- 1Irrigation and Water Harvesting Research Program, Ethiopian Institute of Agricultural Research, Pawe Agricultural Research Center, Pawe, Ethiopia
- 2Soil Fertility and Health Management Research Program, Ethiopian Institute of Agricultural Research, Pawe Agricultural Research Center, Pawe, Ethiopia
Determining the optimal phosphorus rates and deficit irrigation levels is key to enhancing soybean productivity in the Jawi District, Northwest Ethiopia. Soybean is a vital cash crop in Jawi District, Northwest Ethiopia, and improving its productivity is crucial for food security and community socioeconomic status. The optimal phosphorus and deficit irrigation rates in this region remain unresolved. The aim of this study was to optimize soybean productivity in this region by determining the optimal phosphorus rates and deficit irrigation levels. The experiment was conducted during irrigation seasons 2021/22 and 2022/23 using a split-plot design with an RCBD arrangement. The results showed that combining P rates of 10, 20, 30, and 40 kg ha-1 with 100% ETc. significantly increased soybean grain production. Similarly, soybean grain yield increased at P rates of 0, 10, 20, 30, and 40 kg ha-1 P with 75% ETc. The highest water productivity recorded was 0.29 kg m-3 at 50% ETc. This study suggests that combining P rates of 10, 20, 30, and 40 kg ha-1 P with 100% ETc. and P rates of 0, 10, 20, 30, and 40 kg ha-1 P with 75% ETc. could significantly enhance soybean productivity. Implementing these strategies could lead to more sustainable and efficient agricultural practices in Jawi District, thereby improving crop yields and overall profitability.
Introduction
Soybean (Glycine max L.) grown all over the world is an important source of protein and oil for use in food, animal feed, and industrial purposes. It is one of the most abundant sources of dietary protein. Soybeans have protein levels ranging from 36% to 56%, with 16% and 22% fat, oil, and 30% carbon, respectively (Garcia et al., 1997; Velasquez and Bhathena, 2007). This indicates that soybean is an important source of food, oil, fodder, and other industrial materials. Soybeans are the main cash crops in many Ethiopian lowlands and mid-altitude regions (Abate and Ampofo, 1996; Bowles et al., 2018). Soybean is a significant crop in Jawi District, Northwest Ethiopia, and is an important source of income for many farmers. So, enhancing soybean productivity in Jawi District is crucial for ensuring food security and improving the livelihoods of local communities.
The regions of Ethiopia between 1100 and 1850 m above sea level, with mean maximum temperatures between 30°C and 37°C, mean minimum temperatures over 10°C, and 350–500 mm of evenly spaced rainfall throughout the growing season, have been determined to be the most favorable for soybean production (Getachew, 2014). Thus, cultivated-area farmers view it as a legume with significant export potential that might boost foreign exchange earnings.
Research has indicated that soybean subterranean components and fallen senescent leaves enhance soil organic carbon and nitrogen levels. As a result, it also helps to reduce the amount of nitrogen fertilizer required for subsequent crops in a rotation (Yeshitila et al., 2022). Nutrient control has a significant impact on the development, growth, and production of soybeans. For growth and development, soybeans require the same nutrients as other legumes, including calcium, magnesium, sulfur, phosphorus, potassium, and nitrogen (Arain, 2013). Deficiencies in these nutrients result from low nutrient levels in nature or farming practices that deplete nutrients. This study was inspired by earlier studies that provided evidence (Zapata and Roy, 2004). In general, tropical and subtropical soils have substantial phosphorus deficiencies and are acidic (Tiessen, 2005; Mitran et al., 2018). Ethiopia is a tropical nation that accounts for its phosphorus shortage and acidic soils. Thus, because phosphorus enhances nitrogen uptake and influences soybean pod development, it is crucial for plant nutrition (Ahmad et al., 2019; Jin et al., 2006).
Legume crops are susceptible to various environmental stressors including insufficient water and soil fertility (Fantaye, 2004). However, soybean is inherently more resilient to moisture stress than other legume crops (Reddy et al., 2012). As a method of conserving water, deficit irrigation entails providing crops with less water than that required for optimal growth. The P rate describes the quantity of phosphorus added to the soil. Admasu and Tadesse (2019) examined the response of soybeans to moisture deficiencies under various irrigation schemes in the Jimma region of Ethiopia. According to this study, conventional furrow irrigation with 75% ETc and fixed furrow irrigation with 50% ETc are recommended for higher water production without significantly reducing the yield. Furthermore, Getachew (2014) examined how phosphorus levels and critical soil water deficits affect soybean output in another study. The study concluded that available water deficit levels between 25% and 50% are the essential available soil water deficit levels that affect soybean production and yield components. However, the amount of phosphorus-rich deficit irrigation used in Jawi District, Northwest Ethiopia, during the dry season remains unknown. Determining the correct balance between sufficient irrigation to support plant growth and excessive irrigation, which can lead to water wastage or even damage to the crop, is a delicate task. Phosphorus application rates must be adjusted accordingly, as the availability of nutrients to plants can be affected by the soil moisture content. This involves the careful monitoring of plant growth, soil health, and water usage throughout the growing season. The precise ideal phosphorus rate and deficit irrigation level for soybean productivity in Jawi District, Northwest Ethiopia. Thus, the objectives of this study were to determine the phosphorus rate, deficit irrigation level, and its interaction with soybean productivity in relation to the crop response factor, grain yield, water productivity, and other factors in Jawi District, Northwest Ethiopia. The findings of such studies can provide local farmers with invaluable guidelines for optimizing their agricultural practices, leading to more sustainable farming in the region. Enhancing soybean productivity not only supports the local economy but also contributes to food security in the community.
Materials and methods
Description of the study area
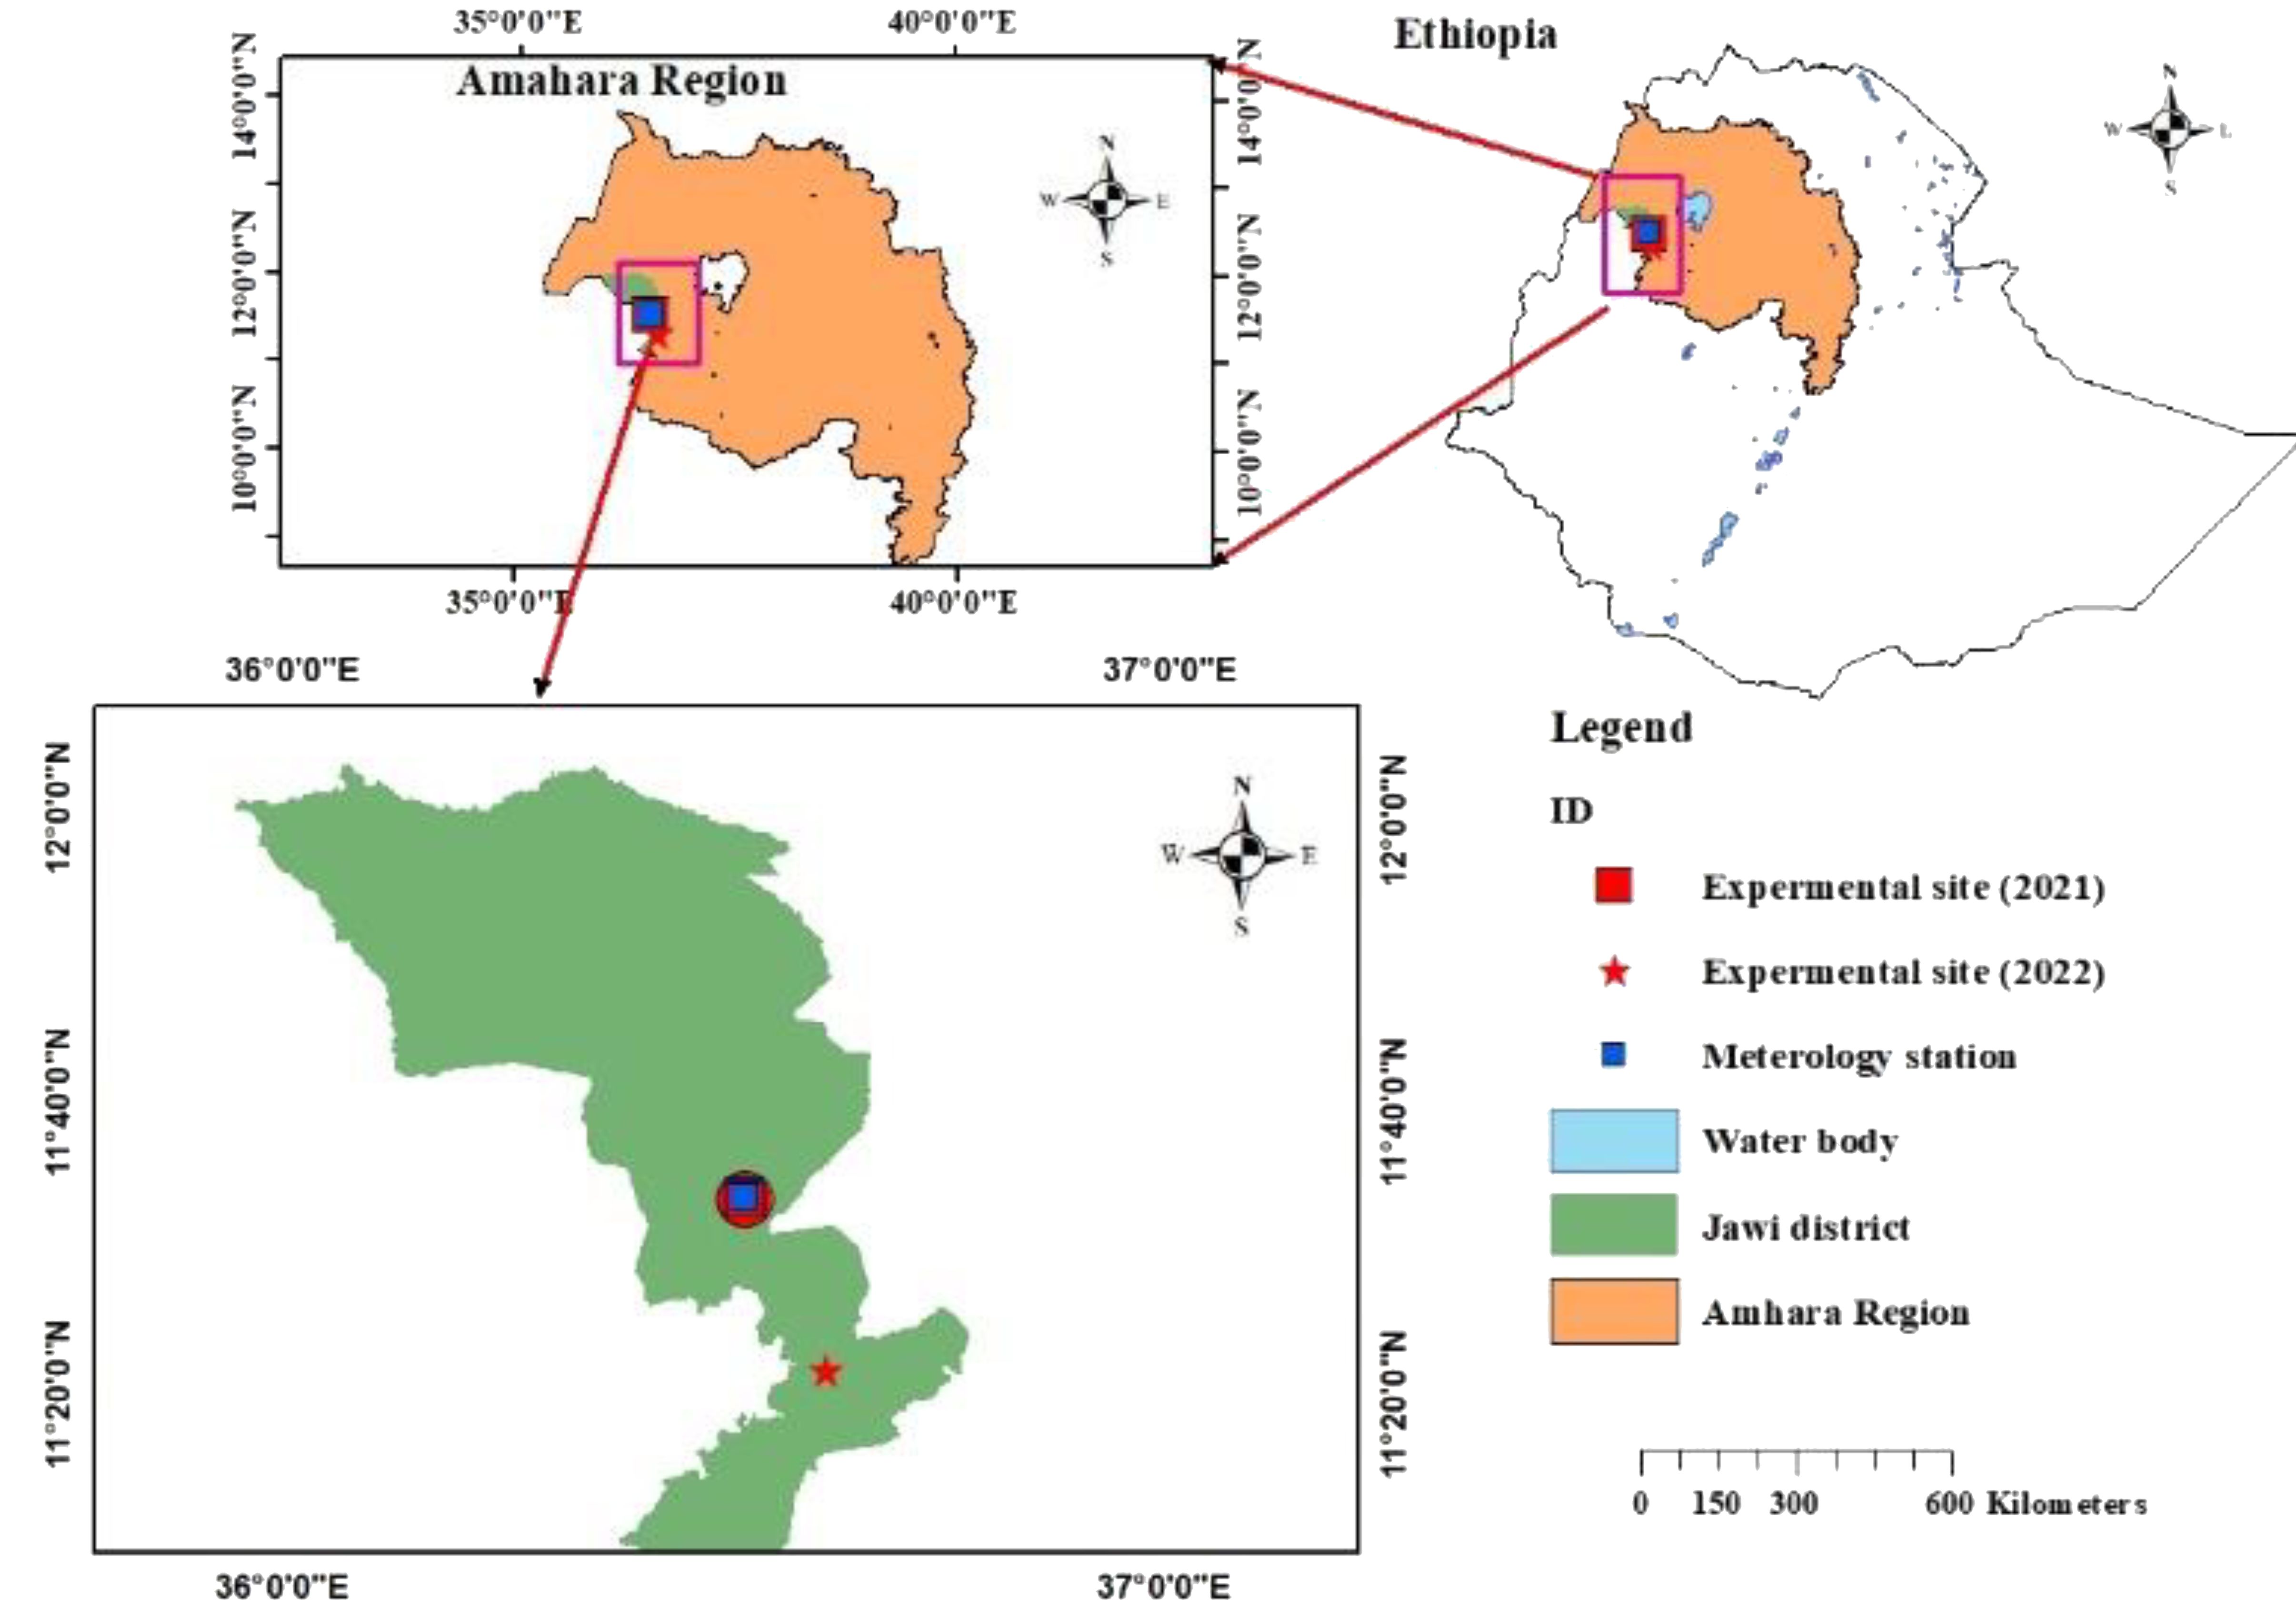
Geographically, Jawi district is in the lowland part of the Awi zone Amhara regional state, Northwest Ethiopia, 602 km away from Addis Ababa, with a coordinate location of 36°29’17.58″ longitude and 11°33’22.68″ latitude, and ranges from 700 to 1500 m. a. s.l. altitude (Figure 1). The experiment was conducted using two irrigation schemes, the Tana Belese Integrated Sugar Factory (TBISF) and Wobo Mariam irrigation schemes, in 2021 and 2022, respectively. According to long-term rainfall data, Jawi receives a mean annual rainfall of 1250 mm and a mean annual temperature of 16°C to 32°C, which range from 12°C to 40°C at the minimum and maximum, respectively (Abeba, 2021). Jawi district is a surplus production area in the Amhara region (Tariku et al., 2018). According to our observations, the major cultivated crops are maize, sorghum, soybean, sesame, groundnut, finger Milat, and perennial crops such as mango and avocado. Horticultural crops such as onions, tomatoes, and peppers are commonly irrigated in this area.
Soil type of study area
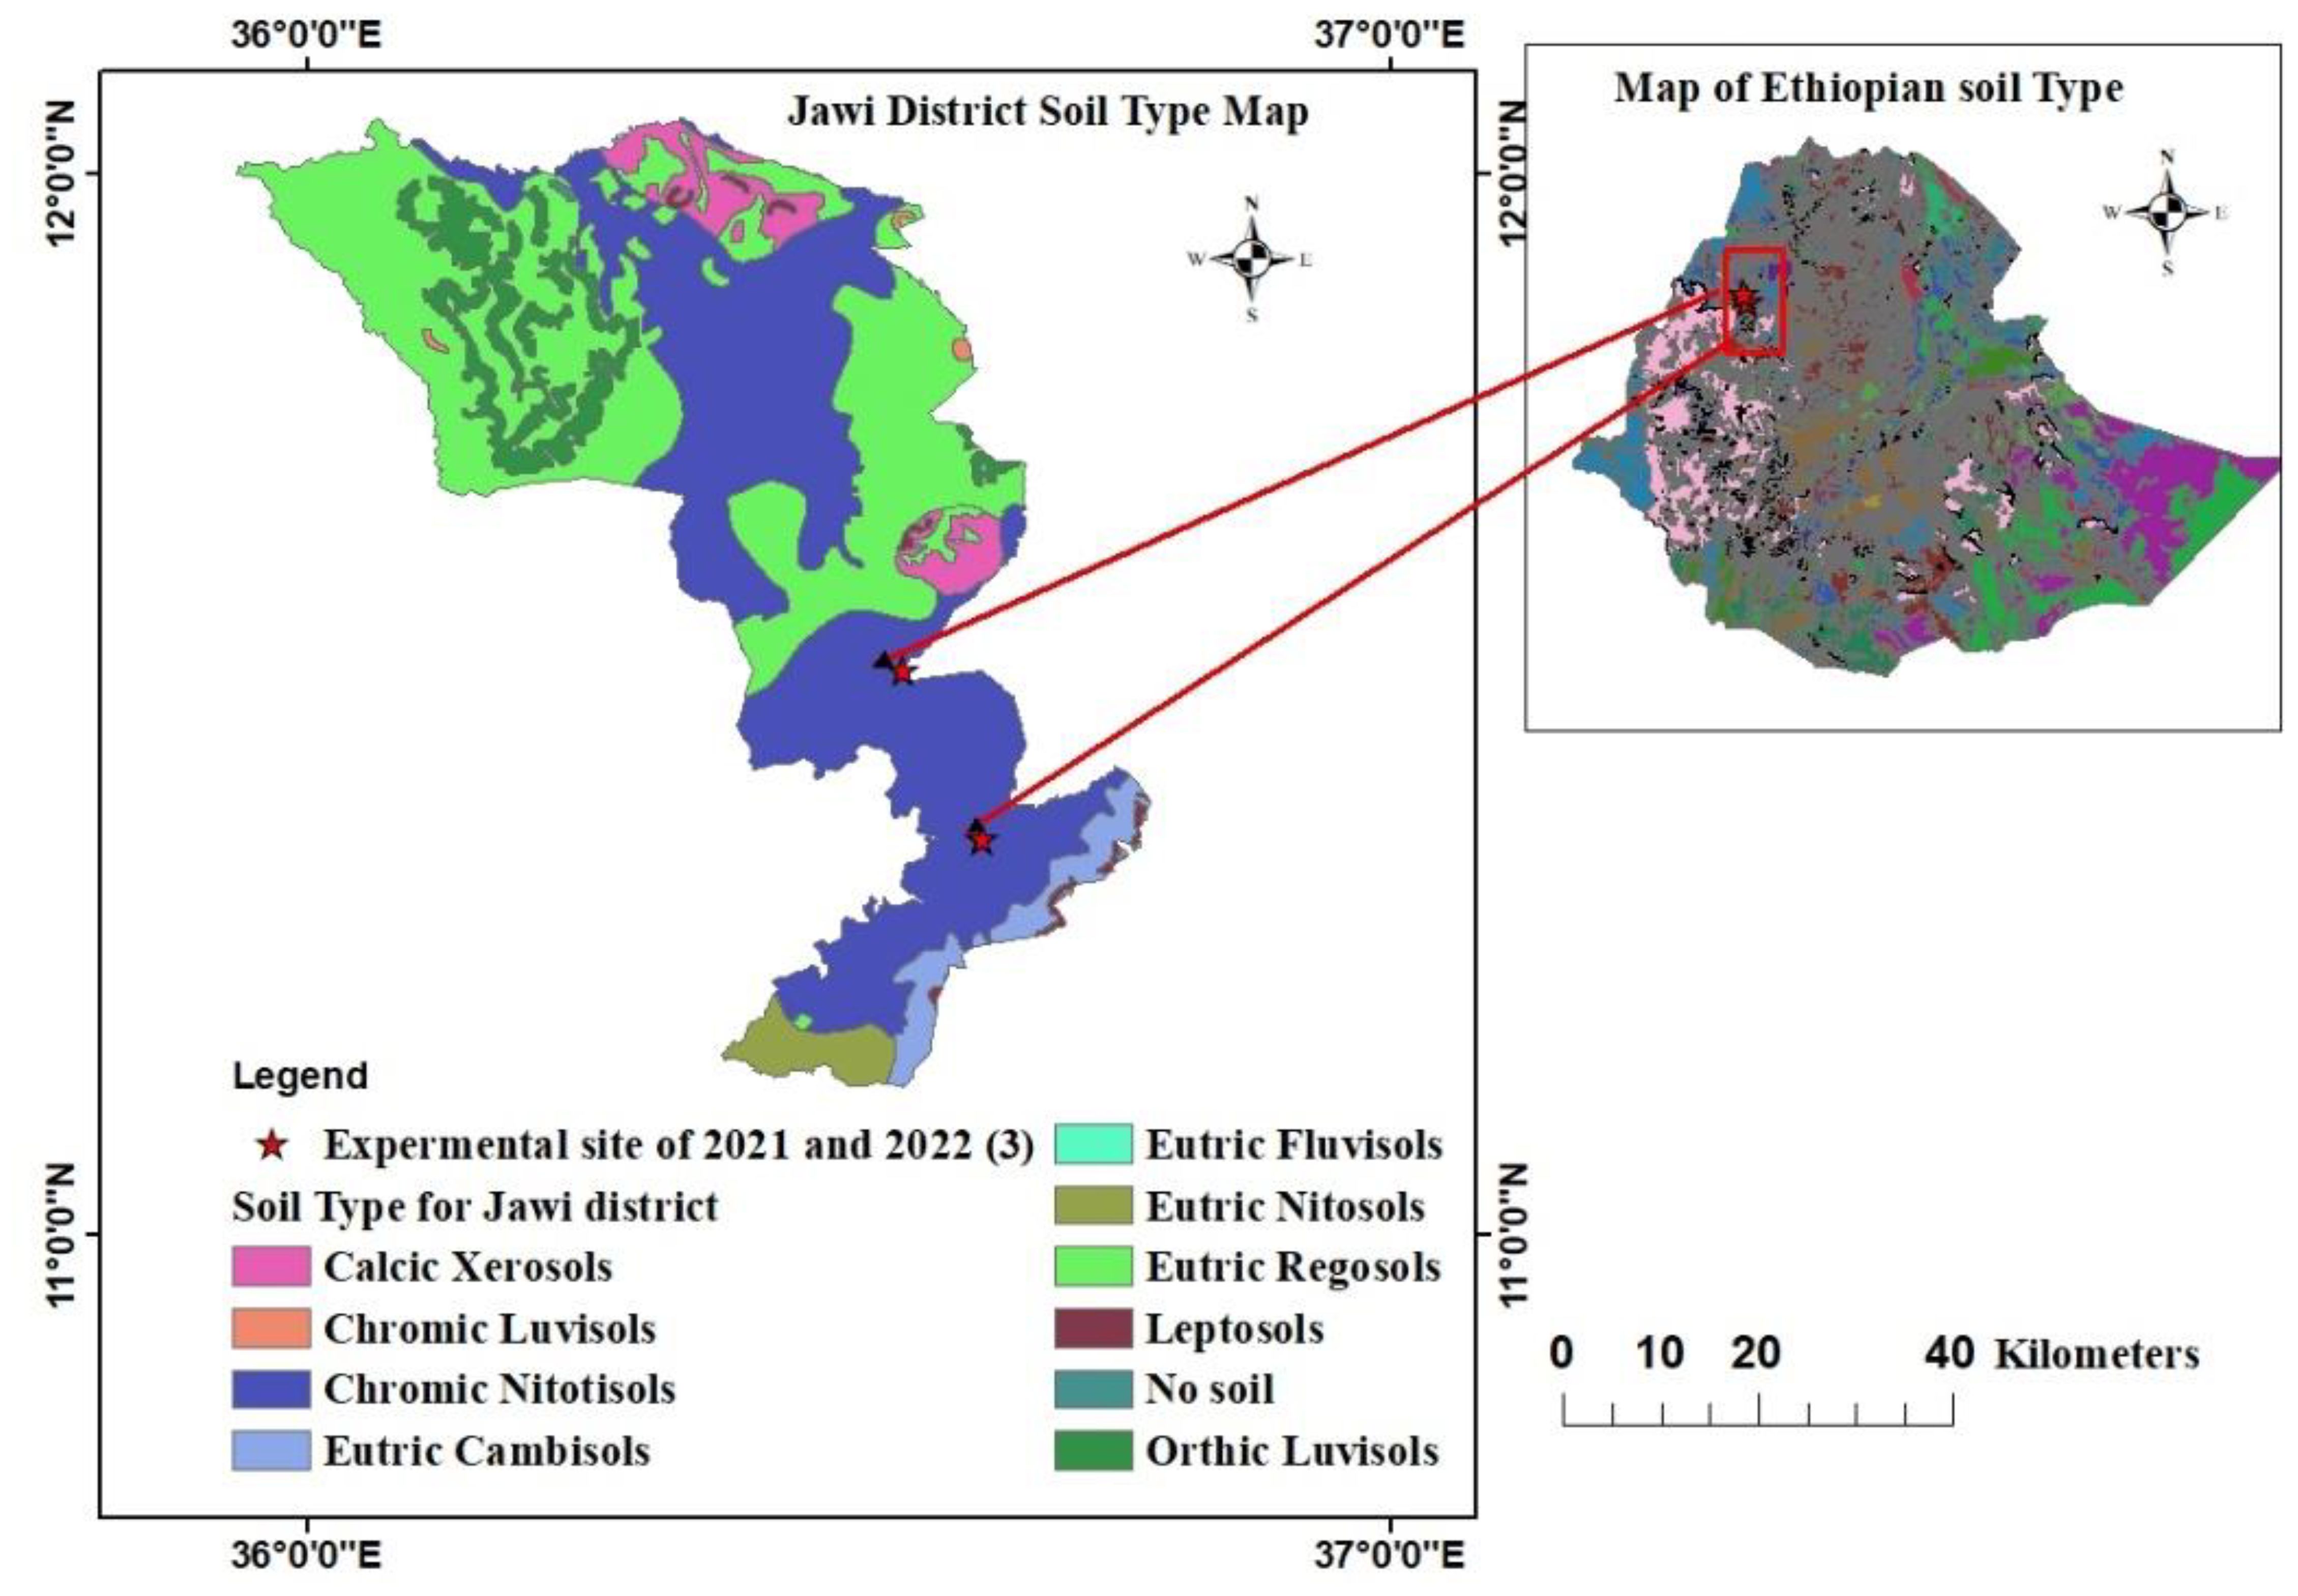
As previously mentioned, the quality of agricultural experiments requires similar soil types, agroclimatic conditions, and agronomic management. Based on the soil type map of Ethiopia (Figure 2), the soil type in each of the experimental areas was chromic nitisol. This uniformity helps reduce the variability in results and allows for more accurate comparisons between treatments.
Chromic nitisol is a specific soil classification system based on Soil Taxonomy. Nitisols are soils typically found in tropical regions and are characterized by their deep profiles and high fertility. The term “chromic” indicates the presence of a high content of iron oxides in the soil, resulting in a reddish color. In addition, these soils have high water-holding capacity and good drainage, making them ideal for crop production. Soil type in the study area was a key factor in the success of this experiment. Chromic nitisols provide an excellent foundation for crop production, and favorable agroclimatic conditions and agronomic management practices further enhance the potential for high yields.
Experimental set up and treatment arrangement
The experiment consisted of two factors: the deficit irrigation level and phosphorus rate. Thus, three irrigation levels [50%, 75%, and 100% of crop water requirement (ETc)] and five phosphorus rates (0, 10, 20, 30, and 40 kg ha-1 P2 O5) were used. The design was a split-plot RCBD arrangement, with the deficit irrigation level as the main plot and phosphorus rate as a subplot. Each treatment combination was randomly assigned to an experimental unit within each block. The experimental plot had a length of 3 m, width of 3 m, and an area of 9 m2, with respect to the distance between the subplots. The main plots, sup plot, and blocks were 2, 2, and 3m, respectively. Thus, the factor combination had 15 treatments assigned, randomized at both the main and sub-plot levels, and replicated thrice.
After preparing the field, we applied pre-irrigation in the experimental field to the depth of the maximum crop root zone within individual plots. Subsequently, we sowed soybean seeds of the Belesa variety in plots with a 5 cm plant spacing and 30 cm row spacing. Each plot consisted of five rows with 60 plants per row, totaling 300 plants per plot (Figure 3). The control treatment involved 100% ETc, with a P rate 0. Full irrigation (100% ETc) denotes the application of irrigation water per the calculated crop water requirement, facilitated by CROPWAT8.
Water management system
After seeding, all plots were irrigated to maintain a uniform moisture level at saturation for the first week to ensure complete germination. Furrow irrigation was used for each treatment. Reference evapotranspiration, crop, and irrigation water requirements were evaluated using the CROPWAT8 technique. For each treatment, irrigation water discharge was measured using a Parshall flume with a three-inch throat width. The dates and watering volumes of each irrigation treatment were recorded.
Agronomic management system
Fertilizer NPS was used for P rate determination as shown in the treatment setup, whereas urea was applied for each treatment in a blanket (100 kg ha-1) at sowing, placed on the side of the seeds at 5 cm and a depth of 2 cm. During the crop growth period, hand weeding and cultivation were performed, as required, to avoid weed competition and improve soil aeration. The crop was monitored regularly for signs of pests or diseases and appropriate measures were taken to control them. Additionally, soil samples were collected periodically to monitor nutrient levels and adjust fertilizer application accordingly.
Crop water requirements of soybean
To determine crop water requirements, the effect of climate on crop water requirements, which is the reference crop evapotranspiration (ETo), and the effect of crop characteristics (Kc) are important (Doorenbos and Kassam, 1979). Long-term and daily climate data, such as maximum and minimum air temperature, relative humidity, wind speed, sunshine hours, and rainfall data of the study area, were collected to determine the reference evapotranspiration. Crop data such as crop coefficient, growing season and development stage, effective root depth, critical depletion factor of soybean, maximum infiltration rate, and total available water in the soil were also determined to calculate crop water requirements using the CROPWAT 8 model.
ETc, Kc, and ETo are crop evapotranspiration, crop coefficient, and reference evapotranspiration, respectively.
Irrigation water requirements
The water requirement of the soybeans was determined from climate data acquired from a regional meteorological station using CROPWAT 8.0. Gross irrigation depth was estimated by considering a field irrigation application efficiency of 60%. Accordingly, the net irrigation depths, gross irrigation depths, and irrigation intervals were evaluated in the field.
The total available water (TAW), stored in a unit volume of soil was determined by the expression.
The irrigation depth supplied at any time can be obtained using the following equation:
The gross irrigation requirement will be obtained from the expression.
Ea. represents furrow application efficiency (60%).
The time required to deliver the desired depth of water into each furrow has been calculated using.
dg, T, L, W, and Q Where: gross depth of water applied (cm), application time (min), furrow length in (m), furrow spacing in (m), and flow rate (discharge) (l/s), respectively.
Water productivity.
Water use productivity was calculated by dividing the harvested yield in kilograms per unit volume of water used in m3.
Water use efficiency (WUE): The crop water use efficiency is the yield harvested in kg ha-1 of total water used.
Where: WUE = crop water uses efficiency (kg ha-1 mm-1) Y = bulb yield in kg ha-1 and ETc = crop evapotranspiration (mm).
Crop response factor
The water-yield relationship was determined using the Stewart model, in which the dimensionless parameters of relative yield reduction and relative water consumption were used (Doorenbos and Kassam, 1979). Ky is defined as the decrease in yield per unit of ETc (Lovelli et al., 2007).
where Ya, Eta, Ym, CWR, and Ky represent the actual yield, evapotranspiration, maximum yield, crop water requirement, and yield response factor, respectively.
Data analysis
Yield and yield component data and water productivity data were analyzed to statistical analysis using Microsoft Excel 2019, R Studio and Statixc10.
Results
Soil properties for the experimental area
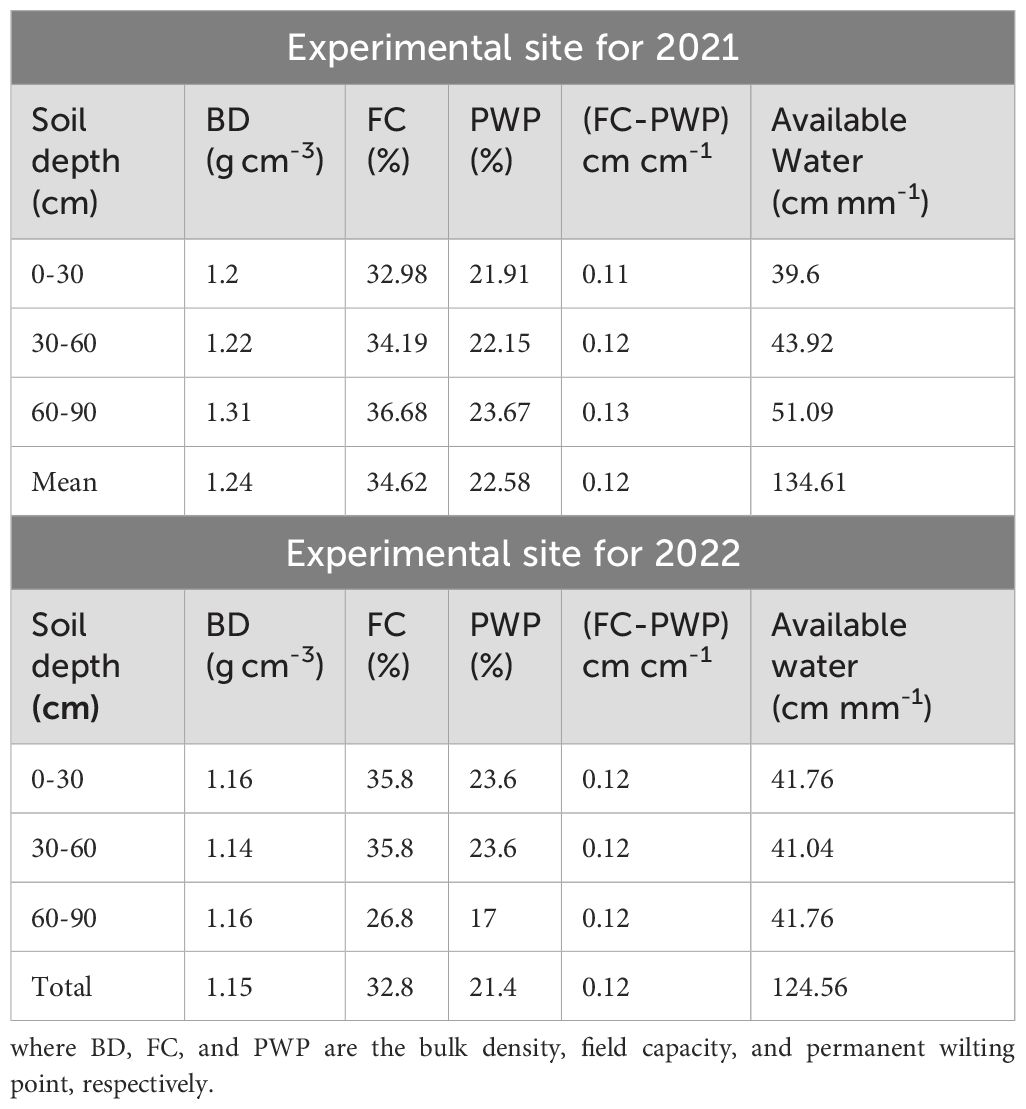
Soil samples were collected before sowing the soybeans and analyzed using laboratory procedures. The hydrometer method determines the particle size of a sample (Bouyoucos, 1962). The results showed that the soil texture varied at the study site (Table 1). The top soil surface had a slightly lower bulk density (1.2 g cm-3) than the subsurface (1.31 g cm-3). This could be due to a slight decrease in organic matter with depth and compaction, owing to the weight of the overlying soil layer (McCauley et al., 2005). In general, the average soil bulk density in 2021 and 2022 was 1.24 g cm-3and 1.15 g cm-3, respectively, below the critical threshold level (1.4 g cm-3) and suitable for crop root growth. The lower bulk density in 2022 can be attributed to improved soil management practices and natural processes. Overall, these findings suggest that the soil at the study site is conducive to optimal crop growth and root development. Similarly, the field capacity (FC) and permanent wilting point (PWP) of the soil were 33.50% and 21.13%, respectively. On a volumetric basis, the water content at the FC varied between 32.98% and 36.68%. The top 0–30 cm had the lowest average water content of FC value of 32.98%, while the subsurface 60–90 cm had the largest value of FC (36.68%). The moisture content at the PWP varied with depth, with values as low as 21.91% in the topsoil (0–30 cm) and as high as 22.15 and 23.67% in the subsurface (30–60 cm) and (60-90 cm), respectively. The difference in FC and PWP is directly related to the total available moisture (TAW), which is the depth of water that a crop can absorb from its root system. The average available soil moisture was 134.61 cm mm-1. As a result, the optimum degree of TAW is present in the topsoil, whereas more concentrations are located in the subsurface soil.
Evaluations of rainfall and evapotranspiration for wet and dry season
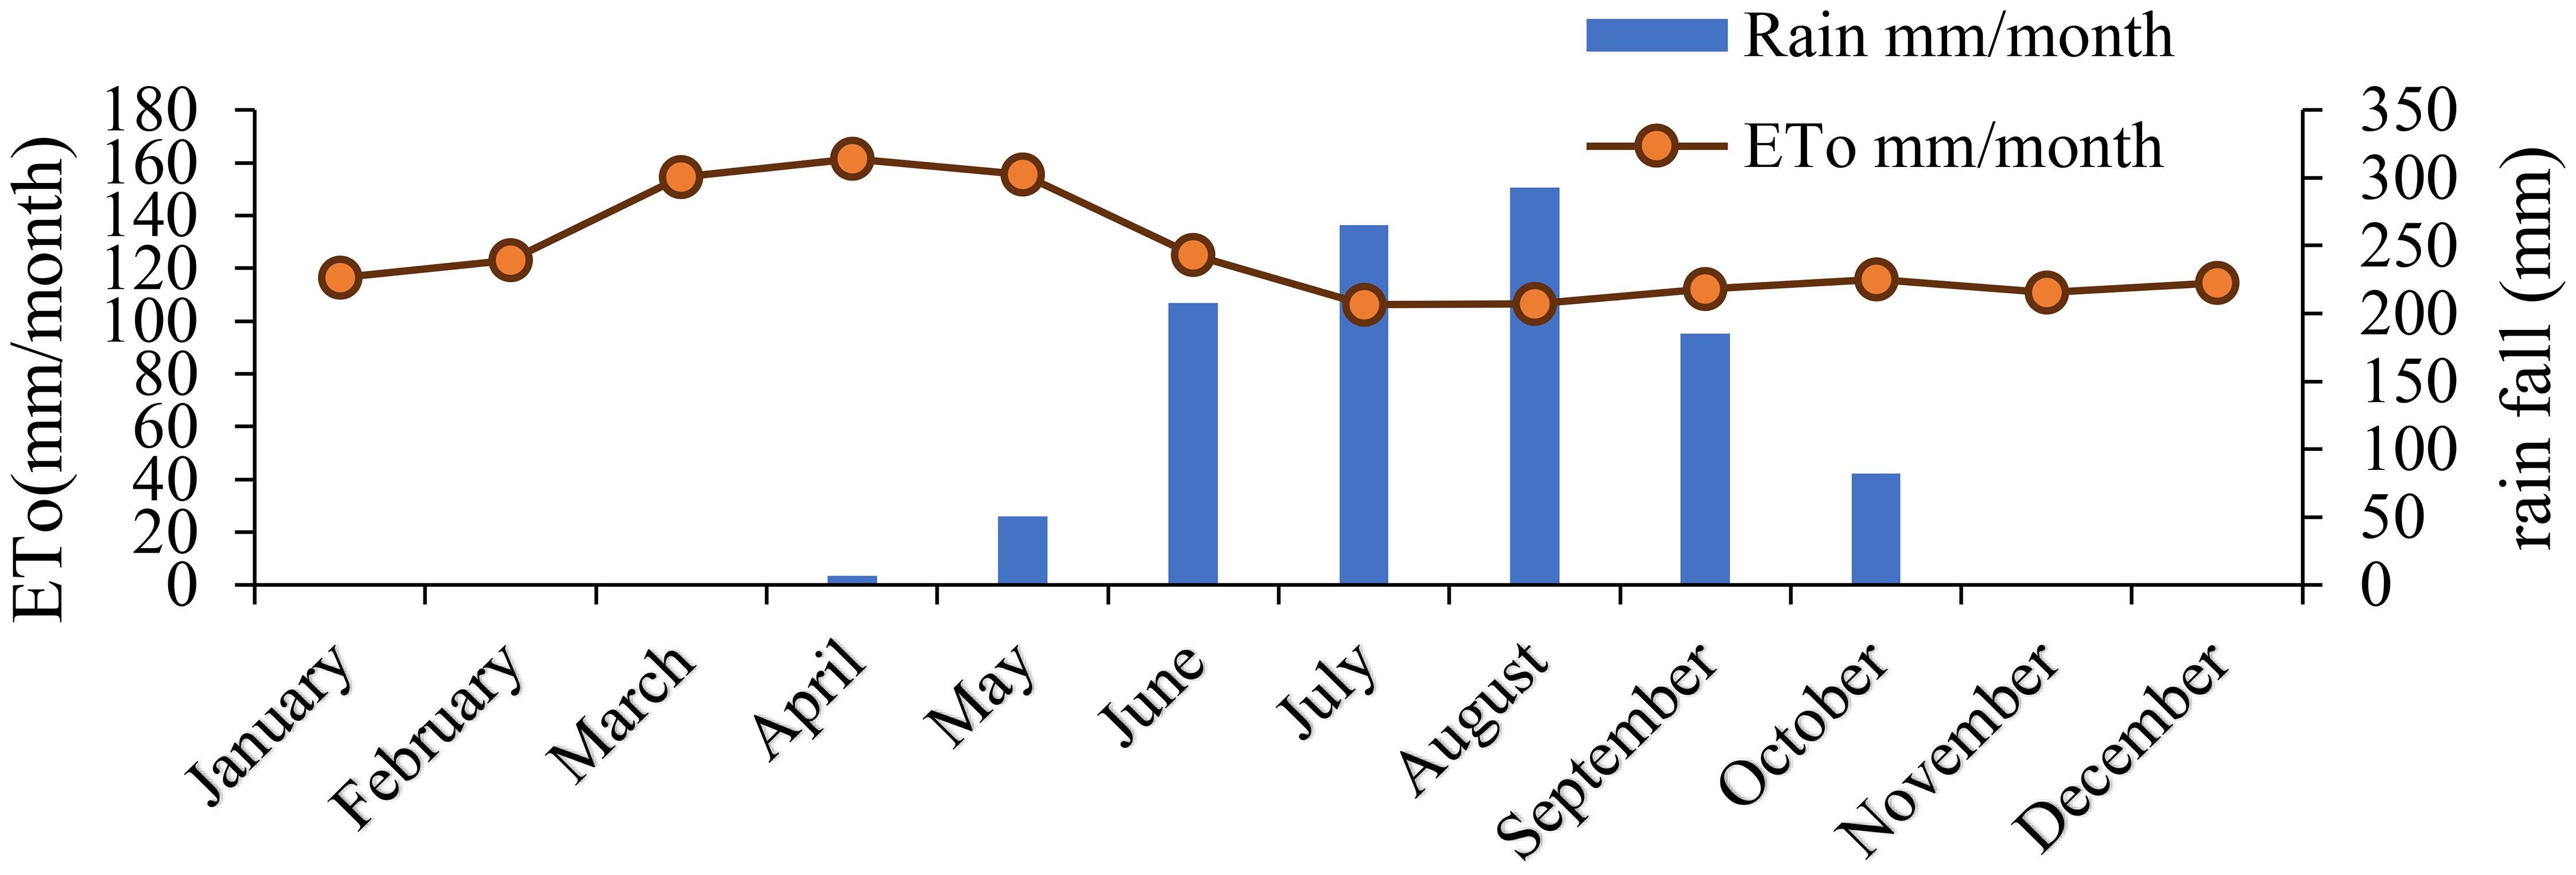
This study was conducted by collecting long-term climatic data from Jawi, a nearby meteorological station. The data included the maximum and minimum temperatures, wind speed, sunshine hours, and relative humidity. The CROPWAT 8 model was used to estimate the reference evapotranspiration (ETo) and effective rainfall using the Penman-Monteith method (Zotarelli et al., 2010). The data show that the mean monthly ETo reached its highest value in April (161.46 mm/month, and the mean monthly minimum evapotranspiration reached its highest value in July (106.23 mm/month (Figure 4).
The study also collected long-term monthly rainfall data and used the USDA-SCS method to determine the effective rainfall (Pe), which was later used to determine the water productivity for each crop under both irrigated and rain-fed systems (Bos et al., 2008; Allen et al., 1998), as shown in (Equation 1). The data show that the mean monthly rainfall reaches its peak in August at 293 mm, and the monthly effective rainfall starts from the end of April until the end of October, which suggests a rainfall farming season (Figure 4). In contrast, November to mid-April exhibited a dry season, which is recommended for the irrigation season in the experimental areas. To support this previous study, we have made similar recommendations for irrigation and rainfall seasons in this area (Adametie and Mitku, 2021; Adamtie et al., 2022). Therefore, the experiment was conducted during the dry season for two consecutive years, 2021/22 and 2022/23.
Overall, this study provides important data for determining the best farming and irrigation seasons for experimental areas. The collected data and methods can be useful for future studies on farming practices in this region. By conducting experiments during the dry season for two consecutive years, the researchers gathered valuable data on the effects of irrigation. This information is crucial for farmers in the region to make informed decisions regarding when to irrigate their crops for optimal growth and yield. The findings of this study, along with the methods employed, can serve as a valuable resource for future research and agricultural practice in this area. Ultimately, this research contributes to a better understanding of the best farming and irrigation practices in experimental areas.
Irrigation water requirement and irrigation scheduling for soybean
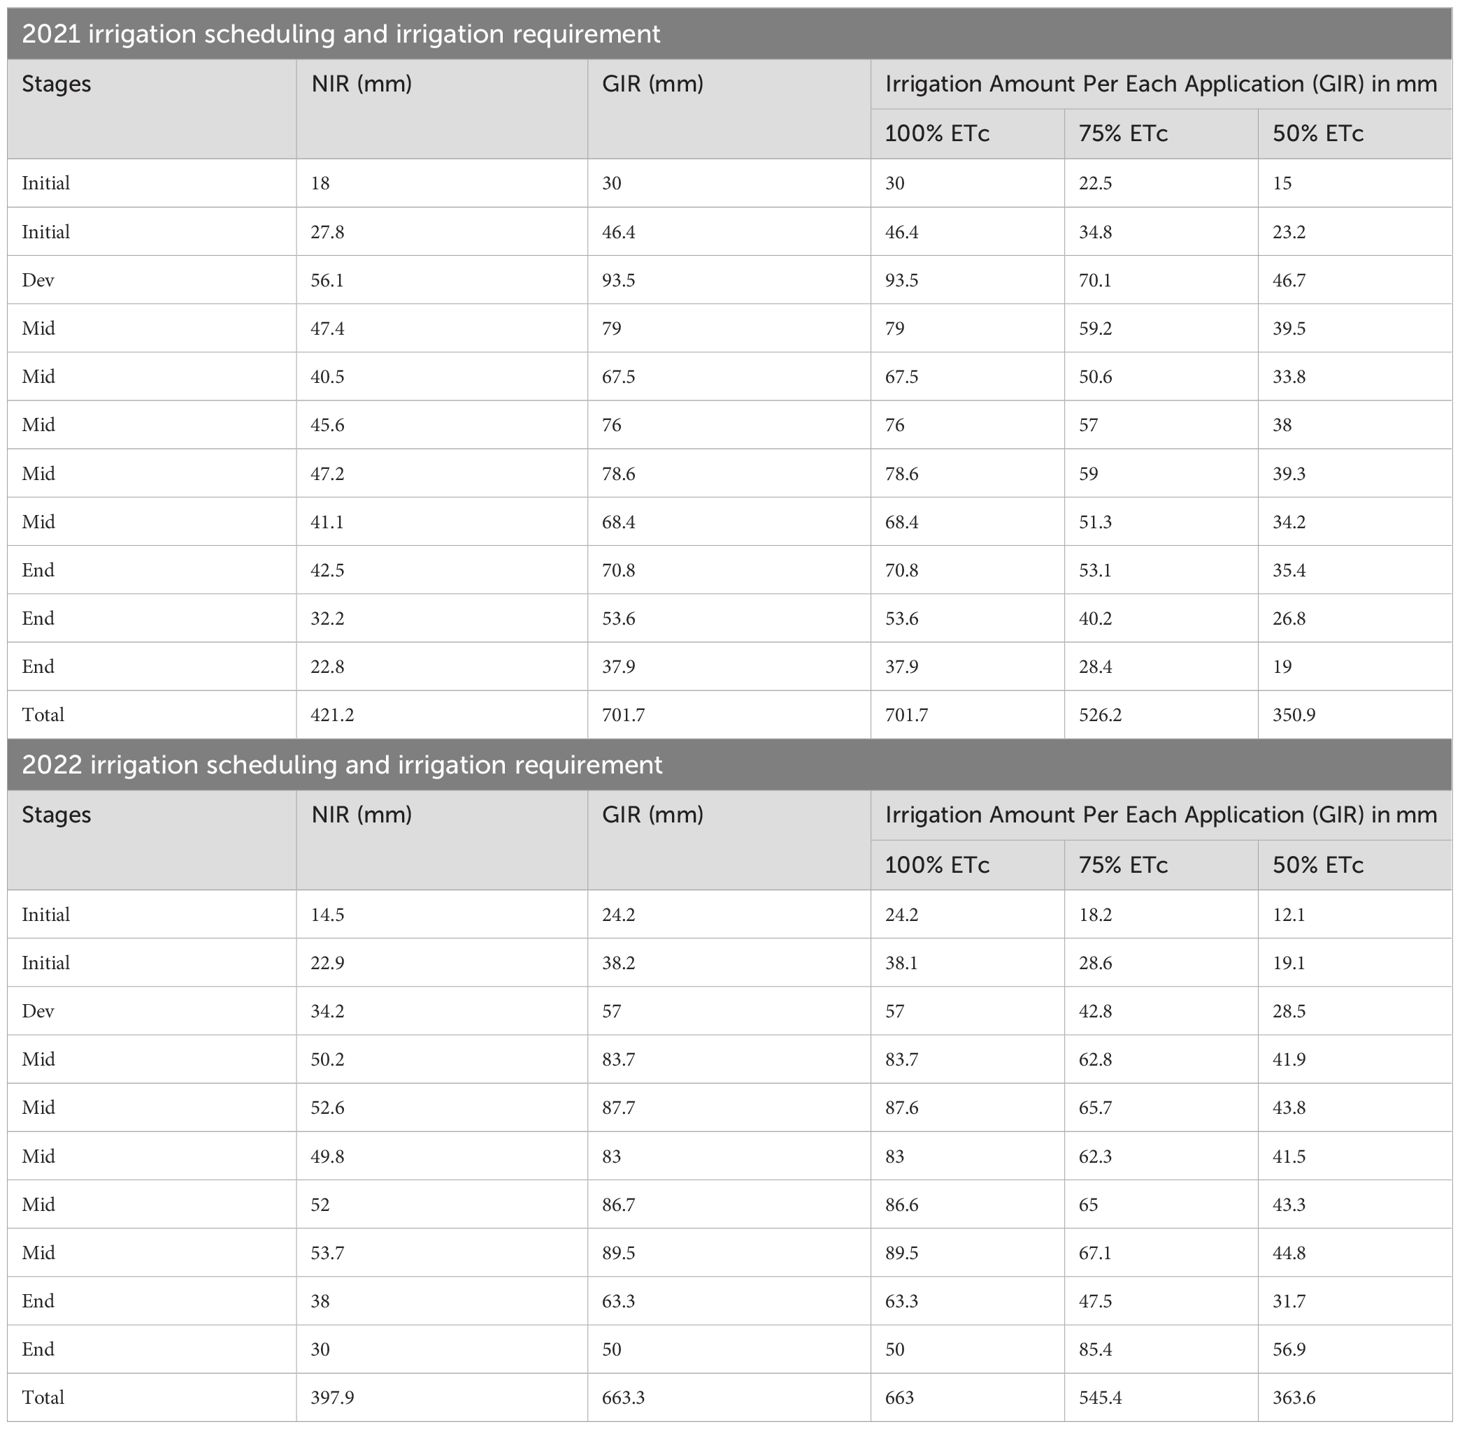
Based on the information provided in Table 2, it can be observed that there were substantial differences in the number of irrigations required for 2021 and 2022. In 2021, there were a total of 11 irrigations, whereas by 2022, there were 10. Additionally, the net and gross irrigation requirements also varied over the two years. In 2021, the total net and gross requirements were 421 mm and 701.7 mm, respectively. By 2022, the total net and gross requirements were 399 mm and 663 mm, respectively.
One of the key reasons for the observed variations in the net irrigation amount between 2021 and 2022 is the difference in the sowing time. In 2021, the sowing date is February, whereas in 2022, it is January. The net irrigation depth was used to calculate the gross irrigation depth, with 100% crop evapotranspiration (ETc) representing the full gross irrigation depth. By reducing this amount to 75% and 50% of the ETc, it was possible to obtain 75% and 50% minimum irrigation requirements, respectively.
Overall, the information provided in Table 2 highlights the importance of carefully considering sowing time and other factors that can influence the irrigation requirements of crops. By doing so, farmers and agricultural experts can ensure that crops receive the appropriate amount of water to thrive while minimizing water waste and promoting sustainable agricultural practices.
Determinations of irrigation levels and phosphorus rates on soybean plant height
A study of soybean plant height revealed a non-significant phosphorus rate. However, zero phosphorus was the shortest 43.4 cm, and 30P was the longest (48.5 cm). The remaining P rate had a similar effect on plant height. Water deficiency had a notable impact on plant height. The analysis result showed that from shortest to longest soyabean plant height 47.7, 46.1 and 43.6 cm were 100%, 75% and 50% ETc respectively (Table 3). Plant height was reduced by 6% to 26% at 50% ETC compared with 100% ETC treatments (Table 3). This finding is supported by that of a previous report by Abeba (2021). Nikakhtar et al. (2023) indicated that water deficiencies of up to 25% have little effect on plant height. However, when the water shortage exceeded 25%, there was a clear reduction in the plant height. This suggests that soybean plants are relatively tolerant to mild water deficits, but that more severe deficits can have a significant impact on their growth. Figure 5 illustrates the combined effects of deficit irrigation and the P rate on soybean plant height. Among the treatments, there were no significant differences in the interactions, whereas those grown at higher water levels with P rates were substantially taller than those grown at relatively lower water levels with P rates, based on the mean plant height values.
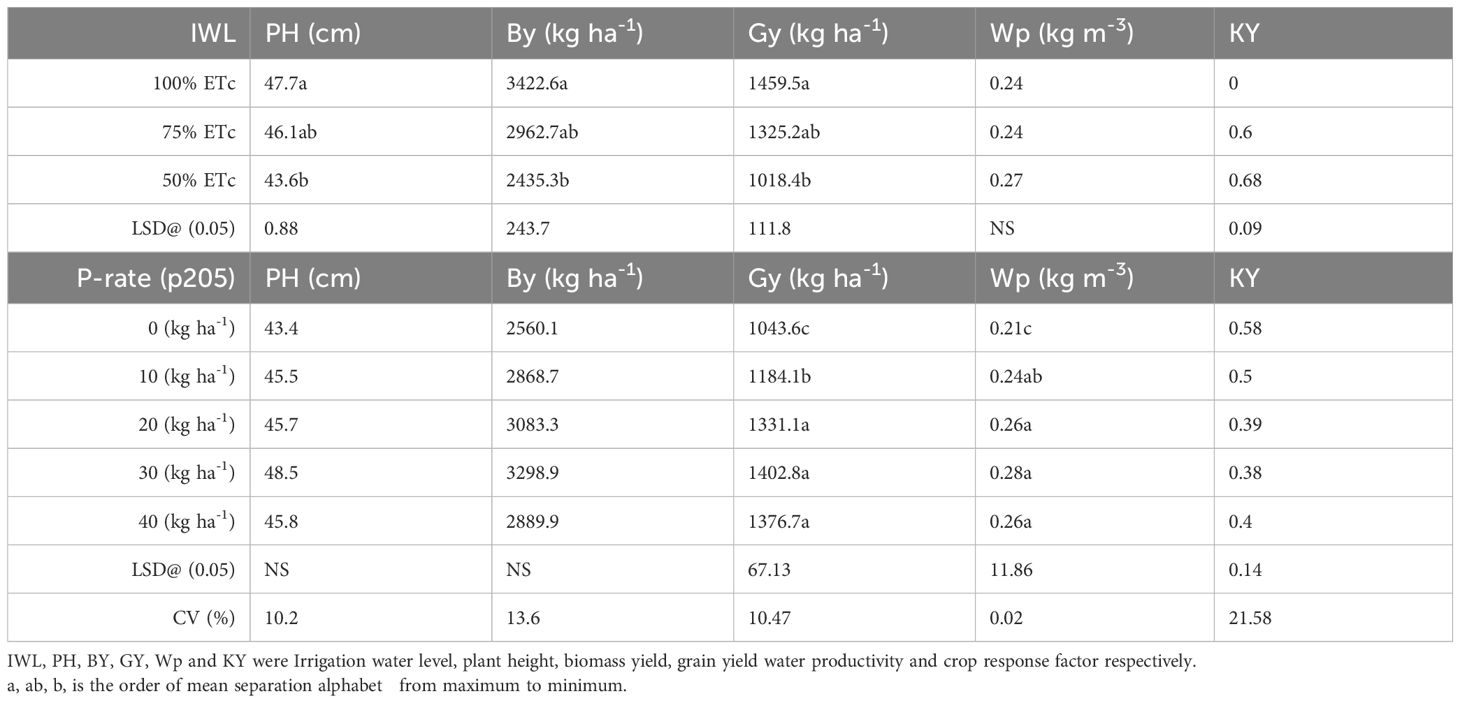
Table 3. Analysis of variance for yield and yield-related variables during the over-year combined analysis (2021 and 2022) of the soybean irrigation experiment.
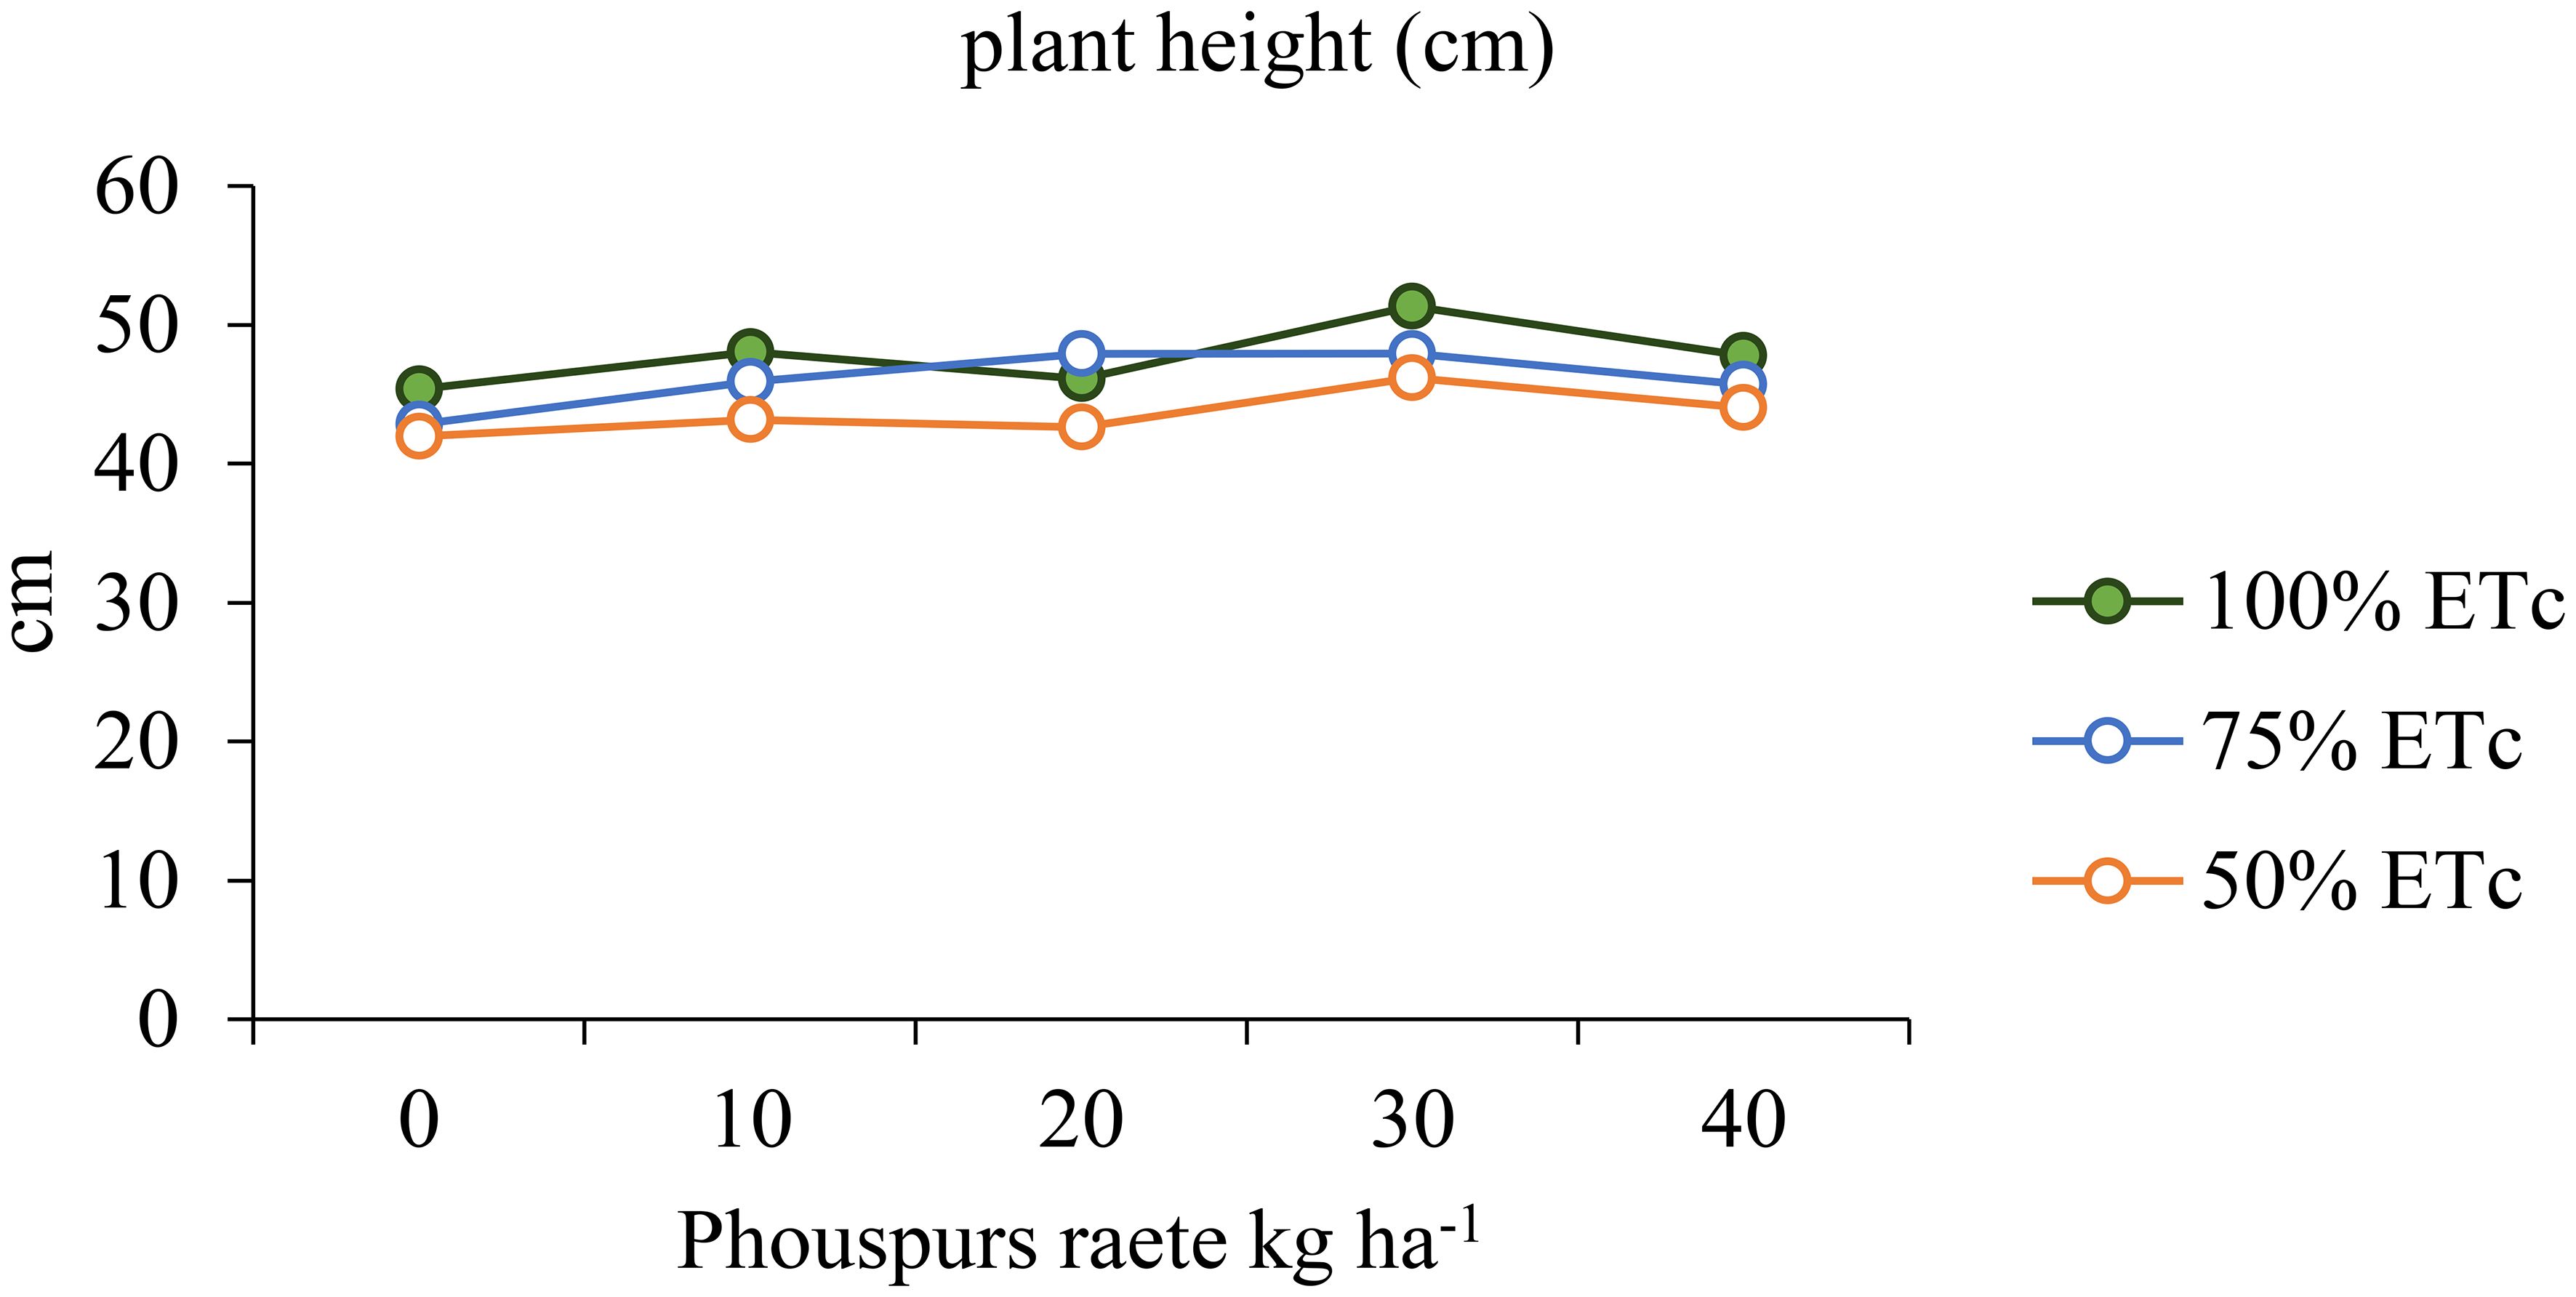
Figure 5. Interaction effects of irrigation level with phosphorus rate on plant height of soya-bean.
Determinations of irrigation level and P rate on soya-bean biomass yield
A two-year analysis conducted in 2021 and 2022 found that the maximum biomass yield was achieved under 100% ETc or full irrigation, whereas the lowest yield was recorded under 50% ETc. Deficit irrigation led to a significant reduction in biomass yield compared with full irrigation. The recorded yields were 3422.6, 2962.7, and 2435.3 kg ha-1 for 100, 75, and 50% ETc, respectively. A 100% ETc treatment was used as a control to compare the deficit levels of irrigation. The results showed that 75% ETc and 50% ETc caused 15.5% and 40.5% reductions in biomass yield, respectively, compared to full (100% ETc) irrigation. These findings highlight the importance of providing adequate water to maximize biomass yield in agricultural practices. It is crucial for farmers to carefully manage irrigation levels to optimize crop production and ensure sustainable agricultural practices.
The data suggested that there was no significant biomass production outcome when the P rate was combined with deficit irrigation (Figure 6). The biomass yields first increased from 10 to 30 P kg/ha, but then decreased to 40 P kg ha-1. The reduction in biomass yield was equivalent to the yield from irrigation. The outcome of this study was supported by a previous report by Nikakhtar et al. (2023). Who reported that the amount of water and phosphorus (P) added to phosphors had a major impact on biomass yield.
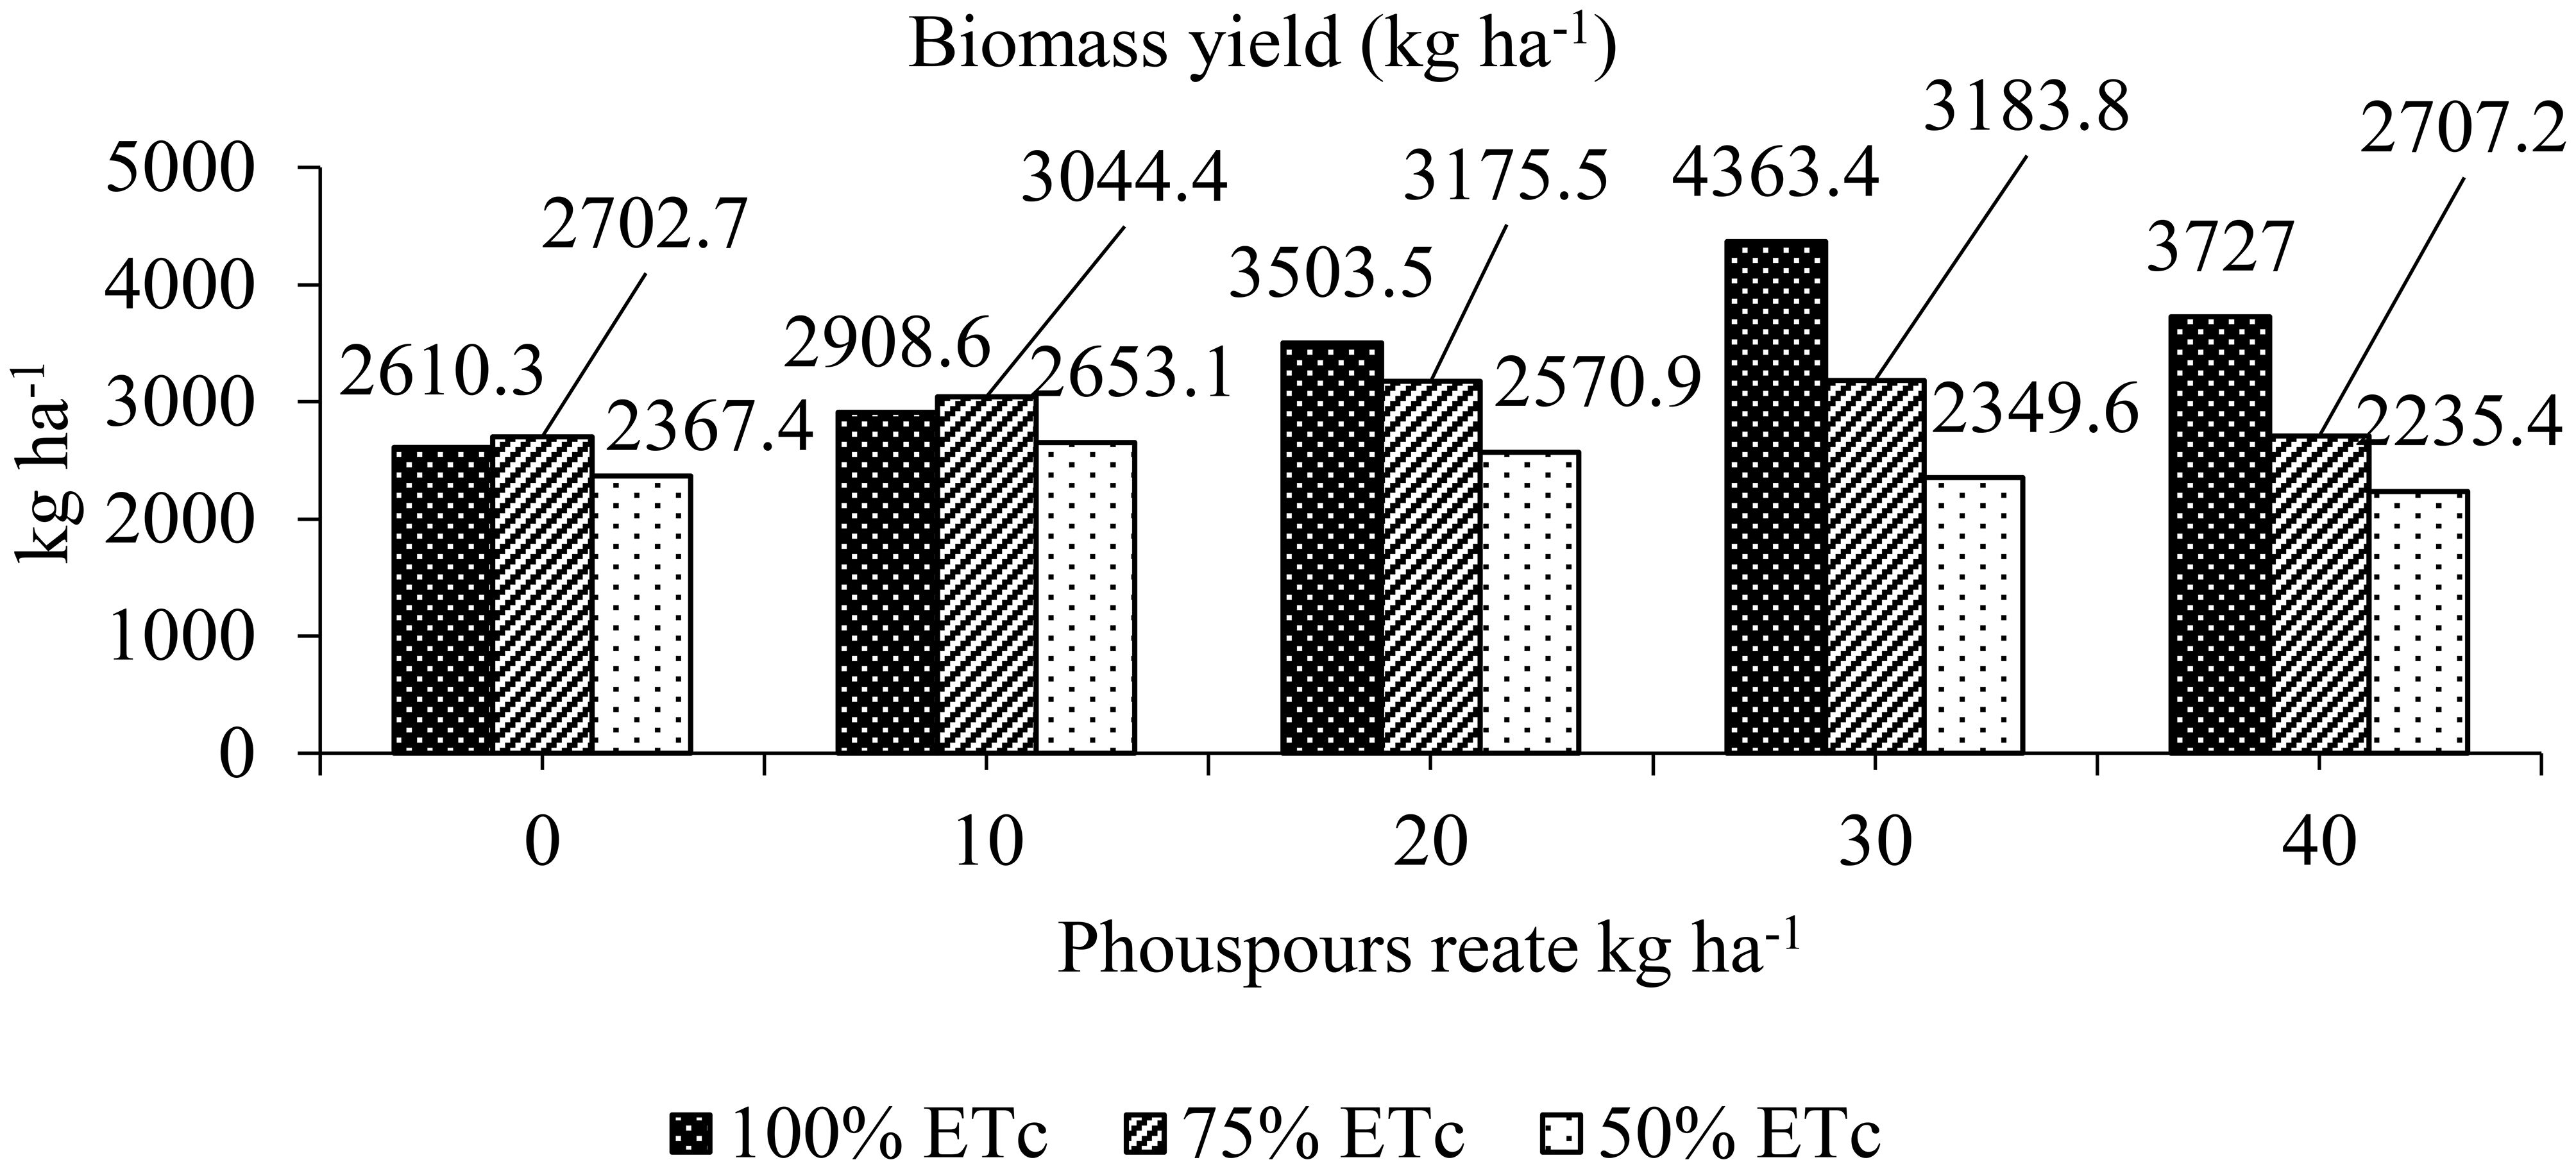
Figure 6. Interaction effects of irrigation level (IR) with phosphorus rate (PR) on biomass yield of soya-bean.
We concluded that deficit irrigation had a notable effect on soybean biomass yield. This means that when soybean plants were given less water than required, they produced less biomass. However, this study did not find a significant effect on biomass yield when the P rate was changed or when the irrigation level was combined with the P rate. This means that the amount of water provided to soybean plants had a greater effect on their growth than the amount of phosphorus in the soil. Therefore, it is essential for farmers to strike a balance between phosphorus application and irrigation levels to achieve the maximum biomass yield in agricultural practices. By carefully monitoring and adjusting these factors, farmers can optimize crop production and promote sustainable agriculture.
Determinations of irrigation level and P rate on soya-bean grain yield
Analysis of variance revealed that grain yield was significantly affected by deficit irrigation, P rate, and its interaction with deficit irrigation and P rate. The findings of our investigation indicated that the amount of added water and phosphorus (P) had a major impact on grain output. For irrigation level, 50% ETC deficit irrigation produced the lowest grain production, whereas 100% ETC and 75% ETc water deficit levels produced the best yield (Table 3). The 50% ETc and 75% ETc levels decreased grain yield by 43.3% and 10.3%, respectively, compared to the full irrigation level. In areas with limited water supply, farmers should consider using deficit irrigation techniques to conserve water and increase crop productivity. The study found that depending on deficit irrigation, a water shortage can affect soybean grain output (Abeba, 2021; Jumrani and Bhatia, 2018; Pawe and Center, 2022).
The use of phosphorus fertilizers can have a significant impact on crop growth and yield. A study was conducted to investigate the effects of different P rates on soybean output. The results (Table 3) showed that soybean grain yield increased with increasing P rate. Specifically, grain yields for P rates of 0, 10, 20, 30, and 40 kg ha-1 were 1043.6, 1184.1, 1331.1, 1402.8, and 1376.4 kg ha-1 of P2O 3, respectively. At P2O5 rates of 20, 30, and 40 kg ha-1, respectively, the greatest yields of 1331.1 kg ha-1, 1402.8 kg ha-1, and 1376.4 kg ha-1 were obtained.
The analysis of variance results showed that the relationships between the P rate and the amount of deficit irrigation varied significantly (Figure 7). The soybean crop with the highest grain production (1703.7 kg ha-1) was cultivated under full irrigation with 100% ETc and 30 kg ha-1 P2O4. Similarly, a yield of 1680.2 kg ha-1 was obtained when 100% ETc and a P rate of 40 kg ha-1 of P2O 3 were combined. However, the combination of 50% ETc and no P produced the lowest grain yield of 975.5 kg ha-1.
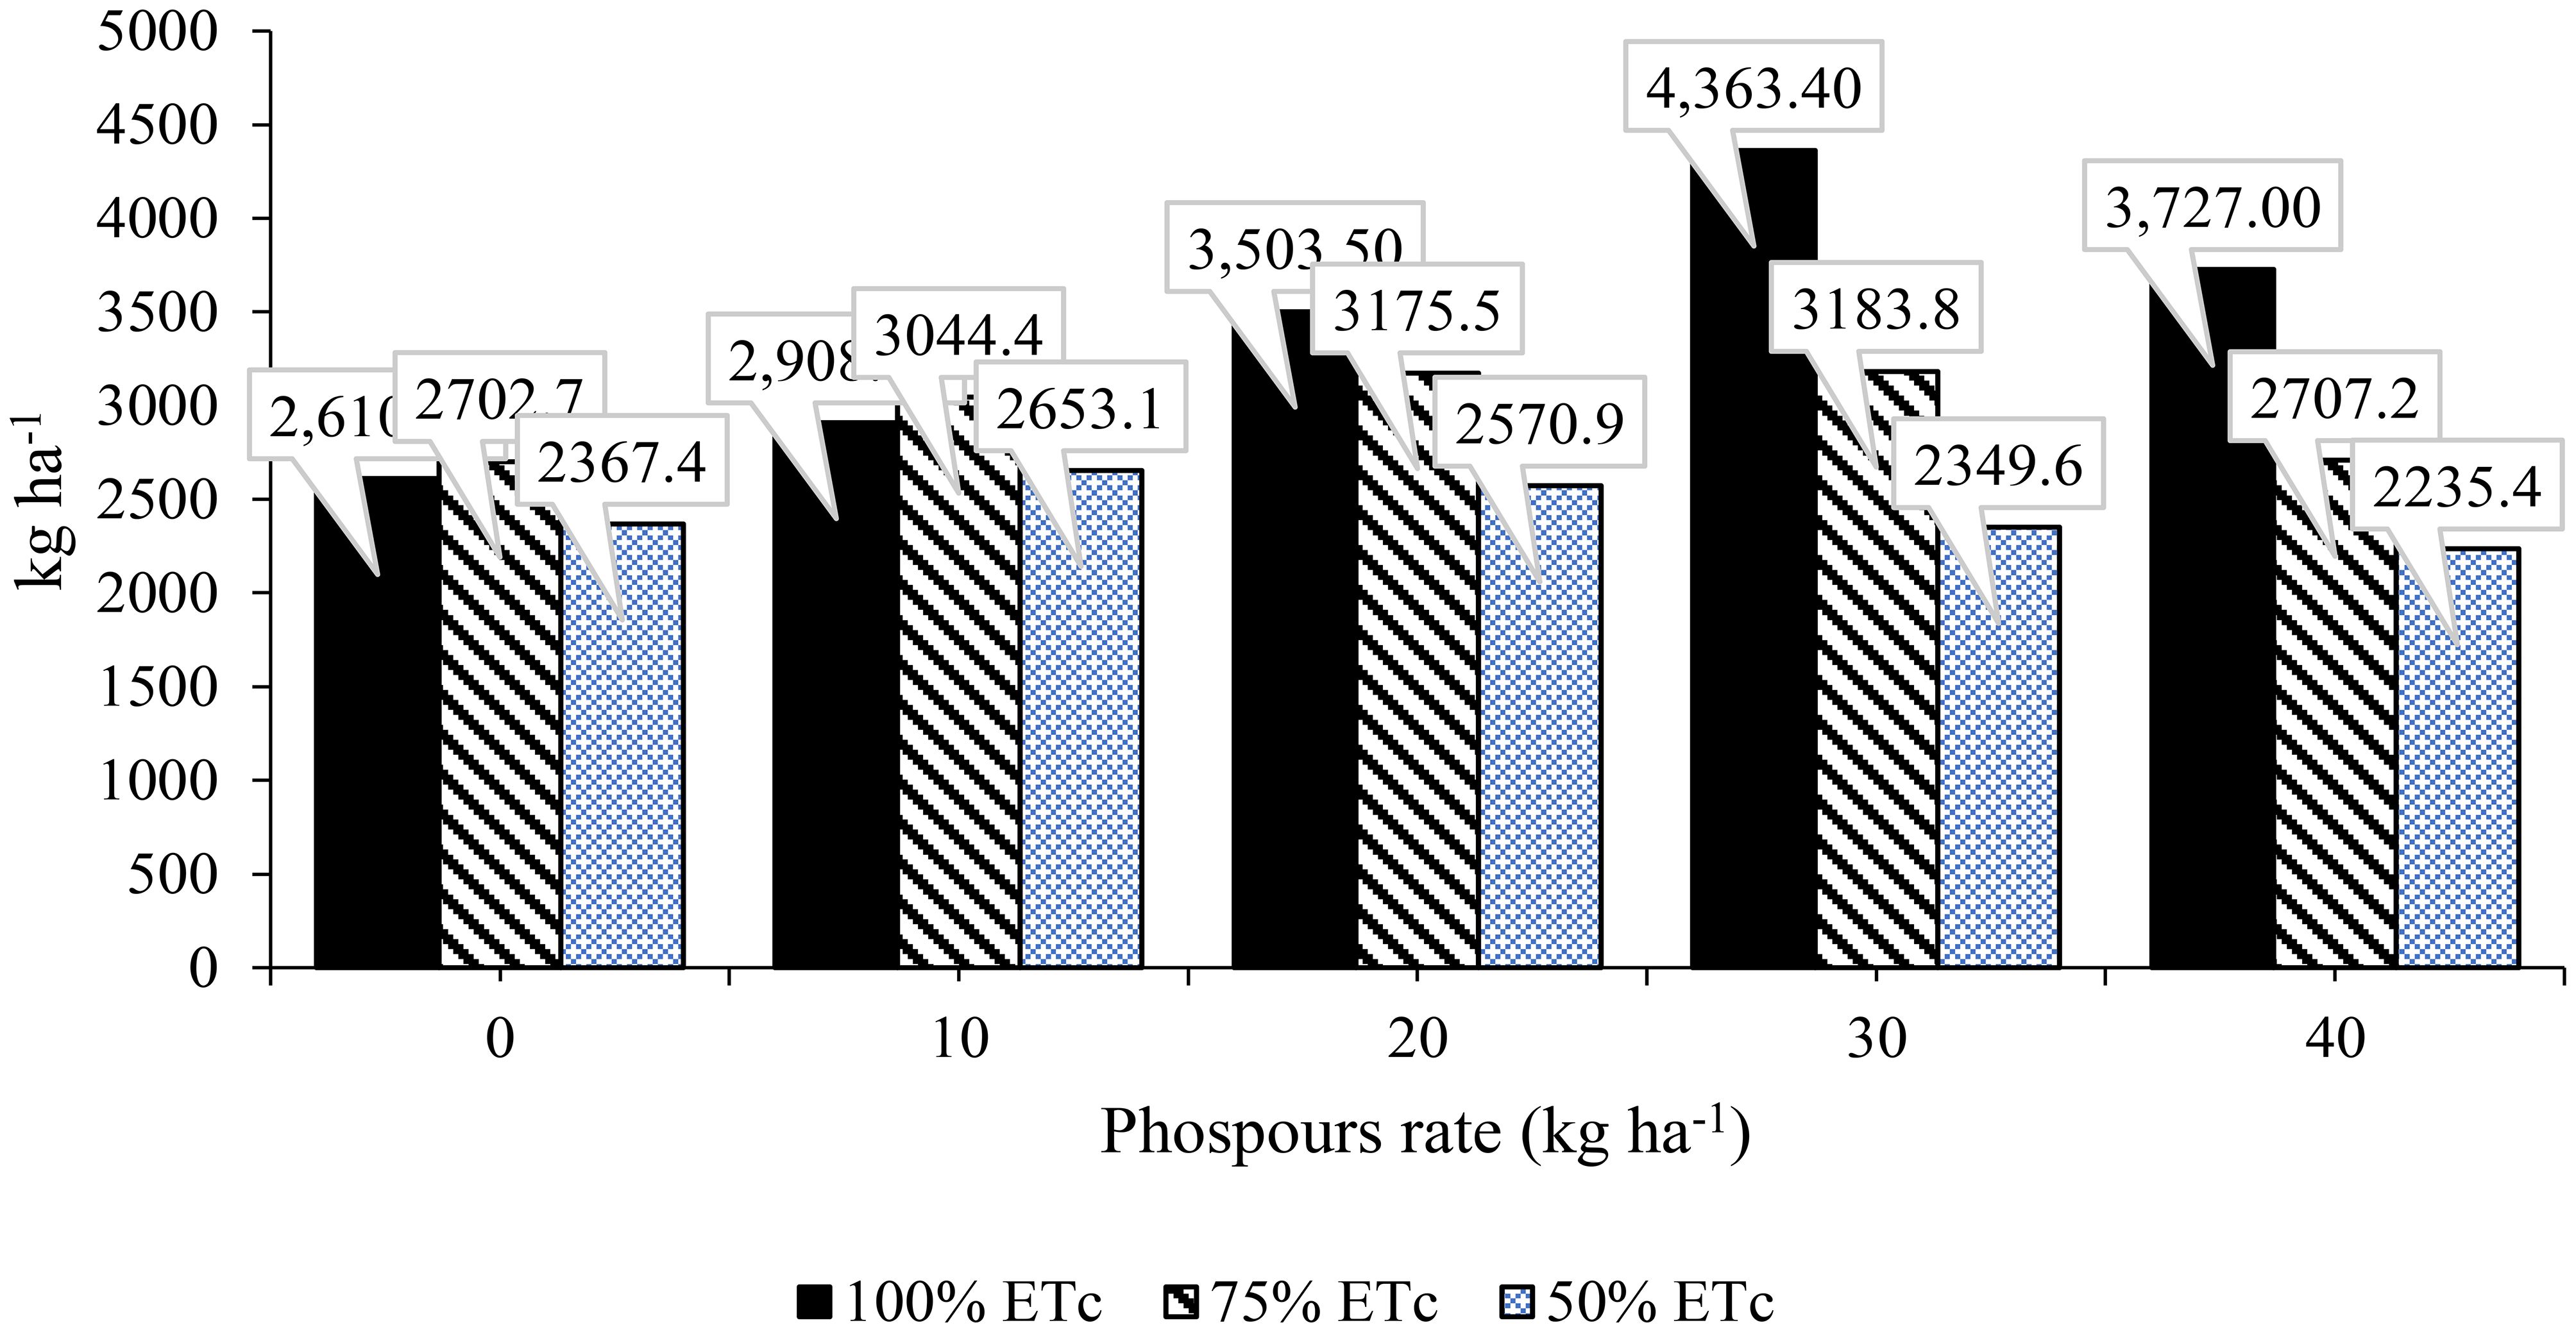
Figure 7. Interaction effects of irrigation level (IR) with phosphorus rate (PR) on grain yield of soya-bean.
This study aimed to determine the optimal soybean grain output under restricted P and water application rates. At a deficit irrigation level of 75% ETc, the results shown that soybean grain yields were 1223.6, 1393.4, 1433.9, and 1472.8 kg ha-1, respectively, with the interactions of P rates of 10, 20, 30, and 40 P2O5 kg ha-1. Different P rates and irrigation volumes had a significant impact on grain output. The highest grain yield of 1472.8 kg ha-1 was achieved with 40 kg ha-1 of P2O5 and 75% ETc. These results suggest that proper irrigation management and phosphorus application are crucial for maximizing the soybean grain yield. These results imply that the two important variables that influence agricultural productivity are water and nutrient management.
Determinations of irrigation level and P rate on soyabean water productivity
This study also determined the impact of applied water and water productivity on soybean production under deficit irrigation, P rate, and its interactions. The levels of deficit irrigation, 100% ETc, 75% ETc, and 50% ETc were used, resulting in an applied water of 6823.5, 5117.6, and 3411.8 m3 ha-1, respectively. This study found that the application of water at different deficit levels did not significantly affect soybean water productivity. However, the application of phosphorus (P) and its interactions had a significant effect on soybean water productivity.
The results of the study showed that, with the exception of 0 P, soybean water productivity varied significantly for dvifferent P rates (Table 3). The highest soybean water productivity was at 50% ETc with 30 P, followed by 100% ETc with 30 P and 100% ETc with 40 P, with values of 0.29 kg m-3 and 0.28 kg m-3, respectively (Table 4). The soybean water productivity remained almost the same for different deficit irrigation levels, ranging from 0 0.27 kg m-3. This shows that crop water productivity and grain yield of soybeans have a positive relationship when subjected to deficit irrigation levels.
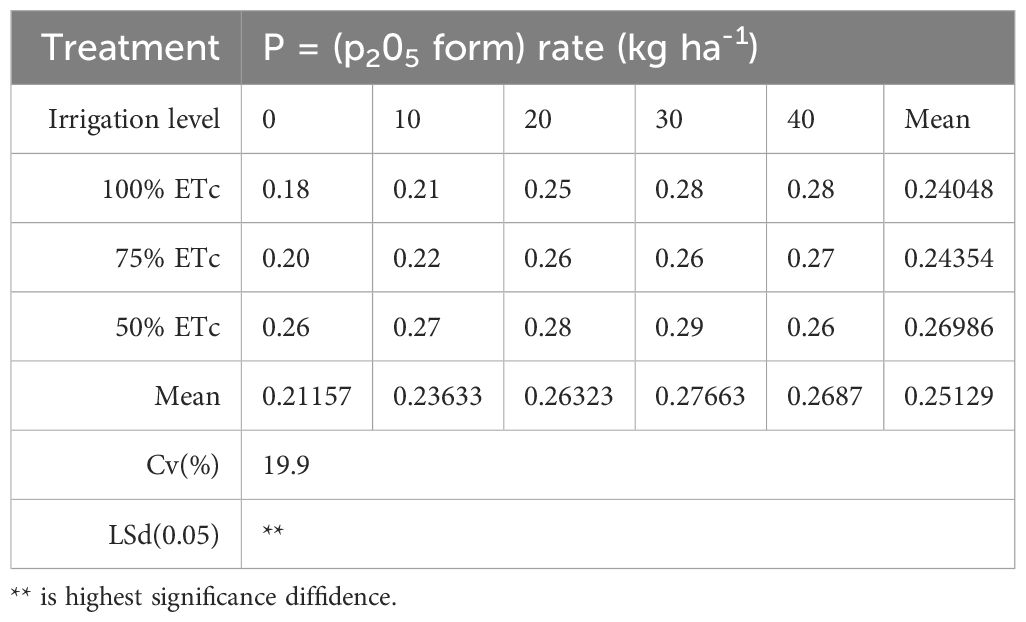
Table 4. The water productivity (kg m-3) of soybeans was influenced by the interaction effect of deficit irrigation levels and P rate (from ANOVA).
The findings of this study suggest that proper application of water and phosphorus can improve soybean water productivity, with farmers achieving maximum yields. It is essential to note that the study did not find any significant impact of deficit irrigation level on soybean water productivity. This information can be useful for farmers seeking to optimize their crop production while conserving water resources. Overall, this study emphasizes the importance of water management practices in agriculture and its potential impact on crop productivity.
Determinations of irrigation level and P rate on soybean yield response factor
One of the most important indicators of a crop’s resistance to water stress is its production response factor. A crop yield response factor larger than one indicates that for a given evapotranspiration deficit, the relative yield decline is proportionately larger than the relative evapotranspiration decrease (Kirda, 1999). The yield response factor was determined and is recorded in Tables 4, 5 to investigate the water shortage response of soybeans. According to the findings, the yield response factor (Ky) for soybeans varied between 0 and 0.68 for irrigation intensities of 100% ETc, 75% ETc, and 50% ETc. Similarly, the values ranged from 0.4 to 0.58 for P rate 40, 30, 20, 10 and 0 kg/ha P. These findings imply that soybean crops are resistant to certain degrees of moisture stress in their growing environments.
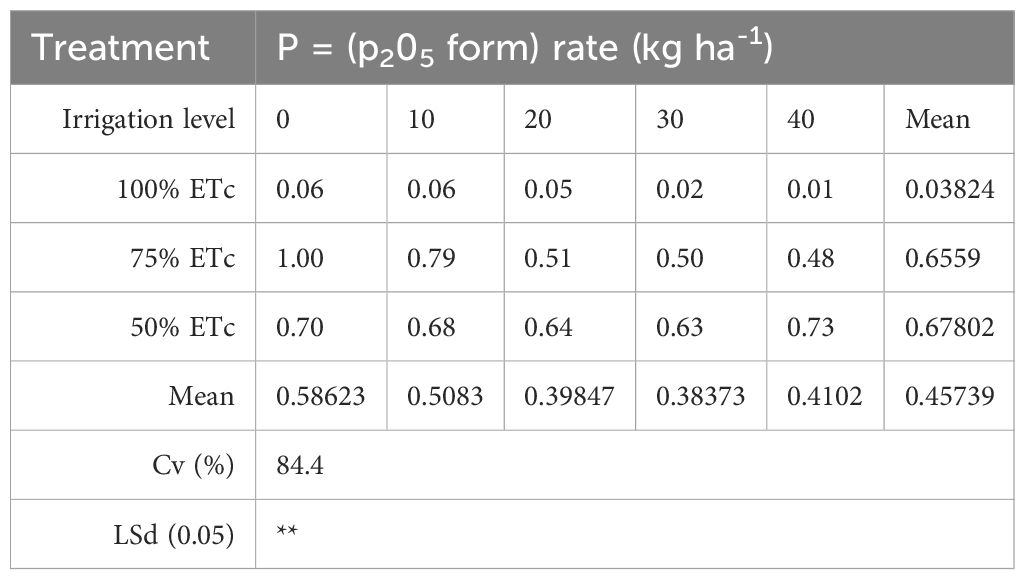
Table 5. Yield response of soybeans was influenced by the interaction effect of deficit irrigation levels with P rate (from ANOVA).
Moreover, the interaction effects of the deficit irrigation level and the P rate were significantly different. Among the interactions, the highest soybean crop response value was 1 for 75% ETc with 0 P, followed by 75% ETc with 10 P, which was observed at 0.79 (Table 5).
These findings hold significant value for farmers and researchers interested in understanding water stress tolerance in soybean crops. The optimal irrigation level and phosphorus rate for a particular crop can be determined by measuring the crop yield response factor. Additionally, the significant interaction effects of deficit irrigation level and P rate suggest that farmers should carefully consider both factors when making decisions regarding crop management. Overall, these results provide valuable insights into the factors that affect soybean crop yield and can help farmers optimize their production practices.
Discovering the benefits of deficit irrigation with a P-rate for soybean production
The goal of this study was to determine how different amounts of deficit irrigation and P application rates may boost soybean output. The control treatment was full irrigation with no P rate, as opposed to the interactions between deficiency levels and P rates (Figure 8). The findings showed that 100% and 75% ETC at P rates of 10, 20, 30, and 40 (kg ha-1) were more effective in improving soybean output. This was attributable to the cumulative effects of soybean output and deficit irrigation in response to P levels. Conversely, 50% ETC with P rates of 10, 20, 30, and 40 kg/ha produced lower soybean yields than did the control treatment.
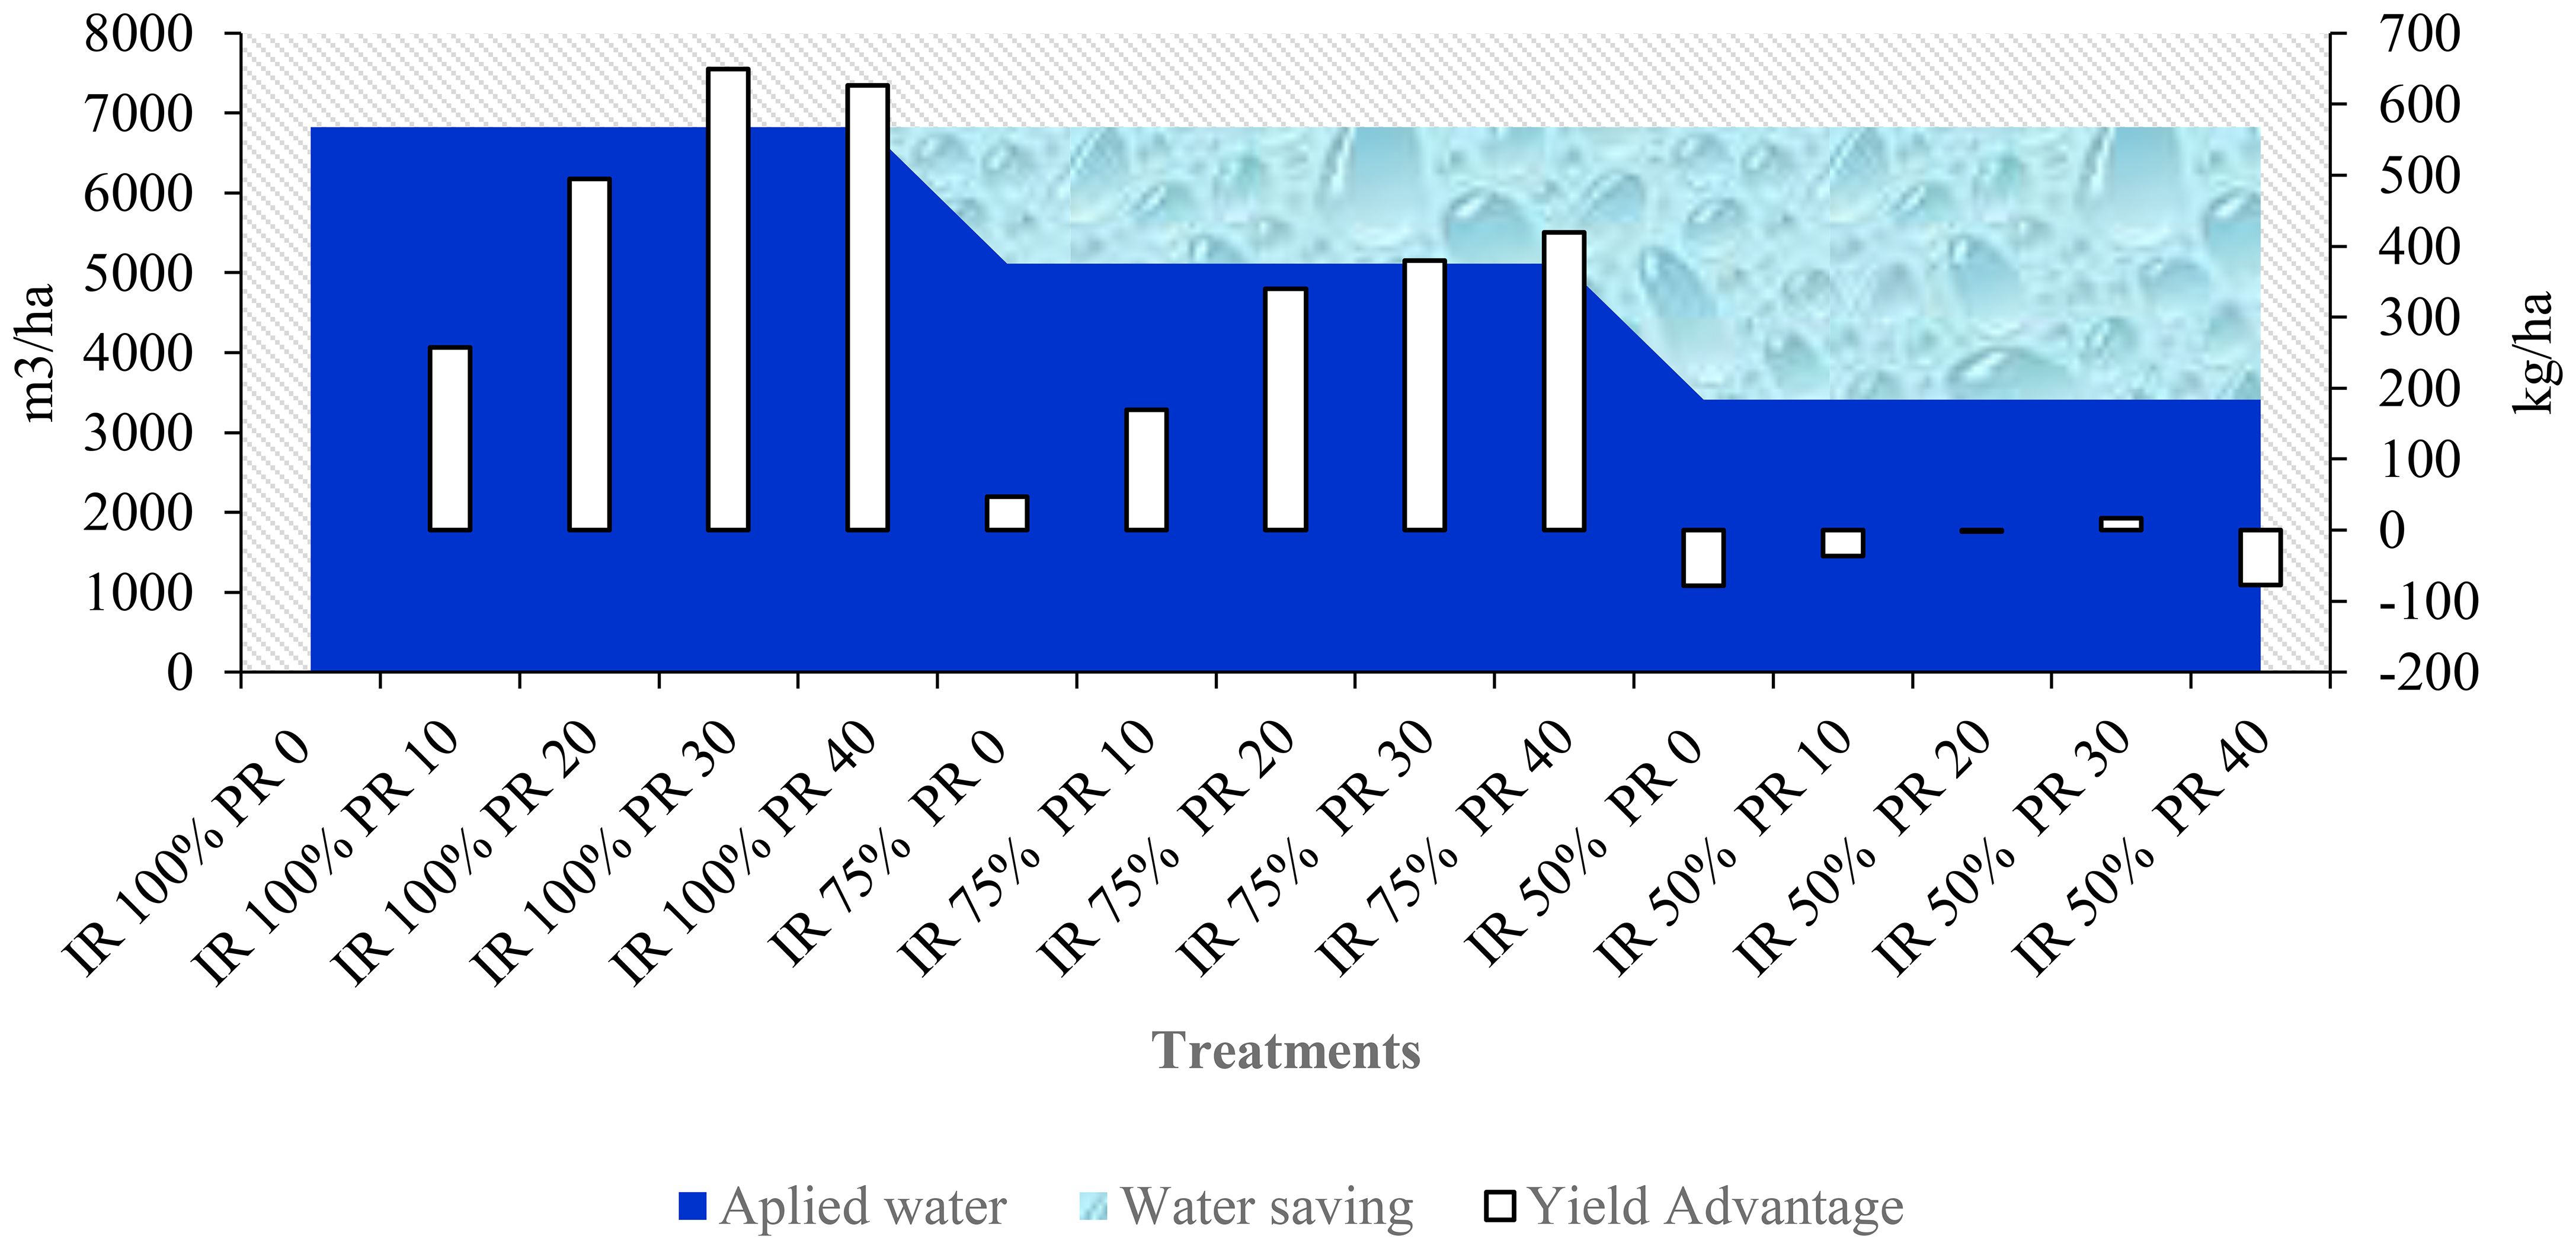
Figure 8. Interaction effects of deficit irrigation and P rate for soyabean yield on applied water, yield advantage, and water saving.
In other words, 100% ETC at P rates of 10, 20, 30, and 40 (kg ha-1) resulted in greater soybean grain yields (19.6, 31.9, 38.1, and 37.3%, respectively) than the control treatment. Similarly, 75% ETC with P rates of 0, 10, 20, 30, and 40 (kg ha-1) increased soybean grain yields by 4.3, 13.9, 24.4, 26.5, and 28.4%, respectively, compared to the control treatment. However, when 50% ETC with P rates of 0, 10, 20, and 40 (kg ha-1) was employed, soybean grain production decreased (8%, 3.6%, 0.2%, and 7.9%, respectively) compared to the control treatment. The exception was 50% ETC with a 30 kg/ha P rate, which produced 1.6% greater yield than the control treatment.
The findings of this study highlight that deficit irrigation at suitable P rates can be a viable option for increasing soybean productivity, particularly in regions with limited water resources. It is crucial to note that these results were specific to the soil and environmental conditions of the experimental site. Further research is necessary to generalize these findings to other regions and soil types. Nevertheless, the outcomes of this study offer useful insights into the potential advantages of deficit irrigation and P rates for soybean production and provide a starting point for future research in this area.
Projected impact of deficit irrigation and P rate on soybean yield in water-scarce regions
This study confirms the benefits of applying deficit irrigation at a P rate to improve soybean yields in regions with limited agricultural water resources. By implementing 75% ETc and 50% ETc deficit irrigation levels, farmers can increase their irrigable area to 1.33 ha and 2 ha, respectively, compared to 100% ETc. This study also predicted the potential outcomes of deficit irrigation and P-rate interactions in the next irrigable areas and the soybean yield generated (Table 6). The forecasted results offer different options based on the available resources. In general, the projected outcome indicates that applying P rates (0, 10, 20, 30, and 40) with 75% ETc can increase soybean grain yield by 28% to 46.3%, and at 50% ETc, 46% to 50.8% can maximize grain yield.
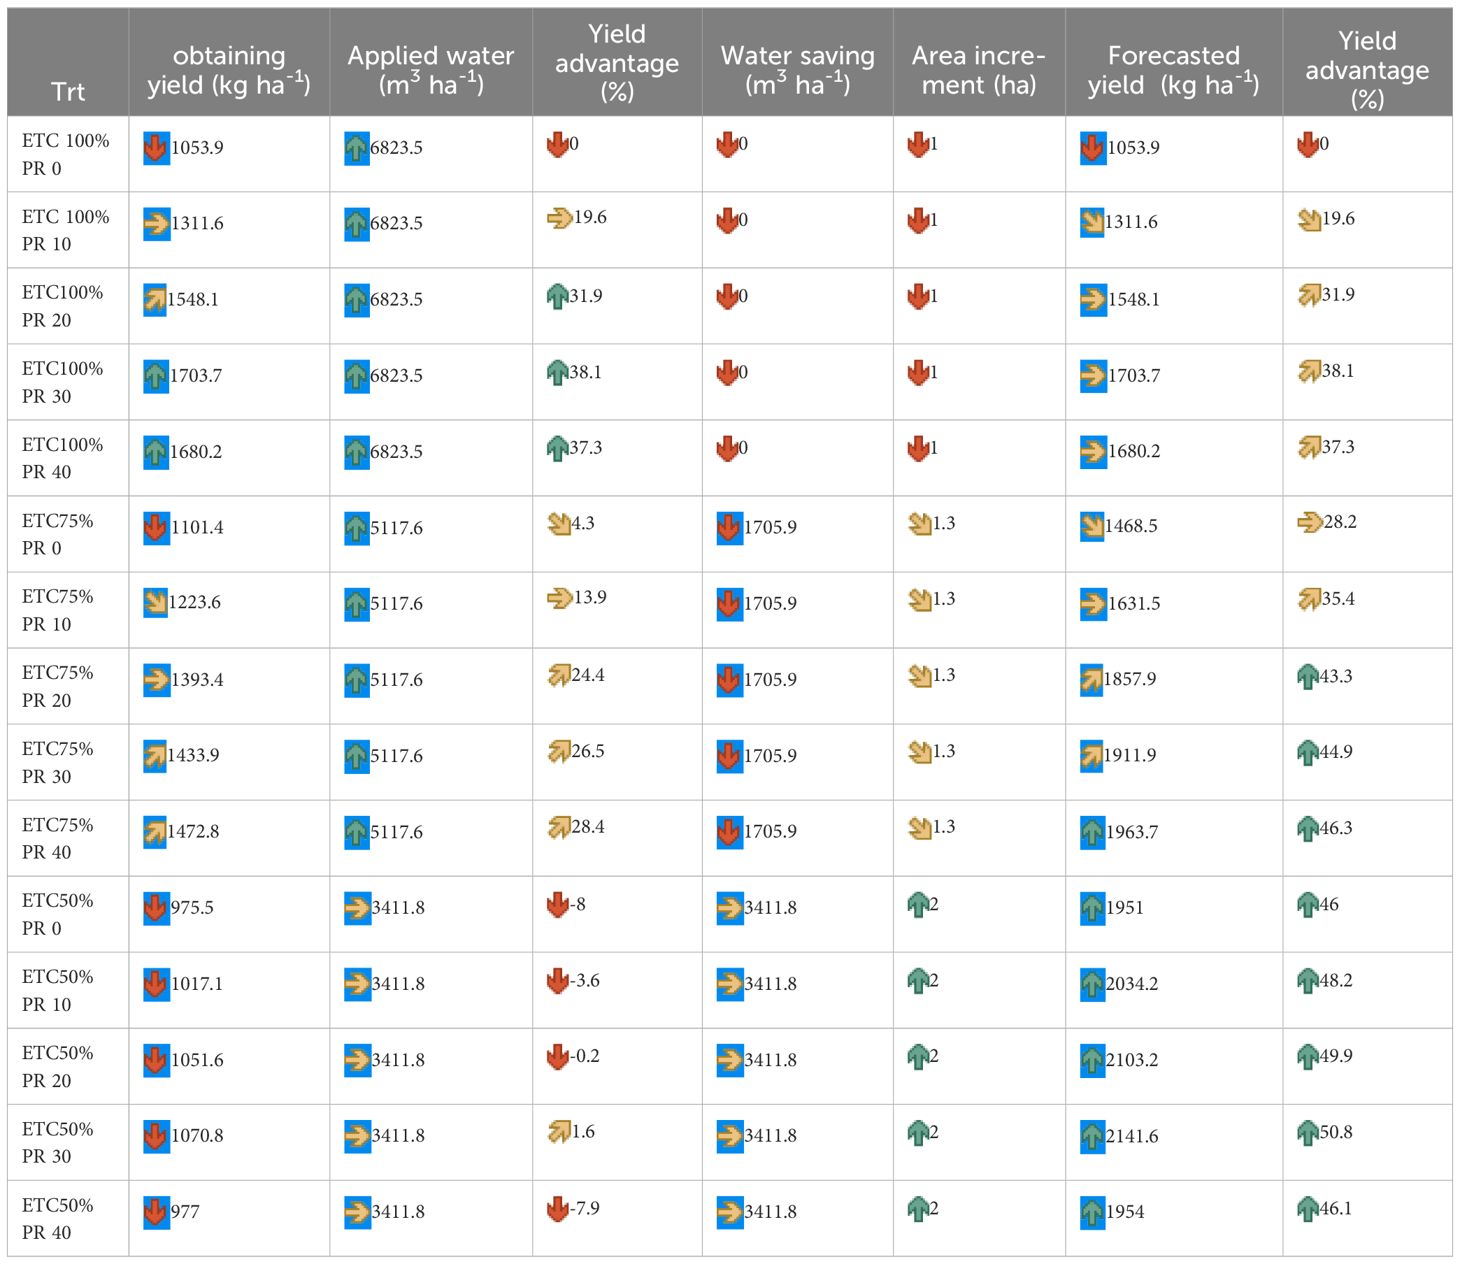
Table 6. Projected impacts of deficit irrigation and P rate on soybean for soyabean yield on obtaining yield (kg ha-1), applied water (m3 ha-1), yield advantage (%), water saving area increment (ha), forecasted yield (kg ha-1), yield advantage (%). The sign also side, partial up and down, up and down indicated on optimum, partial increase and decrease, and increase and decrease, respectively


 .
.
This study is particularly relevant for regions with limited agricultural water resources. By applying deficit irrigation at a P rate, soybean farmers can increase their irrigable area without compromising the yield. Through the implementation of 75% ETc and 50% ETc deficit irrigation levels, farmers can expect to increase their irrigable area to 1.33 ha and 2 ha, respectively, compared with 100% ETc. The study also offers insights into the potential outcomes of deficit irrigation and P-rate interactions, giving farmers different options based on available resources. Based on these results, it is projected that applying a P rate of 75% ETc can increase the soybean grain yield by 28% to 46.3%, and at 50% ETc, the grain yield can be maximized by 46% to 50.8%. These findings provide valuable information for soybean farmers seeking to optimize their yields while conserving water resources.
The present study shows the potential advantages of implementing deficit irrigation and P application rates in enhancing soybean production in regions with limited water resources. These findings are particularly relevant in areas with limited water resources and can provide valuable insights for soybean farmers seeking to optimize their yields while conserving water resources.
Discussion
In wide-ranging crop yields are affected by many factors; those are weather, input price, farming practices, amounts of fertilizer used, quality of seed varieties, and use of irrigation. This study aimed to evaluate the effects of irrigation levels and phosphorus rates on soybean yield and water productivity. The results confirmed that both irrigation and phosphorus application significantly impacted soybean yield and biomass production.
Impact of irrigation levels on soybean yield: Deficit irrigation at 50% ETc resulted in the lowest grain yield, while full irrigation (100% ETc) produced the highest yield (Table 3). This suggests that adequate water supply is crucial for maximizing soybean yield. However, moderate deficit irrigation (75% ETc) also showed a reasonable yield, indicating potential for water-saving strategies in soybean cultivation without drastically affecting the yield. this finding is similar on previous study in areas with limited water supply, farmers should consider using deficit irrigation techniques to conserve water and increase crop productivity. The study found that depending on deficit irrigation, a water shortage more than 25% can affect soybean grain output (Abeba, 2021; Jumrani and Bhatia, 2018; Pawe and Center, 2022).
Influence of phosphorus application on soybean yield: The study found a significant increase in grain yield with increasing phosphorus rates up to 30 kg ha-1. Beyond this level, the yield gains were minimal. This indicates that while phosphorus is essential for soybean growth, there is an optimal level beyond which additional phosphorus does not significantly enhance yield. This finding is similar for previous study on Influence of Soil Water Deficit and Phosphorus Application on Phosphorus Uptake and Yield of Soybean (Glycine max L.) at Dejen, North-West Ethiopia by (Kamara et al., 2007).
Interaction effects of irrigation and phosphorus on grain yield: The interaction between irrigation levels and phosphorus rates showed that the highest yields were obtained with full irrigation and high phosphorus rates (30 kg ha-1) (Figure 7). However, even with moderate deficit irrigation (75% ETc), high phosphorus rates could produce substantial yields, highlighting the importance of balanced nutrient and water management. Furthermore, it was observed that even under limited water supply, the application of high phosphorus rates (30 kg ha-1) resulted in significant crop yields. This underscores the significance of maintaining a harmonious balance between nutrient and water management practices. It is evident that providing adequate irrigation and optimizing phosphorus rates can greatly enhance crop productivity. These findings emphasize the importance of strategic decision-making in agricultural practices to maximize yield potential and ensure sustainable resource utilization. Similar finding by Denisov et al. (2022) who reports full irrigation with high phosphorus rates maximizes soybean yields. Even under moderate irrigation, high phosphorus levels can boost yields, emphasizing the importance of balanced nutrient and water management.
Water productivity: Interestingly, the study found that water productivity did not significantly differ across the different irrigation levels, suggesting that soybean plants could maintain efficient water use under moderate water stress conditions. Phosphorus application improved water productivity, especially at higher irrigation levels, indicating that optimal nutrient management can enhance water use efficiency in soybean cultivation.
Projected impact in water-scarce regions: Implementing 75% ETc and 50% ETc deficit irrigation levels can increase irrigable area to 1.33 ha and 2 ha respectively compared to 100% ETc. As Applying P rates (0, 10, 20, 30, and 40 kg ha-1) with 75% ETc can increase soybean grain yield by 28% to 46.3%. similarly, Applying P rates with 50% ETc can maximize grain yield by 46% to 50.8%.
Conclusion
This study reveals that the combination of deficit irrigation level and P rate in Jawi district, Northwest Ethiopia, significantly impacts soybean productivity. The results showed that P rates of 10, 20, 30, and 40 (kg ha-1) with 100% ETC resulted in higher grain yields compared to the control treatment. Similarly, P rates of 0, 10, 20, 30, and 40 (kg ha-1) P with 75% ETC resulted in higher grain yields.
The study also found higher water productivity at different P rates, except at 0 P. The highest soybean water productivity was observed for 50% ETc with 30 P, followed by 100% ETc with 30 P, and 100% ETc with 40 P. The highest soybean crop response value was recorded for 75% ETc with 0 P and 75% ETc with 10 P.
This study suggests that implementing these strategies can optimize soybean yields while conserving water resources. Farmers can increase their irrigable areas and improve their yield without compromising water resources. This information can be valuable for soybean farmers to improve their yields, especially in areas with limited water resources. to ensure crop sustainability. By following these recommendations, farmers can not only enhance their crop productivity but also contribute to the overall sustainability of their farming practices. This study provides valuable insights for soybean farmers seeking to maximize their yields in water-scarce regions.
Data availability statement
The original contributions presented in the study are included in the article/supplementary material. Further inquiries can be directed to the corresponding author.
Author contributions
TA: Conceptualization, Data curation, Formal analysis, Investigation, Methodology, Project administration, Resources, Software, Supervision, Validation, Visualization, Writing – original draft, Writing – review & editing. AS: Writing – original draft, Writing – review & editing, Investigation, Software. DM: Conceptualization, Supervision, Writing – original draft, Writing – review & editing. MM: Methodology, Supervision, Validation, Visualization, Writing – original draft, Writing – review & editing. MA: Data curation, Investigation, Methodology, Writing – original draft, Writing – review & editing.
Funding
The author(s) declare that no financial support was received for the research, authorship, and/or publication of this article.
Acknowledgments
First, we would like to thank the almighty God for keeping us brave and inspired for compiling this work. We thank the Ethiopian Meteorological Service Agency (EMSA) and Pawe Agricultural Research Center (PARC) soil laboratory for providing meteorological and soil parameter data, respectively.
Conflict of interest
The authors declare that the research was conducted in the absence of any commercial or financial relationships that could be construed as a potential conflict of interest.
Publisher’s note
All claims expressed in this article are solely those of the authors and do not necessarily represent those of their affiliated organizations, or those of the publisher, the editors and the reviewers. Any product that may be evaluated in this article, or claim that may be made by its manufacturer, is not guaranteed or endorsed by the publisher.
References
Abate T., Ampofo J. K. O. (1996). Insect pests of beans in Africa: their ecology and management. Annu. Rev. entomology 41, 45–73. doi: 10.1146/annurev.en.41.010196.000401
Abeba H. S. (2021). Response of Deficit Irrigation and Furrow Irrigation Methods on Yield and Water Use Efficiency of Soybean (Glycine max L.) in Jawi Woreda (Amhara Region: Bahir Dar University).
Adametie T. F., Mitku D. T. (2021). Experimental evaluations of CROPWAT8 irrigation scheduling for hot pepper and WUE through on-farm participatory approaches, Northwest Ethiopia. Am. J. Agric. Forestry 9, 194–205.
Adamtie T. F., Mitku D. T., Hassen A. (2022). Validations of CROPWAT based irrigation practice for tomato productivity in lowland hot humid area of Ethiopia. Am. J. Life Sci. Innovation 1, 27–35. doi: 10.54536/ajlsi.v1i1.426
Admasu R., Tadesse A. A. M. (2019). Effect of deficit irrigation on soybean (Glycine max L.) under conventional, fixed and alternate furrow irrigation systems at Jimma, Ethiopia. Biol. Agric. Healthcare 9 (2).
Ahmad M., Adil Z., Hussain A., Mumtaz M. Z., Nafees M., Ahmad I., et al. (2019). Potential of phosphate solubilizing Bacillus strains for improving growth and nutrient uptake in mungbean and maize crops. Pakistan J. Agric. Sci. 56.
Allen R. G., Pereira L. S., Raes D., Smith M. (1998). Crop evapotranspiration-Guidelines for computing crop water requirements-FAO Irrigation and drainage paper 56 Vol. 300 (Rome: Fao), D05109.
Arain G. (2013). Crop manager–agronomy center pivot irrigation system valley irrigation Pakistan (private), limited, P.
Bos M. G., Kselik R. A., Allen R. G., Molden D. (2008). Water requirements for irrigation and the environment (Springer Science & Business Media).
Bouyoucos G. J. (1962). Hydrometer method improved for making particle size analyses of soils 1. Agron. J. 54, 464–465. doi: 10.2134/agronj1962.00021962005400050028x
Bowles T. M., Atallah S. S., Campbell E. E., Gaudin A., Wieder W. R., Grandy A. S. (2018). Addressing agricultural nitrogen losses in a changing climate. Nat. Sustainability 1, 399–408. doi: 10.1038/s41893-018-0106-0
Denisov K. E., Kravchuk A., Poletaev. I. S., Malysheva A. (2022). Features of growing irrigated soybeans with complex mineral nutrition. doi: 10.28983/asj.y2022i11pp15-18. Аграрный научный журнал.
Fantaye K. T. (2004). Field comparison of resource utilization and productivity of three grain legume species under water stress (University of the Free State).
Garcia M., Torre M., Marina M., Laborda F., Rodriquez A. R. (1997). Composition and characterization of soyabean and related products. Crit. Rev. Food Sci. Nutr. 37, 361–391. doi: 10.1080/10408399709527779
Getachew M. (2014). Influence of soil water deficit and phosphorus application on phosphorus uptake and yield of soybean (Glycine max L.) at Dejen, North-West Ethiopia. Am. J. Plant Sci.2014
Jin J., Wang G., Liu X., Pan X., Herbert S., Tang C. (2006). Interaction between phosphorus nutrition and drought on grain yield, and assimilation of phosphorus and nitrogen in two soybean cultivars differing in protein concentration in grains. J. Plant Nutr. 29, 1433–1449. doi: 10.1080/01904160600837089
Jumrani K., Bhatia V. S. (2018). Impact of combined stress of high temperature and water deficit on growth and seed yield of soybean. Physiol. Mol. Biol. Plants 24, 37–50. doi: 10.1007/s12298-017-0480-5
Kamara A. Y., Abaidoo R., Kwari J., Omoigui L. (2007). Influence of phosphorus application on growth and yield of soybean genotypes in the tropical savannas of northeast Nigeria. Arch. Agron. Soil Sci. 53, 539–552. doi: 10.1080/03650340701398452
Kirda C. (1999). Crop yield response to deficit irrigation: report of an FAO/IAEA co-ordinated research program by using nuclear techniques: executed by the Soil and Water Management & Crop Nutrition Section of the Joint FAO/IAEA Division of Nuclear Techniques in Food and Agriculture. Springer Science & Business Media.
Lovelli S., Perniola M., Ferrara A., Di Tommaso T. (2007). Yield response factor to water (Ky) and water use efficiency of Carthamus tinctorius L. and Solanum melongena L. Agric. Water Manage. 92, 73–80. doi: 10.1016/j.agwat.2007.05.005
McCauley A., Jones C., Jacobsen J. (2005). Basic soil properties. Soil Water Manage. module 1, 1–12.
Mitran T., Meena R. S., Lal R., Layek J., Kumar S., Datta R. (2018). Legumes for soil health and sustainable management (Springer), 487–510.
Nikakhtar A., Neshat A., Yazdanpanah N. (2023). The effect of deficit irrigation management and nitrogen fertilizer levels on yield and water use productivity in soybean. J. Water Soil Resour. Conserv. 13, 13–25.
Pawe E., Center A. A. (2022). Abeba hassen selie1, abebech abera beyene2, ashebir haile tefera3, sisay assres4.
Reddy D. S., Bhatnagar-Mathur P., Vadez V., Sharma K. K. (2012). Grain legumes (soybean, chickpea, and peanut): omics approaches to enhance abiotic stress tolerance. Improving Crop resistance to abiotic Stress, 995–1032.
Tariku S., Wondale L., Zegeye W., Tsigie A., Temesgea Y., Getu A. (2018). Participatory Agricultural Production Systems Analysis In Agp-Ii Districts: Implications For Research And Development For Western Amhara.
Velasquez M. T., Bhathena S. J. (2007). Role of dietary soy protein in obesity. Int. J. Med. Sci. 4, 72–82. doi: 10.7150/ijms.4.72
Yeshitila S., Tsegaye D., Million F. (2022). Response of Soybean (Glycine max L.) Varieties to Different Rates of Phosphorus Fertilizer on Yield and Yield Components at Omo Kuraz, Southern Ethiopia. Cross Curr. Int. J. Agri Vet. Sci. 4, 18–24. doi: 10.36344/ccijavs.2022.v04i03.001
Zapata F., Roy R. N. (2004). Use of phosphate rocks for sustainable agriculture (FAO Fertilizer and Plant Nutrition Bulletin), 1–148.
Keywords: deficit irrigation, phosphorus rate, soybean, Jawi District, Ethiopia
Citation: Adametie TF, Selie AH, Mitku DT, Megerssa MK and Alamenie MA (2024) Determining optimal phosphorus rates and deficit irrigation levels for enhanced soybean productivity in Jawi District, Northwest Ethiopia. Front. Agron. 6:1422570. doi: 10.3389/fagro.2024.1422570
Received: 24 April 2024; Accepted: 02 September 2024;
Published: 03 October 2024.
Edited by:
Tajamul Hussain, Oregon State University, United StatesReviewed by:
Anis Ali Shah, University of Education Lahore, PakistanMuhammad Fraz Ali, Northwest A&F University, China
Copyright © 2024 Adametie, Selie, Mitku, Megerssa and Alamenie. This is an open-access article distributed under the terms of the Creative Commons Attribution License (CC BY). The use, distribution or reproduction in other forums is permitted, provided the original author(s) and the copyright owner(s) are credited and that the original publication in this journal is cited, in accordance with accepted academic practice. No use, distribution or reproduction is permitted which does not comply with these terms.
*Correspondence: Temesgen F. Adametie, dGVtZXNnZW5mZW50YWh1bjA5QGdtYWlsLmNvbQ==
†ORCID: Temesgen F. Adamtie, orcid.org/0000-0002-7572-4893
 Temesgen F. Adametie
 Abeba H. Selie1