- 1Department of Plant Production and Genetics, Faculty of Agriculture, Urmia University, Urmia, Iran
- 2Department of Medicinal Plants, Shahid Bakeri Higher Education Center of Miandoab, Urmia University, Urmia, Iran
- 3School of Biological Sciences, The University of Western Australia, Crawley, WA, Australia
- 4The University of Western Australia Institute of Agriculture, The University of Western Australia, Perth, WA, Australia
This study investigated the impact of stress modifiers in intercropping systems on seed yield and yield components, physiological traits, and antioxidant activity of safflower (Carthamus tinctorius L.) and chickpea (Cicer arietinum L.) under rainfed (water deficit) conditions. The experimental design included three stress modulator levels [control, 1 mM salicylic acid (SA), and 10 mM selenium (Se)] and five planting patterns [intercropping one row of safflower and two rows of chickpeas (1S:2C), two rows of safflower and four rows of chickpeas (2S:4C), and three rows of safflower and five rows of chickpeas (3S:5C), and sole cropping of safflower (Ss) and chickpea (Cs)]. The results revealed that Ss treated with Se produced the highest safflower biological yield (4,905.50 kg ha−1) and seed yield (1,259.50 kg ha−1), while Cs produced the highest chickpea biological yield (2,799.67 kg ha−1) and seed yield (852.44 kg ha−1), followed by Cs treated with SA (2,419.25 kg ha−1 and 764.83 kg ha−1, respectively). Conversely, the 3S:5C intercropping ratio (IR) with Se application recorded the highest safflower oil content (32.08%), while Ss treated with Se produced the highest oil yield (358.62 kg ha−1). The 2S:4C configuration with Se application produced the highest unsaturated fatty acid (oleic and linoleic acids) concentrations in safflower, while 2S:4C and 3S:5C treated with Se produced the highest chlorophyll a and chlorophyll b contents in safflower and chickpea. Furthermore, 1S:2C and 2S:4C treated with SA or Se produced the highest proline and total soluble sugars in safflower and chickpea. The SA and Se treatments in the intercropping systems increased catalase, ascorbate peroxidase, and superoxide dismutase activities compared to the respective control plants (sole cropping) and enhanced oil contents, fatty acid composition, physiological traits, and antioxidant properties. These results underscore the potential of intercropping systems coupled with stress modulator treatments as a sustainable approach for safflower and chickpea cultivation under rainfed conditions.
Introduction
Safflower (Carthamus tinctorius L.) is a widely cultivated annual oilseed crop within the Asteraceae family, historically valued for its natural dye, imparting a yellow hue. Safflower is well-suited to dry, hot climates due to its xerophytic characteristics, with deep taproots and spines (Najafabadi and Jalilian, 2022). Safflower seeds have a high oil content, ranging from 25%–45%, and are rich in unsaturated fatty acids, mainly oleic and linoleic acid. Safflower seed oil and its derivatives have industrial and medicinal applications. For example, its petals and extracted oil are used in herbal medicine to address various ailments such as blood pressure, rheumatic conditions, and vascular diseases (Alioghli et al., 2022), and its leaves are valuable as a source of dyes in the textile industry and as a natural food colorant (Sher et al., 2022). Safflower seed is also used as a supplementary feed for livestock (Jamshidi Jam et al., 2023).
Chickpea (Cicer arietinum L.), an annual plant from the Fabaceae family, is extensively cultivated for human consumption. Its seeds are highly valued for their nutritional composition, being a rich source of proteins, vitamins, and minerals essential for human nutrition (Mohammadkhani et al., 2023). Chickpea engages in symbiotic nitrogen fixation, improving soil fertility, making it integral to crop rotations (Kaur et al., 2022), and fostering agricultural sustainability. Chickpea cultivation, either as a sole crop or in intercropping systems with other plant species, enhances nitrogen storage and uptake by plants, thus contributing to nitrogen fertilization management (Mohammadkhani et al., 2023).
Intercropping, particularly with legumes, has gained attention among farmers, especially smallholders, for enhancing cropping system sustainability (Mohammadzadeh et al., 2022). Intercropping optimizes land use (Maitra et al., 1999), diversifies income streams, and improves nutrient utilization, pest control, and soil health, enhancing yields and resilience against crop failures (Maitra et al., 2000; Manasa et al., 2018). Intercropping involves cultivating multiple plant species simultaneously in the same field to enhance nutrient availability and crop productivity (Ghaderimokri et al., 2022). Studies have demonstrated that intercropping systems are agronomically and economically feasible, especially when species exhibit complementary resource use (Rezaei-Chiyaneh et al., 2021a; Amani Machiani et al., 2019), as they outperform monoculture stands in terms of productivity (Gao et al., 2019; Mohammadzadeh et al., 2022; Namazi et al., 2022). Studies have reported improved vegetative growth and physiological responses of industrial plants intercropped with legumes compared to monocropping conditions (Fotohi Chiyaneh et al., 2022; Gürsoy, 2022). Moreover, intercropping stabilizes yields, suppresses weeds, optimizes land use, and increases nitrogen availability, especially when incorporating legumes (Weerarathne et al., 2017; El-Tohamy et al., 2018), contributing to environmental conservation (Jalilian et al., 2017). Thus, adopting intercropping practices offers a promising solution for achieving optimal yields while minimizing external input requirements, ultimately reducing the long-term input demands of agricultural systems (Rezaei-Chiyaneh et al., 2021b).
In arid and semi-arid climates, water availability significantly constrains agricultural production, particularly under rainfed conditions (Heydarzadeh et al., 2022). Plant responses to water-deficit stress are multifaceted, influenced by factors such as the frequency of dry and wet periods, soil and atmospheric water deficits, and the timing and severity of drought events (Asghari et al., 2023). Zamani et al. (2023) recently showed that intercropping dragon’s head (Lallemantia iberica) with chickpea (Cicer arietinum L.) under rainfed conditions improved nutrient levels, chlorophyll and carotenoid content, carbohydrate accumulation, and seed yield. Water scarcity adversely affects plant growth, morphological characteristics, physiological processes, and biochemical pathways, including osmotic adjustment, stomatal regulation, and antioxidant defense mechanisms (Shah et al., 2020), necessitating strategies to enhance plant tolerance to drought stress.
Salicylic acid (SA) and selenium (Se) have emerged as promising agents for mitigating drought effects on plants. Salicylic acid, a plant hormone, induces plant defense mechanisms against various biotic and abiotic stresses (Ardebili et al., 2014), positively impacting physiological activities, including tissue water status, stomatal conductance, chlorophyll content, and membrane properties (Damalas and Koutroubas, 2021) and antioxidant enzyme activities (Yousefzadeh Najafabadi and Ehsanzadeh, 2017; Kaur et al., 2022). Gürsoy (2022) reported that SA application improved agronomic traits, growth, and antioxidant enzyme activities in sunflower and linseed. Selenium is a crucial plant microelement, exerting regulatory actions as cofactors for various enzymes and influencing plant growth and development (Inostroza-Blancheteau et al., 2013). Studies have shown that Se application improves crop quantity and quality (Sher et al., 2022); enhances photosynthesis, antioxidant metabolism, carbohydrate accumulation, and secondary metabolite synthesis (Inostroza-Blancheteau et al., 2013); and improves chloroplast structure and plasma membrane fluidity and delays senescence (Zhang et al., 2021), enhancing plant resistance to drought stress by activating antioxidant enzymes, inducing hormonal changes, facilitating nutrient uptake, and promoting overall plant growth (Zhang et al., 2021; Huang et al., 2022). For instance, in soybean, Se played a significant role in various physiological processes under drought stress, highlighting its potential to improve growth (Galić et al., 2021).
Hussein et al. (2024) recently explored the effects of foliar SA spray on intercropped soybean (SB; Glycine max L.) and sorghum (S; Sorghum bicolor L.), revealing that optimal seed yields for soybean occurred in the 1S:1SB and 2S:2SB intercropping ratios. Similarly, Taghizadeh et al. (2023) investigated sesame (S) and kidney bean (KB) intercropping, reporting that the 4S:2KB intercropping ratio with biofertilizer application produced the highest sesame oil content, and the 2S:2KB intercropping ratio with biofertilizer application had the greatest land equivalent ratio. Zamani et al. (2022) reported a significant increase in the seed yield of dragon’s head (D; Lallemantia iberica) when intercropped with chickpea (Ch) and treated with biofertilizers. Moreover, all intercropping patterns produced higher oil concentrations than sole cropping, with 2D:1Ch plus biofertilizer yielding the highest oil concentration. Manda et al. (2018) reported favorable outcomes when intercropping safflower with lentils, surpassing sole lentil cultivation and underscoring the effectiveness of intercropping oilseeds with pulses in enhancing production, particularly in regions like India. In another study, intercropping Tef (Eragrostis Tef) with safflower produced higher land equivalent ratio and monetary advantage index values than monocropping (Tilahun, 2019).
Despite the potential benefits of intercropping, maximizing the synergies between safflower and chickpea remains relatively unexplored. Moreover, applying stress modifier (SM) biostimulants like SA and Se to mitigate the adverse effects of water-deficit stress on crop growth and productivity warrants further investigation. This study addresses these gaps by investigating the interactive effects of intercropping with chickpea and SM biostimulants on safflower production. Specifically, the study seeks to evaluate the physiological response of safflower and chickpea to SA and Se application under rainfed conditions, elucidate the impact of SA and Se on antioxidant enzyme activities in safflower and chickpea, and determine the optimal treatment conditions for the desired outcomes. Through these objectives, the research will advance our understanding of sustainable agricultural practices in water-limited environments while enhancing safflower yield, oil content, and fatty acid composition.
Materials and methods
Experimental design
The experiment was conducted at a research farm in Naqadeh, West Azerbaijan Province, Iran (longitude 45° 25′ E, latitude 36° 48′ N, altitude 1,318 m) during the 2021 growing season, with an average annual temperature and precipitation of 10.88°C and 232.9 mm, respectively (Table 1). The experiment had a factorial arrangement based on a randomized complete block design, with three stress modulator levels (C, control; SA, salicylic acid; Se, selenium) and five cropping patterns [one row of safflower and two rows of chickpea (1S:2C), two rows of safflower and four rows of chickpea (2S:4C), three rows of safflower and five rows of chickpea (3S:5C), and sole cropping of safflower (Ss) or chickpea (Cs)]. Soil samples were collected from 0 m to 0.3 m depth before the experiment to determine initial soil characteristics, revealing a loam-clay texture, 0.12% nitrogen, 255 mg kg−1 K, 8.02 mg kg−1 P, and pH 7.9. The study site had a 10-year mean annual temperature and precipitation of 12°C and 390 mm, respectively.

Table 1 Average monthly temperature and rainfall for the 2020 and 2021 growing seasons in the Naqadeh region.
Plant material
Chickpea (cv. Saeed) and safflower (cv. Farman) seeds were obtained from the Dryland Agricultural Research Institute of Maragheh, Iran. Before sowing, the experimental field received 50 kg ha−1 urea, 150 kg ha−1 triple superphosphate, and 100 kg ha−1 potassium. Plots measuring 5 m long × 3 m wide were established with 40 cm row spacing for both crops. Within rows, safflower was spaced at 15-cm intervals (16.6 plants m−2), while chickpea was spaced at 7.5-cm intervals (33.3 plants m−2). Before seeding, chickpea seeds were inoculated with commercial rhizobia (Rhizobium leguminosarum). Seeds were sown manually at 8 cm depth on 25 March 2021. No irrigation or pesticides were applied throughout the growing season. Plots were regularly hand-weeded as required. All agronomic practices were uniform across the experimental units.
Foliar SM sprays were applied at the stem elongation and early flowering stages, with 1 mM SA (Sigma Aldrich Co., USA) or 10 mM Se (Sigma Aldrich Co, Spain). Control groups were sprayed with water.
Plant growth characteristics
At maturity, plant parameters for safflower and chickpea, including plant height, branch number, capitol number, pod number, seed number per capitol and pod, and 1,000-seed weight, were recorded for ten harvested plants per plot. For safflower and chickpea seed yield and biological yield estimations, a 2-m2 area in the middle of each plot was harvested, with the harvested plant samples oven-dried at 72°C for 48 h before recording dry weights as the biological yield. Seeds were separated from capitol (safflower) and pods (chickpea) and weighed after oven-drying at 72°C to constant moisture content (14%–15%).
Land equivalent ratio
The partial land equivalent ratio (LER) of dragon’s head (LERD) and chickpea (LERCh) and total LER (LERT) were calculated as follows (Rezaei-Chiyaneh et al., 2021b):
where YSi and YSs are the seed yield of safflower under intercropping or sole cropping, respectively, and YChi and YChs are the seed yield of chickpea under intercropping or sole cropping, respectively.
Physiological attributes
Representative leaf samples were collected from the plots at the full flowering stage, frozen in liquid nitrogen, and stored in a freezer at −80°C for later analysis. The freezing process preserves the biochemical constituents of the samples.
Chlorophyll content
Fresh leaf samples (0.5 g) at the full flowering stage were ground in liquid nitrogen, mixed with 10 mL of 80% acetone, and homogenized by centrifugation at 4,000 rpm for 15 min. Subsequently, the extracted pigments were quantified using a spectrophotometer, allowing for accurate measurement of chlorophyll a, b, and carotenoid contents (Lichtenthaler and Wellburn, 1987).
Total soluble sugar content
The phenol-sulfuric acid method was used to estimate total soluble sugar contents in the leaves. Leaf tissue (0.5 g) was powdered in a mortar using liquid nitrogen, mixed with ethanol, and combined with 5% phenol. Next, 5 mL of 98% sulfuric acid was added to the mixture and incubated for 1 h before measuring the absorption of the solution at 485 nm using a spectrophotometer (Dubois et al., 1956).
Proline content
Leaf proline content was determined using the ninhydrin colorimetric method. Leaf tissue (0.5 g) was finely ground in a mortar using liquid nitrogen, homogenized in 10 mL of 3% sulfosalicylic acid solution, and centrifuged at 4,000 rpm for 15 min to obtain a clear supernatant. A glacial acetic acid solution of proline ninhydrin acid was prepared in a 1:1:1 ratio for the colorimetric evaluation of proline and equilibrated at 100°C for 1 h to facilitate the reaction between proline and ninhydrin, forming a chromophore. The reaction was terminated by rapidly cooling the solution in an ice bath. To develop the chromophore, 4 mL toluene was added to the reaction mixture, enabling the extraction of the chromophore into the organic phase. The absorbance of the samples was measured at 515 nm using a spectrophotometer (Bates et al., 1973).
Antioxidant enzyme extractions and assays
For antioxidant enzyme activities, 100 mg of fresh material was finely ground in 2 mL of 0.1 M KH2PO4 buffer containing 5% polyvinylpyrrolidone (PVP) at pH 6. The extracts were centrifuged at 15,000 rpm for 30 min at 3°C, with enzyme activity determined from the clear supernatant (Tejera et al., 2004). Catalase (CAT) activity was determined at 240 nm based on variations in hydrogen peroxide (H2O2) concentration. In this case, the reaction mixture contained 1.9 mL of 50 mM K3PO4, buffered at a pH of 7, 10 mM H2O2, and 0.2 mL of enzyme extract. Enzymatic activity was read in 60 s per milligram of protein based on absorption variations (Aebi, 1984). Superoxide dismutase (SOD) activity was measured at 560 nm to minimize the photochemical loss of nitroblue tetrazolium (NBT), as described by Beyer and Fridovich (1987). One unit of SOD was defined as the enzyme amount required to inhibit a 50% decrease in NBT.
Ascorbate peroxidase (APX) activity was determined using Nakano and Asada (1987) method. The reaction mixture comprised 1 mL of 0.5 mM ascorbic acid, 1 mL of 100 mM K3PO4 buffer at pH 7, 100 μL enzyme extract, and 0.1 mL of 0.1 mM H2O2. The absorbance of the reaction mixture was measured at 290 nm.
Oil content and oil yield
Dried seeds were ground into a fine powder to extract safflower oil content following the method outlined by the American Oil Chemists’ Society (AOCS, 1993). Briefly, 5 g of seeds was subjected to a 6-h extraction using 300 mL n-hexane in a Soxhlet extractor. Subsequently, the solvent was removed from the oil content using a rotavapor (Heidolph, Schwabach, Germany). The resulting oil content was collected in a dedicated glass container to facilitate further compound isolation and identification (Zamani et al., 2022).
Seed oil content and oil yield were determined as follows (Taghizadeh et al., 2023):
Fatty acids were converted into fatty acid methyl esters (FAMEs) to enhance their volatility for GC-FID analysis by mixing 0.1 g oil with 1.5 mL hexane and 0.2 mL of 2 N methanolic KOH. The mixture was vortexed for 5 s and then centrifuged at 2,500 rpm for 1 min. The upper layer containing the FAMEs was carefully separated and stored at 4°C for further analysis. GC-FID analysis was performed using an Agilent 6890 N GC instrument (Wilmington, DE, USA) with an FID detector. FAME separations were conducted on an HP-88 capillary column (88% cyanopropyl aryl-polysiloxane, 100 m length, 0.25 mm inner diameter, 0.2 μm film thickness) (Agilent) as follows: initial hold at 140°C for 5 min, followed by ramping of 4°C/min to 240°C, and a final hold at 240°C for 15 min. Nitrogen was the carrier gas at a 1.0 mL min−1 flowrate. The injection port and detector temperatures were set at 260°C and 280°C, respectively. The injector was operated in split mode with a 1:30 split ratio. Data acquisition and processing were performed using ChemStation software. To identify fatty acids, a commercially available FAME mixture (Supelco 37 Component FAME Mix, Bellefonte, PA, USA) was used as a reference standard (Fotohi Chiyaneh et al., 2022; Zamani et al., 2022).
Data analysis
The collected data were subjected to statistical analysis using SAS 9.1 software. The analysis considered cropping patterns, stress modulators, and their interaction as fixed effects, with the block effect considered random. Duncan’s multiple range test assessed significant differences among treatments at a significance level of p< 0.05.
Results
Safflower
The intercropping ratio of safflower (IRs) significantly affected all measured parameters of safflower, except for capitol number. The SM sprays also significantly affected all parameters except for capitol number. Significant IR × SM interactions occurred for several parameters, including plant height, branch number, seed number per capsule, 1,000-seed weight, biological yield, seed yield, chlorophyll a, chlorophyll b, carotenoids, proline, total soluble sugars, CAT activity, APX activity, seed oil content, and seed oil yield (Tables 2A, B).
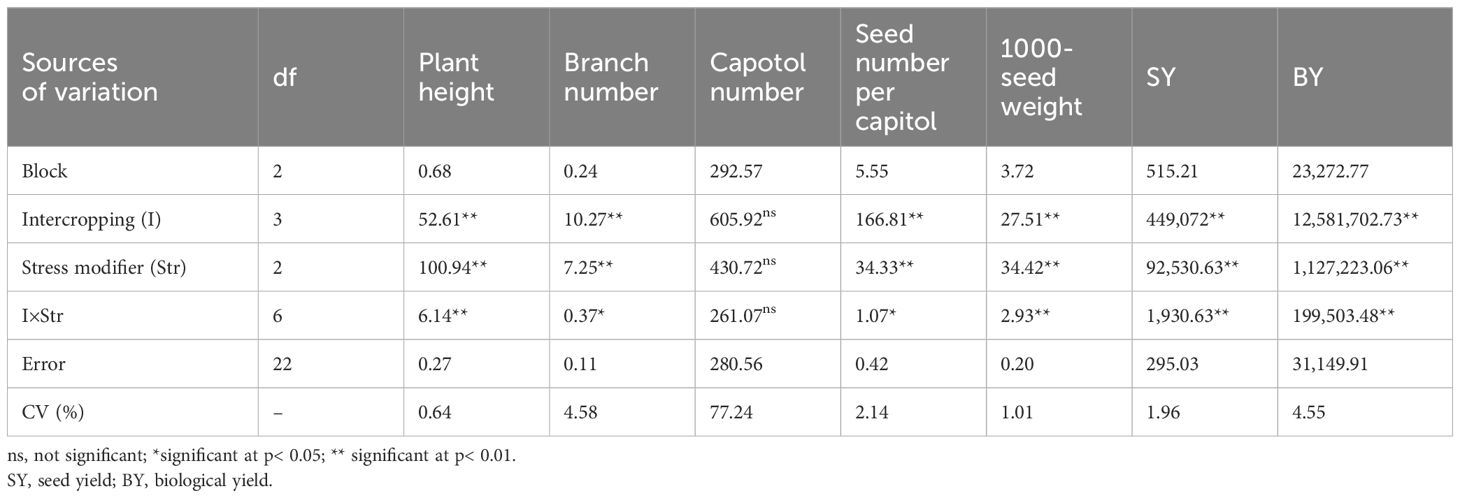
Table 2A Analysis of variance for the effect of cropping pattern and stress modulator biostimulant on evaluated traits in safflower.

Table 2B Analysis of variance for the effect of cropping pattern and stress modulator biostimulant on evaluated traits in safflower.
Plant height. Sole cropping of safflower treated with Se produced the tallest plants, averaging 86.13 cm, while 1S:2C without SM produced the shortest plants (75.76 cm) (Figure 1A). Regardless of SM treatment, 1S:2C, 2S:4C, and 3S:5C decreased safflower plant height by 6.74%, 4.88%, and 3.17%, respectively, compared to sole cropping of safflower (Ss). Across all IRs, the SA and Se treatments increased plant height by 4.94% and 6.58%, respectively, compared to the controls (Figure 1A).
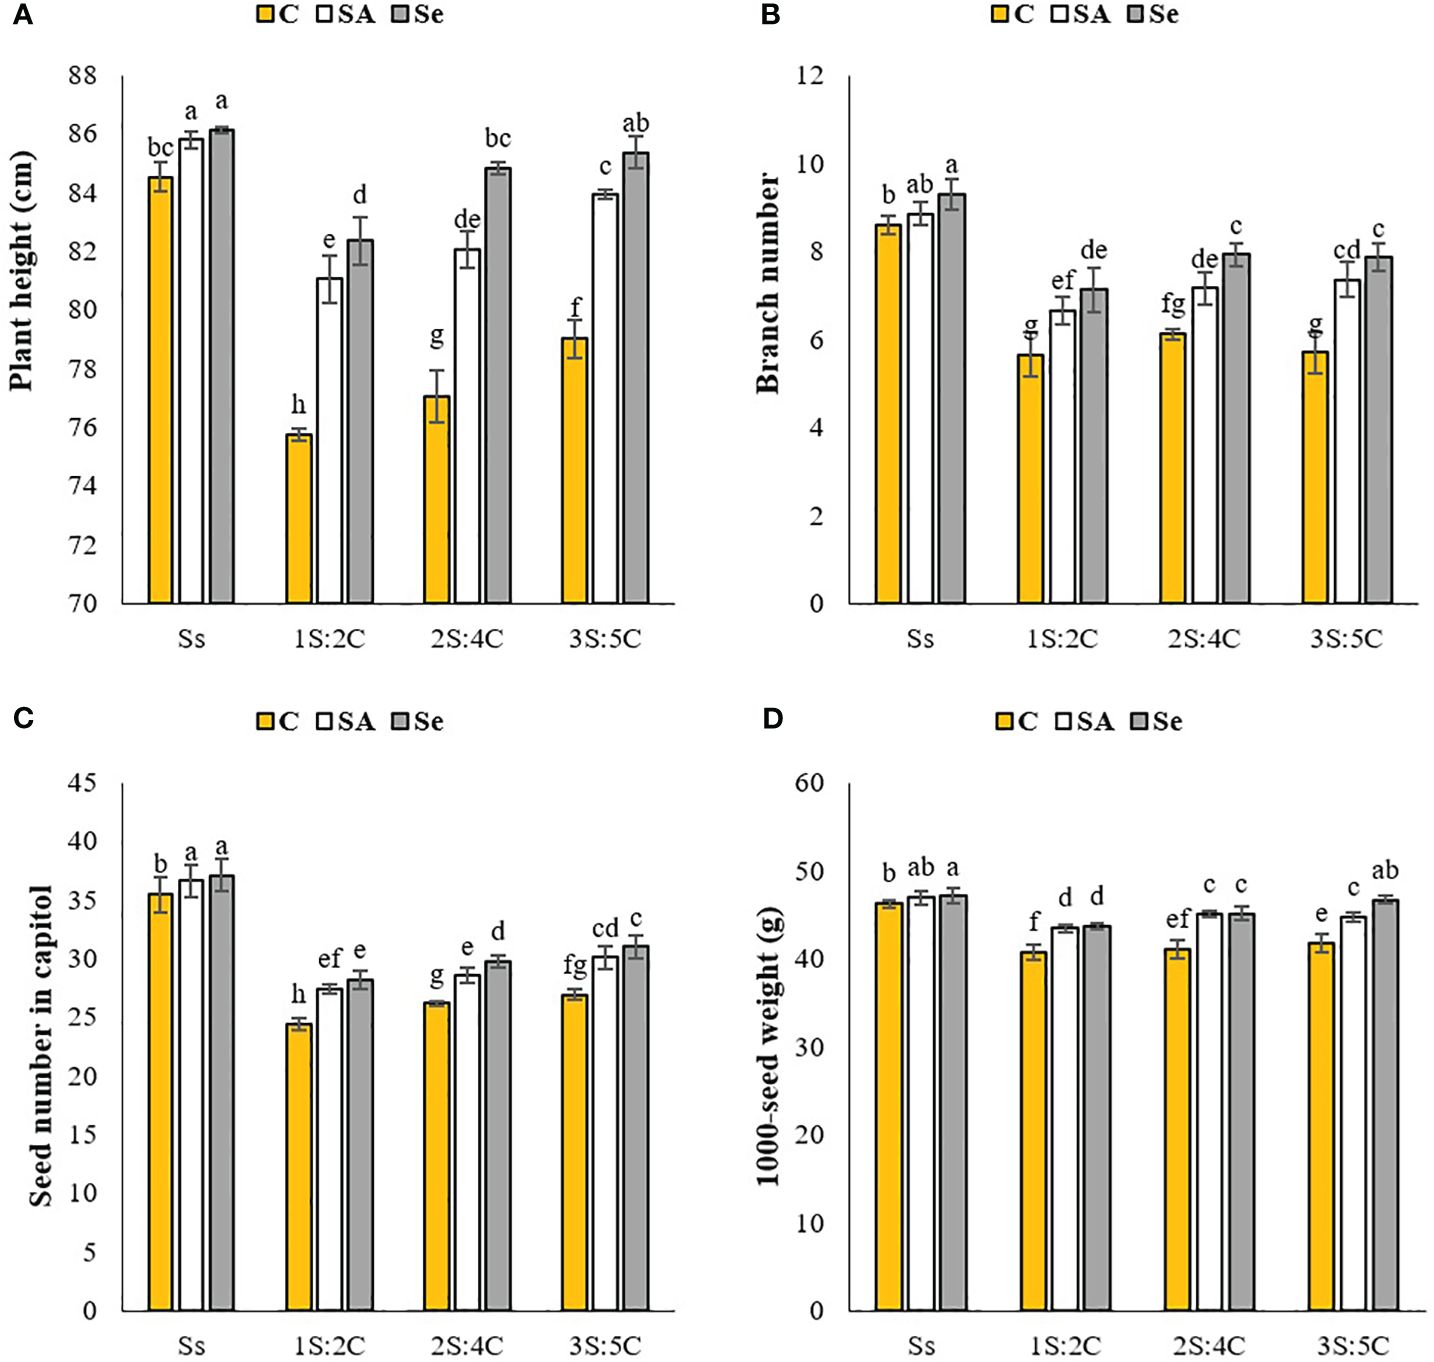
Figure 1 Means comparison for the interaction effect of stress modifier biostimulant (C, control; SA, salicylic acid; Se, selenium) and cropping pattern (Ss, safflower sole cropping; 1S:2C, 2S:4C, and 3S:5C, ratios of safflower and chickpea in the intercropping pattern) on plant height (A), branch number (B), seed number (C), and 1000-seed weight (D) of safflower. Lowercase letters above the bars indicate significant (p ≤ 0.05) differences.
Branch number. Sole-cropped safflower treated with Se produced the most branches (9.30), while 1S:2C without SM produced the fewest (5.66). The branch number in 1S:2C did not significantly differ from that in 3S:5C (Figure 1B). Regardless of SM treatment, 1S:2C, 2S:4C, and 3S:5C decreased branch numbers by 27.32%, 20.70%, and 21.82%, respectively, compared to sole cropping (Ss). Across all IRs, foliar application of SA and Se increased branch number by 13.14% and 19.02%, respectively, compared to the controls (Figure 1B).
Seed number per capsule. Sole-cropped safflower treated with Se or SA produced the most seeds per capitol (37.13), while 1S:2C without SM produced the fewest (24.46) (Figure 1C). Regardless of SM treatment, 1S:2C, 2S:4C, and 3S:5C decreased seed number per capitol by 26.67%, 22.61%, and 19.35%, respectively, compared to sole cropping (Ss). However, across all IRs, the SA and Se applications increased seed number per capitol by 7.86% and 10.33%, respectively, compared to the controls (Figure 1C).
1,000-seed weight. Sole-cropped safflower treated with Se produced the highest 1,000-seed weight (47.13 g), while 1S:2C without SM produced the lowest (40.76 g) (Figure 1D). Regardless of SM treatment, 1S:2C, 2S:4C, and 3S:5C decreased 1,000-seed weight by 8.86%, 6.43%, and 5.08%, respectively, compared to sole cropping (Ss). Across all IRs, the SA and Se applications increased 1,000-seed weight by 5.75% and 6.96%, respectively, compared to the controls (Figure 1D).
Biological yield. Sole-cropped safflower treated with Se produced the highest biological yield (4,905.50 kg ha−1), while 1S:2C without SM produced the lowest (1,871.50 kg ha−1) (Figure 2A). Regardless of SM treatment, 1S:2C, 2S:4C, and 3S:5C decreased biological yield by 55.34%, 5.54%, and 10.48%, respectively, compared to sole cropping (Ss). Across all IRs, foliar application of SA and Se increased biological yield by 12.65% and 13.48%, respectively, compared to the controls (Figure 2A).
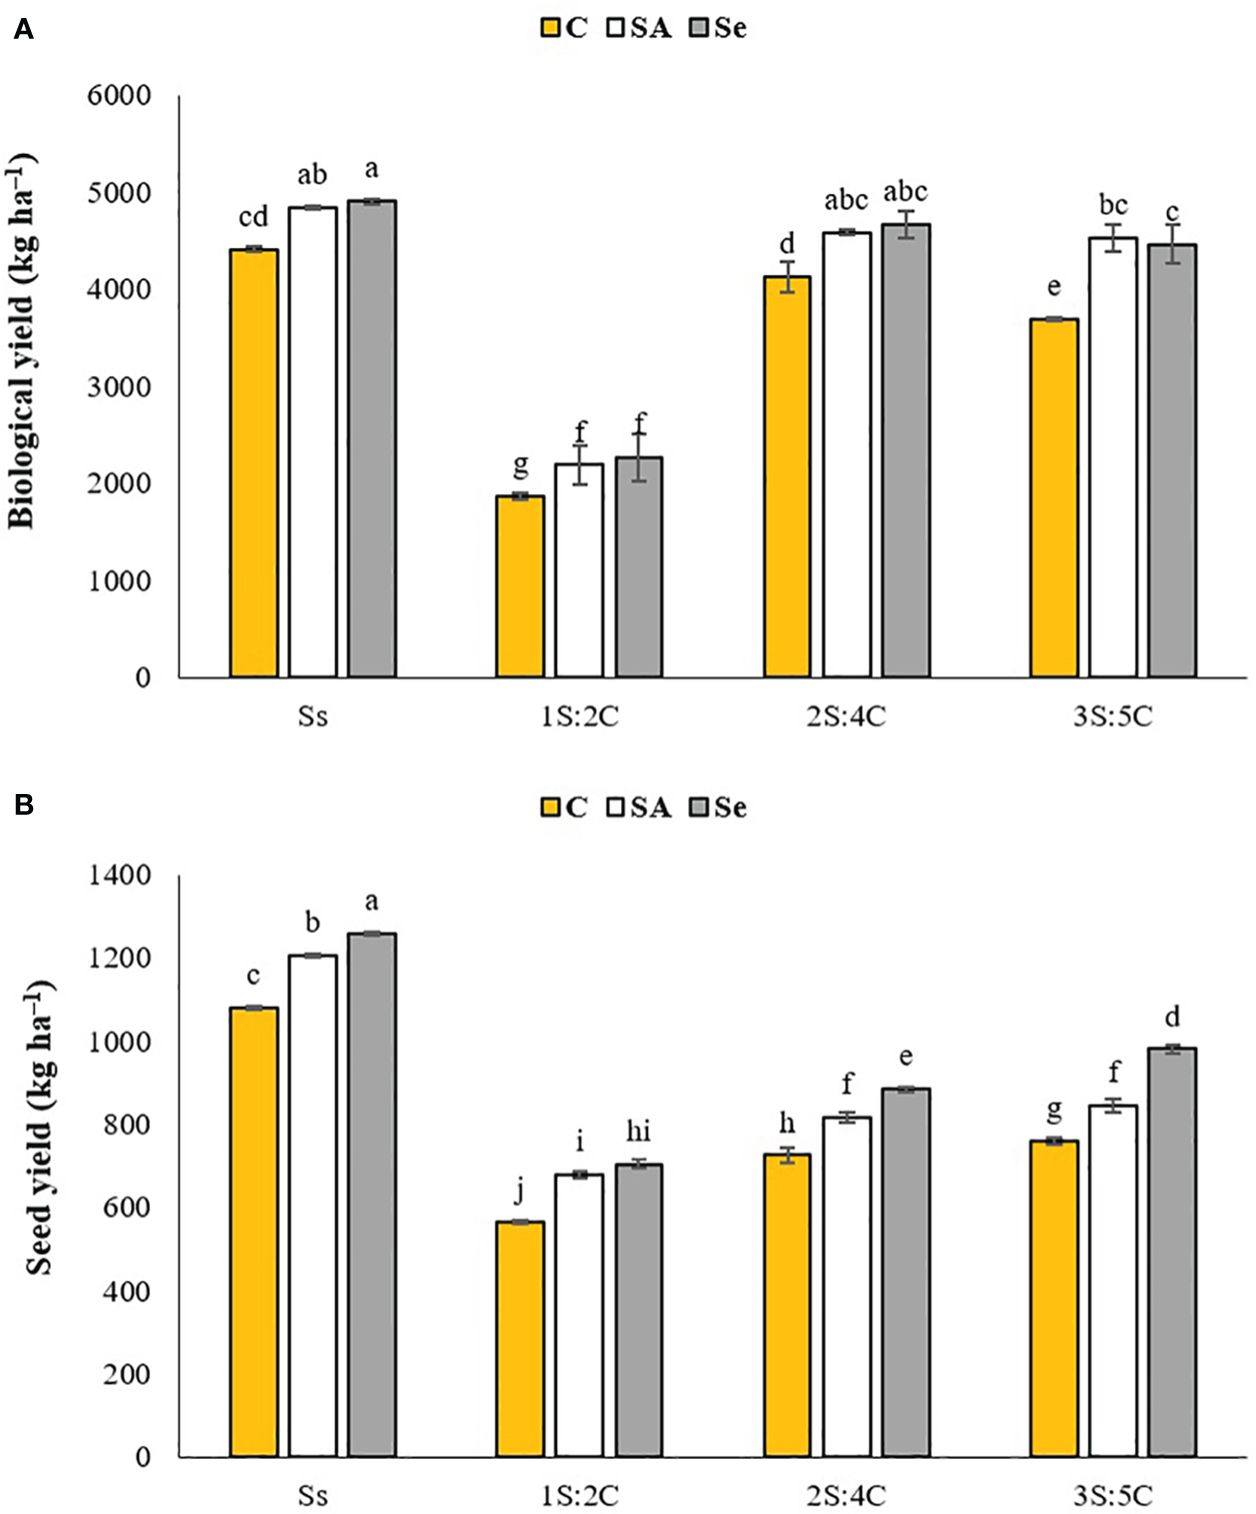
Figure 2 Means comparison for the mean effect of stress modifier biostimulant (C, control; SA, salicylic acid; Se, selenium) and cropping pattern (Ss, safflower sole cropping; 1S:2C, 2S:4C, and 3S:5C, ratios of safflower and chickpea in the intercropping pattern) on biological (A) and seed (B) yields of safflower. Lowercase letters above the bars indicate significant (p ≤ 0.05) differences. kg ha–1.
Seed yield. Sole-cropped safflower treated with Se produced the highest seed yield (1,259.50 kg ha−1), while 1S:2C without SM produced the lowest (565 kg ha−1) (Figure 2B). Regardless of SM treatment, 1S:2C, 2S:4C, and 3S:5C decreased seed yield by 45.05%, 31.56%, and 27.05%, respectively, compared to sole cropping (Ss). Across all IRs, foliar application of SA and Se increased seed yield by 11.74% and 18.23%, respectively, compared to the controls (Figure 2B).
Chlorophyll a content. The IR of 2S:4C treated with Se produced the highest chlorophyll a content (2.49 mg g FW−1), which did not significantly differ from 2S:4C. In contrast, sole cropping without SM produced the lowest (1.58 mg g FW−1), which did not significantly differ from 1S:2C, 2S:4C, and 3S:5C without SM or sole cropping treated with Se or SA (Figure 3A). Regardless of SM treatment, 1S:2C, 2S:4C, and 3S:5C increased safflower chlorophyll a content by 18.69%, 20.55%, and 21.45%, respectively, compared to sole cropping (Ss). Across all IRs, foliar application of SA and Se increased safflower chlorophyll a content by 13.18% and 25.11%, respectively, compared to the controls (Figure 3A).
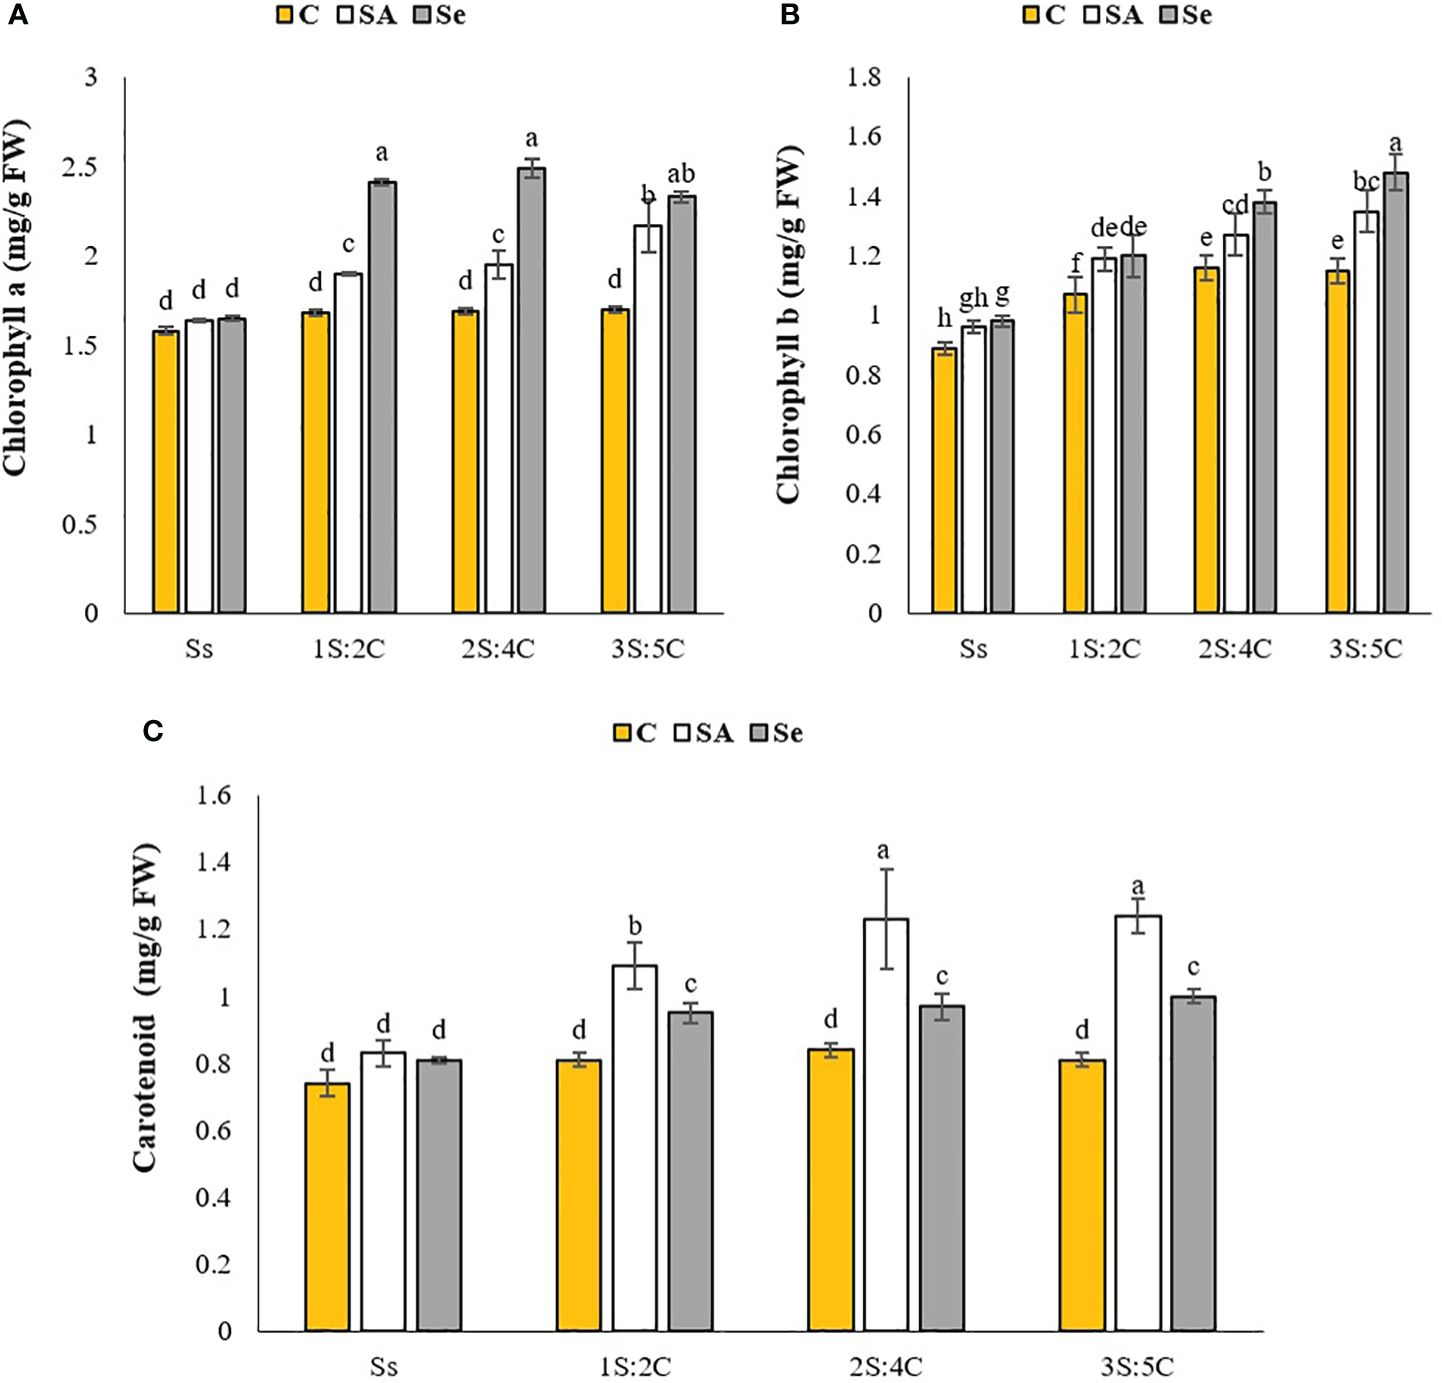
Figure 3 Means comparison for the interaction effect of stress modifier biostimulant (C, control; SA, salicylic acid; Se, selenium) and cropping pattern (Ss, safflower sole cropping; 1S:2C, 2S:4C, and 3S:5C, ratios of safflower and chickpea in the intercropping pattern) on chlorophyll a (A), chlorophyll b (B), and carotenoid (C) contents of safflower. Lowercase letters above the bars indicate significant (p ≤ 0.05) differences.
Chlorophyll b content. The IR of 3S:5C treated with Se produced the highest chlorophyll b content (1.48 mg g FW−1), while sole cropping without SM produced the lowest (0.89 mg g FW−1) (Figure 3B). Regardless of SM treatment, 1S:2C, 2S:4C, and 3S:5C increased safflower chlorophyll b content by 18.20%, 25.72%, and 28.89%, respectively, compared to sole cropping (Ss). Across all IRs, foliar application of SA and Se increased safflower chlorophyll b content by 10.48% and 15.27%, respectively, compared to the controls (Figure 3B).
Carotenoid content. The IR of 3S:5C treated with SA produced the highest safflower carotenoid content (1.24 mg g FW−1), statistically similar to 2S:4C, while sole cropping without SM produced the lowest (0.74 mg g FW−1), statistically similar to 1S:2C, 2S:4C, and 3S:5Cwithout SM and sole cropping with Se and SA application (Figure 3C). Regardless of SM treatment, 1S:2C, 2S:4C, and 3S:5C increased safflower carotenoid content by 16.49%, 21.71%, and 21.96%, respectively, compared to sole cropping (Ss). Across all IRs, foliar application of SA and Se increased safflower carotenoid content by 27.10% and 14.20%, respectively, compared to the controls (Figure 3C).
Proline content. The IR of 1S:2C treated with SA produced the highest safflower proline content (2.86 μmol g FW−1), while sole cropping without SM produced the lowest proline (1.70 μmol g FW−1). This value did not significantly differ from the other IR treatments without SM or sole cropping treated with Se or SA (Figure 4A). Regardless of SM treatment, 1S:2C, 2S:4C, and 3S:5C increased safflower proline content by 25.38%, 12.64%, and 16.74%, respectively, compared to sole cropping (Ss). Across all IRs, foliar application of SA and Se increased safflower proline content by 23.06% and 15.04%, respectively, compared to the controls (Figure 4A).
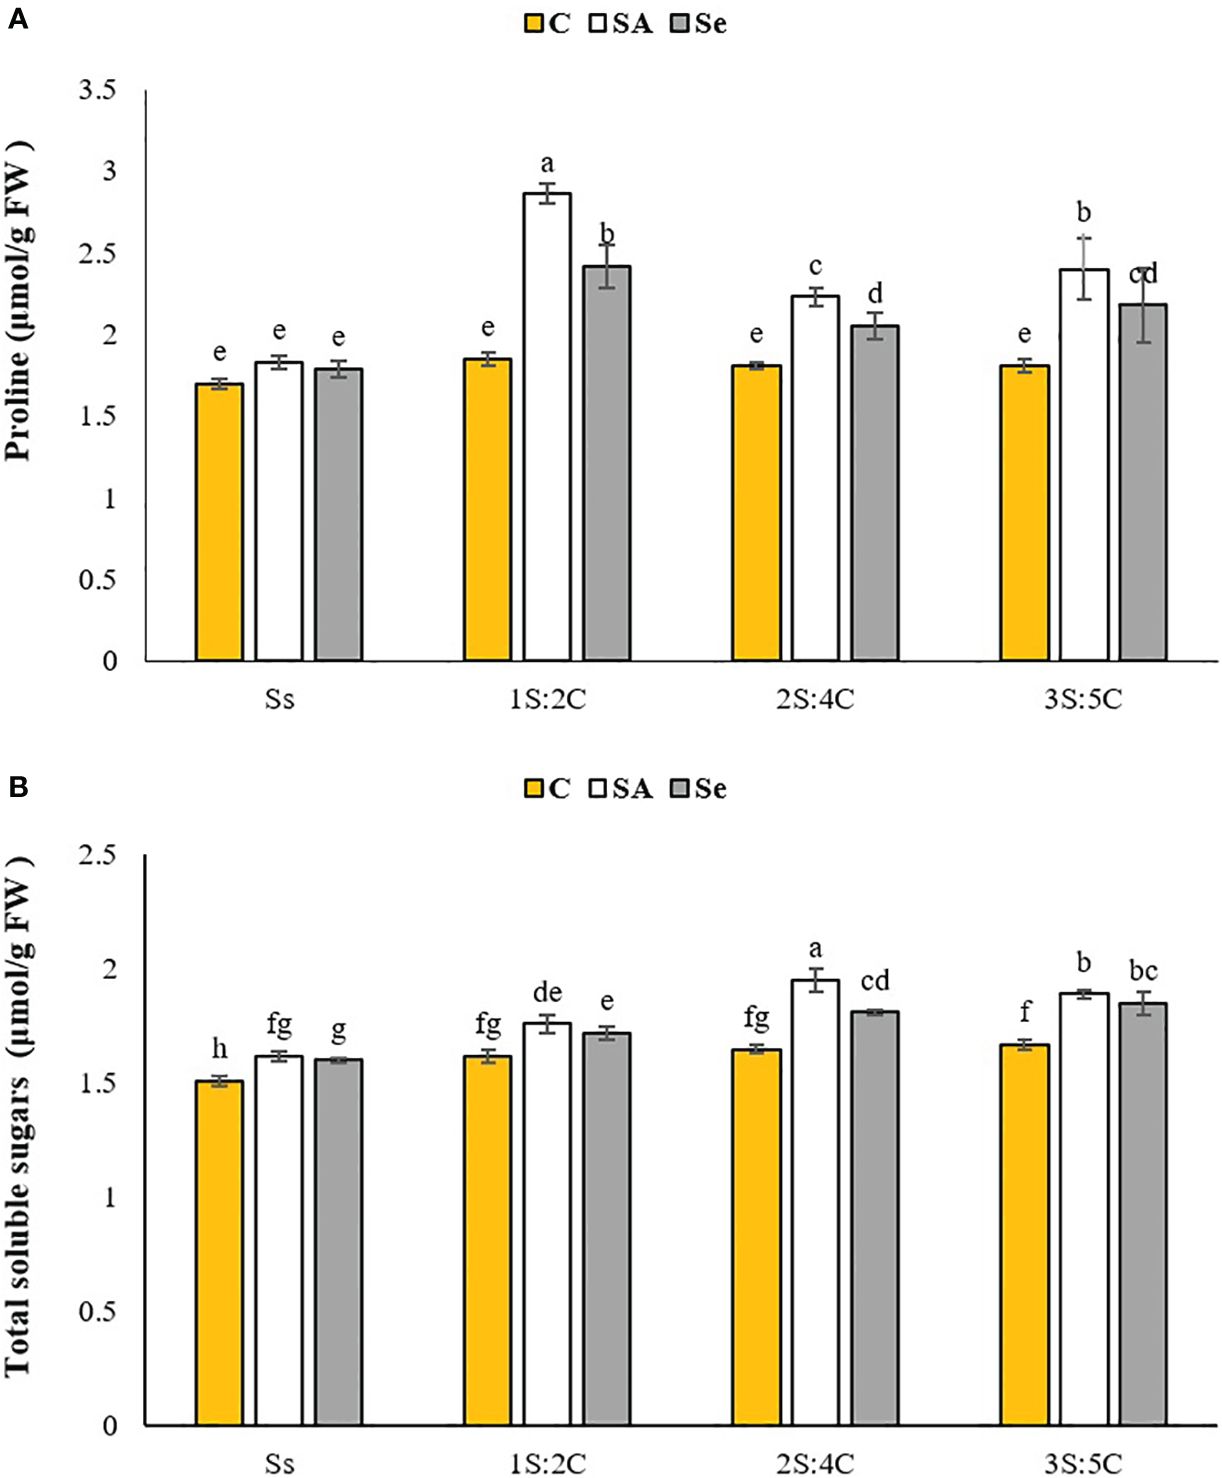
Figure 4 Means comparison for the interaction effect of stress modifier biostimulant (C, control; SA, salicylic acid; Se, selenium) and cropping pattern (Ss, safflower sole cropping; 1S:2C, 2S:4C, and 3S:5C, ratios of safflower and chickpea in the intercropping pattern) on proline (A), and total soluble sugar (B) contents of safflower. Lowercase letters above the bars indicate significant (p ≤ 0.05) differences.
Total soluble sugar content. The IR of 2S:4C treated with SA produced the highest total soluble sugar content in safflower (1.95 μmol g FW−1), while sole cropping without SM produced the lowest (1.51 μmol g FW−1) (Figure 4B). Regardless of SM treatment, 1S:2C, 2S:4C, and 3S:5C increased safflower total soluble sugar content by 7.25%, 12.56%, and 12.56%, respectively, compared to sole cropping (Ss). Across all IRs, foliar application of SA and Se increased safflower total soluble sugar content by 36.11% and 39.39%, respectively, compared to the controls (Figure 4B).
CAT activity. The IR of 2S:4C treated with SA produced the highest CAT activity in safflower (1.96 unit mg protein FW−1), while sole cropping without SM had the lowest (1.17 unit mg protein FW−1) (Figure 5A). Regardless of SM treatment, 1S:2C, 2S:4C, and 3S:5C increased safflower CAT activity by 21.18%, 27.34%, and 27.48%, respectively, compared to sole cropping (Ss). Across all IRs, foliar application of SA and Se increased safflower CAT activity by 23.06% and 19.78%, respectively, compared to the controls (Figure 5A).
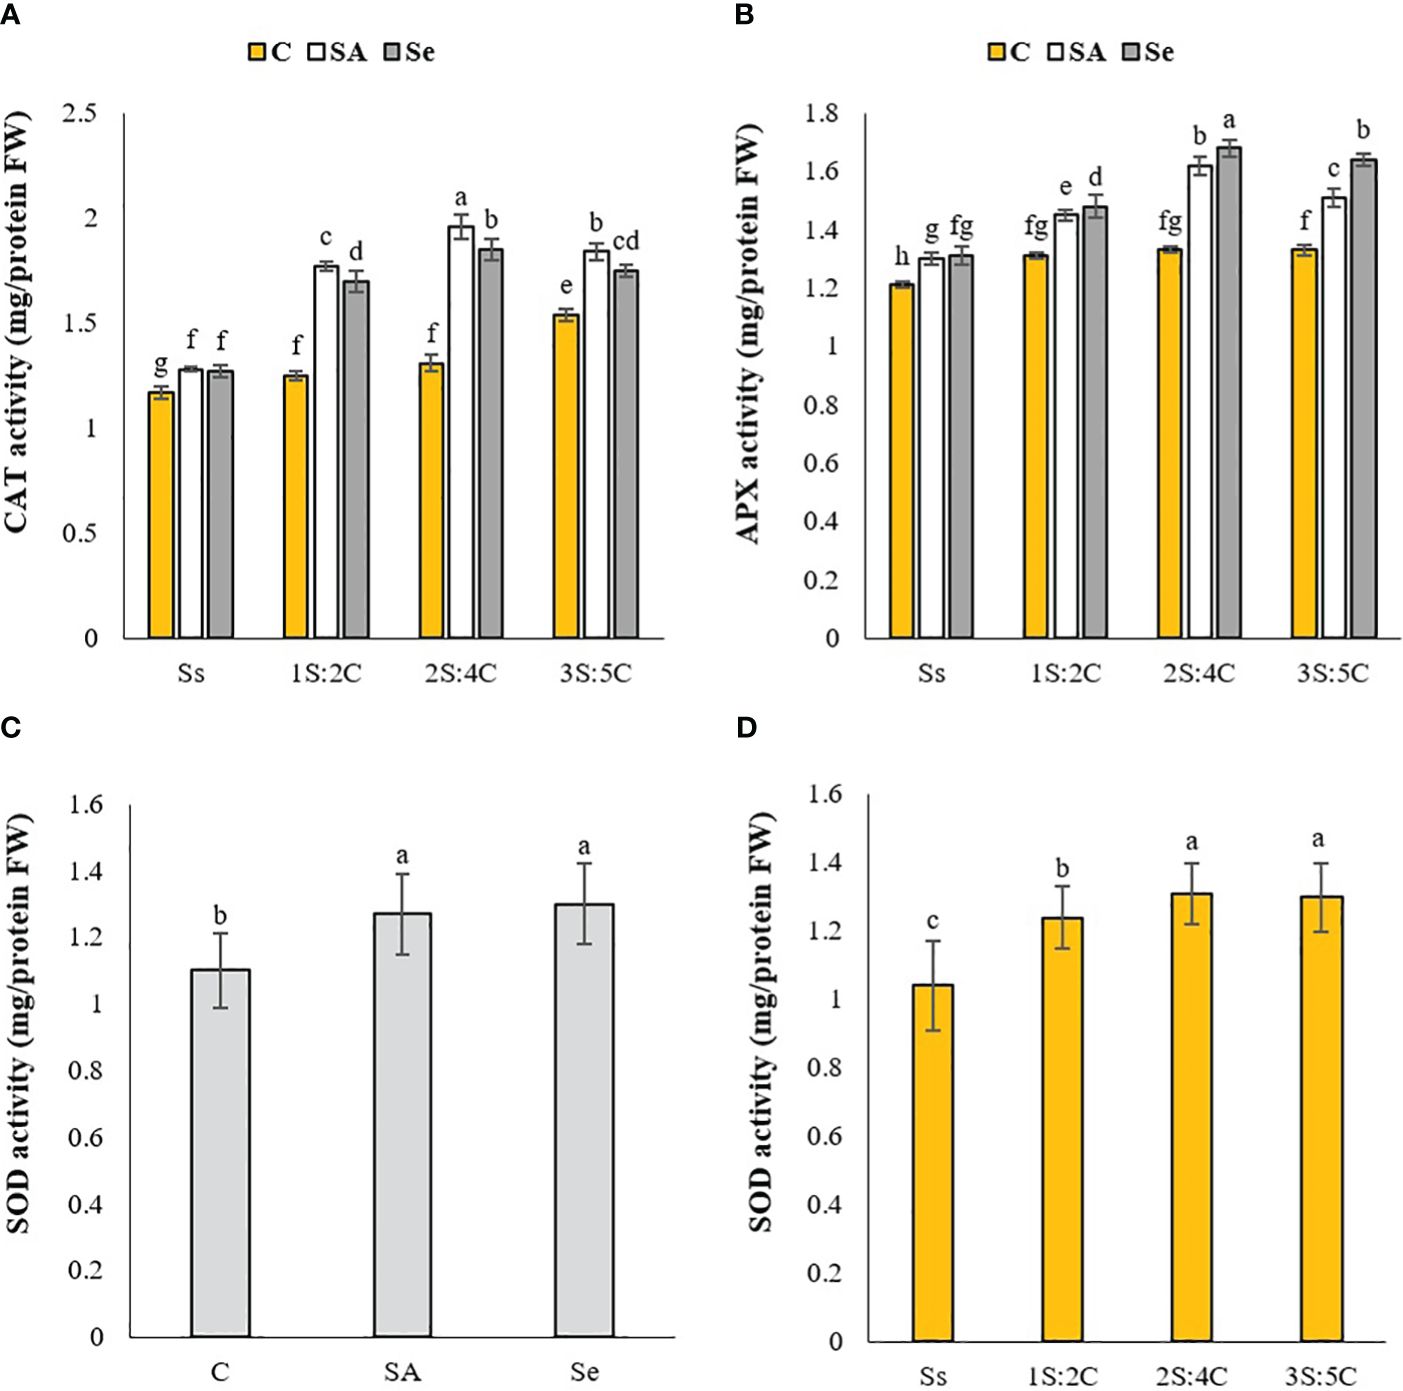
Figure 5 Means comparison for the effect of stress modifier biostimulant (C, control; SA, salicylic acid; Se, selenium) and cropping pattern (Ss, safflower sole cropping; 1S:2C, 2S:4C, and 3S:5C, ratios of safflower and chickpea in the intercropping pattern) on CAT (A), APX (B), and SOD (C, D) activities of safflower. Lowercase letters above the bars indicate significant (p ≤ 0.05) differences.
APX activity. The IR of 2S:4C treated with Se produced the highest APX activity in safflower (1.64 unit mg protein FW−1), while sole cropping without SM produced the lowest (1.21 unit mg protein FW−1) (Figure 5B). Regardless of SM treatment, 1S:2C, 2S:4C, and 3S:5C increased safflower APX activity by 9.91%, 17.49%, and 14.73%, respectively, compared to sole cropping (Ss). Across all IRs, foliar application of SA and Se increased safflower APX activity by 11.90% and 15.22%, respectively, compared to the controls (Figure 5B).
SOD activity. The IR of 2S:4C produced the highest SOD activity (1.31 unit mg protein FW−1), while sole cropping produced the lowest (1.04 unit mg protein FW−1) (Figure 5C). Regardless of SM treatment, 1S:2C, 2S:4C, and 3S:5C increased SOD activity by 16%, 20.61%, and 20%, respectively, compared to sole cropping (Ss). Across all IRs, the foliar application of Se increased SOD activity by 15%, which did not significantly differ from SA application compared to the controls (Figure 5D).
Oil content. The IR of 3S:5C treated with Se produced the highest safflower oil content (32.08%), which did not significantly differ from 2S:4C, while sole cropping without SM produced the lowest (28.28%). The oil content of the 1S:2C, 2S:4C, and 3S:5C treatments without SM and sole cropping with SM did not significantly differ (Figure 6A). Regardless of SM treatment, 1S:2C, 2S:4C, and 3S:5C increased safflower oil content by 2.23%, 5.92%, and 6.76%, respectively, compared to sole cropping (Ss). Across all IRs, foliar application of SA and Se increased safflower oil content by 4.09% and 6.23%, respectively, compared to the controls (Figure 6A).
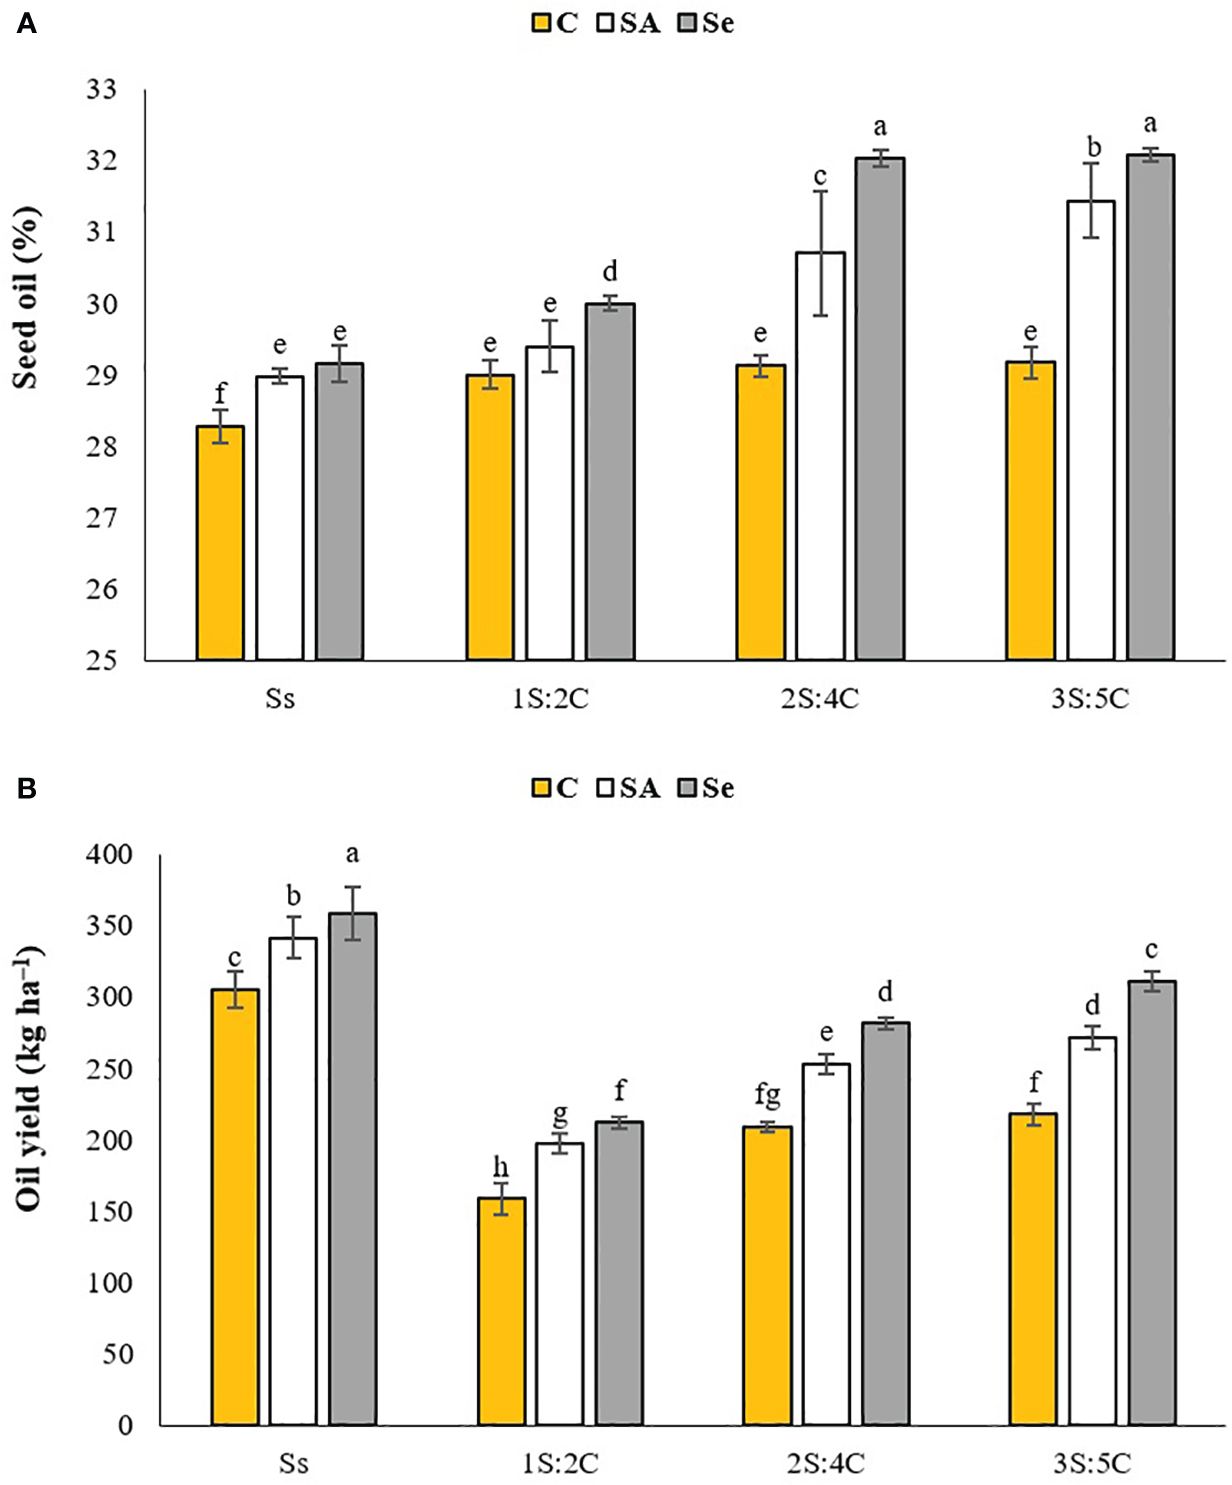
Figure 6 Means comparison for the interaction effect of stress modifier biostimulant (C, control; SA, salicylic acid; Se, selenium) and cropping pattern (Ss, safflower sole cropping; 1S:2C, 2S:4C, and 3S:5C, ratios of safflower and chickpea in the intercropping pattern) on seed oil content (A) and oil yield (B) of safflower. Lowercase letters above the bars indicate significant (p ≤ 0.05) differences.
Oil yield. Sole cropping treated with Se produced the highest safflower oil yield (358.62 kg ha−1), while 1S:2C without SM produced the lowest (158.58 kg ha−1) (Figure 6B). Regardless of SM treatment, 1S:2C, 2S:4C, and 3S:5C decreased safflower oil yield by 43.55%, 26.08%, and 20.38%, respectively, compared to sole cropping (Ss). Across all IRs, foliar application of SA and Se increased safflower oil yield by 5.77% and 7.70%, respectively, compared to the controls (Figure 6B).
Oil fatty acid composition. The major fatty acid constituents in safflower oil were linoleic acid (50.23%–61.08%), oleic acid (10.11%–15.24%), stearic acid (8.76%–12.95%), and palmitic acid (8.06%–16.99%). The IR of 2S:4C treated with Se produced the most linoleic acid (61.09%) and oleic acid (15.25%), while sole cropping without SM produced the least. Sole cropping treated with Se produced the most stearic acid (12.95%), while sole cropping with SA produced the most palmitic acid (16.99%). The IR of 3S:5C without SM produced the least stearic and palmitic acids (8.76% and 8.06%, respectively). Across all IRs, foliar application of SA and Se increased the contents of oleic acid by 10.63% and 18.20%, linoleic acid by 4.52% and 6.65%, stearic acid by 14.99% and 19.03%, and palmitic acid by 13.50% and 15.40%, respectively (Table 3).
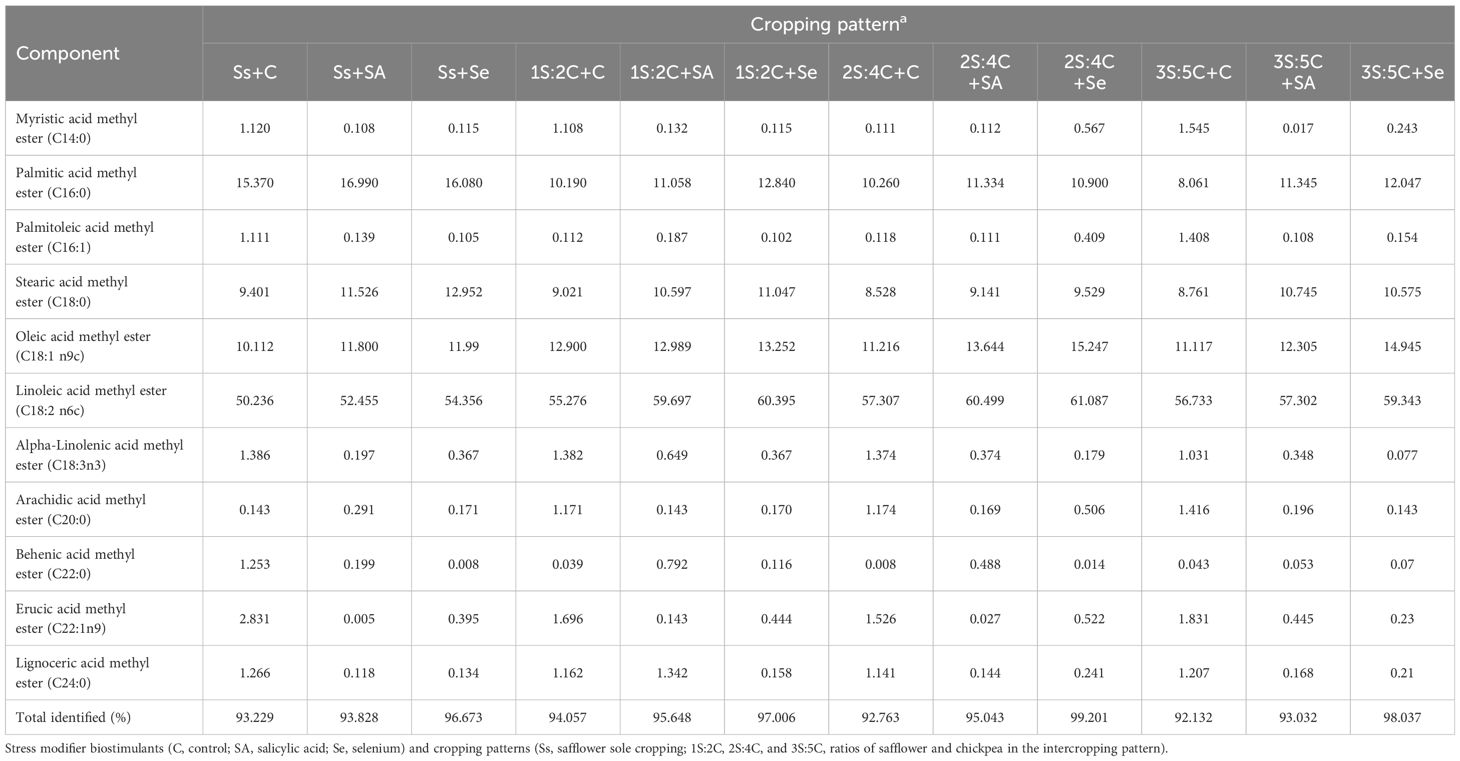
Table 3 Composition of safflower oil fatty acids in different cropping patterns and stress modifier applications under rainfed conditions.
Chickpea
The IR and SM treatments significantly affected all measured parameters in chickpea. Significant IR × SM interactions were observed for plant height, 1,000-seed weight, chlorophyll a, chlorophyll b, carotenoids, proline, total soluble sugars, CAT activity, APX activity, and SOD activity (Tables 4A, B).

Table 4A Analysis of variance for the effect of cropping patterns and stress modulator biostimulants on evaluated traits in chickpea.

Table 4B Analysis of variance for the effect of cropping patterns and stress modulator biostimulants on evaluated traits in chickpea.
Plant height. The IR of 3S:5C treated with Se produced the tallest plants (33.93 cm), while 1S:2C without SM produced the shortest (24.33 cm) (Figure 7A). Regardless of SM treatment, 1S:2C, 2S:4C, and 3S:5C decreased chickpea plant height by 9.82%, 7.42%, and 6.09%, respectively, compared to sole cropping (Cs). Across all IRs, foliar application of SA and Se significantly increased plant height by 18.44% and 20.25%, respectively, compared to the controls (Figure 7A).
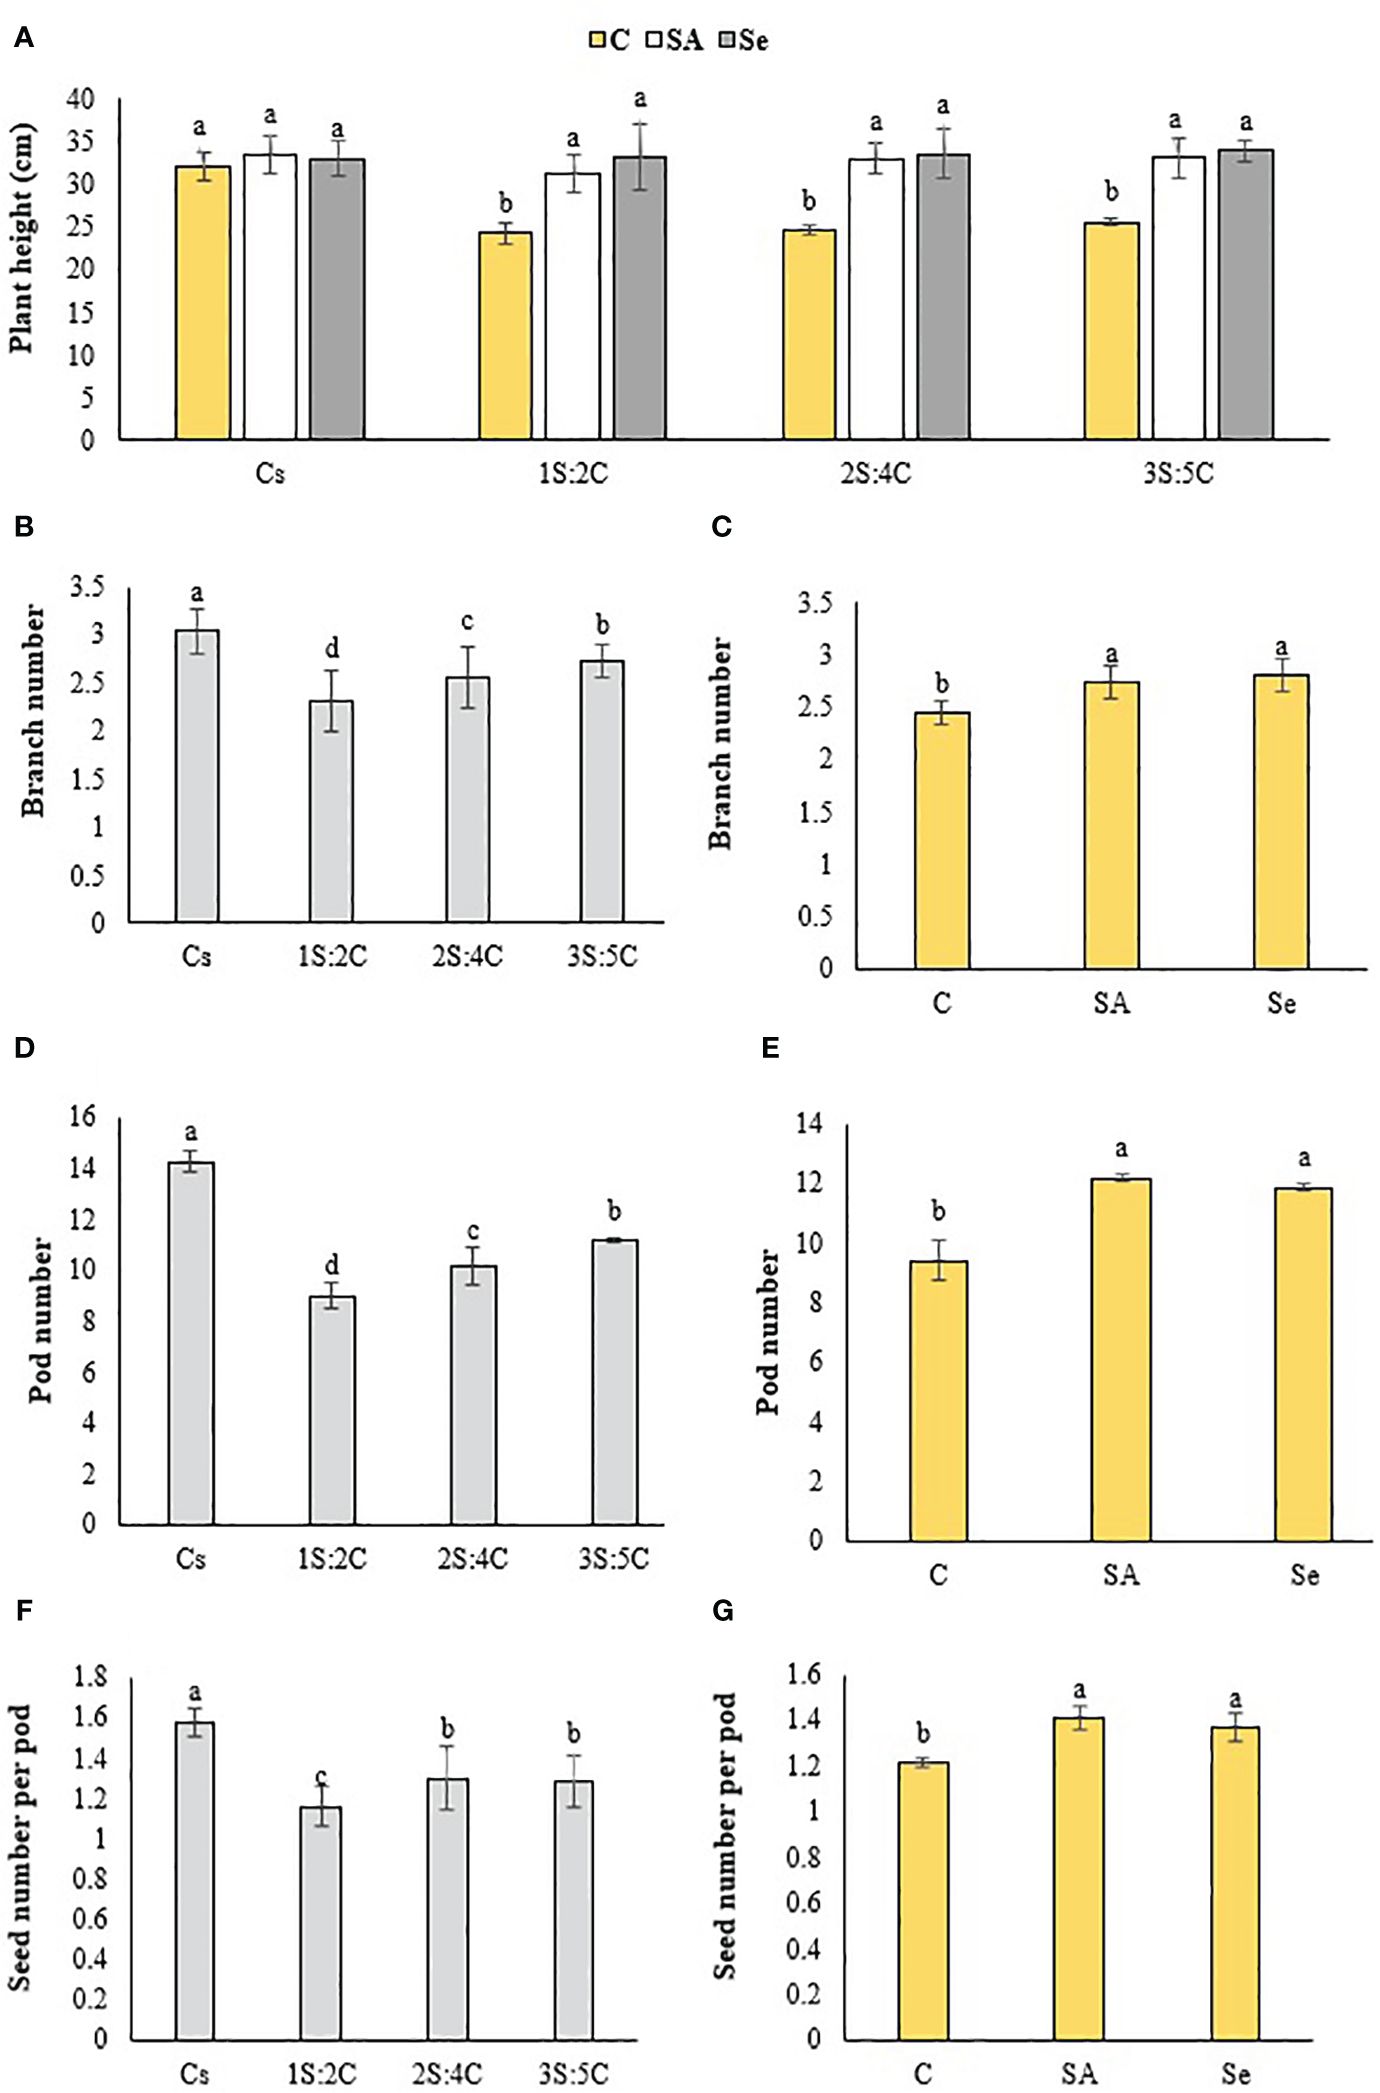
Figure 7 Means comparison for the effect of stress modifier biostimulant (C, control; SA, salicylic acid; Se, selenium) and cropping pattern (Cs, chickpea sole cropping; 1S:2C, 2S:4C, and 3S:5C, ratios of safflower and chickpea in the intercropping pattern) on plant height (A), branch number (B, C), pod number (D, E), and seed number per pod (F, G) of chickpea. Lowercase letters above the bars indicate significant (p ≤ 0.05) differences.
Branch number. Sole cropping produced the most chickpea branches (3.04), while 1S:2C produced the fewest (2.31) (Figure 7B). Regardless of SM treatment, 1S:2C, 2S:4C, and 3S:5C decreased chickpea branch numbers by 24.01%, 15.79%, and 10.20%, respectively, compared to sole cropping (Figure 7B). Across all IRs, the foliar Se application produced the most branches (2.80), which did not significantly differ from the SA application, while the control treatment produced the fewest (2.45) (Figure 7C).
Pod number. Sole cropping produced the most pods (14.27), while 1S:2C produced the fewest (8.98) (Figure 7D). Regardless of SM treatment, 1S:2C, 2S:4C, and 3S:5C decreased pod numbers by 37.07%, 28.52%, and 21.86%, respectively, compared to sole cropping (Figure 7D). Across all IRs, the foliar SA application produced the most pods (12.18), while the control produced the fewest (9.42) (Figure 7E).
Seed number per pod. Sole cropping produced the most seeds per pod (1.58), while 1S:2C produced the fewest (1.16) (Figure 7F). Regardless of SM treatment, 1S:2C, 2S:4C, and 3S:5C decreased seed number per pod by 26.58%, 17.72%, and 18.99%, respectively, compared to sole cropping (Figure 7F). Across all IRs, the foliar application of SA produced the most seeds per pod (1.41), which did not significantly differ from the Se treatment, while the control produced the fewest (1.21) (Figure 7G).
1,000-seed weight. Sole cropping treated with SA produced the highest 1,000-seed weight (36.23 g), while 1S:2C without SM produced the lowest (28.86 g) (Figure 8A). Regardless of SM treatment, 1S:2C, 2S:4C, and 3S:5C decreased 1,000-seed weight by 13.72%, 7.98%, and 5.72%, respectively, compared to sole cropping (Cs) (Figure 8A). Across all IRs, foliar application of SA and Se significantly increases 1,000-seed weight by 9.81% and 8.47%, respectively, compared to the controls (Figure 8A).
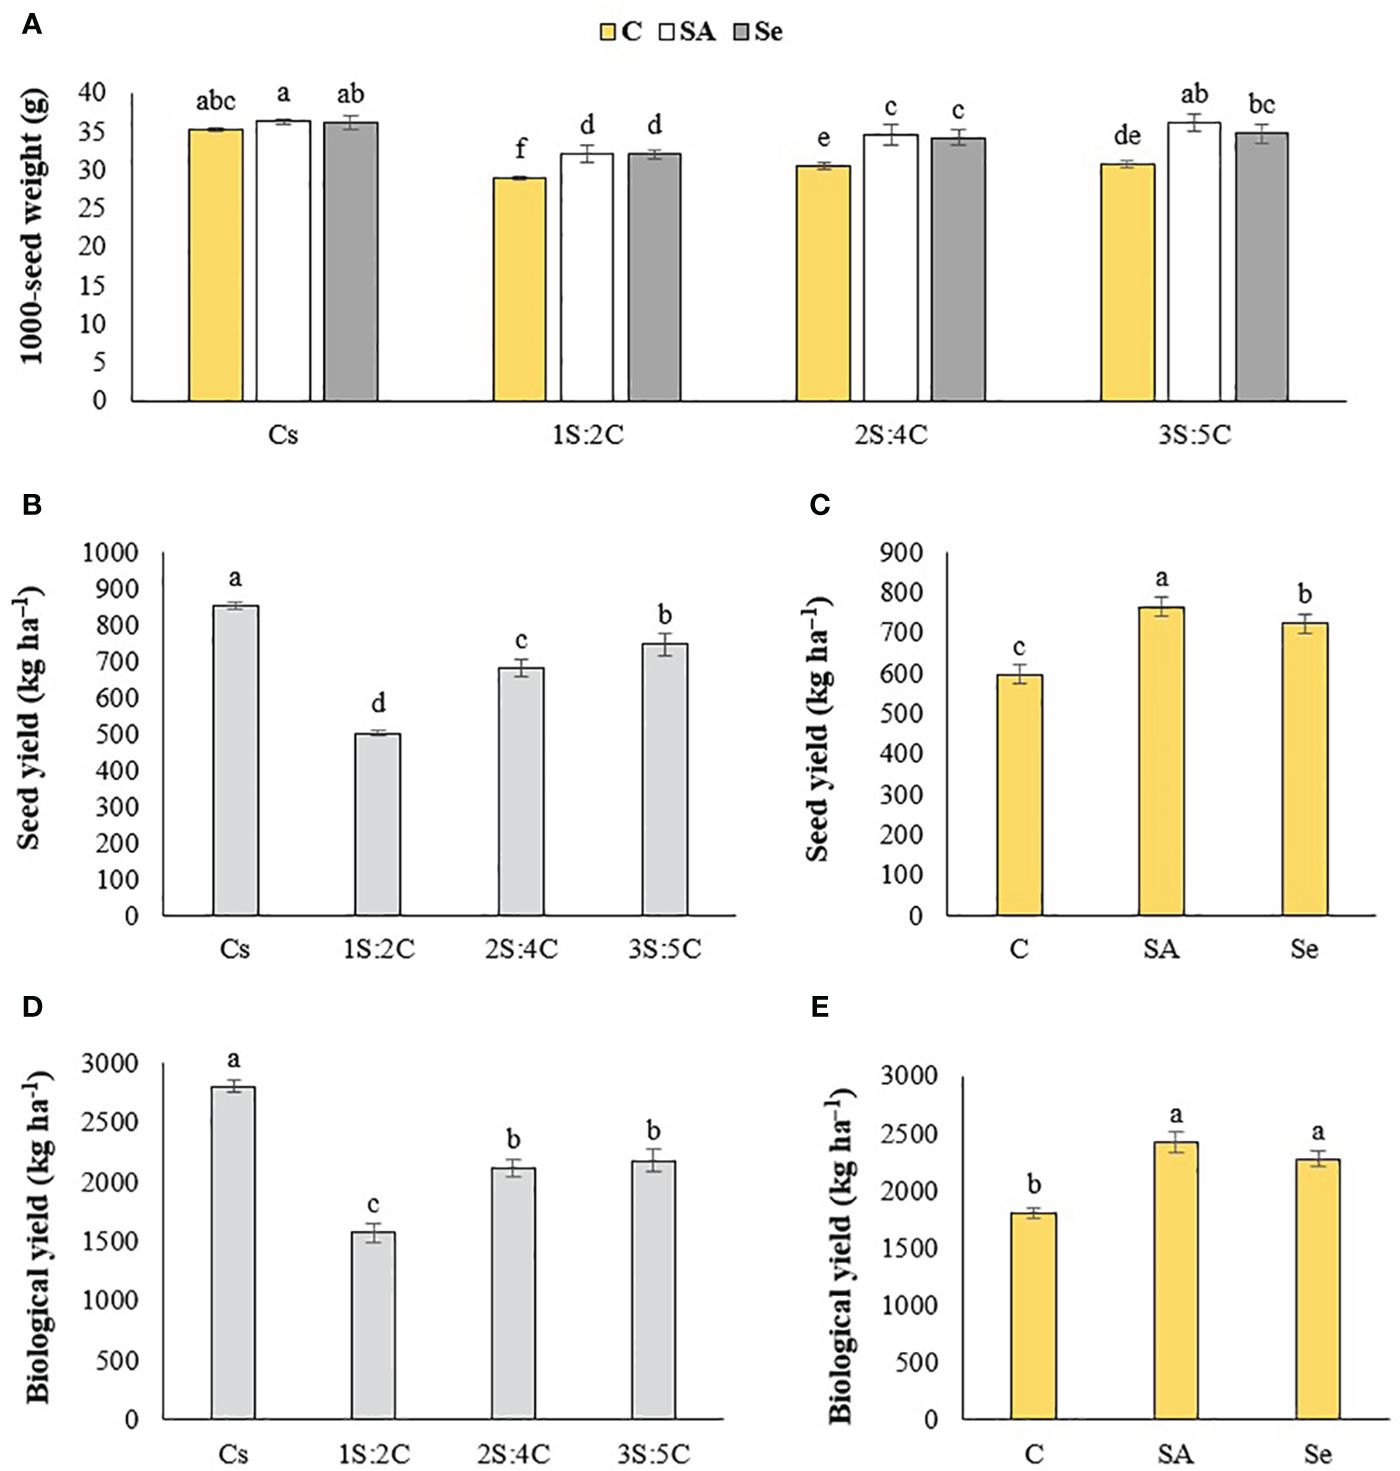
Figure 8 Means comparison for the effect of stress modifier biostimulant (C, control; SA, salicylic acid; Se, selenium) and cropping pattern (Cs, chickpea sole cropping; 1S:2C, 2S:4C, and 3S:5C, ratios of safflower and chickpea in the intercropping pattern) on 1000-seed weight (A), seed yield (B, C), and biological yield (D, E) of chickpea. Lowercase letters above the bars indicate significant (p ≤ 0.05) differences.
Seed yield. Sole cropping produced the highest chickpea seed yield (852.44 kg ha−1), while 1S:2C produced the lowest (501.56 kg ha−1) (Figure 8B). Regardless of SM treatment, 1S:2C, 2S:4C, and 3S:5C decreased seed yield by 41.16%, 20.32%, and 12.58%, respectively, compared to sole cropping (Figure 8B). Across all IRs, the foliar application of SA produced the highest seed yield (764.83 kg ha−1), while the control produced the lowest (596.92 kg ha−1) (Figure 8C).
Biological yield. Sole cropping produced the highest biological yield (2,799.67 kg ha−1), while 1S:2C produced the lowest (1,570.67 kg ha−1) (Figure 8E). The biological yield of 2S:4C and 3S:5C did not significantly differ (Figure 8D). Regardless of SM treatment, 1S:2C, 2S:4C, and 3S:5C decreased biological yield by 43.90%, 24.59%, and 22.12%, respectively, compared to sole cropping (Figure 8D). Across all IRs, the foliar application of SA produced the highest biological yield (2,419.25 kg ha−1), which did not differ significantly from the Se treatment (Figure 8E), while the control produced the lowest (1,802 kg ha−1) (Figure 8E).
Chlorophyll a content. The IR of 2S:4C treated with Se produced the highest chlorophyll a content (2.49 mg g FW−1), while sole cropping without SM produced the lowest (1.58 mg g FW−1) (Figure 9A). Regardless of SM treatment, 1S:2C, 2S:4C, and 3S:5C increased chlorophyll a content by 18.70%, 20.55%, and 21.45%, respectively, compared to sole cropping (Cs). Across all IRS, foliar application of SA and Se increased chlorophyll a content by 13.18% and 25.11%, respectively, compared to the controls (Figure 9A).
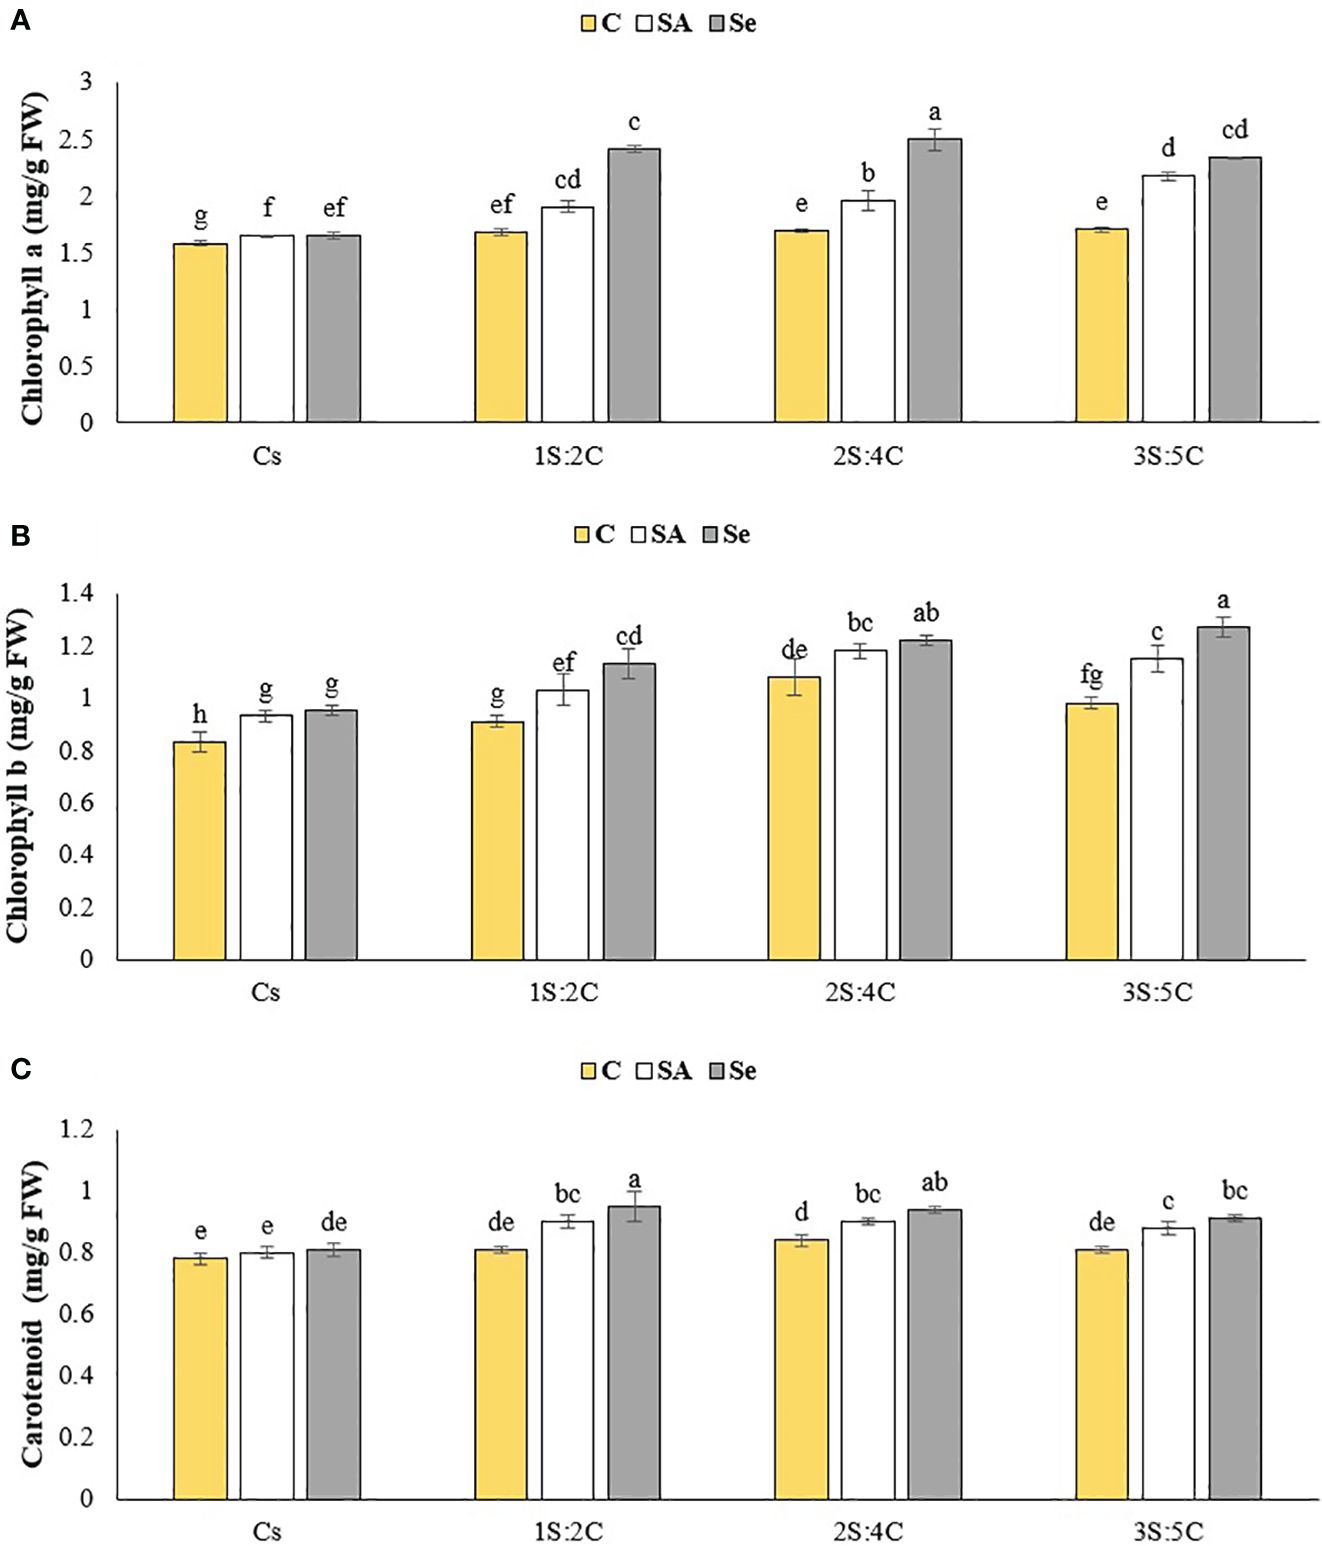
Figure 9 Means comparison for the effect of stress modifier biostimulant (C, control; SA, salicylic acid; Se, selenium) and cropping pattern (Cs, chickpea sole cropping; 1S:2C, 2S:4C, and 3S:5C, ratios of safflower and chickpea in the intercropping pattern) on chlorophyll a (A), chlorophyll a (B), and carotenoid (C) contents of chickpea. Lowercase letters above the bars indicate significant (p ≤ 0.05) differences.
Chlorophyll b content. The IR of 3S:5C treated with Se produced the highest chlorophyll b content (1.27 mg g FW−1), while sole cropping without SM produced the lowest (0.83 mg g FW−1) (Figure 9B). Regardless of SM treatment, 1S:2C, 2S:4C, and 3S:5C increased chlorophyll b content by 11.73%, 22.13%, and 20.29%, respectively, compared to sole cropping (Cs). Across all IRs, foliar application of SA and Se increased chlorophyll b content by 11.42% and 16.84%, respectively, compared to the controls (Figure 9B).
Carotenoid content. The IR of 1S:2C treated with Se produced the highest carotenoid content (0.95 mg g FW−1), while sole cropping without SM produced the lowest (0.78 mg g FW−1) (Figure 9C). Regardless of SM treatment, 1S:2C, 2S:4C, and 3S:5C increased carotenoid content by 10.15%, 10.82%, and 8.08%, respectively, compared to sole cropping (Cs). Across all IRs, foliar application of SA and Se increased carotenoid content by 6.89% and 10.24% compared to the controls (Figure 9C).
Proline content. The IR of 1S:2C treated with Se produced the highest proline content (2.71 μmol g FW−1), while sole cropping without SM produced the lowest (1.63 μmol g FW−1) (Figure 10A). Regardless of SM treatment, 1S:2C, 2S:4C, and 3S:5C increased proline content by 23.03%, 15.89%, and 9.12%, respectively, compared to sole cropping (Cs). Across all IRs, foliar application of SA and Se increased proline content by 11.22% and 23.16%, respectively, compared to the controls (Figure 10A).
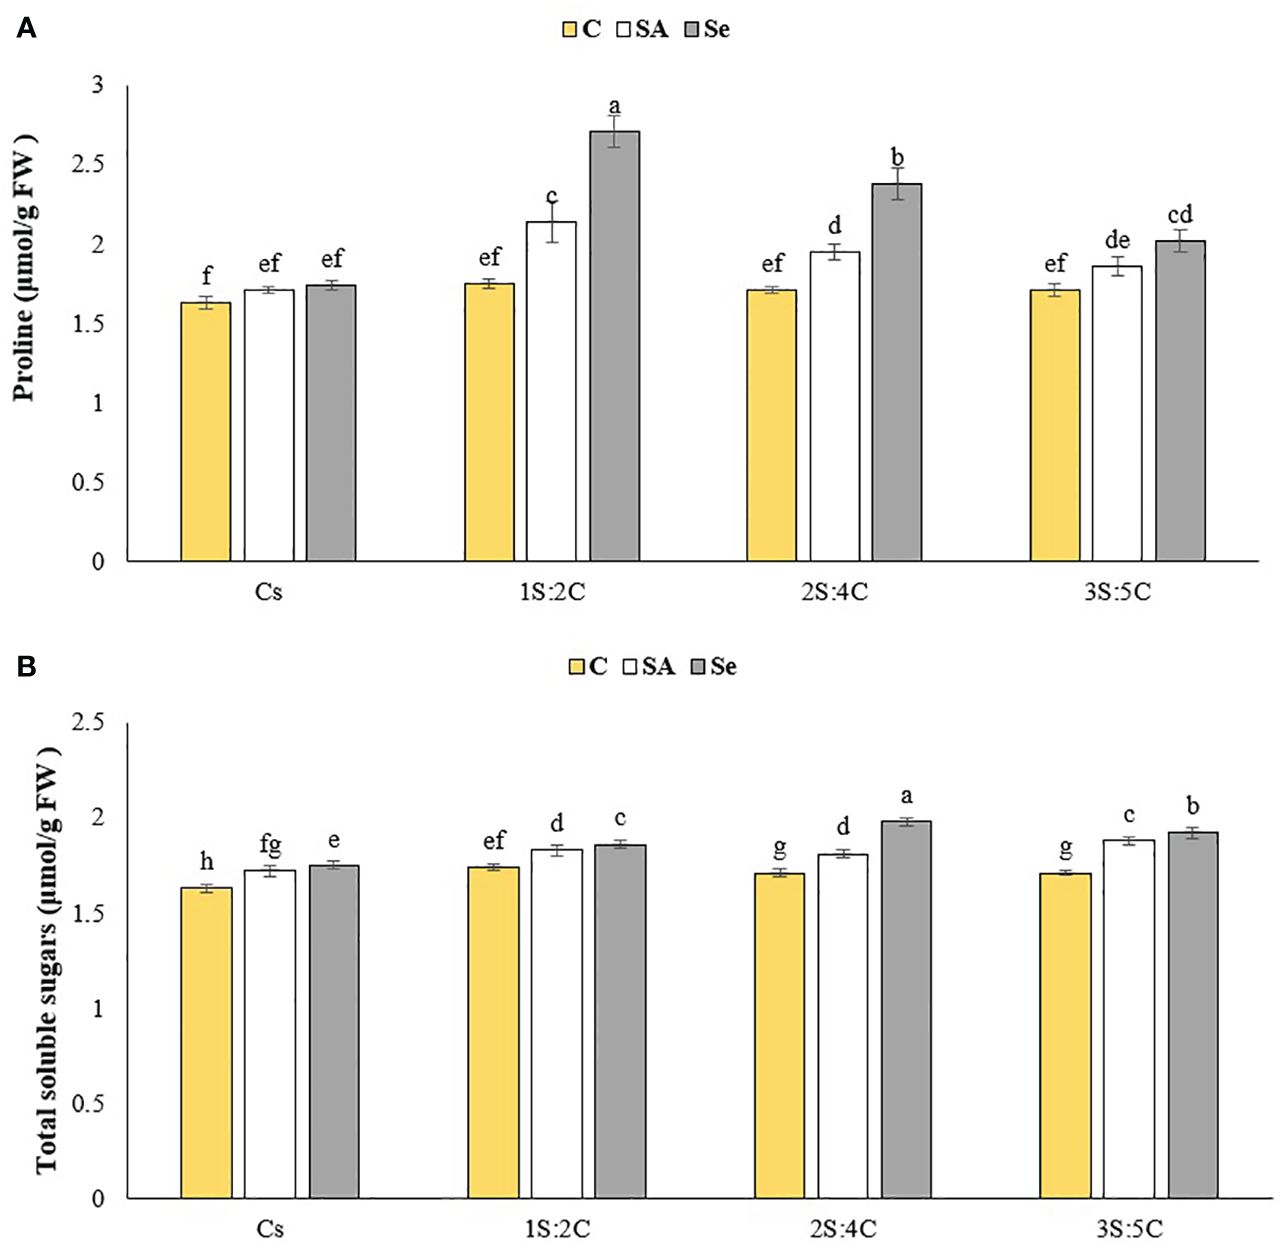
Figure 10 Means comparison for the effect of stress modifier biostimulant (C, control; SA, salicylic acid; Se, selenium) and cropping pattern (Cs, chickpea sole cropping; 1S:2C, 2S:4C, and 3S:5C, ratios of safflower and chickpea in the intercropping pattern) on proline (A), and total soluble sugar (B) contents of chickpea. Lowercase letters above the bars indicate significant (p ≤ 0.05) differences.
Total soluble sugar content. The IR of 2S:4C treated with Se produced the highest total soluble sugar content (1.98 μmol g FW−1), while sole cropping without SM produced the lowest (1.63 μmol g FW−1) (Figure 10B). Regardless of SM treatment, 1S:2C, 2S:4C, and 3S:5C increased total soluble sugar content by 6.08%, 7.27%, and 7.44%, respectively, compared to sole cropping (Cs). Across all IRs, foliar application of SA and Se increased the total soluble sugar content by 6.21% and 9.58%, respectively, compared to the controls (Figure 10B).
CAT activity. The IR of 2S:4C treated with Se produced the highest CAT activity (1.81 unit mg protein FW−1), while sole cropping without SM produced the lowest (1.42 unit mg protein FW–1) (Figure 11A). Regardless of SM treatment, 1S:2C, 2S:4C, and 3S:5C increased CAT activity by 7.29%, 11.71%, and 9.74%, respectively, compared to sole cropping (Cs). Across all IRs, foliar application of SA and Se increased CAT activity by 7.27% and 11.52%, respectively, compared to the controls (Figure 11A).
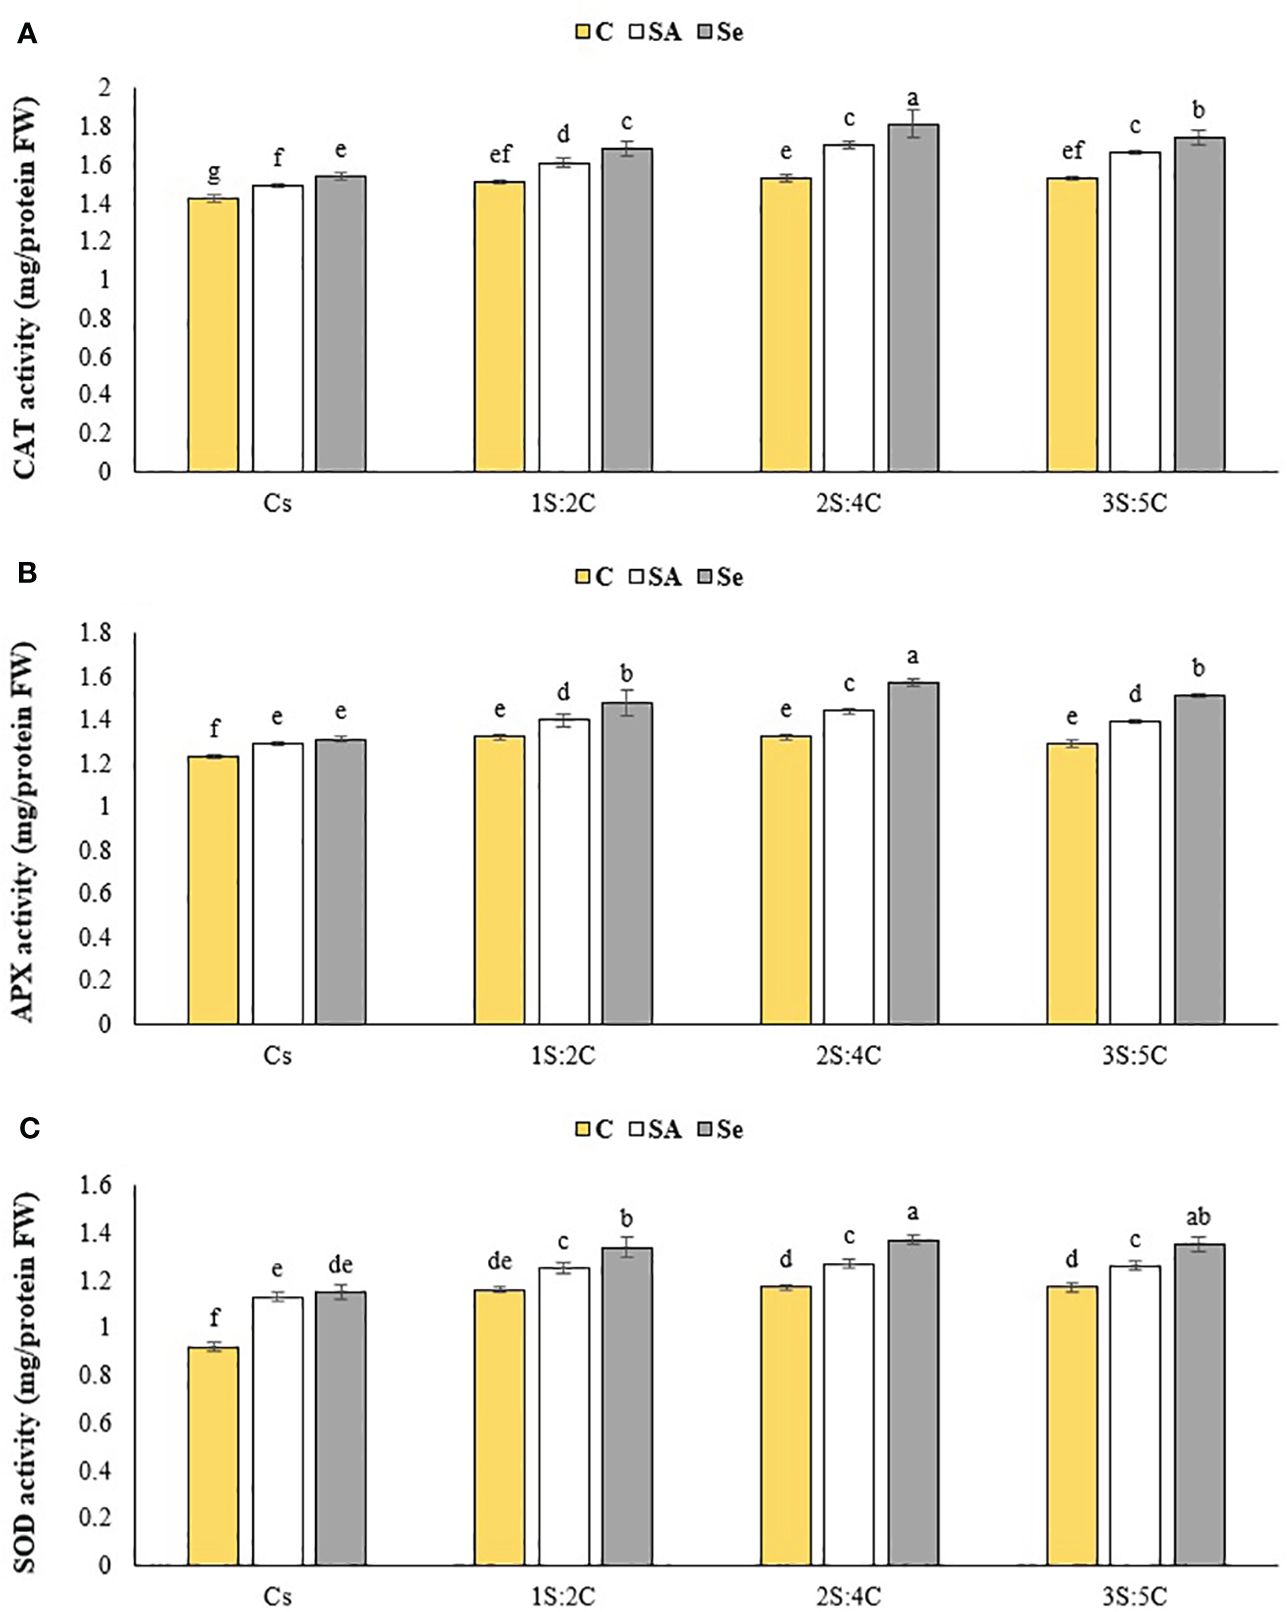
Figure 11 Means comparison for the effect of stress modifier biostimulant (C, control; SA, salicylic acid; Se, selenium) and cropping pattern (Cs, chickpea sole cropping; 1S:2C, 2S:4C, and 3S:5C, ratios of safflower and chickpea in the intercropping pattern) on CAT (A), APX (B), and SOD (C) activities of chickpea. Lowercase letters above the bars indicate significant (p ≤ 0.05) differences.
APX activity. The IR of 2S:4C treated with SA produced the highest APX activity (1.96 unit mg protein FW−1), while sole cropping without SM produced the lowest (1.17 unit mg protein FW−1) (Figure 11B). Regardless of SM treatment, 1S:2C, 2S:4C, and 3S:5C increased APX activity by 8.81%, 11.55%, and 8.59%, respectively, compared to sole cropping (Cs). Across all IRs, foliar application of SA and Se increased APX activity by 6.52% and 12.09%, respectively, compared to the controls (Figure 11B).
SOD activity. The IR of 2S:4C treated with Se produced the highest SOD activity (1.37 unit mg protein FW−1), while sole cropping without SM produced the lowest (0.92 unit mg protein FW−1) (Figure 11C). Regardless of SM treatment, 1S:2C, 2S:4C, and 3S:5C increased SOD activity by 14.67%, 16.01%, and 15.34%, respectively, compared to sole cropping (Cs). Across all IRs, foliar application of SA and Se increased SOD activity by 9.97% and 15.16%, respectively, compared to the controls (Figure 11C).
Partial and total LER. The IR of 1S:2C treated with Se had the highest partial LERS (0.94), while 1S: 2C treated with SA had the highest partial LERC (1.00). The IR of 1S:2C with Se application had the highest LERT (1.81), indicating 81% higher total land productivity than monocropping, while 3S:5C with SA application had the lowest (1.31) (Figure 12).
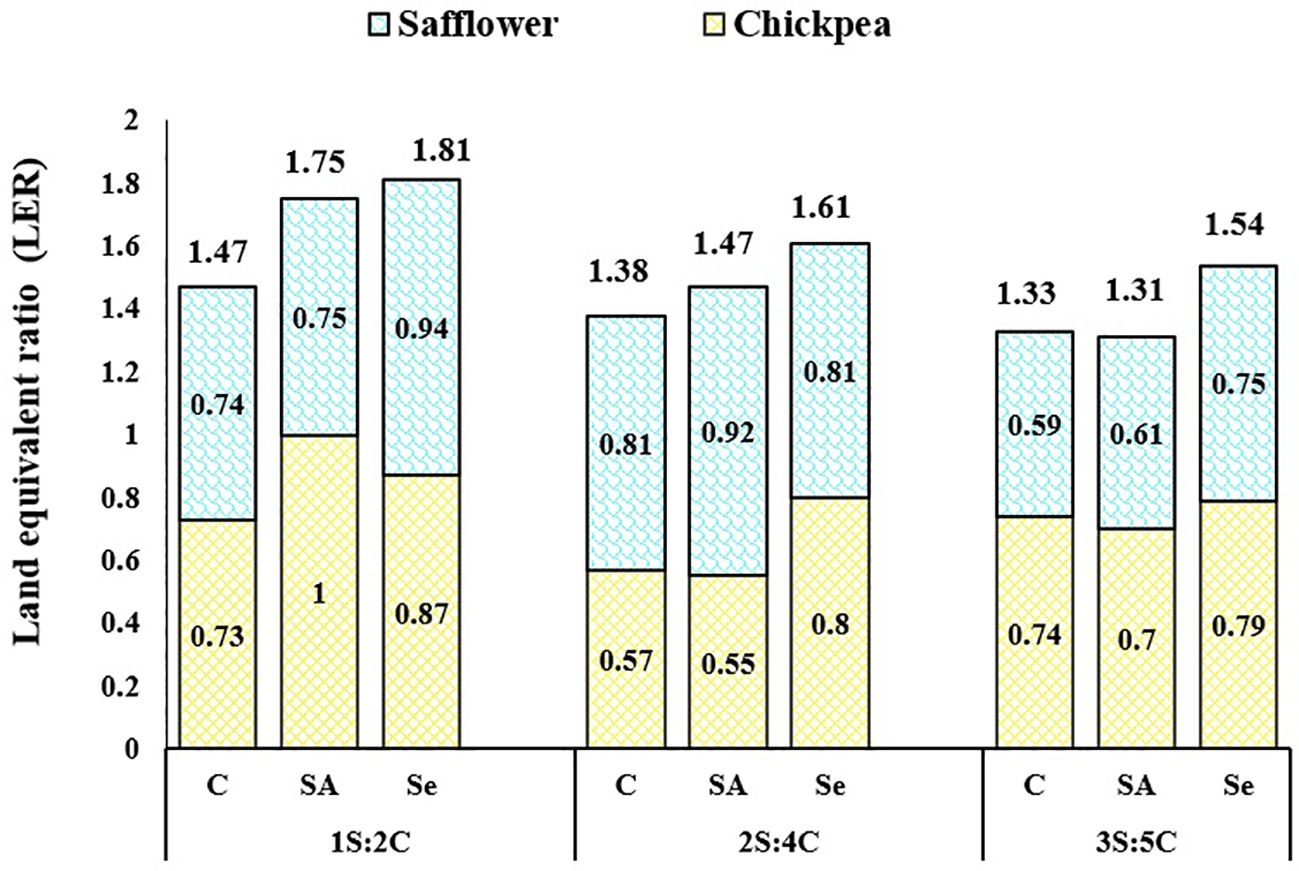
Figure 12 Partial and total land equivalent ratio (LER) for seed yields of safflower (S) and chickpea (C) in different cropping patterns (Cs, chickpea sole cropping; 1S:2C, 2S:4C, and 3S:5C, ratios of safflower and chickpea in the intercropping pattern) and stress modifier biostimulants (C, control; SA, salicylic acid; Se, selenium).
Discussion
The findings of this study support the notion that different cropping patterns significantly impact various agronomic traits and the biological and seed yields of safflower. Our results align with research conducted by Faridvand et al. (2022), who reported that monocropping systems generally have higher productivity than intercropping systems. Monocropping offers a homogeneous environment, facilitating optimal resource allocation and reducing competition between plant species, unlike intercropping systems, which often suffer from resource limitations such as light, water, and nutrients due to increased interspecific competition (Faridvand et al., 2022). For instance, Zamani et al. (2023) demonstrated lower seed and biological yield in dragon’s head (Lallemantia iberica) intercropped with chickpea than monocropping. However, the intercropping patterns in our study exhibited higher total plant productivity, as indicated by the LER index, indicating the advantage of these planting patterns. This advantage is supported by previous studies reporting higher LER values under intercropping than monocropping, such as for lemon balm (Melissa officinalis L.)/kidney bean (Phaseolus vulgaris L.) (Qoreishi et al., 2023) and sesame (Sesamum indicum L.)/kidney bean (Taghizadeh et al., 2023).
Interestingly, incorporating chickpeas into cropping patterns positively influenced safflower growth and development, consistent with the findings of Jalilian et al. (2017). This positive impact can be attributed to the enhanced availability of essential nutrients, particularly nitrogen, under different chickpea cropping patterns, increasing safflower’s photosynthetic capacity and thus growth parameters such as branch, leaf, and capitol numbers, seed number per capsule, 1,000-seed weight, and ultimately seed yield.
Moreover, applying stress modulators like SA and Se enhanced safflower productivity by directly enhancing photosynthetic pigments, photosynthetic efficiency, RuBisCo concentration and activity, and ATP and NADPH production (Jamshidi Jam et al., 2023). Similarly, in Brassica napus L., Habibi (2015) reported that Se and SA applications enhanced agronomic traits such as pod number, seed number per pod, and seed productivity, potentially by stabilizing carbon dioxide, which positively influences carbon assimilation and subsequent seed formation. Gürsoy (2022) reported that SA application improved sunflower productivity when intercropped with linseed under water-deficit stress by enhancing photosynthetic capacity, CO2 assimilation, and the release of growth regulators and phytohormones. Similarly, Akbulut (2020) demonstrated that SA application indirectly improved the agronomic traits and seed yield of Jerusalem artichoke (Helianthus tuberosus L.) intercropped with snap bean (Phaseolus vulgaris L.) under water-deficit conditions. In our study, SA and Se application likely increased safflower yield in the different intercropping patterns with chickpea by optimizing water relations, improving nutrient cycling, and enhancing enzyme activity, thereby promoting overall plant performance (Damalas and Koutroubas, 2021).
The decrease in chlorophyll concentration observed under rainfed conditions can be attributed to water deficiency, which triggers the decomposition and peroxidation of chlorophyll by active oxygen species, damaging lipids, proteins, and photosynthetic pigments (Zhou et al., 2022; Zamani et al., 2023). Moreover, water deficiency disrupts the chloroplast membrane, decreasing chlorophyll content (Wang et al., 2021). Conversely, the observed increase in chlorophyll contents in 2S:4C and 3S:5C treated with Se (Figure 3) suggests a positive impact on photosynthesis. This finding aligns with previous research where intercropping systems with mung bean facilitated chlorophyll synthesis by providing an adequate nitrogen supply, ultimately leading to higher chlorophyll contents and potentially enhanced photosynthesis rates (Shaker-Koohi et al., 2014).
Furthermore, SA application in intercropping systems can increase chlorophyll content. SA-associated stress modulators, such as auxins, gibberellins, and cytokinins, stimulate physiological activities such as the activation of enzymes involved in photosynthesis, resulting in enhanced chlorophyll contents (Moreira et al., 2015; Dong et al., 2019; Tang et al., 2022). The improved chlorophyll content in safflower plants intercropped with chickpea was accompanied by enhanced photosynthetic activity. In an intercropping system with snap bean and Jerusalem artichoke, El-Tohamy et al. (2018) demonstrated that SA application contributes to cell membrane reconstruction, improving chloroplast structure and optimizing the photosynthetic system, and enhances the water absorption capacity of the root system, alleviating adverse drought stress effects.
Intercropping with legumes combined with Se application reduced canopy temperatures in potato plants, providing effective cooling and enhancing tolerance to water-deficit and heat stress (Nyawade et al., 2020). Se application also stimulates the formation of plant-silicified structures, which help mitigate the heat load on plant leaves (Ardebili et al., 2014). In safflower, the combined application of Se and SA induced changes in the biochemical composition of tissues, increasing proline accumulation, crucial for enhancing plant resistance to heat stress under water-deficit conditions (Asghari et al., 2023). Proline is an osmoprotectant and compatible solute, helping plants offset the adverse effects of water deficit and conferring tolerance to various stress conditions (Sapre and Vakharia, 2016). Proline is a crucial regulatory mechanism that mitigates water loss by reducing cell water potential (Hosseini et al., 2010). It acts as a biochemical marker indicating metabolic changes in response to various stress types (Hussain et al., 2016).
Several studies have highlighted the positive association between Se concentration and proline accumulation in safflower leaves exposed to water-deficit conditions, suggesting the potential role of Se and SA in facilitating plant osmotic adjustment (Damalas and Koutroubas, 2021; Sher et al., 2022). Proline accumulation in safflower tissues helps maintain cell turgidity by reducing cell water potential and mitigating the adverse impacts of water-deficit stress (Vijayalakshmi et al., 2016). In this study, the observed increase in proline concentrations following Se and SA treatments suggests the potential of these stress modulators to enhance safflower’s stress tolerance mechanisms. Proline accumulation in intercropping systems in plants treated with Se and SA can be attributed to various factors, such as the regulatory influence of abscisic acid (ABA) on light-mediated mechanisms involved in proline metabolism (El-Tohamy et al., 2018) or the presence of high-energy photosynthetic compounds that enhance proline synthesis (Gürsoy, 2022).
The increase in total soluble sugar content in safflower plants intercropped with chickpea and treated with Se and SA can be attributed to the osmotic adjustment process induced by these stress modulators. Osmotic adjustment is a physiological response triggered by water-deficit and heat stress, leading to the accumulation of compatible solutes, including sugars, ions, and amino acids (Moreira et al., 2015; Yousefzadeh Najafabadi and Ehsanzadeh, 2017; Tang et al., 2022; Ulhassan et al., 2022). Intercropping safflower with chickpea, especially when treated with Se and SA, significantly increased total soluble carbohydrate content compared to treatments without these stress modulators. This increased accumulation of solutes, such as sugars, is crucial in lowering leaf osmotic potential, enabling water movement into leaf cells, and maintaining turgor potential (Zhang et al., 2021). Consequently, plant tissues exhibit greater tolerance to low soil water conditions. The accumulated solutes act as water reservoirs, protecting cell membranes and protein complexes and allowing for sustained cell metabolic activity (Vijayalakshmi et al., 2016). The higher concentration of total soluble sugars in plants treated with SA and Se under intercropping patterns can be attributed to enhanced vegetative growth, potentially mediated by the production of plant growth regulators such as auxins, gibberellins, and cytokinins, which promote plant growth and increase total soluble sugar concentrations (Tang et al., 2022). Asadi et al. (2020), in a study involving intercropped linseed (L; Linum usitatissimum L.) with chickpea (C; Cicer arietinum L.) affected by fertilizer resources under dryland conditions, reported that 1C:1L and 4C:2L produced the most chlorophyll a, chlorophyll b, and carotenoids, while monocropping produced the least. Notably, monocropping produced higher amounts of proline and soluble sugars than intercropping. In another study, investigating chickpea (C) and dragon’s head (D) intercropping systems, Zamani et al. (2023) reported that 1D:1C and 2D:1C with biofertilization produced the highest chlorophyll a, chlorophyll b, and carotenoid concentrations in both species.
Cultivation practices can significantly impact the soil environment, leading to nutrient and water stress and generating ROS with toxic effects (Hu et al., 2010; Yao et al., 2019). ROS, including superoxide radicals (O2.−) and hydrogen peroxide (H2O2), are highly reactive and can damage DNA, proteins, lipids, and carbohydrates, ultimately leading to cell death (Heydarzadeh et al., 2022). Excess ROS can also accelerate crop root senescence. To counteract the harmful effects of ROS, plants increase the activities and contents of antioxidant enzymes such as SOD, CAT, and glutathione (GSH) (Rahimi et al., 2022). Our measurements of SOD, APX, and CAT activities revealed that intercropping systems significantly increased SOD and CAT activities in safflower plants compared to sole cropping, particularly with foliar SA and Se applications. These findings indicate that intercropping systems regulate intracellular homeostasis in safflower, delay senescence, and maintain the nutrient acquisition capacity of roots by preventing an imbalance in redox reactions (Huang et al., 2022). Intercropping may enhance safflower’s nitrogen uptake capacity and prolong the root system’s nutrient uptake duration.
The antioxidant system plays a crucial role in plant tolerance to stress conditions. When plants are exposed to stress, the activity of antioxidant enzymes or substances generally increases, which is associated with enhanced stress tolerance (Moreira et al., 2015). Among these enzymes, SOD is the first line of defense against ROS, mainly by removing O2.− formed in various cellular compartments. Increased SOD activity helps scavenge O2.− induced by water deficit (Wang et al., 2021). Other key antioxidant enzymes, such as CAT and APX, detoxify H2O2 under stressful conditions (Heydarzadeh et al., 2022). In our study, SA and Se application increased SOD activity under water-deficit conditions, enhancing O2.− radical scavenging. Other studies have reported similar findings, with SA and Se application increasing SOD activity (Dong et al., 2019; Tang et al., 2022) and converting O2.– radicals into H2O2. Applying SA in our experiment also increased CAT and SOD activities, alleviating oxidative stress from water deficiency, likely due to SA significantly increasing the active iron (Fe) content, as CAT and SOD are heme-containing enzymes (Dong et al., 2019). The observed increase in enzyme activities (CAT, APX, and SOD) in safflower plants intercropped with chickpea and treated with SA and Se can be attributed to the favorable growth conditions provided by the intercropping system, including nitrogen availability, efficient use of soil nutrients, and optimal light distribution in the mixed canopy.
The intercropping systems in this study positively impacted safflower oil content and quality, particularly linoleic and oleic acid constituents, compared to monocropping, likely due to the higher efficiency in using environmental resources, including water, nutrients, and radiation, and enhanced availability of nitrogen through biological fixation facilitated by the legume species (chickpea). The increased nitrogen availability contributes directly or indirectly to the performance and photosynthetic rate of the companion plant (safflower), increasing the production of oil precursor compounds. Furthermore, SA and Se application enhanced the quantity and quality of oil fatty acids in safflower plants, attributed to the production of plant growth regulators, which regulate the host plant’s water relations and enhance enzyme activity, thus improving plant tolerance to drought stress (Jamshidi Jam et al., 2023). Fotohi Chiyaneh et al. (2022) reported that biofertilizers significantly modified oil concentrations and chemical constituents of ajowan (Carum copticum L.). Moreover, Rezaei-Chiyaneh et al. (2021) noted that intercropping black cumin with fenugreek increased oil concentration and quality of black cumin by decreasing saturated fatty acids (palmitic and stearic) and increasing unsaturated fatty acids (linoleic acid and oleic acid) due to increased nutrient uptake.
Multiple factors affect the oil yield of safflower seeds, including seed yield and oil content, collectively determining the overall oil yield (Taghizadeh et al., 2023). In our study, 3S:5C treated with Se produced the highest safflower seed and oil yields. Even in sole cropping, foliar Se application increased seed yield, leading to a higher oil yield. Using stress modulators such as Se and SA promotes root system expansion and photosynthetic efficiency (Ghassemi-Golezani and Farhangi-Abriz, 2018), increasing plant nutrient and water availability and enhancing growth. Intercropping safflower with chickpea has additional benefits, including increased activity of beneficial microorganisms, improved soil structure, enhanced soil water retention capacity, and improved nutrient availability and plant uptake. These factors contribute to improved plant nutrition and higher safflower seed oil yield (Akbulut, 2020). Our findings suggest that applying SA and Se under different cropping patterns enhances the oil yield of safflower seeds by promoting favorable growth conditions and optimizing nutrient and water availability.
Conclusion
Our study underscores the significant influence of cropping patterns, stress modulators like Se and SA, and intercropping with legumes on safflower plants. Applying Se or SA significantly enhanced safflower and chickpea yields, with the 2S:4C and 3S:5C (safflower: chickpea) intercropping ratios treated with Se and SA yielding the best results in terms of yield and oil quality. Moreover, the application of Se and SA positively impacted safflower oil content, yield, and quality, outperforming the control group. Intercropping safflower with chickpea treated with Se and SA also enhanced both crops’ physiological traits and enzymatic activities. Our findings suggest that implementing the 2S:4C and 3S:5C treatments, along with Se and SA treatments, could enhance yields and income for farmers while promoting environment-friendly practices. However, it is essential to note that this study did not directly quantify income.
Further research focusing on the economic aspects is crucial to validate the potential benefits of these treatments. These findings could have significant implications for sustainable agricultural practices, highlighting the importance of crop diversification, nutrient management, and stress modulation strategies in enhancing the productivity and quality of safflower oil. Continued investigation into the mechanisms by which Se and SA influence safflower plant growth, physiology, and oil production will offer valuable insights for future agricultural practices. Additional research and experimentation are needed to validate and optimize these findings across various agroecological regions and cropping systems.
Data availability statement
The raw data supporting the conclusions of this article will be made available by the authors, without undue reservation.
Author contributions
ER-C: Conceptualization, Methodology, Project administration, Supervision, Writing – original draft, Writing – review & editing. SM: Investigation, Software, Writing – original draft. HM: Methodology, Software, Writing – review & editing. AD: Data curation, Formal analysis, Writing – review & editing. KS: Methodology, Project administration, Writing – review & editing.
Funding
The author(s) declare that no financial support was received for the research, authorship, and/or publication of this article.
Conflict of interest
The authors declare that the research was conducted in the absence of any commercial or financial relationships that could be construed as a potential conflict of interest.
Publisher’s note
All claims expressed in this article are solely those of the authors and do not necessarily represent those of their affiliated organizations, or those of the publisher, the editors and the reviewers. Any product that may be evaluated in this article, or claim that may be made by its manufacturer, is not guaranteed or endorsed by the publisher.
References
Aebi H. (1984). Catalase in vitro. Methods Enzymol. 105, 121–126. doi: 10.1016/S0076-6879(84)05016-3
Akbulut E. (2020). Effects of salicylic acid on fatty acid gene expression in Carthamus tinctorious L. cv. Dinçer under pendimethalin stress. Int. J. Pure Appl. Sci. 6, 61–67. doi: 10.29132/ijpas.780077
Alioghli N., Fathi S. A. A., Razmjou J., Hassanpour M. (2022). Does intercropping patterns of potato and safflower affect the density of Leptinotarsa decemlineata (Say), predators, and the yield of crops? Biol. Control. 175, 105051. doi: 10.1016/j.biocontrol.2022.105051
Amani Machiani M., Rezaei-Chiyaneh E., Javanmard A., Maggi F., Morshedloo M. R. (2019). Evaluation of common bean (Phaseolus vulgaris L.) seed yield and quali-quantitative production of the essential oils from fennel (Foeniculum vulgare Mill.) and dragonhead (Dracocephalum moldavica L.) in intercropping system under humic acid application. J. Clean. Prod. 235, 112–122. doi: 10.1016/j.jclepro.2019.06.241
AOCS (1993). Official Methods and Recommended Practices (Champaign, IL, United States: The American Oil Society Champaign).
Ardebili N. O., Saadatmand S., Niknam V., Khavari-Nejad R. A. (2014). The alleviating effects of selenium and salicylic acid in salinity exposed soybean. Acta Physiol. Plant 36, 3199–3205. doi: 10.1007/s11738-014-1686-6
Asadi S., Rezaei-chiyaneh E., Amirnia. R. (2020). Evaluation of ecophysiological characteristics of row intercropped linseed (Linum usitatissimum L.) with chickpea (Cicer arietinum L.) affected as fertilizer resources under dryland conditions. J.Agroecology 12, 261–284. doi: 10.22067/JAG.V12I2.75309
Asghari J., Mahdavikia H., Rezaei-Chiyaneh E., Banaei-Asl F., Amani Machiani M., Harrison M. T., et al. (2023). Selenium nanoparticles improve physiological and phytochemical properties of basil (Ocimum basilicum L.) under drought stress conditions. Land 12, 164. doi: 10.3390/land12010164
Bates L. S., Waldren R. P., Teare I. D. (1973). Rapid determination of free proline for water-stress studies. Plant Soil. 39, 205–207. doi: 10.1007/BF00018060
Beyer W. F., Fridovich I. (1987). Assaying for superoxide dismutase activity: some large consequences of minor changes in conditions. Anal. Biochem. 161, 559–566. doi: 10.1016/0003-2697(87)90489-1
Damalas C. A., Koutroubas S. D. (2021). Foliar applications of salicylic acid for improving crop tolerance to drought stress: A review. Salicylic Acid - A Versatile Plant Growth Regulator 65–76. doi: 10.1007/978–3-030–79229-9_5
Dong Y., Wan Y., Liu F., Zhuge Y. (2019). Effects of exogenous SA supplied with different approaches on growth, chlorophyll content and antioxidant enzymes of peanut growing on calcareous soil. J. Plant Nutr. 42, 1869–1883. doi: 10.1080/01904167.2019.1648679
Dubois M., Gilles K. A., Hamilton J. K., Rebers P. T., Smith F. (1956). Colorimetric method for determination of sugars and related substances. Anal. Chem. 28, 350–356. doi: 10.1021/ac60111a017
El-Tohamy W. A. K., El-Abagy H. M., Badr M. A. A., Gruda N. (2018). Effect of exogenous salicylic acid on the response of snap bean (Phaseolus vulgaris L.) and Jerusalem artichoke (Helianthus tuberosus L.) to drought stress. Acta Sci. Pol. Hortorum Cultus. 17, 81–91. doi: 10.24326/asphc.2018.4
Faridvand S., Rezaei-Chiyaneh E., Battaglia M. L., Gitari H. I., Raza M. A., Siddique K. H. M., et al. (2022). Application of bio and chemical fertilisers improves yield, and essential oil quantity and quality of Moldavian balm (Dracocephalum moldavica L.) intercropped with mung bean (Vigna radiata L.). Food Energy Secur. 11 (2), 1–16. doi: 10.1002/fes3.319
Fotohi Chiyaneh S., Rezaei-Chiyaneh E., Amirnia R., Keshavarz Afshar R., Siddique K. H. M. (2022). Changes in the essential oil, fixed oil constituents, and phenolic compounds of ajowan and fenugreek in intercropping with pea affected by fertilizer sources. Ind. Crops Prod. 178, p114587. doi: 10.1016/j.indcrop.2022.114587
Galić L., Špoljarević M., Jakovac E., Ravnjak B., Teklić T., Lisjak M., et al. (2021). Selenium biofortification of soybean seeds influences physiological responses of seedlings to osmotic stress. Plants. 10, 1498. doi: 10.3390/plants10081498
Gao L., Liu X. M., Du Y. M., Zong H., Shen G. M. (2019). Effects of tobacco–peanut relay intercropping on soil bacteria community structure. Ann. Microbiol. 69, 1531–1536. doi: 10.1007/s13213-019-01537-9
Ghaderimokri L., Rezaei-Chiyaneh E., Ghiyasi M., Gheshlaghi M., Battaglia M. L., Siddique K. H., et al. (2022). Application of humic acid and biofertilizers changes oil and phenolic compounds of fennel and fenugreek in intercropping systems. Sci. Rep. 12, 5946. doi: 10.1038/s41598–022-09645–4
Ghassemi-Golezani K., Farhangi-Abriz S. (2018). Changes in oil accumulation and fatty acid composition of soybean seeds under salt stress in response to salicylic acid and jasmonic acid. Russ. J. Plant Physiol. 65, 229–236. doi: 10.1134/S1021443718020115
Gürsoy M. (2022). Effect of salicylic acid pretreatment on seedling growth and antioxidant enzyme activıties of sunflower (Helianthus annuus L.) and linseed (Linum usitatissimum L.) plants in salinity conditions. Rom. Agric. Res. 39, 1–10. Available at: https://hdl.handle.net/20.500.12451/9470.
Habibi G. (2015). Contrastive response of Brassica napus L. to exogenous salicylic acid, selenium and silicon supplementation under water stress. Arch. Biol. Sci. 67, 397–404. doi: 10.2298/ABS140411006H
Heydarzadeh S., Jalilian J., Pirzad A., Jamei R., Petrussa E. (2022). Fodder value and physiological aspects of rainfed smooth vetch affected by biofertilizers and supplementary irrigation in an agri-silviculture system. Agroforest Syst. 96, 221–232. doi: 10.1007/s10457-021-00695-7
Hosseini T., Shekari F., Ghorbanli M. (2010). Effect of salt stress on ion content, proline and antioxidative enzymes of two safflower cultivars (Carthamus tinctorius L.). J. Food Agric. Environ. 8, 1080–1086. Available at: https://www.academia.edu/49011383/Effect_of_salt_stress_on_ion_content_proline_and_antioxidative_enzymes_of_two_safflower_cultivars_Carthamus_tinctorius_L_.
Hu T., Yuan L., Wang J., Kang S., Li F. (2010). Antioxidation responses of maize roots and leaves to partial root-zone irrigation. Agric. Water Manage. 98, 164–171. doi: 10.1016/j.agwat.2010.06.019
Huang J., Qian J., Wang S., Li Y., Zhai X., Olajide T. M., et al. (2022). Effect of selenium biofortification on bioactive compounds and antioxidant activity in germinated black soybean. J. Food Sci. 87, 1009–1019. doi: 10.1111/1750-3841.16014
Hussain M. I., Lyra D. A., Farooq M., Nikoloudakis N., Khalid N. (2016). Salt and drought stresses in safflower: a review. Agron. Sustain. Dev. 36, 1–31. doi: 10.1007/s13593-015-0344-8
Inostroza-Blancheteau C., Reyes-Díaz M., Alberdi M., Godoy K., Rojas-Lillo Y., Cartes P., et al. (2013). Influence of selenite on selenium uptake, differential antioxidant performance and gene expression of sulfate transporters in wheat genotypes. Plant Soil. 369, 47–59. doi: 10.1007/s11104-012-1492-0
Jalilian J., Najafabadi A., Zardashti M. R. (2017). Intercropping patterns and different farming systems affect the yield and yield components of safflower and bitter vetch. J. Plant Interact. 12, 92–99. doi: 10.1080/17429145.2017.1294712
Jamshidi Jam B., Shekari F., Andalibi B., Fotovat R., Jafarian V., Dolatabadian A., et al. (2023). The effects of salicylic acid and silicon on safflower seed yield, oil content, and fatty acids composition under salinity stress. Silicon. 15, 4081–4094. doi: 10.1007/s12633-023-02308-7
Kaur H., Hussain S. J., Kaur G., Poor P., Alamri S., Siddiqui M. H., et al. (2022). Salicylic acid improves nitrogen fixation, growth, yield and antioxidant defence mechanisms in chickpea genotypes under salt stress. J. Plant Growth Regul. 41, 2034–2047. doi: 10.1007/s00344-022-10592-7
Lichtenthaler H. K., Wellburn A. R. (1987). Determination of total carotenoids and chlorophylls a and b of leaf in different solvents. Biochem. Soc Trans. 11, 591–592. doi: 10.1042/bst0110591
Maitra S., Barik A., Samui S. K., Saha D. (1999). Economics of cotton based intercropping system in the rice fallows of coastal Bengal- Sundarbans. J. Indian Soc Coast. Agric. Res. 17, 299–304.
Maitra S., Ghosh D. C., Sounda G., Jan P. K., Roy D. K. (2000). Productivity, competition and economics of intercropping legumes in finger millet (Eleusine coracana) at different fertility levels. Indian J. Agric. Sci. 70, 824–828.
Manasa P., Maitra S., Reddy M. D. (2018). Effect of summer maize-legume intercropping system on growth, productivity and competitive ability of crops. Int. J. Manage. Technol. Eng. 8, 2871–2875.
Manda T. K., Puste A. M., Maitra S. (2018). Influence of irrigation and mulching on yield attributes, yield and quality of lentil (Lens esculentum L.) grown as intercrop under limited water conditions. IJBS 5, 61–64. doi: 10.30954/2347–9655.01.2018.7
Mohammadkhani F., Pouryousef M., Yousefi A. R. (2023). Growth and production response in saffron-chickpea intercropping under different irrigation regimes. Ind. Crops Prod. 193, 116256. doi: 10.1016/j.indcrop.2023.116256
Mohammadzadeh V., Rezaei-Chiyaneh E., Mahdavikia H., Rahimi A., Gheshlaghi M., Battaglia M. L., et al. (2022). Effect of intercropping and bio-fertilizer application on the nutrient uptake and productivity of mung bean and marjoram. Land. 11, 1825. doi: 10.3390/land11101825
Moreira A., Moraes L. A., Schroth G., Mandarino J. M. (2015). Effect of nitrogen, row spacing, and plant density on yield, yield components, and plant physiology in soybean–wheat intercropping. Agron. J. 107, 2162–2170. doi: 10.2134/agronj15.0121
Najafabadi A., Jalilian J. (2022). Impacts of high and low-input farming systems on the quality change of safflower oil while intercropped with bitter vetch. J. Agric. Sci. 28(3), 401–411. doi: 10.15832/ankutbd.857026
Nakano A., Asada K. (1987). Purification of ascorbate peroxidase in spinach chloroplasts: its inactivation in ascorbate-depleted medium and reactivation by monodehydroascorbate radical. Plant Cell Physiol. 28, 131–140. doi: 10.1093/oxfordjournals.pcp.a077268
Namazi Y., Rezaei-Chiyaneh E., Moghaddam S. S., Battaglia M. L. (2022). The effects of microbial inoculation and intercropping on yield and active ingredients of savory (Satureja hortensis L.) intercropped with common bean (Phaseolus vulgaris L.). Int. J. Environ. Sci. Technol. 19, 8273–8288. doi: 10.1007/s13762-022-04024-y
Nyawade S., Gitari H. I., Karanja N. N., Gachene C. K., Schulte-Geldermann E., Sharma K., et al. (2020). Enhancing climate resilience of rain-fed potato through legume intercropping and silicon application. Front. Sustain. Food Syst. 4. doi: 10.3389/fsufs.2020.566345/full
Rahimi A., Mohammadi M. M., Siavash Moghaddam S., Heydarzadeh S., Gitari H. (2022). Effects of stress modifier biostimulants on vegetative growth, nutrients, and antioxidants contents of garden thyme (Thymus vulgaris L.) under water deficit conditions. J. Plant Growth Regul. 41, 2059–2072. doi: 10.1007/s00344-022-10604-6
Rezaei-Chiyaneh E., Amani Machiani M., Javanmard A., Mahdavikia H., Maggi F., Morshedloo M. R., et al. (2021a). Vermicompost application in different intercropping patterns improves the mineral nutrient uptake and essential oil compositions of sweet basil (Ocimum basilicum L.). J. Soil Sci. Plant Nutr. 21, 450–466. doi: 10.1007/s42729-020-00373-0
Rezaei-Chiyaneh E., Jalilian J., Seyyedi S. M., Barin M., Ebrahimian E., Afshar R. K., et al. (2021b). Isabgol (Plantago ovata) and lentil (Lens culinaris) intercrop responses to arbuscular mycorrhizal fungi inoculation. Biol. Agric. Hortic. 37, 125–140. doi: 10.1080/01448765.2021.1903556
Rezaei-Chiyaneh E., Battaglia M. L., Sadeghpour A., Shokrani F., Nasab A. D. M., Raza M. A., von Cossel M. (2021). Optimizing intercropping systems of black cumin (Nigella sativa L.) and fenugreek (Trigonella foenum-graecum L.) through inoculation with bacteria and mycorrhizal fungi. Adv. Sustain Syst. 5, 2000269. doi: 10.1002/adsu.202000269
Sapre S. S., Vakharia D. N. (2016). Role of silicon under water deficit stress in wheat: (Biochemical perspective): A review. Agric. Rev. 37, 109–116. doi: 10.18805/ar.v37i2.10736
Shah T. M., Imran M., Atta B. M., Ashraf M. Y., Hameed A., Waqar I., et al. (2020). Selection and screening of drought tolerant high yielding chickpea genotypes based on physio-biochemical indices and multi-environmental yield trials. BMC Plant Biol. 20, 1–16. doi: 10.1186/s12870-020-02381-9
Shaker-Koohi S., Nasrollahzadeh S., Raei Y. (2014). Evaluation of chlorophyll value, protein content and yield of sorghum (Sorghum bicolor L.)/mungbean (Vigna radiate L.) intercropping. Int. J. Biosci. 4, 136–143.
Sher A., Ul-Allah S., Sattar A., Ijaz M., Ahmad W., Bibi Y., et al. (2022). The effect of selenium concentration on the quantitative and qualitative yield of four safflower (Carthamus tinctorius L.) genotypes. J. Soil Sci. Plant Nutr. 22, 2663–2669. doi: 10.1007/s42729-022-00834-8
Taghizadeh Y., Amirnia R., Rezaei-Chiyaneh E., Ghiyasi M., Razavi B. S., Siddique K. H. M., et al. (2023). Co-inoculation of mycorrhizal fungi with bacterial fertilizer along with intercropping scenarios improves seed yield and oil constituents of sesame. J. Soil Sci. Plant Nutr. 23, 2258–2272. doi: 10.1007/s42729-023-01177-8
Tang W., Tang W., Xie Y., Li X., Li H., Lin L., et al. (2022). Effects of intercropping on Se accumulation and growth of pakchoi, lettuce and radish. Int. J. Phytorem. 25, 1165–1172. doi: 10.1080/15226514.2022.2140779
Tejera G. N. A., Olivera M., Iribarne C., Lluch C. (2004). Partial purification and characterization of a non-specific acid phosphatase in leaves and root nodules of Phaseolus vulgaris. Plant Physiol. Biochem. 42, 585–591. doi: 10.1016/j.plaphy.2004.04.004
Tilahun H. (2019). Planting density and time of safflower relay intercropping in Tef (Eragrostis Tef) at Sebatamit Kebele in Bahir Dar Zuria District, Amhara Region. J. Biology Agric. Healthcare 9, 22–34. doi: 10.7176/JBAH
Ulhassan Z., Khan A. R., Sheteiwy M. S., Azhar W., Hamid Y., Hussain S., et al. (2022). “Selenium-mediated regulation of antioxidant defense system and improved heavy metals tolerance in plants,” in Antioxidant Defense in Plants: Molecular Basis of Regulation, Springer, Singapore 369–382. doi: 10.1007/978–981-16–7981-0_16
Vijayalakshmi T., Vijayakumar A. S., Kiranmai K., Nareshkumar A., Sudhakar C. (2016). Salt stress induced modulations in growth, compatible solutes and antioxidant enzymes response in two cultivars of safflower (Carthamus tinctorius L. cultivar TSF1 and cultivar SM) differing in salt tolerance. Am. J. Plant Sci. 7, 1802–1819. doi: 10.4236/ajps.2016.713168
Wang Q., Zhang C., Li J., Wu X., Long Y., Su Y., et al. (2021). Intercropping vicia sativa L. improves the moisture, microbial community, enzyme activity and nutrient in rhizosphere soils of young kiwifruit plants and enhances plant growth. Horticulturae. 7, 335. doi: 10.3390/horticulturae7100335
Weerarathne L. V. Y., Marambe B., Chauhan B. S. (2017). Does intercropping play a role in alleviating weeds in cassava as a non-chemical tool of weed management?–A review. Crop Prot. 95, 81–88. doi: 10.1016/j.cropro.2016.08.028
Yao Y., Zhang C., Camberato J. J., Jiang Y. (2019). Nitrogen and carbon contents, nitrogen use efficiency, and antioxidant responses of perennial ryegrass accessions to nitrogen deficiency. J. Plant Nutr. 42, 2092–2101. doi: 10.1080/01904167.2019.1655047
Yousefzadeh Najafabadi M., Ehsanzadeh P. (2017). Photosynthetic and antioxidative upregulation in drought-stressed sesame (Sesamum indicum L.) subjected to foliar-applied salicylic acid. Photosynthetica. 55, 611–622. doi: 10.1007/s11099-017-0673-8
Zamani F., Amirnia R., Rezaei-Chiyaneh E., Gheshlaghi M., von Cossel M., Siddique K. H. M., et al. (2022). Optimizing essential oil, fatty acid profiles, and phenolic compounds of dragon’s head (Lallemantia iberica) intercropped with chickpea (Cicer arietinum L.) with biofertilizer inoculation under rainfed conditions in a semi-arid region. Arch. Agron. Soil Sci. 69, 1687–1704. doi: 10.1080/03650340.2022.2105320
Zamani F., Amirnia R., Rezaei-Chiyaneh E., Gheshlaghi M., von Cossel M., Siddique K. H. M., et al. (2023). Alleviating plant water stress with biofertilizers: A case study for dragon’s head (Lallemantia iberica) and chickpea (Cicer arietinum L.) in a rainfed intercropping system. Int. J. Plant Prod. 17, 251–264. doi: 10.1007/s42106-023-00234-7
Zhang X., He H., Xiang J., Li B., Zhao M., Hou T., et al. (2021). Selenium-containing soybean antioxidant peptides: Preparation and comprehensive comparison of different selenium supplements. Food Chem. 358, 129888. doi: 10.1016/j.foodchem.2021.129888
Keywords: antioxidant enzymes, fatty acid, selenium, sustainable agriculture, water deficit
Citation: Mosalman S, Rezaei-Chiyaneh E, Mahdavikia H, Dolatabadian A and Siddique KHM (2024) Enhancing rainfed safflower yield, oil content, and fatty acid composition through intercropping with chickpea and stress-modifier biostimulants. Front. Agron. 6:1389045. doi: 10.3389/fagro.2024.1389045
Received: 20 February 2024; Accepted: 08 May 2024;
Published: 28 May 2024.
Edited by:
Adornis Dakarai Nciizah, Agricultural Research Council of South Africa (ARC-SA), South AfricaReviewed by:
Rouhollah Amini, University of Tabriz, IranMisheck Musokwa, University of KwaZulu-Natal, South Africa
Copyright © 2024 Mosalman, Rezaei-Chiyaneh, Mahdavikia, Dolatabadian and Siddique. This is an open-access article distributed under the terms of the Creative Commons Attribution License (CC BY). The use, distribution or reproduction in other forums is permitted, provided the original author(s) and the copyright owner(s) are credited and that the original publication in this journal is cited, in accordance with accepted academic practice. No use, distribution or reproduction is permitted which does not comply with these terms.
*Correspondence: Esmaeil Rezaei-Chiyaneh, ZS5yZXphZWljaGl5YW5laEB1cm1pYS5hYy5pcg==
 Salah Mosalman1
 Esmaeil Rezaei-Chiyaneh
 Aria Dolatabadian
 Kadambot H.M. Siddique