 Yue Li
 Junfei Chang2†
 Xining Gao
- 1College of Agronomy, Shenyang Agricultural University, Shenyang, China
- 2Dashiqiao Meteorological Bureau, Yingkou, China
- 3Liaoning Key Laboratory of Agrometeorological Disasters, Shenyang, China
- 4National Meteorological Center, China Meteorological Administration, Beijing, China
Global climate change poses a great impact on crop growth, development and yield. Soybean production in Northeast China, which is one of the traditional dominant soybean production areas in China, is of great significance for developing the domestic soybean industry and reducing dependence on imported soybeans. Therefore, it is crucial to evaluate the impacts of future climate change on soybean yield in Northeast China, and to propose reasonable adaptation measures. In this study, we took Fujin city of Heilongjiang province in Northeast China as an example, and used the CROPGRO-soybean model in DSSAT (Decision Support System for Agrotechnology Transfer) to simulate the impacts of future climate change on soybean yield in the four periods of the 2020s (2021-2030), 2030s (2031-2040), 2040s (2041-2050) and 2050s (2051-2060) under two representative concentration pathway (RCP) scenarios (RCP4.5 and RCP8.5), and further determine the best agronomic management practices. The results showed that the calibrated and validated model is suitable for simulating soybean in the study area. By analyzing the meteorological data under future climate scenarios RCP4.5 and RCP8.5 from the PRECIS regional climate model, we found that the average temperature, cumulative precipitation and cumulative solar radiation would mostly increase during the growing season in Fujin city of Heilongjiang province. Combined with the model simulation results, it is shown that under the effect of CO2 fertilization, future climate change will have a positive impact on soybean yield. Compared to the baseline (1986-2005), the soybean yield would increase by 0.6% (7.4%), 3.3% (5.1%), 6.0% (16.8%) and 12.3% (20.6%) in the 2020s, 2030s, 2040s and 2050s under RCP4.5 (RCP8.5).Moreover, the optimal sowing dates and the optimal supplemental irrigation amount under RCP4.5 (RCP8.5) are May 10 (May 5) and 50 mm (40mm), respectively. Under future climate conditions, the agronomic management practices, such as advancing the sowing date and supplementary irrigation in the key stage of soybean growth would increase soybean yield and make soybean growth more adaptable to future climate change.
1 Introduction
The uncertainty of climate change will have an impact on human society, environment and ecosystem. Therefore, it is very important to study the future climate change. According to the recent Intergovernmental Panel on Climate Change (IPCC, 2021), future changes in the global average temperature are expected to reach or exceed 1.5 °C in the next 20 years, and human activities have increased the occurrence frequency and intensity of extreme temperature, precipitation and drought. Global climate change may have disastrous impacts on nature and human social systems, especially on agriculture industry and food security (Tao et al., 2016; Baldos et al., 2020). Climate plays a significant role in agricultural production, and changes in climatic conditions directly affect crop development and final yield (You et al., 2008; Guo et al., 2009; Zhou and Wang, 2015; Kassaye et al., 2021; Lukali et al., 2021). Studies show that 32%-39% of the annual yield variability of corn, soybean and other crops globally is caused by climate variability (Ray et al., 2015). In addition, the global distribution of climate change impacts on crops is different, resulting in different impacts on crop yield. For example, in high latitudes, the temperature is relatively low, so increasing the temperature could increase the land area suitable for agriculture and forestry, and finally increase the crop yield. However, climate change at low latitudes could reduce soil moisture and agricultural productivity, thus reducing crop yield (Darwin et al., 1995). Due to the uncertainty of the impacts of future climate change on crops and the importance of agricultural production, the study of the impacts of future climate change on agriculture has become one of the hottest issues in the current climate change research field (Zhao et al., 2016; Martins et al., 2019; Xiao et al., 2020; Zilli et al., 2020).
The impacts of climate change on crops have been widely studied by the two main methods of observation experiment and model simulation (Cai et al., 2016; Mohammed et al., 2017). The method of using computer models to simulate and predict climate change has been developed rapidly and has become the most ideal method for the quantitative study of climate change impacts. Crop model takes crops as the research object and the growth and development process as the main content. Simulation results are often used to quantify the impacts of climate and other factors on crop yield (Shi et al., 2013). At present, more than 100 crop simulation models have been developed, e.g., the Agricultural Production System Simulator (APSIM) model from Australia, the Soil Water Atmosphere Plant (SWAP) model from Holland, and the Decision Support System for Agrotechnology Transfer (DSSAT) model from the United States. These crop models have also been widely used to evaluate the impacts of agronomic management practices on crop yields and make some adjustments, such as supplementary irrigation, adjustment of sowing dates and supplementary fertilization (Humphreys et al., 2016; Mohanty et al., 2016; Tari et al., 2017; Ding et al., 2020; Saddique et al., 2020; Kim et al., 2021; Wang et al., 2021). Among them, DSSAT is a process-based model that uses meteorological, soil, and field management data to predict the growth and development of a specific crop. It has over 42 crop modules, such as CERES (CROP Environment Resource Synthesis) and CROPGRO (Crop Growth) in the DSSAT Cropping System Model (CSM). The DSSAT model has been widely used in studying the impacts of climate change on crop growth and the evaluation (assessment) of agronomic management practices (Jones et al., 2011). Hasan and Rahman (2019) used the DSSAT model and PRECIS (Predicting Regional Climate Impact Studies) model to simulate the impacts of future climate change on rice yield in Bangladesh. The results showed that the impacts of future climate change on the average rice yield for 2030s and 2050s are positive. However, as the temperature continues to rise, the impact becomes negative in 2070s, which can be mitigated by changing the transplanting date. A recent study by Rugira et al. (2021) used the DSSAT model to simulate the maize yield in Northern China under different agronomic management practices, then revealed that the sowing date of May 20 and supplementary irrigation of 170 mm during the tasseling and grouting phases could effectively improve the maize yield in Northern China. Moreover, the DSSAT CSM-CROPGRO-Soybean model has been widely used to predict the growth and development of soybean and explore the impacts of adjusting agronomic management practices on soybean yield (Júnior and Sentelhas, 2019; Fernandes et al., 2022). Although previous studies have investigated the impacts of climate change on agricultural production, the application of the DSSAT-CROPGRO-Soybean model in Northeast China, which is the main soybean production area in China, has rarely been reported.
Soybean (Glycine max) (Glycine Max (L.) Merrill), a legume crop, has high economic and nutritional value. As a food crop and oil crop, soybean is widely cultivated all around the world and plays a key role in global food security (Masuda and Goldsmithe, 2009; Li et al., 2010). China is the fourth largest soybean producer in the world (Klein and Luna, 2021). Due to the increasing growth of population, the production level still cannot meet the demand, so improving the soybean production level is of great significance to improve the national economy. Although soybeans are widely cultivated across China, approximately 50% of the total area of soybean cultivation in China is located in northeast China, due to its moderate soil and temperature conditions. Northeast China is the region with the highest production of spring soybean in China (He et al., 2013). Hence, it is important to study the impacts of future climate change on soybean yield in Northeast China.
In this study, Fujin city of Heilongjiang province was taken as an example, and the DSSAT-CROPGRO-Soybean model and two Representative Concentration Pathways (RCPs)—RCP4.5 and RCP8.5 were used. The objectives of this paper were to investigate the simulated trends of soybean yields under two RCPs; to assess the impacts of various agronomic management practices on soybean yield under future climate change; and to determine the best agronomic management practice to achieve an increase in soybean yield.
2 Materials and methods
2.1 Study area
Fujin city (132°01’E, 47°23’N) is located in the northeast of Heilongjiang Province and the south bank of the lower reaches of the Songhua River, with an average altitude of approximately 60 m (Figure 1). It has a temperate continental monsoon climate with four distinct seasons. During the soybean growing season (May-September) in Fujin city from 1961 to 2020, the average temperature was 18.2 °C, the average cumulative precipitation was 424.9 mm (accounting for 80.7% of the annual precipitation), and the average cumulative solar radiation was 18.32 MJ·m-2. In general, during 1986-2005, the average temperature, cumulative precipitation and cumulative solar radiation during the soybean growing season showed increasing trends, but the trends were not significant (Figure 2).
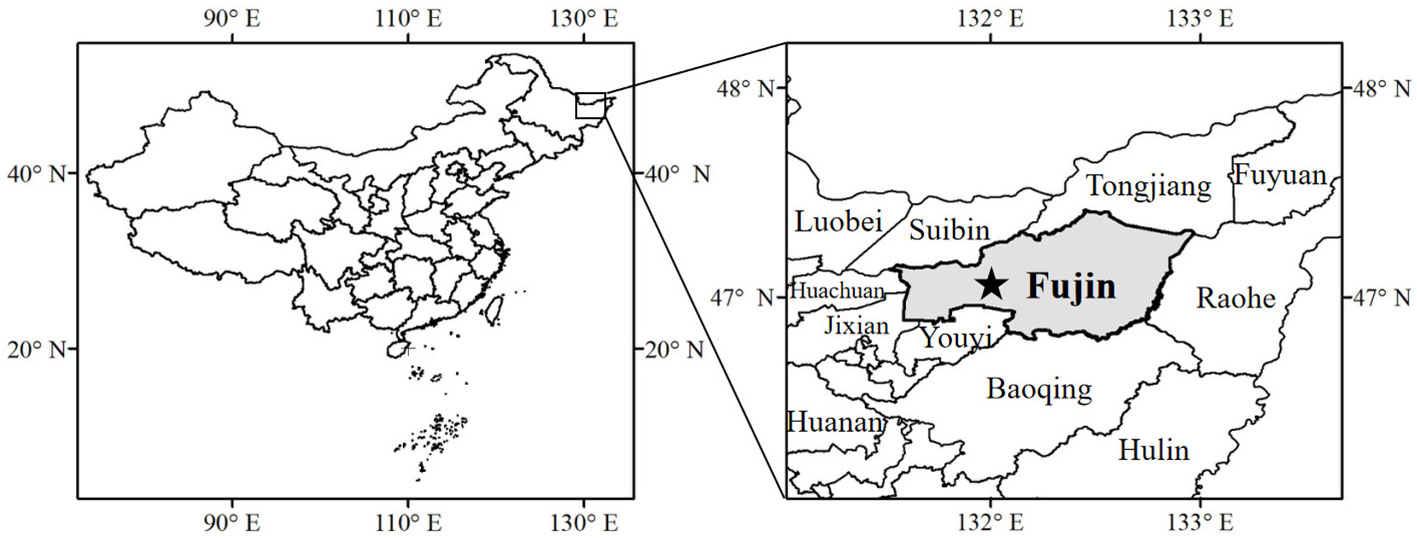
Figure 1 Geographical location of the study experimental station in Fujin city of Heilongjiang province.
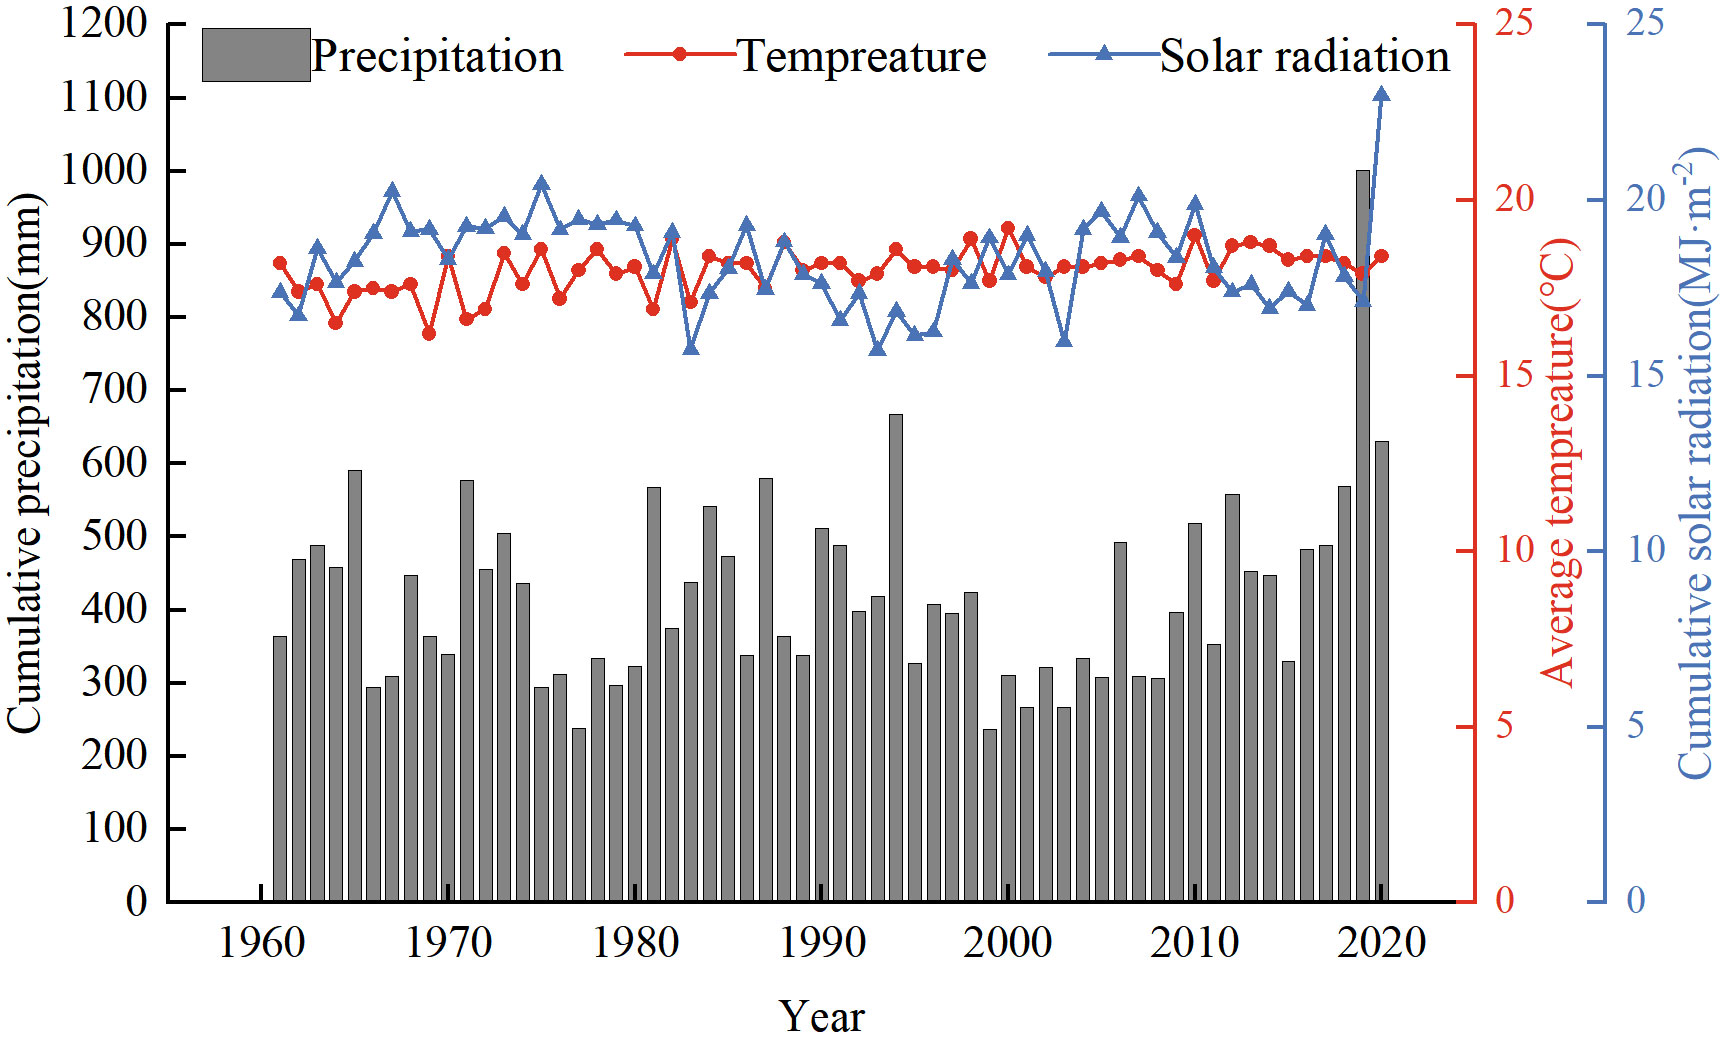
Figure 2 Time series of climatic elements (including cumulative precipitation, cumulative solar radiation, and average temperature) during the growing season (May to September) for soybean from1961 to 2020 in Fujin city of Heilongjiang province.
2.2 Data
2.2.1 Historical and future climate data
Historical daily climate data including average, maximum and minimum temperatures, precipitation and sunshine duration from 1960 to 2020 in Fujin city were obtained from National Meteorological Information Center (http://data.cma.cn/). To meet the data requirement to force the DSSAT model, sunshine duration was converted to solar radiation using the method provided by Allan et al. (1998). These data were used to calibrate and verify the genetic parameters of the soybean model and further to simulate the impacts of climate change on soybean yield in Fujin city.
Future daily climate data including average temperatures, cumulative precipitation and cumulative solar radiation during the period of 2021-2060 were obtained from the Institute of Agricultural Environment and Sustainable Development, Chinese Academy of Agricultural Sciences. The future climate scenario data were generated with higher horizontal resolution of 25 km×25 km dynamic downscaling based on the results of PRECIS (Providing REgional Climates for Impacts Studies) nested global model HadGEM2-ES simulation. This set of data has been widely used in studying the impacts of climate change, and its validity has also been verified in previous studies (Xu et al., 2006; Khiem et al., 2014; Massey et al., 2015; Liu et al., 2020; Meng et al., 2020). We further took the average of the gridded data within the region of Fujin city to represent the future climate scenario data at this research site. Four representative concentration pathways (RCP2.6, 4.5, 6.0, 8.5) were released by the Coupled Model Intercomparison Project phase 5 (CMIP5, Taylor et al., 2012). In this study, we only focus on the moderate (RCP4.5) and high (RCP8.5) emission scenarios for which radiative forcing rise to 4.5 W·m-2 and 8.5 W·m-2 by 2100, respectively. We chose 1986-2005 as a baseline, and four future periods representing the 2020s (2021-2030), 2030s (2031-2040), 2040s (2041-2050) and 2050s (2051-2060) to study the changes of climate factors and soybean yield in Fujin under RCP4.5 and RCP8.5.
2.2.2 Field data
We chose Kenong 30, which is commonly planted soybean variety in Fujin with high yield and protein, and is cultivated by Heilongjiang Bayi Agricultural University, to conduct the experiment. The data of field management practices, observations during the growing season, and yield were obtained from the experiment with phased sowing conducted at the Fujin experimental station in 2020. The experiment was divided into three phases, with the sowing dates of May 10, May 20 and May 30. The planting depth was 4 cm, and the planting density was 26 plants/m2. One week before sowing, the method of ridging and fertilizing was adopted.
The DSSAT model was used to simulate the soybean yield during the base period of 1986-2005, and the farmland management measures were set as follows: a) no chemical treatment was used to control pests and diseases; b) there were no irrigated treatments, only rain-fed treatments; c) the recommended fertilizer levels were applied, including 200 kg/ha DAP (diammonium phosphate), 90 kg/ha urea and 60 kg/ha potassium chloride, and no topdressing was carried out after sowing; d) based on the prevailing local practices, the sowing date was on May 20, the plant density was 19 plants/m2, and the planting depth was 4 cm.
The soil data of Fujin agro-meteorological experimental station were obtained from the Chinese soil science database (http://vdb3.soil.csdb.cn), including soil color, type, depth, total nitrogen, cation exchange capacity, organic carbon and PH values, etc.
2.3 Methods
In this study, the CSM-CROPGRO-Soybean, embedded within DSSAT version 4.7.0 (Jones et al., 2003; Hoogenboom et al., 2017; Hoogenboom et al., 2019) was used, and meteorological data, soil data and field management data were input into the model to simulate soybean growth and yield under different climate scenarios. The crop model inputs include: (1) meteorological data, including the name, altitude, latitude and longitude of the stations, and the daily meteorological data (maximum and minimum air temperature, precipitation, solar radiation); (2) soil data, including soil color, type, depth, total nitrogen, cation exchange capacity, organic carbon and PH values; (3) field management data, including planting method, density, depth, irrigation time and amount; (4) genetic coefficients: there are total 16 genetic coefficients for soybean, including SCDL, PPSEN, EM-FL, etc. Moreover, the crop variety parameters reflect the interaction between variety genotype and environment, which could affect the accuracy of crop yield simulation results. We calibrated and validated the genetic coefficients of the experimental variety with field observations, including the dates of emergence, flowering and maturity, above-ground biomass and final yield in 2020 at the experimental station.
We used the statistical indices of root mean square error (RMSE), normalized root mean square error (NRMSE), correlation coefficient (R2) and Willmott’s index of agreement (D) for the simulated and observed data to evaluate the calibrated model. These indices were calculated (Equations 1-4) as follows:
Where k is the number of samples,Xiand Yiare the ith observed and simulated data, and and are the mean values of all observed and simulated samples.
In the DSSAT-CROPGRO-Soybean model, we adjusted two agronomic management practices that are adjusting sowing date and supplementary irrigation to analyze their effects on soybean yield. In this study, we ran crop simulations by adjusting sowing dates at an interval of 5 days from April 30 to June 9, a total of 9 adjustment plans of sowing dates. Supplemental irrigation was applied four times in the key stage of soybean growth (flowering and podding period), with an interval of 20 days starting from 20 days before the flowering date. The sprinkler irrigation was used, and the irrigation amount was set for five levels of 10, 20, 30, 40 and 50 mm.
3 Results
3.1 Model calibration and validation
In the DSSAT-CROPGRO-Soybean model, we calibrated and validated the genetic coefficients of the experimental soybean variety with field data during the growing season in 2020 at the experimental station in Fujin city of Heilongjiang province. The black dotted line in Figure 3 is 1:1 line. The closer the value is to the 1:1 line, the closer the model simulation value is to the observed value. We found that the simulated and observed values for the length of growing season (days after sowing), above-ground biomass and yield were round the 1:1 line, showing high goodness of fitting for these indices. Moreover, we calculated the statistical indices of root mean square error (RMSE), normalized root mean square error (NRMSE), correlation coefficient (R2) and Willmott’s index of agreement (D) between the simulated and observed agricultural indices including emergence, flowering and maturity dates, above-ground biomass and yield. The results showed that the values of both R2 and D were close to 1, and the NRMSE was below 20% (Table 1). Therefore, the calibrated DSSAT-CROPGRO-Soybean model is suitable for simulating soybean in Fujin.
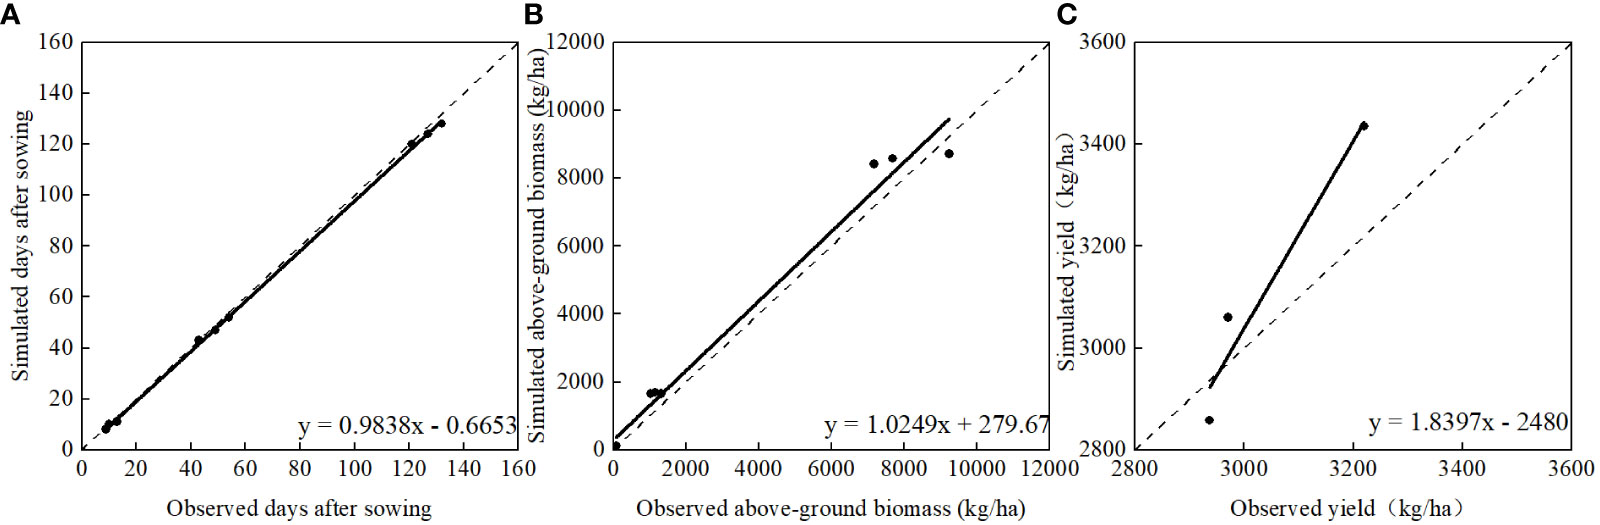
Figure 3 Comparison of simulated values (Y-axes) and observed values (X-axes) for (A) days after sowing, (B) above-ground biomass and (C) yield in 2020 at the experimental station in Fujin of Heilongjiang province.
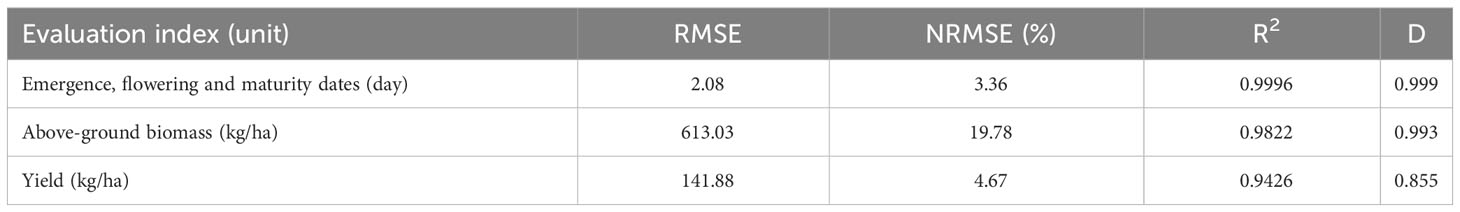
Table 1 Statistical indices including root mean square error (RMSE), normalized root mean square error (NRMSE), correlation coefficient (R2) and Willmott’s index of agreement (D) between simulated and observed agricultural indices including emergence, flowering and maturity dates, above-ground biomass and yield in 2020 at the experimental station in Fujin city of Heilongjiang province.
3.2 Climate projections
3.2.1 Cumulative precipitation change
During the study period of 2021-2060, the cumulative precipitation during the growing season showed large fluctuations from 292.8 mm to 734.3 mm under RCP4.5, and from 299.9 mm to 808.8 mm under RCP8.5. The cumulative precipitation during the growing season was basically below 700 mm, and only exceeded 700 mm in 2038 under RCP4.5 and in 2050s under RCP8.5.The average values under RCP4.5 and RCP8.5 were 458.4 mm and 479.8 mm, respectively (Figure 4). Under RCP4.5, there was no significant increasing or decreasing trend in precipitation during the growing season. However, there was an increasing trend under RCP8.5 at a rate of 24.8 mm per decade (p>0.05) (Figure 4B).
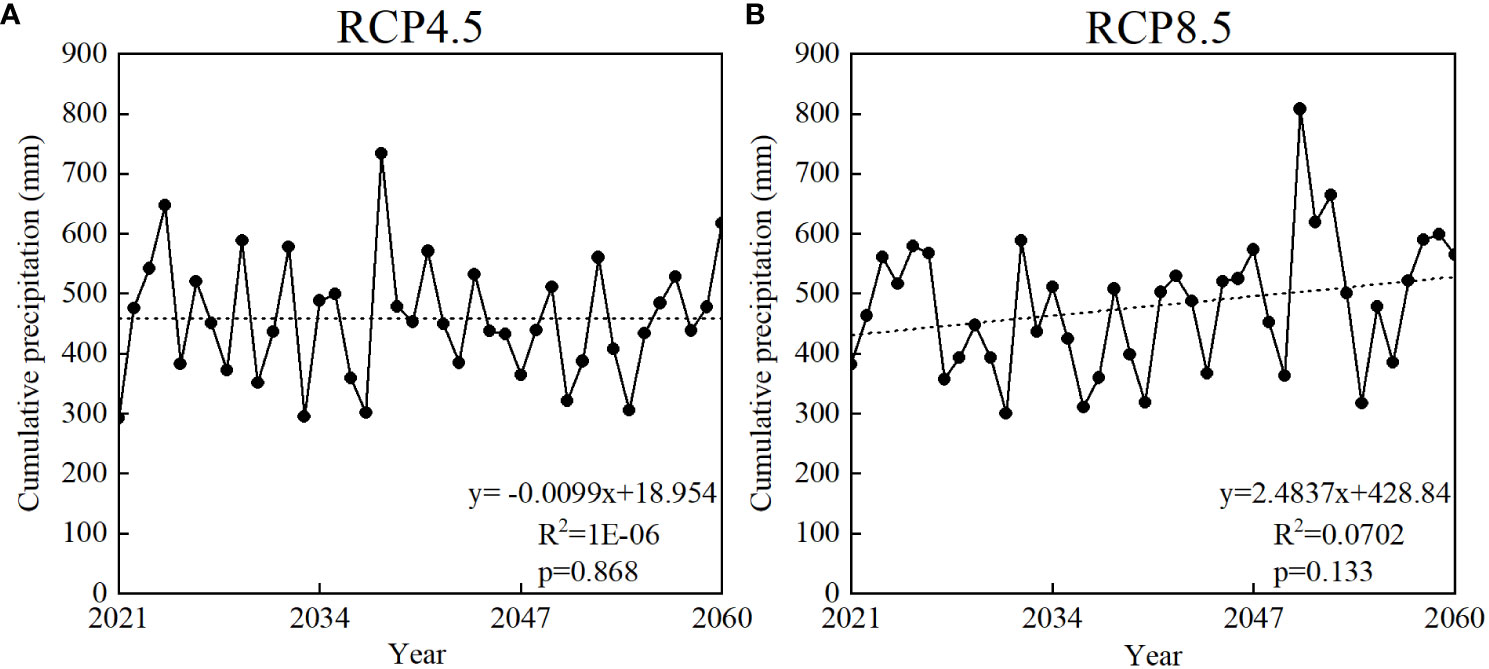
Figure 4 Time series of cumulative precipitation during the growing season of soybean from 2021 to 2060 under (A) RCP4.5 and (B) RCP 8.5 in Fujin city of Heilongjiang province.
Compared to the baseline (1986-2005), when the average cumulative precipitation during the growing season was 389.8 mm, the average cumulative precipitation in each decadal period would all increase. They would increase by 18.7%, 15.2%, 11.4% and 19.0% in the 2020s (2021-2030), 2030s (2031-2040), 2040s (2041-2050) and 2050s (2051-2060) under RCP4.5, while under RCP8.5, precipitation would increase by 19.6%, 4.3%, 20.6% and 34.5%, respectively (Figure 5).
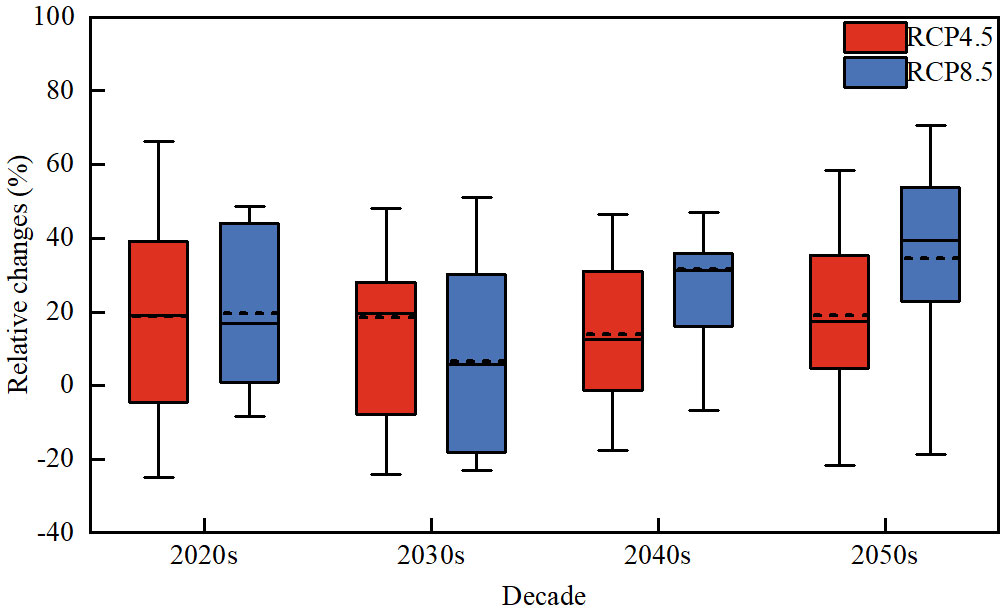
Figure 5 Changes in cumulative precipitation during the growing season of soybean in the four periods (2020s, 2030s, 2040s and 2050s) relative to the baseline(1986-2005) under RCP4.5 and RCP8.5 in Fujin city of Heilongjiang province.(The lower and upper boundary lines of the box are the first and third quartiles of the data. Two solid vertical lines indicate the remaining data. Inside the box, the solid black line indicates the median of the data and the dashed black line indicates the mean of the data.).
3.2.2 Cumulative solar radiation change
During the study period of 2021-2060, the cumulative solar radiation during the growing season showed an increasing trend under both RCP4.5 at a rate of 32.7 MJ·m-2 per decade (p>0.05) and RCP8.5 at a relatively slower rate of 14.0 MJ·m-2 per decade (p>0.05). The range of cumulative solar radiation fluctuations under RCP8.5 was larger than that under RCP4.5, from 2300.9 MJ·m-2 to 3041.7 MJ·m-2 (Figure 6).
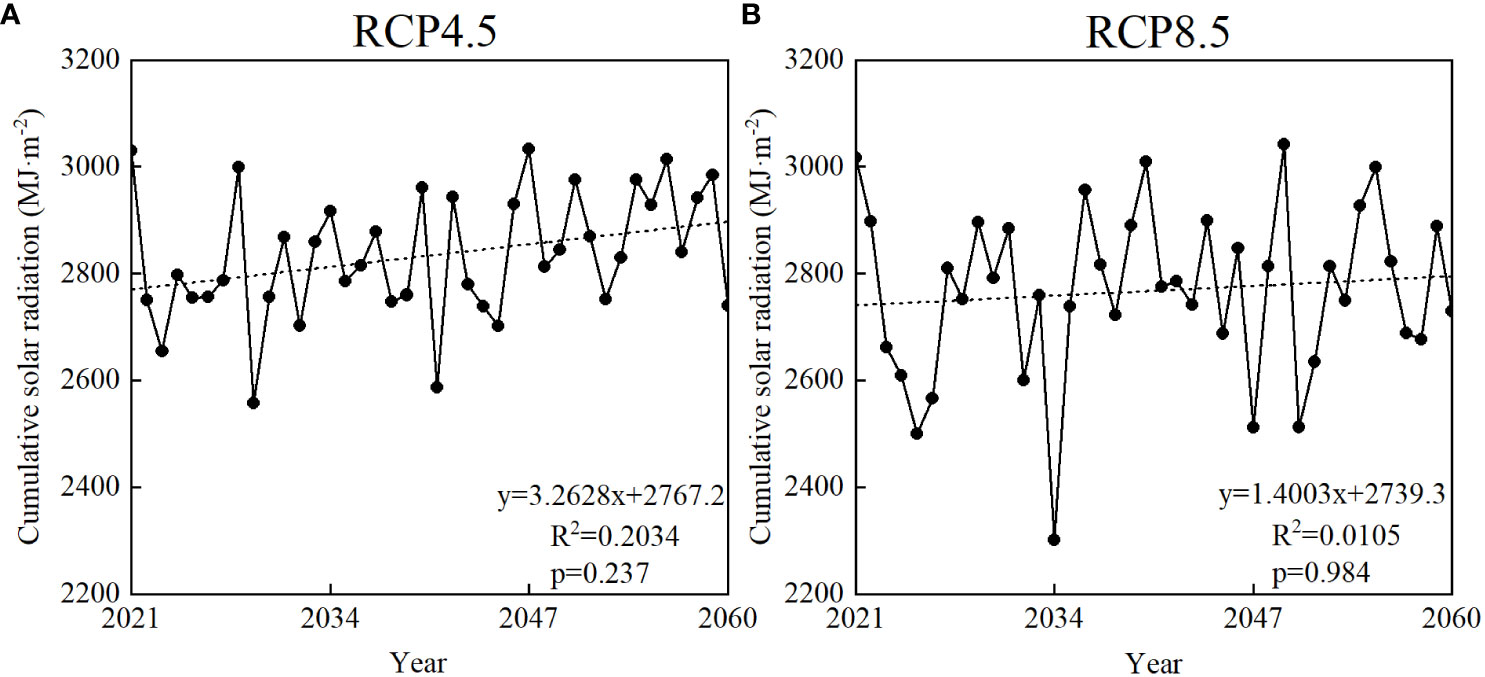
Figure 6 Time series of cumulative solar radiation during the growing season of soybean from 2021 to 2060 under (A) RCP4.5 and (B) RCP 8.5 in Fujin city of Heilongjiang province.
Compared to the baseline when the cumulative solar radiation during the growing season was 2766.8 MJ·m-2, the solar radiation would increase by 1.5%, 2.9%, 3.1% and 5.3% in the 2020s, 2030s, 2040s and 2050s under RCP4.5, while under RCP8.5, they would increase by 0.3%, 0.9%, 0.7% and 1.8%, respectively (Figure 7).
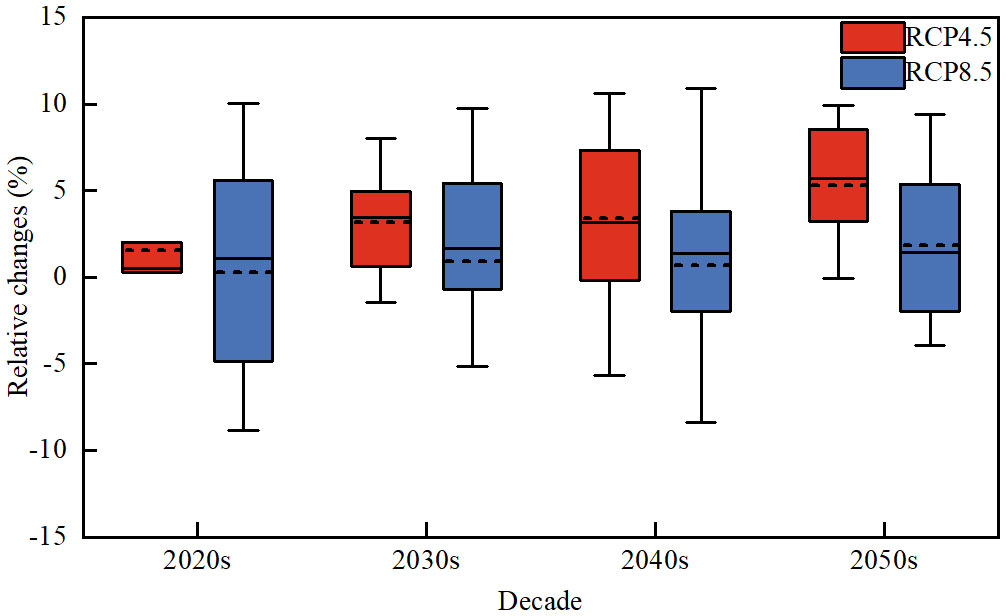
Figure 7 Changes in cumulative solar radiation during the growing season of soybean in the four periods (2020s, 2030s, 2040s and 2050s) relative to the baseline(1986-2005) under RCP4.5 and RCP8.5 in Fujin city of Heilongjiang province.(The lower and upper boundary lines of the box are the first and third quartiles of the data. Two solid vertical lines indicate the remaining data. Inside the box, the solid black line indicates the median of the data and the dashed black line indicates the mean of the data.).
3.2.3 Average temperature change
The average temperature during the growing season showed a significant increasing trend from 2021 to 2060 under both RCP4.5 and RCP8.5. The amplitude of the increasing trend under RCP8.5 (0.81 °C per decade, p<0.001) was greater than that under RCP4.5 (0.51 °C per decade, p<0.001) (Figure 8), due to the higher concentration of greenhouse gas emissions.
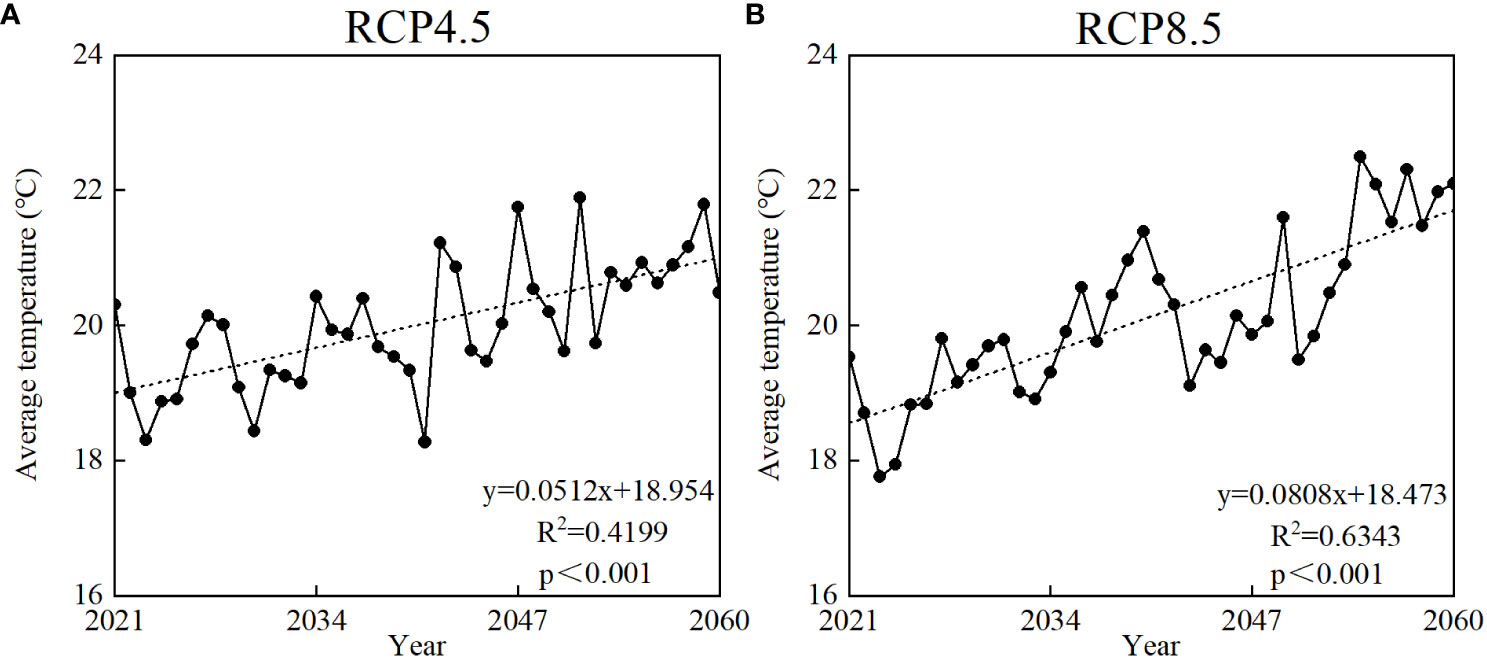
Figure 8 Time series of average temperature during the growing season of soybean from 2021 to 2060 under (A) RCP4.5 and (B) RCP 8.5 in Fujin city of Heilongjiang province.
The average temperature during the period of 1986-2005 varied from 16.3 °C to 19.9 °C, and the projected average temperature would vary from 18.3 °C to 21.9 °C under RCP4.5 and from 17.8 °C to 22.5 °C under RCP8.5, respectively, for 2021-2060. Compared to the baseline, the average temperature would gradually increase over timer for the four future decades under both RCP 4.5 and RCP8.5, and the increase in the 2020s, 2030s, 2040s and 2050s under RCP4.5 (RCP 8.5) would be 7.8% (6.1%), 8.3% (9.7%), 10.5% (9.8%), and 16.8% (20.4%), respectively (Figure 9).
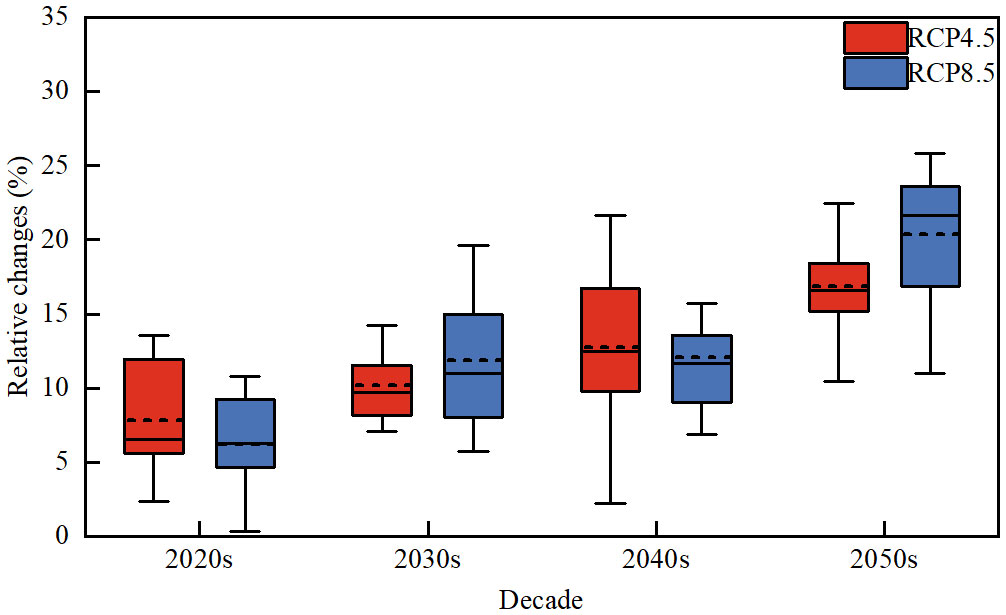
Figure 9 Changes in average temperature during the growing season of soybean in the four periods (2020s, 2030s, 2040s and 2050s) relative to the baseline(1986-2005) under RCP4.5 and RCP8.5 in Fujin city of Heilongjiang province.(The lower and upper boundary lines of the box are the first and third quartiles of the data. Two solid vertical lines indicate the remaining data. Inside the box, the solid black line indicates the median of the data and the dashed black line indicates the mean of the data.).
3.3 Potential impacts of future climate scenarios on soybean yield
According to the IPCC AR5 (IPCC, 2013), the CO2 concentrations in the 2020s, 2030s, 2040s and 2050s under RCP4.5 (RCP 8.5) will be 424 ppm (433 ppm), 449 ppm (470 ppm), 475 ppm (517 ppm) and 499 ppm (574 ppm), respectively. Considering the effect of CO2, the soybean yield in Fujin city would increase in the future as compared to the base period of 1986-2005, and the relative increase rate under RCP8.5 would be higher than that under RCP4.5 except for the 2030s. Compared to the baseline, the soybean yield would increase by 0.6%, 3.3%, 6.0% and 12.3% in the 2020s, 2030s, 2040s and 2050s under RCP4.5. Moreover, under RCP8.5, the average soybean yield would increase at rates of 7.4%, 5.1%, 16.8% and 20.6%, respectively (Figure 10). The results indicated that future climate change in Fujin city was beneficial to the increase in soybean yield. Furthermore, the increasing rate under RCP8.5 was greater than that under RCP4.5.
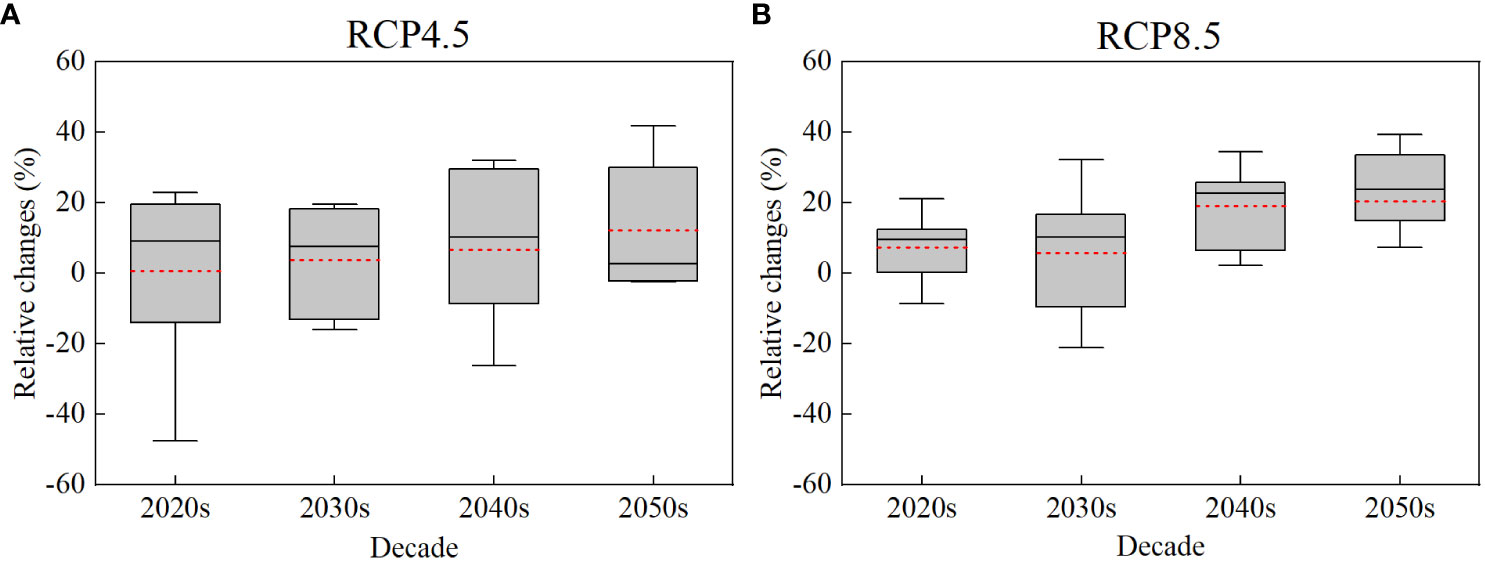
Figure 10 Changes in soybean yield during the growing season of soybean in the four periods (2020s, 2030s, 2040s and 2050s) relative to the baseline(1986-2005) under (A) RCP4.5 and (B) RCP 8.5 in Fujin city of Heilongjiang province.(The lower and upper boundary lines of the box are the first and third quartiles of the data. Two solid vertical lines indicate the remaining data. Inside the box, the solid black line indicates the median of the data and the dashed red line indicates the mean of the data.).
3.4 Agronomic management practices
To adapt to the impact of future climate change on crop yield, agronomic management practices are often adopted to achieve yield increase, such as changing crop varieties, adjusting sowing date, supplementary irrigation (Moradi et al., 2013; Teixeira et al., 2018; Zabel et al., 2021). As the temperature increases under future climate conditions, the length of growing season will change, so selecting suitable sowing date could promote the growth and development of soybean. Moreover, due to the large water consumption of soybean growth, we also adopted the method of supplementary irrigation during soybean growth and development to achieve an increase in soybean yield under future climate conditions.
In this study, we used the DSSAT-CROPGRO-Soybean model to evaluate two agronomic management practices that are adjusting sowing date and supplementary irrigation, in order to propose optimal agricultural measures to maximize soybean yield in Fujin under future climate change.
3.4.1 Adjustment of sowing date
In this paper, we ran crop simulations by adjusting sowing dates at an interval of 5 days from April 30 to June 9 to assess the impact of such adjustments on the soybean yield, in order to determine the optimal sowing date. The results showed that advancing the sowing date is beneficial to the adaptation of soybean production to future climate change in Fujin. As shown in Figure 11, the sowing date was set on May 10 to achieve the maximum yield under RCP4.5, which would increase by 3.6% relative to the yield at the unadjusted sowing date. Under RCP8.5, the maximum soybean yield would be achieved on the sowing date of May 5, 15 days earlier than the prevailing local sowing date. In addition, the soybean yield would increase by 9.2% relative to that at the unadjusted sowing date.
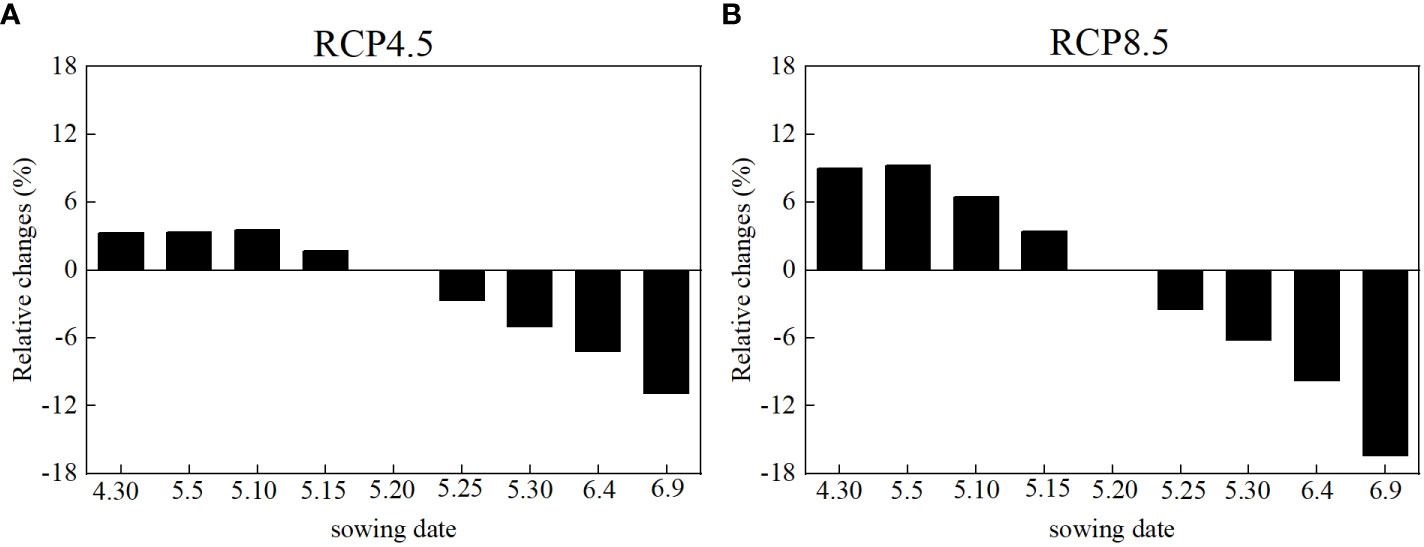
Figure 11 Changes in the average soybean yield at different sowing dates (from April 30 to June 9, at an interval of 5 days) as compared to the average yield at the unadjusted sowing date (May 20) during the study period of 2021-2060 under (A) RCP4.5 and (B) RCP 8.5 in Fujin city of Heilongjiang province.
From the perspective of decadal analysis, the sowing dates for soybean yield maximization in different decades are different. As shown in Figure 12, the optimal sowing dates in the 2020s, 2030s, 2040s and 2050s are May 10 (April 30), May 5 (April 30), April 30 (May 5) and May 10 (May 5) respectively, under RCP4.5 (RCP8.5).
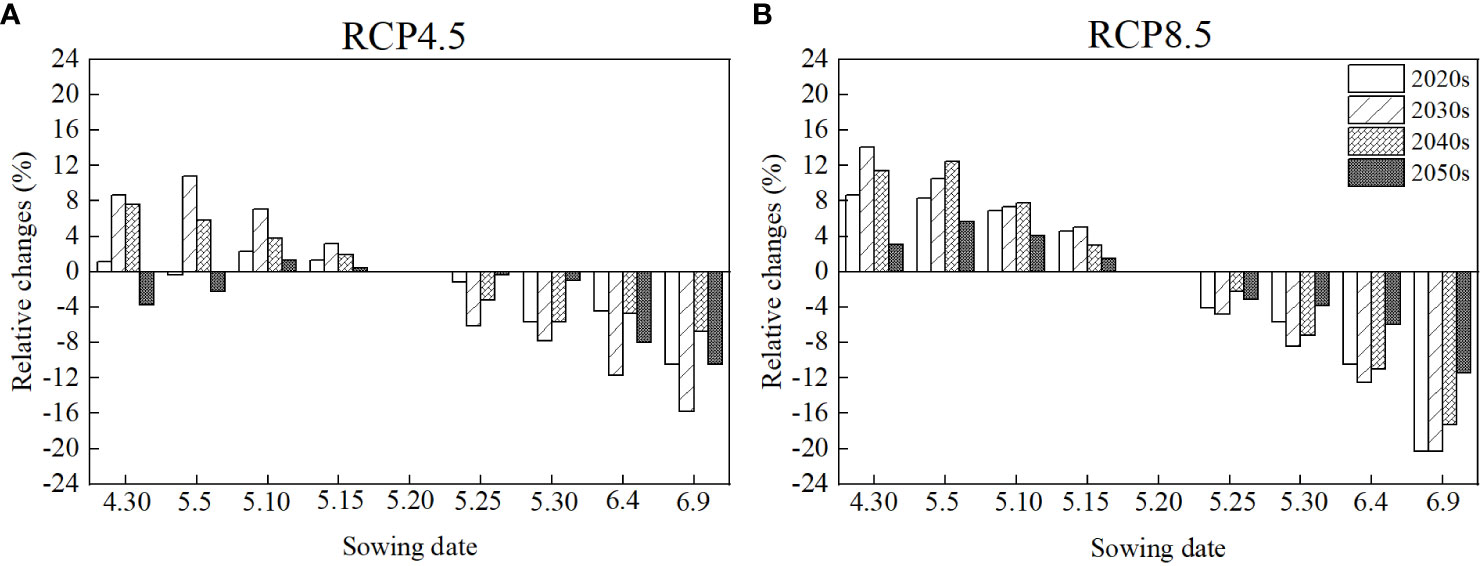
Figure 12 Changes in the average soybean yield at different sowing dates (from April 30 to June 9, at an interval of 5 days) as compared to the average yield at the unadjusted sowing date (May 20) in the 2020s, 2030s, 2040s and 2050s under (A) RCP4.5 and (B) RCP 8.5 in Fujin city of Heilongjiang province.
3.4.2 Supplemental irrigation
Supplemental irrigation was applied four times in the key stage of soybean growth (flowering and podding period), with an interval of 20 days starting from 20 days before the flowering date. The irrigation amount was set for five levels of 10, 20, 30, 40 and 50 mm. We adopted four time supplemental irrigation treatments in the soybean simulation in Fujin. The results showed that during the study period of 2021-2060, the optimal supplemental irrigation amount was 50 mm (200 mm in total) under RCP4.5 with a potential 28.2% increase in soybean yield as compared to the rain-fed treatment, whereas under RCP8.5, the optimal supplemental irrigation amount was 40 mm (160 mm in total) with a potential 10.3% increase in soybean yield as compared to the rain-fed treatment (Figure 13). Moreover, the highest increase in soybean yield as compared to the rain-fed treatment was at the irrigation amount of 40 mm (40 mm), 50 mm (50 mm), 40 mm(10 mm) and 50 mm (30 mm) in the 2020s, 2030s, 2040s and 2050s, respectively, under RCP4.5 (RCP8.5) (Figure 14).
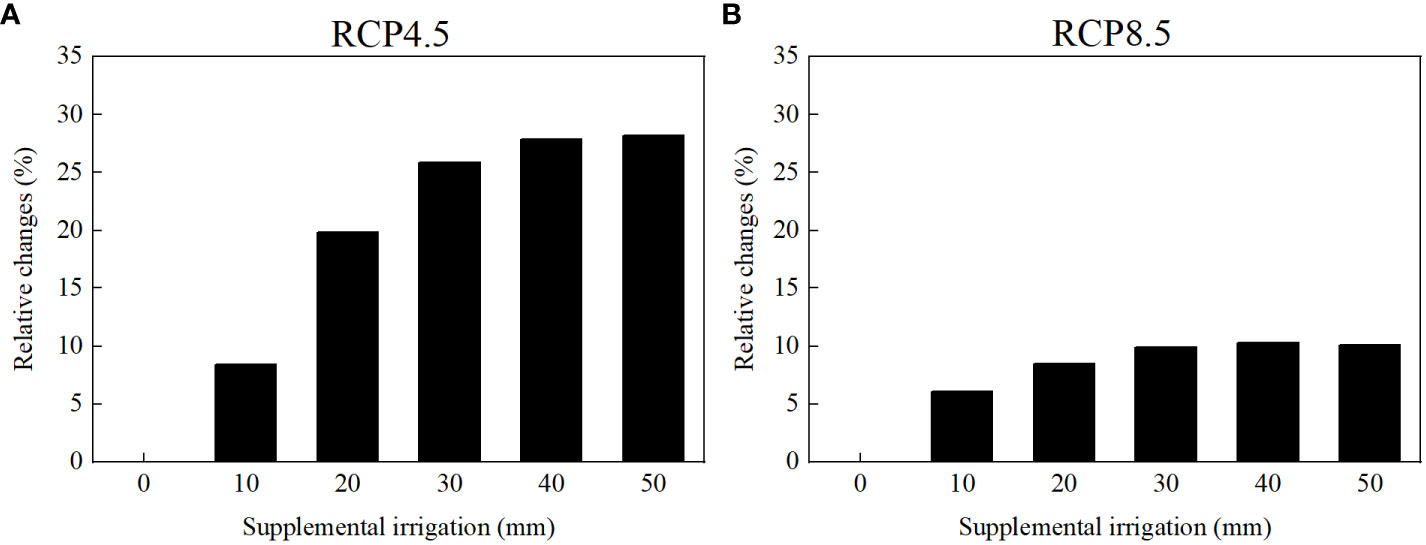
Figure 13 Changes in the average soybean yield at different irrigation amounts (10 mm, 20 mm, 30 mm, 40 mm and 50 mm) as compared to the rain-fed treatment during the study period of 2021-2060 under (A) RCP4.5 and (B) RCP 8.5 in Fujin city of Heilongjiang province.
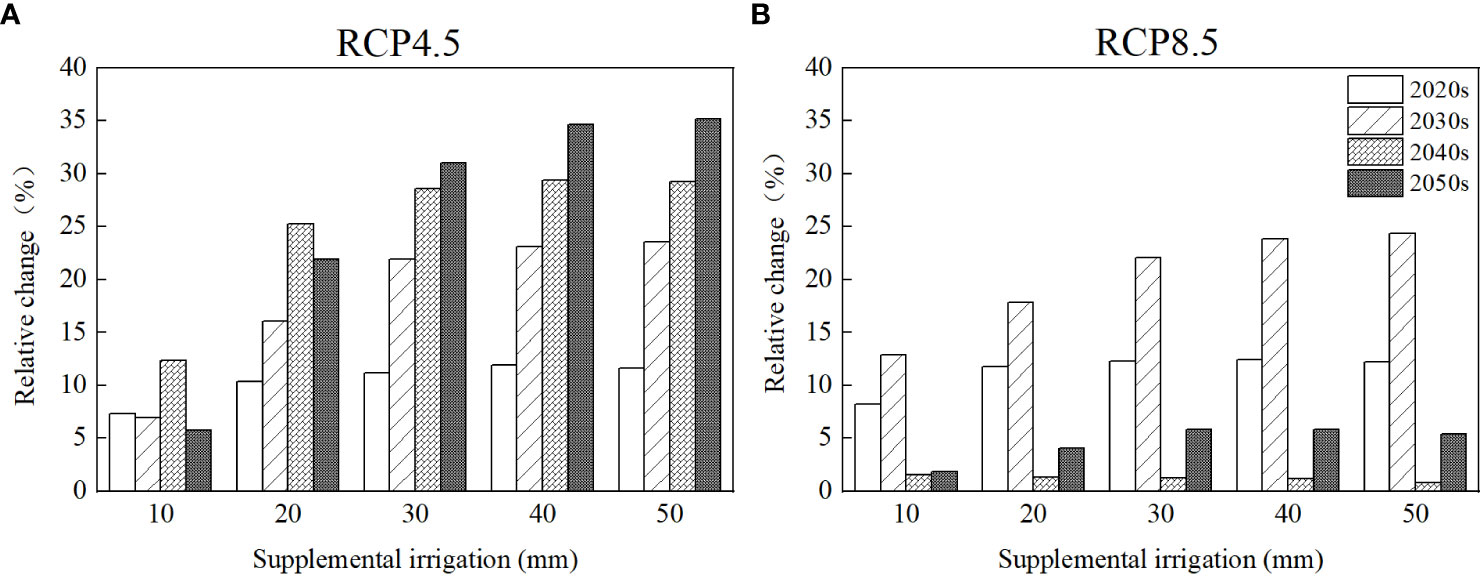
Figure 14 Changes in the average soybean yield at different irrigation amounts (10 mm, 20 mm, 30 mm, 40 mm and 50 mm) as compared to the rain-fed treatment in the 2020s, 2030s, 2040s and 2050s under (A) RCP4.5 and (B) RCP 8.5 in Fujin city of Heilongjiang province.
4 Discussion
4.1 The variation of future climate resources
From the perspective of precipitation, Wu et al. (2019) pointed out that, by the end of the century, the average precipitation in China would increase by 8% (12%) under RCP4.5 (RCP8.5) relative to the average during the period of 1971-2000, and spatially, precipitation in the north is expected to increase more than that in the south. From the perspective of temperature, You et al. (2014) predicted that the average temperature in China would increase by 0.29 °C per decade (0.43 °C per decade) under RCP4.5 (RCP8.5) during 2021-2040. In Northeast China, Chu et al. (2017) pointed out that the temperature increase rate is expected to be 0.19 °C per decade (0.48 °C per decade) under RCP4.5 (RCP8.5) during 2005-2099. By the end of this century, precipitation in the growing season generally showed an increasing trend, but the increasing trend was not obvious. Dong et al. (2018) also pointed out that the Northeast region is expected to experience significant warming under the RCP4.5 scenario during 2020-2050. In this study, we found similar trends in cumulative precipitation and average temperature in soybean growing season during 2021-2060 in Fujin city of Heilongjiang Province in Northeast China.
4.2 Effects of future climate conditions on soybean yield
Soybean is a thermophilic crop, and the optimum temperature during the growing season is above 20 °C (Hesketh et al., 1973; Hatfield et al., 2011). However, Fujin city is located in Northeast China with higher latitude and lower temperature. The average temperature from May to September is lower than 20 °C. Therefore, future temperature increases under RCP4.5 and RCP8.5 would promote soybean yield in Fujin. Chen et al. (2012) studied the relationship between temperature and soybean yield in Northeast China, then found that crop yield increased with the increasing temperature in Northeast China. This suggests that climate warming may be beneficial to future crop production in the study area, which is consistent with the results of this study. At the same time, under the two climate scenarios, the atmospheric CO2 concentration would increase in the future, which would increase photosynthesis of crop leaves and thus improve crop productivity. This phenomenon is called the “CO2 fertilization effect”, which is obvious in C3 crops (soybean, rice, wheat, etc.) (Kimball et al., 2002). In addition, under non-stress conditions, when the CO2 concentration increases by 200 ppm, the yield of C3 crops would increase by 18% (Ainsworth and Long, 2020). This may be one of the possible reasons for the increase in soybean yield in the future in Fujin city.
4.3 Adjustment of agronomic management practices
Sunshine duration and temperature have a great impact on the length of soybean growth period, and thus affect the yield of soybean. For soybean, the availability of these climatic factors is determined by sowing date. Appropriate adjustment of sowing date can minimize the loss of soybean yield caused by adverse meteorological conditions (Cober and Voldeng, 2001; Serafin-Andrzejewska et al., 2021). Zhang et al. (2019) studied the variation in the irrigation water requirement of soybean under future climate scenarios (RCP2.6, RCP4.5 and RCP8.5), and found that with the increase in future temperature and CO2 concentration, the soybean planted may have lower nutrients, which would increase the amount of water needed for soybean to produce the required calories, so supplementary irrigation at the critical stage of soybean growth may increase soybean yield. Therefore, in order to make the growth of soybean in Fujin city adapt to the future climatic conditions and achieve higher yield, it is necessary to adjust the agronomic management practices, including adjusting sowing date and supplementing irrigation in the key stage of soybean growth.
4.4 DSSAT-CROPGRO-soybean model
According to previous studies, the DSSAT model can be used for a wide range of purposes, for example, simulating crop yields under future climate change, such as maize, wheat, soybean and other crops (Boote et al., 2017; Liu et al., 2020; Bai and Gao, 2021); evaluating the impacts of management practices, such as adjusting sowing date and irrigation amount on crop yield (Banterng et al., 2010; Wang et al., 2020). Moreover, the CROPGRO-Soybean model has been widely used to simulate the growth and development of soybean and explore the impacts of management practices on soybean yield (Ruiz-Nogueira et al., 2001). However, the application of the DSSAT-CROPGRO-Soybean model in Northeast China, which is the main soybean production area in China, has rarely been reported. Our case study in Fujin city is a pioneer to adopt this model to simulate the soybean yield under future climate change and investigate the impacts of different agronomic measures on soybean yield, which has some practical guiding significance.
4.5 Limitations and prospects of the study
However, there are some limitations of the results in this study. First, our case study was limited to one experimental station in Fujin city. To expand the research to the entire Northeast China and even the whole country, more experimental stations would need to be involved. Second, there were few schemes to explore better agronomic management practices for the future climate change. In summary, future studies on the impacts of future climate change on soybean yield should focus on the following: 1) collecting crop data from multiple experimental stations to expand the research to the entire Northeast China and even the whole country; 2) testing out more relevant agronomic management practices; 3) the experiment time in this paper was short, and more experimental data are needed in the future to improve the accuracy of the model; 4) we only used the DSSAT model in this study, and more models could be applied and compared to simulate the impacts of future climate change on soybean yield in the future; and 5) in this study, only a single soybean crop variety was studied. Future research could involve multiple soybean varieties to assess their adaptability to future climate change and determine the best soybean varieties to adapt to future climate change.
5 Conclusions
In this study, we used the DSSAT-CROPGRO-Soybean model to simulate the changes in soybean yield under two future climate scenarios (RCP4.5 and RCP8.5) during the period of 2021-2060 in Fujin city of Heilongjiang Province, and evaluated the impacts of different agronomic management practices such as adjustment of sowing date and supplemental irrigation on soybean yield under future climate change conditions to determine the best agronomic management practice to adapt to future climate change.
The results showed that the cumulative solar radiation and average temperature during the growth period of soybean from 2021 to 2060 in Fujin city showed an increasing trend under RCP4.5 and RCP8.5, and average temperature was expected to significantly increase at the rate of 0.5 °C per decade (0.8 °C per decade) under RCP4.5 (RCP8.5). The cumulative precipitation during the soybean growing season in Fujin city was expected to fluctuate greatly with no obvious trend during 2021-2060. Compared to the baseline (1986-2005), these three meteorological elements would increase in the next four decades. In addition, the soybean yield in Fujin city would increase by 5.0% (12.0%), 8.3% (3.3%), 11.5% (24.3%) and 17.2% (25.8%) in the 2020s, 2030s, 2040s and 2050s relative to the baseline (1986-2005) under RCP4.5 (RCP8.5). Moreover, under RCP4.5 (RCP8.5), the optimal sowing date of May 10 (May 5) and the optimal supplemental irrigation amount of 50 mm (40 mm),which would result in an increase in soybean yield by 3.6% (9.2%) and 28.2% (10.3%), respectively. These results provide a scientific basis for farmers from the perspective of tackling future climate change and ensuring yields, but these measures have timeliness, therefore, we suggest paying continuous attention to the adjustment of agronomic management practices in the future, and cultivating new varieties, in order to achieve a high and stable soybean yield in Heilongjiang province.
Data availability statement
The raw data supporting the conclusions of this article will be made available by the authors, without undue reservation.
Author contributions
YL: Conceptualization, Formal Analysis, Methodology, Validation, Writing – original draft, Writing – review & editing, Resources. JC: Formal Analysis, Methodology, Validation, Writing – original draft, Writing – review & editing, Resources. XG: Conceptualization, Methodology, Supervision, Validation, Writing – original draft, Writing – review & editing, Resources. LZ: Data curation, Writing – review & editing. LW: Supervision, Validation, Writing – original draft, Writing – review & editing. CR: Supervision, Validation, Writing – review & editing.
Funding
The author(s) declare financial support was received for the research, authorship, and/or publication of this article. This work was supported by the National Key Research and Development Program of China (2019YFD1002204).
Acknowledgments
We thank Mingyu Li for helping with the DSSAT model. The authors are grateful to the editors and reviewers for their constructive comments to improve the manuscript.
Conflict of interest
The authors declare that the research was conducted in the absence of any commercial or financial relationships that could be construed as a potential conflict of interest.
Publisher’s note
All claims expressed in this article are solely those of the authors and do not necessarily represent those of their affiliated organizations, or those of the publisher, the editors and the reviewers. Any product that may be evaluated in this article, or claim that may be made by its manufacturer, is not guaranteed or endorsed by the publisher.
References
Ainsworth E. A., Long S. P. (2020). 30 years of free-air carbon dioxide enrichment (FACE): What have we learned about future crop productivity and its potential for adaptation? Global Change Biol. 27 (1), 27–49. doi: 10.1111/gcb.15375
Allan R. G., Pereira L. S., Raes D., Smith M. (1998). Crop evapotranspiration-guidelines for computing crop water requirements-FAO Irrigation and drainage paper 56 (Rome: FAO).
Bai Y., Gao J. (2021). Optimization of the nitrogen fertilizer schedule of maize under drip irrigation in Jilin, China, based on DSSAT and GA. Agric. Water Manage. 244, 106555. doi: 10.1016/j.agwat.2020.106555
Baldos U. L. C., Fuglie K. O., Hertel T. W. (2020). The research cost of adapting agriculture to climate change: A global analysis to 2050. Agric. Econ. 51 (2), 207–220. doi: 10.1111/agec.12550
Banterng P., Hoogenboom G., Patanothai A., Singh P., Wani S. P., Pathak P., et al. (2010). Application of the cropping system model (CSM)-CROPGRO-Soybean for determining optimum management strategies for soybean in tropical environments. J. Agron. Crop Sci. 196 (3), 231–242. doi: 10.1111/j.1439-037X.2009.00408.x
Boote K. J., Prasad V., Allen L. H., Singh P., Jones J. W. (2017). Modeling sensitivity of grain yield to elevated temperature in the DSSAT crop models for peanut, soybean, dry bean, chickpea, sorghum, and millet. Eur. J. Agron. 100, 99–109. doi: 10.1016/j.eja.2017.09.002
Cai C., Yin X., He S., Jiang W., Si C., Struik P. C., et al. (2016). Responses of wheat and rice to factorial combinations of ambient and elevated CO2 and temperature in FACE experiments. Global Change Biol. 22 (2), 856–874. doi: 10.1111/gcb.13065
Chen C., Qian C., Deng A., Zhang W. (2012). Progressive and active adaptations of cropping system to climate change in Northeast China. Eur. J. Agron. 38, 94–103. doi: 10.1016/j.eja.2011.07.003
Chu Z., Guo J., Zhao J. (2017). Impacts of future climate change on agroclimatic resources in Northeast China. J. Geog. Sci. 27 (9), 1044–1058. doi: 10.1007/s11442-017-1420-6
Cober E. R., Voldeng H. D. (2001). A new soybean maturity and photoperiod-sensitivity locus linked to E1 and T. Crop Sci. 41 (3), 698–701. doi: 10.2135/cropsci2001.413698x
Darwin R. F., Tsigas M., Lewandrowski J., Raneses A. (1995). World agriculture and climate change: economic adaptations (America, Washington: Agricultural Economic Report, No. 703, U.S. Department of Agriculture).
Ding Y., Wang W., Zhuang Q., Luo Y. (2020). Adaptation of paddy rice in China to climate change: The effects of shifting sowing date on yield and irrigation water requirement. Agric. Water Manage. 228, 105890. doi: 10.1016/j.agwat.2019.105890
Dong Z., Song Y., Tian J. (2018). Estimation of drought change trends in Northeast China in 2020-2050 and its impact on maize yield. J. Geosci. Environ. Prot. 6 (12), 185–201. doi: 10.4236/gep.2018.612016
Fernandes R. D. M., Melo D. D., Elli E. F., Battisti R. (2022). Climate change impacts on rainfed and irrigated soybean yield in Brazil’s new agricultural frontier. Theor. Appl. Climatol. 147, 803–816. doi: 10.1007/S00704-021-03865-W
Guo R., Lin Z., Mo X., Yang C. (2009). Responses of crop yield and water use efficiency to climate change in the North China Plain. Agric. Water Manage. 97 (8), 1185–1194. doi: 10.1016/j.agwat.2009.07.006
Hasan M. M., Rahman M. M. (2019). Simulating climate change impacts on T. aman (BR-22) rice yield: a predictive approach using DSSAT model. Water Environ. J. 34, 250–262. doi: 10.1111/wej.12523
Hatfield J. L., Boote K. J., Kimball B. A., Ziska L. H., Izaurralde R. C. (2011). Climate impacts on agriculture: Implications for crop production. Agron. J. 103, 351–370. doi: 10.2134/agronj2010.0303
He Y., Liu D., Yao Y., Huang Q., Li J., Chen Y., et al. (2013). Spatializing growth suitability for spring soybean cultivation in Northeast China. J. Appl. Meteorol. Climatol. 52 (4), 773–783. doi: 10.1175/JAMC-D-11-0259.1
Hesketh J. D., Myhre D. L., Willey C. R. (1973). Temperature control of time intervals between vegetative and reproductive events in soybeans. Crop Sci. 13 (2), 250–254. doi: 10.2135/cropsci1973.0011183x001300020030x
Hoogenboom G., Porter C. H., Boote K. J., Shelia V., Wilkens P. W., Singh U., et al. (2019). “The DSSAT crop modeling ecosystem,” in Advances in crop modeling for a sustainable agriculture. Ed. Boote K. J. (Cambridge, United Kingdom: Burleigh Dodds SciencePublishing), 173–216.
Hoogenboom G., Porter C. H., Shelia V., Boote K. J., Singh U., White J. W., et al. (2017). Decision Support System for Agrotechnology Transfer (DSSAT) version 4.7.0.0 (Gainesville, Florida, USA: DSSAT Foundation). Available at: https://DSSAT.net.
Humphreys E., Gaydon D. S., Eberbach P. L. (2016). Evaluation of the effects of mulch on optimum sowing date and irrigation management of zero till wheat in central Punjab, India using APSIM. Field Crops Res. 197, 83–96. doi: 10.1016/j.fcr.2016.08.016
IPCC (2013). Summary for policymakers. In climate change 2013: the physical science basis. Contribution of working group I to the fifth assessment report of the intergovernmental panel on climate change (Cambridge, U.K. and New York: Cambridge Univ. Press).
IPCC (2021). Summary for policymakers, in climate change 2021: the physical science basis, contribution of working group I to the sixth assessment report of the intergovernmental panel on climate change (Cambridge, U.K. and New York: Cambridge Univ. Press).
Jones J. W., He J., Boote K. J., Wilkens P., Hu Z. (2011). Estimating DSSAT cropping system cultivar-specific parameters using bayesian techniques. in Methods of Introducing System Models into Agricultural Research 365-393. doi: 10.2134/advagricsystmodel2.c13
Jones J. W., Hoogenboom G., Porter C. H., Boote K. J., Batchelor W. D., Hunt L. A., et al. (2003). The DSSAT cropping system model. Eur. J. Agron. 18 (3-4), 235–265. doi: 10.1016/S1161-0301(02)00107-7
Júnior R. S. N., Sentelhas P. C. (2019). Soybean-maize succession in Brazil: Impacts of sowing dates on climate variability, yields and economic profitability. Eur. J. Agron. 103, 140–151. doi: 10.1016/j.eja.2018.12.008
Kassaye A. Y., Shao G., Wang X., Shifaw E., Wu S. (2021). Impact of climate change on the staple food crops yield in Ethiopia: implications for food security. Theor. Appl. Climatol. 145 (1), 327–343. doi: 10.1007/s00704-021-03635-8
Khiem M. V., Redmond G., Mcsweeney C., Thuc T. (2014). Evaluation of dynamically downscaled ensemble climate simulations for Vietnam. Int. J. Climatol. 34, 2450–2463. doi: 10.1002/joc.3851
Kim D. H., Jang T., Hwang S., Jeong H. (2021). Paddy rice adaptation strategies to climate change: Transplanting date shift and BMP applications. Agric. Water Manage. 252, 106926. doi: 10.1016/J.AGWAT.2021.106926
Kimball B. A., Kobayashi K., Bindi M. (2002). Responses of agricultural crops to free-air CO2 enrichment. Adv. Agron. 77, 293–368. doi: 10.1016/S0065-2113(02)77017-X
Klein H. S., Luna F. V. (2021). The growth of the soybean frontier in south America: the case of Brazil and Argentina. Rev. Hist Econ. 39 (3), 427–468. doi: 10.1017/S0212610920000269
Li X., Esker P. D., Pan Z., Dias A. P., Xue L., Yang X. B. (2010). The uniqueness of the soybean rust pathosystem: an improved understanding of the risk in different regions of the world. Plant Dis. 94 (7), 796–806. doi: 10.1094/PDIS-94-7-0796
Liu T., Yang X., Batchelor W. D., Liu Z., Zhang Z., Wan N., et al. (2020). A case study of climate-smart management in foxtail millet (Setaria italica) production under future climate change in Lishu county of Jilin, China. Agric. For. Meteorol. 292, 108301. doi: 10.1016/j.agrformet.2020.108131
Lukali A. A., Osima S. E., Lou Y., Kai K. H. (2021). Assessing the impacts of climate change and variability on maize (Zea mays) yield over Tanzania. Clim. Atmos. Sci. 11 (3), 569–588. doi: 10.4236/ACS.2021.113035
Martins M. A., Tomasella J., Dias C. G. (2019). Maize yield under a changing climate in the Brazilian Northeast: impacts and adaptation. Agric. Water Manage. 216, 339–350. doi: 10.1016/j.agwat.2019.02.011
Massey N., Jones R., Otto F. E. L., Aina T., Wilson S., Murphy J. M., et al. (2015). Weather@home-development and validation of a very large ensemble modelling system for probabilistic event attribution. Quart. J. R. Meteor. Soc 141 (690), 1528–1545. doi: 10.1002/qj.2455
Masuda T., Goldsmithe P. D. (2009). World soybean production: area harvested, yield, and long-term projections. Int. Food Agribus Man. 12 (4), 143–161. doi: 10.22004/ag.econ.92573
Meng C., Xu Y., Li Q., Ma Y., Feng Q., Ma W., et al. (2020). Analyses of observed features and future trend of extreme temperature events in Inner Mongolia of China. Theor. Appl. Climatol. 139, 577–597. doi: 10.1007/s00704-019-02969-8
Mohammed A., Tana T., Singh P., Molla A., Seid A. (2017). Identifying best crop management practices for chickpea (Cicer arietinum L.) in Northeastern Ethiopia under climate change condition. Agric. Water Manage. 194, 68–77. doi: 10.1016/j.agwat.2017.08.022
Mohanty M., Reddy K. S., Probert M. E., Dalal R. C., Sinha N. K., Rao A. S., et al. (2016). Efficient nitrogen and water management for the soybean-wheat system of Madhya Pradesh, central India, assessed using APSIM model. Proc. Natl. Acad. Sci. India Sect. B: Biol. Sci. 86 (1), 217–228. doi: 10.1007/s40011-014-0443-3
Moradi R., Koocheki A., Mahallati M. N., Mansoori H. (2013). Adaptation strategies for maize cultivation under climate change in Iran: irrigation and planting date management. Mitig. Adapt. Strat. Global Change. 18 (2), 265–284. doi: 10.1007/s11027-012-9410-6
Ray D. K., Gerber J. S., MacDonald G. K., West P. C. (2015). Climate variation explains a third of global crop yield variability. Nat. Commun. 6 (1), 59–89. doi: 10.1038/ncomms6989
Rugira P., Ma J., Zheng L., Wu C., Liu E. (2021). Application of DSSAT CERES-Maize to identify the optimum irrigation management and sowing dates on improving maize yield in Northern China. Agronomy 11 (4), 674. doi: 10.3390/AGRONOMY11040674
Ruiz-Nogueira B., Boote K. J., Sau F. (2001). Calibration and use of CROPGRO-soybean model for improving soybean management under rainfed conditions. Agric. Syst. 68 (2), 151–173. doi: 10.1016/S0308-521X(01)00008-7
Saddique Q., Cai H., Xu J., Ajaz A., He J., Yu Q., et al. (2020). Analyzing adaptation strategies for maize production under future climate change in Guanzhong Plain, China. Mitig. Adapt. Strat. Global Change. 25 (8), 1–21. doi: 10.1007/s11027-020-09935-0
Serafin-Andrzejewska M., Helios W., Jama-Rodzeńska A., Kozak M., Kotecki A., Kuchar L. (2021). Effect of sowing date on soybean development in South-Western Poland. Agriculture 11 (5), 413–424. doi: 10.3390/AGRICULTURE11050413
Shi W., Tao F., Zhang Z. (2013). A review on statistical models for identifying climate contributions to crop yields. J. Geog. Sci. 23 (3), 567–576. doi: 10.1007/s11442-013-1029-3
Tao F. L., Zhang Z., Zhang S., Rötter R. P., Shi W. J., Xiao D. P., et al. (2016). Historical data provide new insights into response and adaptation of maize production systems to climate change/variability in China. Field Crops Res. 185, 1–11. doi: 10.1016/j.fcr.2015.10.013
Tari D. B., Amiri E., Daneshian J. (2017). Simulating the impact of nitrogen management on rice yield and nitrogen uptake in irrigated lowland by ORYZA2000 Model. Commun. Soil Sci. Plant Anal. 48 (2), 201–213. doi: 10.1080/00103624.2016.1254234
Taylor K. E., Stouffer R. J., Meehl G. A. (2012). An overview of CMIP5 and the experimentdesign. Bull. Amer. Meteorol. Soc 93, 485–498. doi: 10.1175/BAMS-D-11-00094.1
Teixeira E. I., Ruiter J. D., Ausseil A. G., Daigneault A., Johnstone P., Holmes A., et al. (2018). Adapting crop rotations to climate change in regional impact modelling assessments.Sci. Total Environ. 616-617, 785–795. doi: 10.1016/j.scitotenv.2017.10.247
Wang C., Feng L., Wu L., Cheng C., Li Y., Yan J., et al. (2020). Assessment of genotypes and management strategies to improve resilience of winter wheat production. Sustainability 12 (4), 1474. doi: 10.3390/su12041474
Wang X., Li L., Ding Y., Xu J., Wang Y., Zhu Y., et al. (2021). Adaptation of winter wheat varieties and irrigation patterns under future climate change conditions in Northern China. Agric. Water Manage. 243, 106409. doi: 10.1016/j.agwat.2020.106409
Wu S. Y., Wu Y., Wen J. (2019). Future changes in precipitation characteristics in China. Int. J. Climatol. 39 (8), 3558–3573. doi: 10.1002/joc.6038
Xiao D., Liu D., Wang L., Feng P., Bai H., Tang J. (2020). Climate change impact on yields and water use of wheat and maize in the North China Plain under future climate change scenarios. Agric. Water Manage. 238 (106238), 1–15. doi: 10.1016/j.agwat.2020.106238
Xu Y., Zhang Y., Lin E., Lin W., Dong W., Jones R., et al. (2006). Analyses on the climate change responses over China under SRES B2 scenario using PRECIS. Chin. Sci. Bull. 51 (18), 2260–2267. doi: 10.1007/s11434-006-2099-8
You Q., Min J., Fraedrich K., Zhang W., Kang S., Zhang L., et al. (2014). Projected trends in mean, maximum, and minimum surface temperature in China from simulations. Global Planet. Change. 112, 53–63. doi: 10.16/j.gloplacha.2013.11.006
You L., Rosegrant M. W., Wood S., Sun D. (2008). Impact of growing season temperature on wheat productivity in China. Agric. For. Meteorol. 149 (6), 1009–1014. doi: 10.1016/j.agrformet.2008.12.004
Zabel F., Müller C., Elliott J., Minoli S., Jägermeyr J., Schneider J. M., et al. (2021). Large potential for crop production adaptation depends on available future varieties. Global Change Biol. 27 (16), 3870–3882. doi: 10.1111/GCB.15649
Zhang Y., Wang Y., Niu H. (2019). Effects of temperature, precipitation and carbon dioxide concentrations on the requirements for crop irrigation water in China under future climate scenarios. Sci. Total Environ. 656, 373–387. doi: 10.1016/j.scitotenv.2018.11.362
Zhao J., Yang X., Liu Z., Lv S., Wang J., Dai S. (2016). Variations in the potential climatic suitability distribution patterns and grain yields for spring maize in Northeast China under climate change. Clim. Change. 137 (1), 29–42. doi: 10.1007/s10584-016-1652-y
Zhou M., Wang H. (2015). Potential impact of future climate change on crop yield in northeastern China. Adv. Atmos. Sci. 32 (7), 889–897. doi: 10.1007/s00376-014-4161-9
Keywords: soybean, future climate scenarios, DSSAT-CROPGRO-soybean model, agronomic management practices, case study
Citation: Li Y, Chang J, Gao X, Zhang L, Wang L and Ren C (2024) A case study on the impacts of future climate change on soybean yield and countermeasures in Fujin city of Heilongjiang province, China. Front. Agron. 6:1257830. doi: 10.3389/fagro.2024.1257830
Received: 18 July 2023; Accepted: 08 January 2024;
Published: 25 January 2024.
Edited by:
Domenico Ronga, University of Salerno, ItalyReviewed by:
Dengpan Xiao, Hebei Normal University, ChinaMotoki Nishimori, National Agriculture and Food Research Organization (NARO), Japan
Copyright © 2024 Li, Chang, Gao, Zhang, Wang and Ren. This is an open-access article distributed under the terms of the Creative Commons Attribution License (CC BY). The use, distribution or reproduction in other forums is permitted, provided the original author(s) and the copyright owner(s) are credited and that the original publication in this journal is cited, in accordance with accepted academic practice. No use, distribution or reproduction is permitted which does not comply with these terms.
*Correspondence: Xining Gao, c3lhdWd4bkBzeWF1LmVkdS5jbg==
†These authors have contributed equally to this work and share first authorship