- 1Institute for Sustainable Agriculture (IAS), CSIC, Cordoba, Spain
- 2Agronomy Department, University of Cordoba, Cordoba, Spain
Determining crop evapotranspiration (ET) is essential for managing water at various scales, from regional water accounting to farm irrigation. Quantification of ET may be carried out by several procedures, being eddy covariance and energy balance the most established methods among the research community. One major limitation is the high cost of the sensors included in the eddy covariance or energy balance systems. We report here the development of a simpler device (CORDOVA-ET: COnductance Recording Device for Observation and VAlidation of ET) to determine crop ET based on industrial-grade, commercial off-the-shelf (COTS) sensors costing far less than research-grade sensors. The CORDOVA-ET contains a sensor package that integrates the basic micrometeorological instrumentation and the infrared temperature sensors required for estimating ET over crops using the energy balance approach. One novel feature is the presence of four different nodes that allow the determination of ET in four different locations within a field or in four different fields of the same crop, thus allowing an assessment of ET spatial variability. The system was conceived as an open-source and hardware alternative to commercial devices, using a collaborative approach for the development of a regional ET network in countries of North Africa and the Near East. Comparisons of radiation, temperature, humidity, and wind against those of research-grade sensors yielded excellent results, with coefficients of correlation (R2) above 0.96. The estimated reference ET calculated from these measurements showed R2 = 0.99 and a root mean square error (RMSE) of 0.22 mm/day. The infrared temperature measurements at the four different nodes showed an RMSE below 0.56°C. The energy balance components and estimates of ET from the CORDOVA-ET were validated against an eddy-covariance system over a wheat crop. The high (R2) for net radiation (0.98), sensible heat (0.88), and latent heat (0.86) showed good agreement between the modeled energy fluxes and the field measurements. The hardware components, acquisition, and data processing software are available as open-source repositories to facilitate adoption for different applications, from water use efficiency research to irrigation management.
1 Introduction
Determining water use by crops is a prerequisite for sustainable irrigation management and is essential for assessing productivity in water-limited agriculture. Crop water use is equivalent to evapotranspiration (ET), the sum of the water transpired by the crop (T) and the water evaporated from the soil (E). Knowledge of ET is particularly critical in managing irrigation and water balance studies. Different methods are available for measuring and estimating the ET of crops. In the field of agronomy, the reference method to measure ET is based on determining the rate of water loss from large, weighing lysimeters (Howell et al., 1995). However, lysimeters are not generally available because of their very high costs. Although in some cases, it has been shown that their measurements represent the surrounding field (Evett et al., 2012), it is not uncommon to find lysimeter canopies that differ from the rest of the field, thus not providing representative measurements. Eddy covariance (EC) is a method for directly measuring the vapor flux from crop canopies which it is now widely used to determine ET (Baldocchi et al., 1988; Baldocchi, 2014). It requires high-speed measurements (>10Hz) of the 3D components of wind speed and temperature for the estimation of sensible heat, and of water vapor concentration for the estimation of the latent heat flux (LE), which is equivalent to ET. Limitations of the EC method include the high cost of instrumentation and the specialized skills required to achieve reliable results due to data analysis and interpretation complexity. Nevertheless, it is considered the preferred method for research activities on ET at the field scale (Wilson et al., 2001). The measurement of ET may also be performed using energy balance (EB) approaches based on the energy balance equation at the crop surface by assessing the amount of energy used for the evaporation of water (latent heat, LE) and the energy used to increase the air temperature (sensible heat, H). The basis of EB for calculating ET was developed by Penman and Monteith (Penman, 1948; Monteith, 1965), and its most widely adopted implementation is the FAO56 method (Allen et al., 1998). The method in FAO56 allows the calculation of a reference ET over a well-irrigated grass surface (ETo) that can be used, together with a crop coefficient (Kc), to estimate the ET for any crop (ETc). ETo is calculated from basic micrometeorological observations: solar radiation, air temperature and humidity, and wind speed. The ETc represents the water use rate of a crop not limited by the soil water supply. However, there are many instances where water deficits restrict transpiration, leading to an ET rate below the ETc, which is termed actual ET (ETa). Determination of ETa is becoming important in water-scarce situations where deficit irrigation (Fereres and Soriano, 2007) is now the norm rather than the exception. Tanner (1960) was among the first to use the energy balance approach to obtain daily estimates of ET. All methods based on energy balance require measuring or modeling the net radiation (Rn) as the amount of energy resulting from the radiation balance (incoming-outgoing) in the shortwave and longwave regions of the spectrum. Once Rn is known the ratio of latent heat to sensible heat (LE/H; the Bowen ratio) is determined based on humidity and temperature gradients above the crop. The soil heat flux and energy storage still need to be estimated or measured but some assumptions can be made depending on the temporal or spatial scale. The energy balance method is behind most of the methods for estimating ET from earth observations both from satellites, such as METRIC (Allen et al., 2011) or SEBAL (Bastiaanssen et al., 1998), and airborne (Berni et al., 2009). Using the Bowen ratio approximation, Tanner (1960) showed that EB estimates of ET predicted well the ET measured in a lysimeter hourly and daily. Since then, the EB method has been widely used in research and in applications at different spatial scales, from plots to large areas. In recent decades, ET data has become an integral part of routine agrometeorological information, particularly in arid and semi-arid areas (e.g., Marek et al., 2020). For the ET data to be accurate for various applications and to cover large areas, weather station networks’ investment and maintenance cost must be quite high, limiting their implementation to areas where capital and high technical skills are amply available. There is a need to extend the acquisition of ET data and provide it as part of the agrometeorological information in the arid and semi-arid areas of the world where currently ET data are not available. Another issue is the need to have ground measurements of ETa for which aerodynamic and canopy resistances must be calculated to be able to provide information to check the predictions of some of the remote sensing methods for ET assessment which are now in use worldwide (Trebs et al., 2021; Mallick et al., 2022). We have developed an instrument with a sensor package that integrates the basic micro-meteorological instrumentation required for estimating ET over crops using the energy balance approach to address both needs. The instrument is based on industrial-grade, commercial off-the-shelf (COST) sensors whose price is much lower than research-grade sensors typically used in scientific applications. However, we provide validation and calibration protocols for ensuring the quality and suitability of the data for the EB application and for estimating ET in the context of agricultural applications. The philosophy of this development also emerges from the do-it-yourself DIY, and most of the sensor integration has been designed for 3D printing. The idea is that potential users can download the design files and bill of materials and produce their own instrumentation wherever they are as an alternative to commercial providers, thus offering countries with limited resources a cost-effective alternative to current instrumentation.
2 Materials and methods
The system presented here, named CORDOVA-ET: COnductance Recording Device for Observation and VAlidation of ET, comprises a set of hardware components assembled to measure the primary meteorological variables that are required to apply the energy balance approach, a communication infrastructure based on wireless protocols, and the data handling devices and algorithms needed to generate the estimates of actual evapotranspiration (ETa). This section describes the different components and methodologies used by the system, as well as the validation campaigns performed to evaluate the results against established methods.
2.1 System components
The CORDOVA-ET requires specific instrumentation for collecting and handling the data from the field. Figure 1 summarizes the components, which shows the sensing nodes, the pyranometer node, and the base station described below. Figure 2 shows pictures of the different type of nodes and base station.
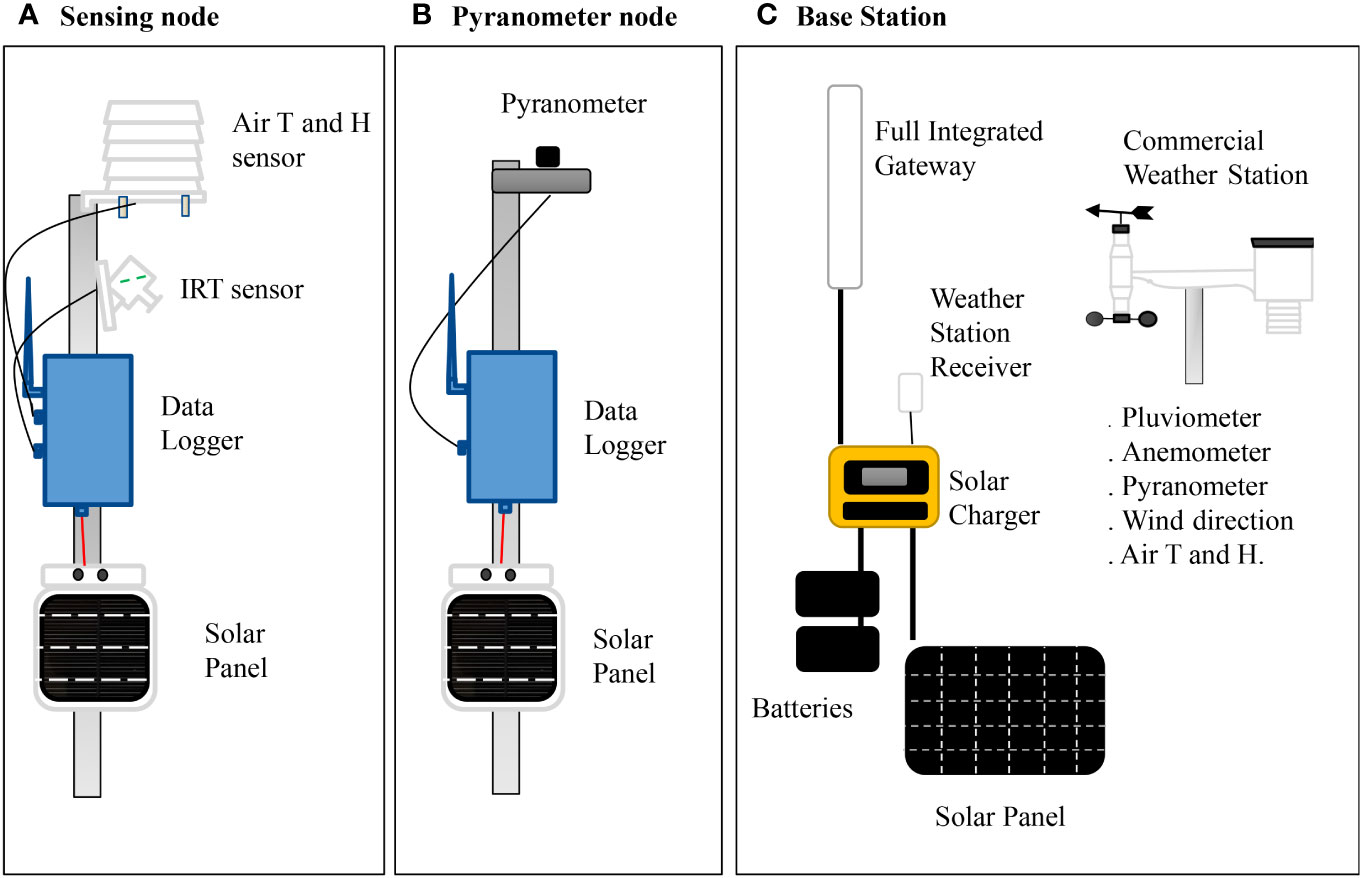
Figure 1 Diagram of the different node types of the CORDOVA-ET. A normal deployment includes four sensing nodes (A) with air temperature and humidity and infrared thermometer; one pyranometer node (B), and the base station, which includes the weather station (C).
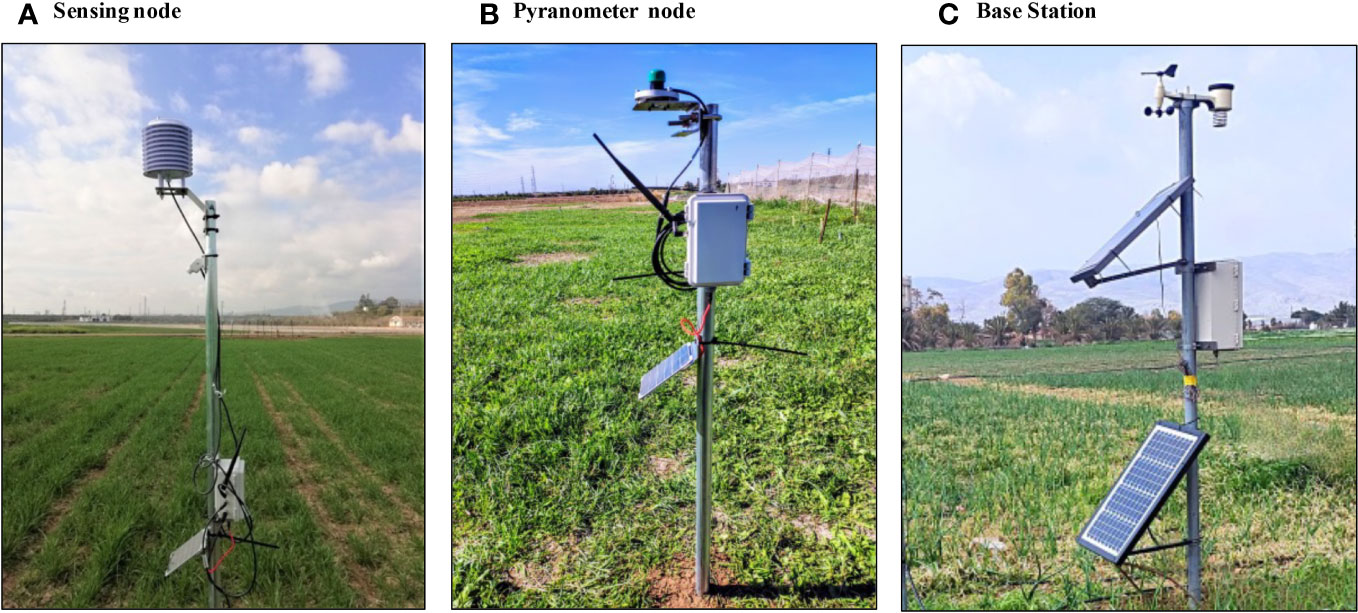
Figure 2 Pictures of the different node types and base station of the CORDOVA-ET showing the sensing node (A), the pyranometer node (B) and the base station, including the weather station on top (C).
2.1.1 Sensor nodes
The sensor node is the component that holds all the sensors required for measuring the crop attributes needed for calculating the energy balance, as well as the communication and main microcontroller to run the software logic to measure and transmit the measurements. The solar-powered node requires a solar panel and regulator to recharge the battery. Both the design files for the electronic components and the software running in the nodes are publicly available as open-source in: [https://github.com/OpenAgriTech/CORDOVA-ET-node] for the software and [https://github.com/OpenAgriTech/CORDOVA-ET-Hardware] for the electronic boards and 3D printed parts.
The standard deployments of the CORDOVA-ET consist of four nodes that monitor four locations, which may represent different growing conditions, crops, or irrigation treatments. Deploying multiple nodes in a large field also allows capturing the spatial variability within the field, which can better support the validation of satellite products with a coarse spatial resolution (~100m). The radio communication system uses LoRaWAN, which allows long-range operation between the nodes and the base station. In ideal conditions, the communication range can go up to 15km; however, in standard conditions, with the antennas being relatively close to the ground, it is safer to assume 2-5km distances.
2.1.1.1 Air temperature and humidity sensor
The SHT35 (Sensirion, Switzerland) sensor has been selected based on its accuracy (). It is a digital sensor that utilizes the I2C protocol, thereby eliminating potential issues with analog noise and the need for analog-to-digital digital conversion modules. Accurately measuring air temperature and humidity requires avoiding potential overheating caused by direct solar radiation. The sensor is protected by a standard radiation shield with 11 protection elements that provides sufficient ventilation while preventing direct radiation from reaching the sensor. Also, the sensor requires environmental protection against dust and rainfall that could damage the sensor or provide incorrect readings after rainfall events. The model selected is manufactured by Rika (China) and encapsulates the SHT35 into a PTFE protective cover that allows airflow while filtering out water and dust.
2.1.1.2 Canopy temperature sensor
The MLX90614 (Melexis, Belgium) is an infrared thermometer for non-contact surface temperature measurements. The sensor communicates using a digital interface (SMBus) with an output resolution of 0.14°C and an absolute temperature accuracy of ±0.5°C for the normal operational range of ambient and object temperature that are usual in agricultural applications (0−50°C and 0−60°C, respectively). This sensor has been used in agricultural monitoring applications (O’Shaughnessy et al., 2011; Jones et al., 2018; Deery et al., 2019) The sensor is available with different fields of view (FoV), from 90 to 5 degrees. Currently, we are integrating the sensor with 35° FoV. The sensor is mounted on a custom-built carrier board with an accurate 3V power supply and board-to-cable connectors. The board and sensors are integrated into an enclosure that is 3D-printed using white PETG that offers environmental protection against radiation, water and dust.
2.1.1.3 Microcontroller
The LoPy4 (Pycom Ltd, UK) is a compact hardware development board based on the ESP32 chipset that integrates quadruple network communications (LoRa, Sigfox, WiFi, Bluetooth) and is programmed using MicroPython. This board incorporates features for low-power operation and flexible hardware integration and plenty of programming and data processing capabilities. The board is integrated into a carrier board that connects the sensors and battery supply. The LoPy4 is mounted on a custom-built board that carries the board and provides connectors for the battery, sensors, programming interface, and a microSD card socket for local storage. The software running on the controller is implemented for low-power operation and the board is in deep sleep mode most of the time except during data acquisition and transmission. The sampling interval is configurable and set by default to 5 minutes. When the board wakes up, it initializes the sensors and reads them sequentially. The battery voltage is also recorded for remote monitoring of the battery status. The measurements are encoded into a binary array for transmission over LoRaWAN. When the transmission is finished, the device waits for a few seconds for any downlink message that can be used to configure the controller remotely, and then the controller enters into deep sleep mode again. The LoPy4 board does not include a real-time clock (RTC) for keeping the time when the board is in deep sleep or powered off. This prevents offline operation and local storage of data with timestamps. To provide the microcontroller with offline logging capabilities, an expansion socket allows installing an external RTC with a backup battery that can be used to store the local time. A custom algorithm also allows time synchronization with the data storage server. The node sends its local timestamp on a LoRaWAN message and the server calculates the offset with the actual time, returning the offset as a downlink message to the node. The node can then calculate the offset and adjust the internal clock accordingly. While this algorithm cannot resolve the uncertainty in the time delays of the transmission and server, the accuracy is within 1-2 seconds, which is enough for this type of application.
2.1.1.4 Enclosure
A critical aspect of field sensors is the ingress protection of electronics, as moisture, heat and dust can cause damage. All the microcontroller electronics are integrated into an IP67 box, ensuring complete waterproof protection. It has a hinged cover, which facilitates maintenance and inspection in the field. The connectors for sensors, antenna, and solar panel also need to be rated with IP67 protection to ensure ingress protection. A venting valve is also integrated into the enclosure to ensure that changes in the internal pressure will not suck in moisture inside the enclosure, leading to the build-up of condensation and damaging the electronics in the long term.
2.1.1.5 Power supply
The power supply setup for the node consists of a 2W external solar panel, which is connected to a solar charging regulator located inside the enclosure. A waterproof connector is used for this connection. Additionally, the regulator is linked to a 6,000mAh LiPo battery, which serves as the power source for the node. The large capacity of the battery enables the node to operate for an extended duration, even in the absence of solar power.
2.1.1.6 Pyranometer node
Initial versions of the CORDOVA-ET included custom-built pyranometers based on a multi-spectral detector (AS7262, ams-OSRAM AG, Austria) encapsulated in a 3D-printed diffuser and enclosure that was mounted on top the radiation shield of the air temperature and humidity sensor. However, this solution showed poor reliability and a need for regular re-calibration. Due to the importance of solar radiation measurements, a specific node for a commercial pyranometer was designed based on the original sensor nodes. The node included a custom-built 14-bit analog-to-digital converter (ADC) based on the MCP3424 (Microchip Technology, Arizona, USA) that interfaces an SP-110 pyranometer (Apogee Instruments, Utah, USA) or the SKS-1110 (Skye Instruments Ltd, Llandrindod Wells, UK). Similarly, to the sensor nodes, the pyranometer node sends the readings every 5 minutes using LoRaWAN.
2.1.2 Base station
The base station comprises the elements to allow the transmission of the node data to the Internet. It collects other meteorological data from a standard weather station: wind speed, radiation, and rainfall. A solar panel and a rechargeable battery power the base station. The base station is typically located in the center of the experiment. The weather station is meant to register the conditions of the field environment where the sensor nodes are installed.
The elements of the base station are:
2.1.2.1 Standard weather station
The WH4000SE (Froggit, Germany) weather station is a compact wireless weather station chosen because of its low cost and capacity to measure all the required weather variables. Many commercial weather stations (not scientific grade) do not measure solar radiation, which is a significant limitation for agro-meteorological applications. The WH4000SE allows direct transmission of weather observations to the Internet, and its compact form makes its installation very simple. The weather station comprises the external unit, and a console that receives the data from the station displays the measurements and transmits the data over WiFi. The console also offers the possibility of local storage of the weather variables that can be retrieved using a PC. One main limitation of the weather station sensors is the solar radiation sensor, which does not include a diffuse or cosine corrector. This can lead to some errors in the observations, especially during clear sky conditions. Also, the sensor is located quite close to the wind vane, which can cast shadows during conditions of low solar elevation. Therefore, the weather station was modified by attaching an optical broadband diffuser (model 36-603, Edmund Optics, UK) glued using optical adhesive cured with UV light. The modified weather stations are calibrated against a standard pyranometer for several days and the calibration coefficients are recorded on each station for further configuration.
2.1.2.2 LoRaWAN Gateway
This device acts as bridge between the nodes and a network server on the Internet. It receives signals from LoRaWAN end-devices and sends them to the network server through a backhaul connection, such as Ethernet or cellular. In this case, we use the 4G mobile network. A 4G modem can be integrated internally or used as separate equipment. The gateway also sends downlink messages from the network server back to the end-devices. We have used different LoRaWAN gateways, such as The Things Indoor Gateway (The Things Industries, The Netherlands), a compact, low-cost eight-channel Gateway that receives node data and transmits it over WiFi. It requires a 4G Router with a WiFi access point or nearby WiFi connectivity. Another popular LoRaWAN Gateway we have used routinely is the DLOS8 (Dragino Technology Co. LTD., China), which integrates the 4G modem and is designed to be installed outdoors.
2.1.3 Communications and data handling
The system has been designed to operate wirelessly and in real-time using novel low-power communication protocols, such as LoRaWAN. LoRaWAN, which stands for Long Range Wide Area Network, is a wireless communication protocol designed for low-power, wide-area networks (LPWANs). It enables long-range communication between battery-powered devices, such as sensors, and a central network server. LoRaWAN operates in the unlicensed Industrial, Scientific, and Medical (ISM) bands, such as 868 MHz (Europe) and 915 MHz (North America). The standard range of LoRaWAN devices can vary depending on several factors, including the environment, antenna configuration, and transmit power. However, LoRaWAN is designed to achieve long-range communication, typically covering several kilometers in open environments with line-of-sight conditions. In rural or suburban areas with fewer obstacles, LoRaWAN devices can achieve ranges of up to 10 kilometers or more. This makes LoRaWAN ideal for agricultural applications as it can easily cover a farm scale.
In the CORDOVA-ET, the LoRaWAN devices (nodes) communicate with a LoRaWAN gateway (base station), which relays the data to a server using a mobile Internet connection. The base station is powered by solar panels and rechargeable batteries (see Figure 3). The data from the nodes is encrypted using specific keys managed by a network server. We have selected The Things Network (TTN) (https://www.thethingsnetwork.org/),a collaborative LoRaWAN infrastructure where the users bring their gateways and provide the services for managing communications with the cloud. TTN offers limited free data storage and visualization, as it is designed to serve as a broker for the information and focuses on handling the encryption and device keys required to pass over the data to an application server or database.
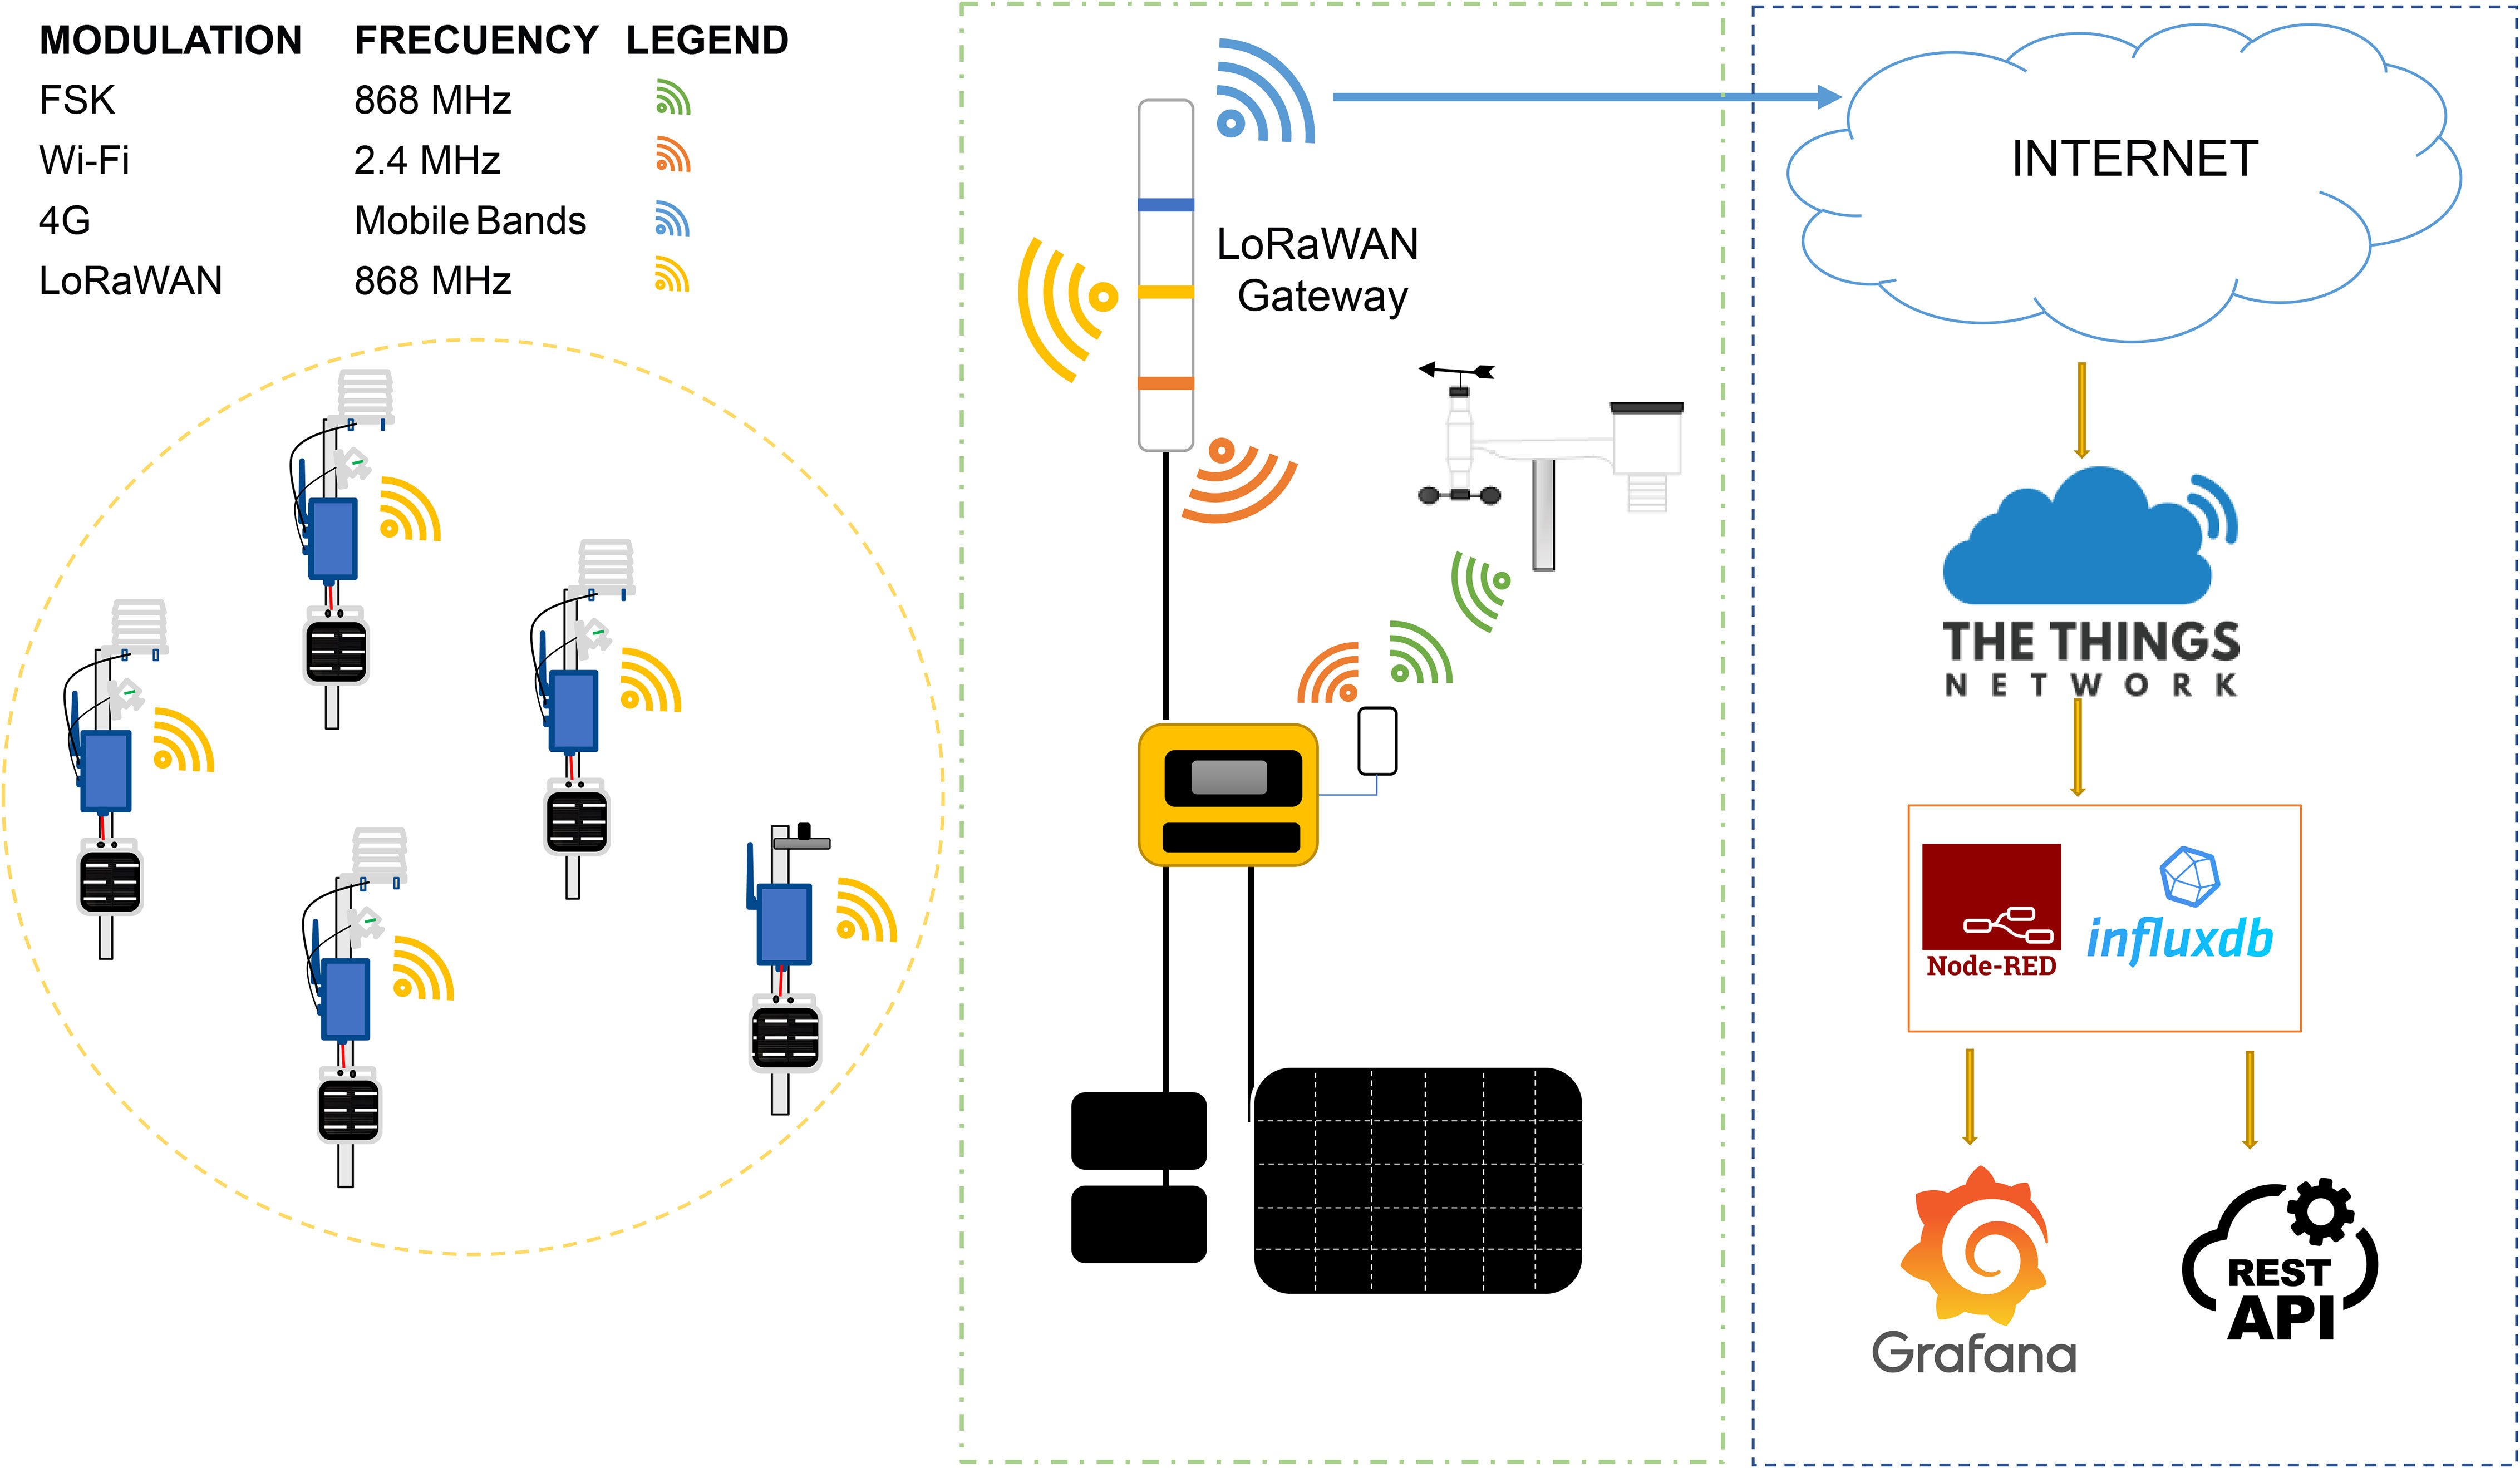
Figure 3 Representation of the different communication protocolos and aata workflow.Each colour of the waves represent a different frequency and encoding. The data goes from the nodes to the base station using LoRaWAN and then it is broadcasted to the Internet, where it gets ingested into The Things Network LoRaWAN server. Finally, the data it is stored and processed into a physical or cloud server running Node-Red and InfluxDB, which can be acessed using Grafana for graphical representation or a REST-API for data analysis or mobile applications.
Once the data has been decoded on the TTN server, it can be retrieved from a cloud or physical server using the MQTT protocol. MQTT (Message Queuing Telemetry Transport) is a lightweight publishsubscribe messaging protocol designed for efficient communication between devices and applications in the Internet of Things (IoT) context. It follows a client-server architecture and operates on top of TCP/IP, making it suitable for constrained devices and low-bandwidth networks. In this case, TTN acts as an MQTT server and we use Node-RED for retrieving the MQTT messages from the nodes. Node-RED is a popular open-source flow-based programming tool providing a visual development environment for wiring IoT devices, APIs, and online services. It allows users to create and deploy applications by connecting nodes in a graphical interface without the need for traditional coding.
Once the data is retrieved from TTN, it is stored in a time-series database named InfluxDB. InfluxDB is an open-source, time-series database for storing, querying, and analyzing timestamped data. It is specifically optimized for handling large volumes of time-series data generated by various applications, including IoT sensor data, monitoring systems, financial data, etc.
The stored data is visualized in real-time using Grafana. Grafana is an open-source data visualization and monitoring tool that allows users to create interactive dashboards and graphs for analyzing and monitoring various data sources. It provides a flexible and customizable platform for visualizing time-series data, metrics, logs, and other data types. Grafana is highly integrated with InfluxDB and allows graphical queries of the data for different periods and time-based aggregations.
All these open-source solutions can be deployed in a physical or cloud server. During the validation of the CORDOVA-ET, the physical server was a Raspberry Pi (model 4 with 4Gb of RAM) running Raspbian distribution. Each components for data storage (InfluxDB) and visualization (Grafana) ran on independent Docker containers, providing additional security and much easier deployment on new servers. Using containers ensures much faster replication in new servers by new users or new implementations.
2.2 Energy balance model
The calculation of evapotranspiration (ET) using energy balance is based on the fundamental equation (1), where the net radiation (Rn) equals the sum of the latent heat (LE), sensible heat (H) and the soil heat flux (G).
Manipulating the equation, it is possible to isolate LE as in eq (2). Therefore, if the terms Rn, G and H are known, it is possible to estimate LE and therefore the evaporated water from the crop.
The sensible heat (H) can be calculated using equation (3), where ρa is the air density, cp is the specific heat of air, Tc is the canopy temperature, Ta is the air temperature and raH is the aerodynamic resistance to heat transfer. The main requirement is to measure Tc, which can be obtained using infrared thermometry, as in the CORDOVA-ET. raH depends mainly on the canopy architecture (plant height, density, etc.) and wind speed.
The aerodynamic resistance in neutral conditions () can be calculated following (4), where z is the height of wind and temperature measurements (typically 2 m); d is the zero plane displacement height (), where h is the canopy height; zom is roughness length governing momentum transfer (depends on the canopy architecture, but can be assumed as 0.123h); zoh is roughness length governing the transfer of heat and vapor (also depends on the canopy architecture, but can be assumed as 0.1zom); uz is the wind speed at zm; and k is von Kármán constant (0.4).
When calculating aerodynamic resistance (raH), the distinction between neutral and non-neutral conditions is crucial. Neutral conditions refer to a state where the buoyancy effects of temperature differences between the canopy and the surrounding air are negligible. In neutral conditions, the temperature gradient between the two is not significant enough to induce vertical air movement or affect the aerodynamic processes involved in the exchange of heat and momentum. On the other hand, non-neutral conditions arise when there are substantial temperature differences between the canopy and the air, leading to buoyancy effects that influence vertical air movement. In non-neutral conditions, the buoyancy component becomes significant and affects the exchange of heat and momentum between the canopy and the surrounding air. Consequently, a more sophisticated approach is required to estimate ra accurately. Different formulations and parameterizations for ra were evaluated by (Liu et al., 2007). In this study, we used Viney (1991), that is based in a semi-empirical function for correcting [equation (5)] using Richardson number RiB(6).
where:
and:
where g is the gravitational acceleration (0.98 ms−2).
Rncan be measured with a net radiometer, which measures all the components of the incoming and outgoing net radiation as in eq (7), where Rs is the shortwave solar radiation, measured with a pyranometer; α is the albedo, which can be measured with a second pyranometer looking downwards; L ↑ and L ↓ are the outgoing and incoming longwave radiation, which usually are measured with a pyrgeometer.
Net radiometers that measure the four components for short and longwave are a standard part of the equipment of eddy-covariance systems. However, they are not commonly available in agrometeorological weather stations. Thus modeling the albedo and longwave components is required. Estimating the incoming longwave radiation (L ↓) requires air temperature and humidity, as well as a cloudiness factor that can be calculated as a fraction of actual solar radiation (Rs) and the potential irradiance (Rspot). This is the standard method for FAO and ASCE formulations (Allen et al., 1998; Walter et al., 2000). However, for the sub-daily calculations, we followed a different approach based on (Crawford and Duchon, 1999) that has been tested by Berni et al. (2009). Here, the estimate of the cloudiness is not done on every time step but calculated daily, and the same cloudiness factor is applied for all the day’s observations.
The outgoing longwave radiation (L ↑) can be estimated from the actual canopy temperature, converting the temperature to radiant energy using the Stefan–Boltzmann law: , where ϵc is the canopy emissivity (assumed as 0.98); σ is the Stefan-Boltzmann constant; and Tc is the canopy temperature.
One factor that requires attention is the albedo α. In the absence of two pyranometers or albedometer, we are assuming α = 0.18. However, this assumption may not be correct due to the nature of the albedo since its value depends on the nature of the canopy (e.g., ground cover, senescence) and on solar elevation. This may require further investigations in the future and modeling for different crops and conditions.
G can be measured using soil heat flux plates. However, it can also be estimated using FAO56 approach where G is calculated as a fraction of Rn that is different during the daytime (Rs ≥ 0) or nigh time as expressed in (8).
With all the components of (2) known, it is possible to calculate LE. Converting LE to ET can be performed by converting energy fluxes to mass fluxes using (9):
Where λ is the latent heat of the vaporization of water (Jkg−1), which depends on the air temperature (Ta). The units of ETa resulting from (9) will be kgm−2s−1. Since most applications require mm/day units, mass fluxes must be aggregated throughout the day and water density can be assumed as 1m3 = 1kg.
All these processing steps have been implemented in a Python library called OpenCropLib, which is available as open-source (Jimenez-Berni, 2023).
Another Python library, called RefET, has been used to calculate reference ET (ETo) from the weather station data using both daily and hourly intervals.
2.3 Field validation campaigns
The wheat field used for validation was very close to an official weather station on a grass field in Campus Alameda del Obispo, Cordoba (Spain): 37.86N, 4.8W. The field was sown in November 2020 and harvested in June 2021. The dimensions of the field were 220x90m, oriented in the E-W direction.
A complete CORDOVA-ET system was installed (four nodes, a pyranometer node, and the base station) in the middle of the field on February 2021, selecting for the nodes a homogeneous area with no apparent crop issues. The air temperature and humidity sensors, and infrared thermometers were installed at 2.5 m. The weather station was installed 10m next to the official weather station at 2m height.
An eddy covariance system was installed within 10m downwind of the CORDOVA-ET sensor nodes to validate the energy fluxes. The equipment consisted of (1) a three-dimensional sonic anemometer (model CSAT3; Campbell Scientific Inc., Logan, UT, USA) to measure vertical (w), horizontal (u) wind speed and sonic air temperature Ts and (2) a high-frequency open-path infra-red gas analyzer (IRGA) to measure CO2 (Ca) and water vapor (q) concentrations in air (model LI-7500, LI-COR, Lincoln, USA). The separation between the anemometer and the gas analyzer was 0.25 m during the measurement period. The footprint of eddy fluxes was calculated using the model of Schuepp et al. (1990). Then, the sensor height of the eddy covariance system was adjusted to ensure that more than 90% of the fluxes originated inside the wheat field. Canopy height was measured weekly with a ruler.
Solar panels powered all the sensors which were connected to a datalogger (model CR1000, Campbell Scientific Inc.) operating at 10 Hz. Data were processed to obtain 30-min covariances (). The raw measured fluxes of carbon (Fc), water vapor (LE), sensible heat (H), and momentum (τ) were corrected using the frequency response functions derived by Moore (1986). I.e., frequency response on sensor separation, path length averaging, and signal acquisition and processing time. Fc and LE were also corrected for density fluctuations, according to Webb et al. (1980). All the calculations for the eddy covariance system were performed using the TK3 software (Mauder and Foken, 2015). To obtain the daily averages, the semi-hourly corrected fluxes were then averaged for each 24 h, including nocturnal data with friction velocity > 0.2 m/s. A problem with the solar power supply caused a power outage from 7 to 28 April, lea.
The net radiation and its components (long and short wave, each both downwards and upwards) were measured each minute with a 4-way net radiometer (model NR01; Campbell Scientific Inc., Logan, UT, USA) connected to a datalogger (model CR1000, Campbell Scientific Inc., Logan, UT, USA) which also averaged and stored the radiation fluxes every 10-min. Next to the net radiometer. An infrared temperature (IRT) sensor (model IRTS-P, Apogee, USA) was deployed close to the neet radioameter to record continuous canopy temperature for validation. This is a widely used high-quality sensor used in multiple publications (Berni et al., 2009; Krishnan et al., 2020).
The energy balance closure of the eddy covariance energy fluxes was checked by comparing H + LE and the available energy was calculated as Rn − G, where Rn is measured with the net radiometer and G is calculated using (8). To correct for potential closure error, a correction was introduced using Bowen ratio (β = H/LE), where Rnis partitioned using β using equations (10) and (11). β was calculated on daily steps using the sum of H and LE on each day. The corresponding daily β was used in the calculation of the corrected energy fluxes.
A reference weather station was located 10m from the CORDOVA-ET and the eddy covariance systems. The weather station is part of the Irrigation Agroclimatic Information System (SIAR in Spanish) (Ministerio de Agricultura, 2023), a nationwide weather station network.
The validation of the different variables has been performed on half-hourly data averaged from the raw data recorded at higher temporal resolution. The time series of selected days have been plotted for the reference station and CORODOVA-ET sensors to show the system’s capacity for tracking diurnal conditions. For each of the evaluated variables, the determination coefficient (R2), slope, root mean square error (RMSE), and mean absolute error (MAE) have been calculated using (12) and (13), respectively. Night-time measurements (when Rs≤ 0) have been removed for the analysis.
Where are the predicted values and yiare the actual values, in this case, the variables measured by the reference station or the eddy covariance.
3 Results
3.1 Validation of primary data
3.1.1 Weather variables
The weather variables obtained from the commercial weather station were compared aginst those of the reference station. The variables include air temperature and humidity, solar radiation, and wind speed. The data from selected days (Figure 4) and the different results, showed excellent agreement for all variables except for the relative humidity (Figure 4B), which shows an underestimation of the weather station sensor at high humidity levels and an overestimation at low humidity.

Figure 4 Comparison of weather variables for the CORDOVA-ET weather station and a reference, scientific-grade weather station. The plots represent air temperature (A), relative humidity (B), wind speed (C) and solar radiation (D). Blue is the CORDOVA-ET and orange is the reference station. The data is presented for a period of four days in April 2021.
When plotting the variables for the whole validation period (Figure 5), the results confirm the good agreement for all the variables, except for the relative humidity. The slope of air temperature (Figure 5A) was 1.01, with an RMSE of 0.58C and MAE of 0.48C. In the case of relative humidity 5.B), it is evident that there is a saturation effect in the reading at high humidity, resulting in lower humidity, and an overestimation for lower humidity. This results in a slope of 1.17 with an RMSE of 4.72%RH and MAE of -0.80%RH. The wind speed (Figure 5C) showed a slight overestimation at higher wind speeds and an underestimation at lower wind speeds, as suggested by the slope (0.87) with an RMSE of 0.27 and MAE of -0.9 m/s. This behavior is usual in cup anemometers when compared with propeller anemometers. Regarding solar radiation (Figure 5D), it is essential to note that comparisons were made against the pyranometer node instead of the radiation sensor from the weather station. The results showed good agreement, with a slope of 0.99 and RMSE and MAE of 30.63 and 2.28 Wm−2 respectively.
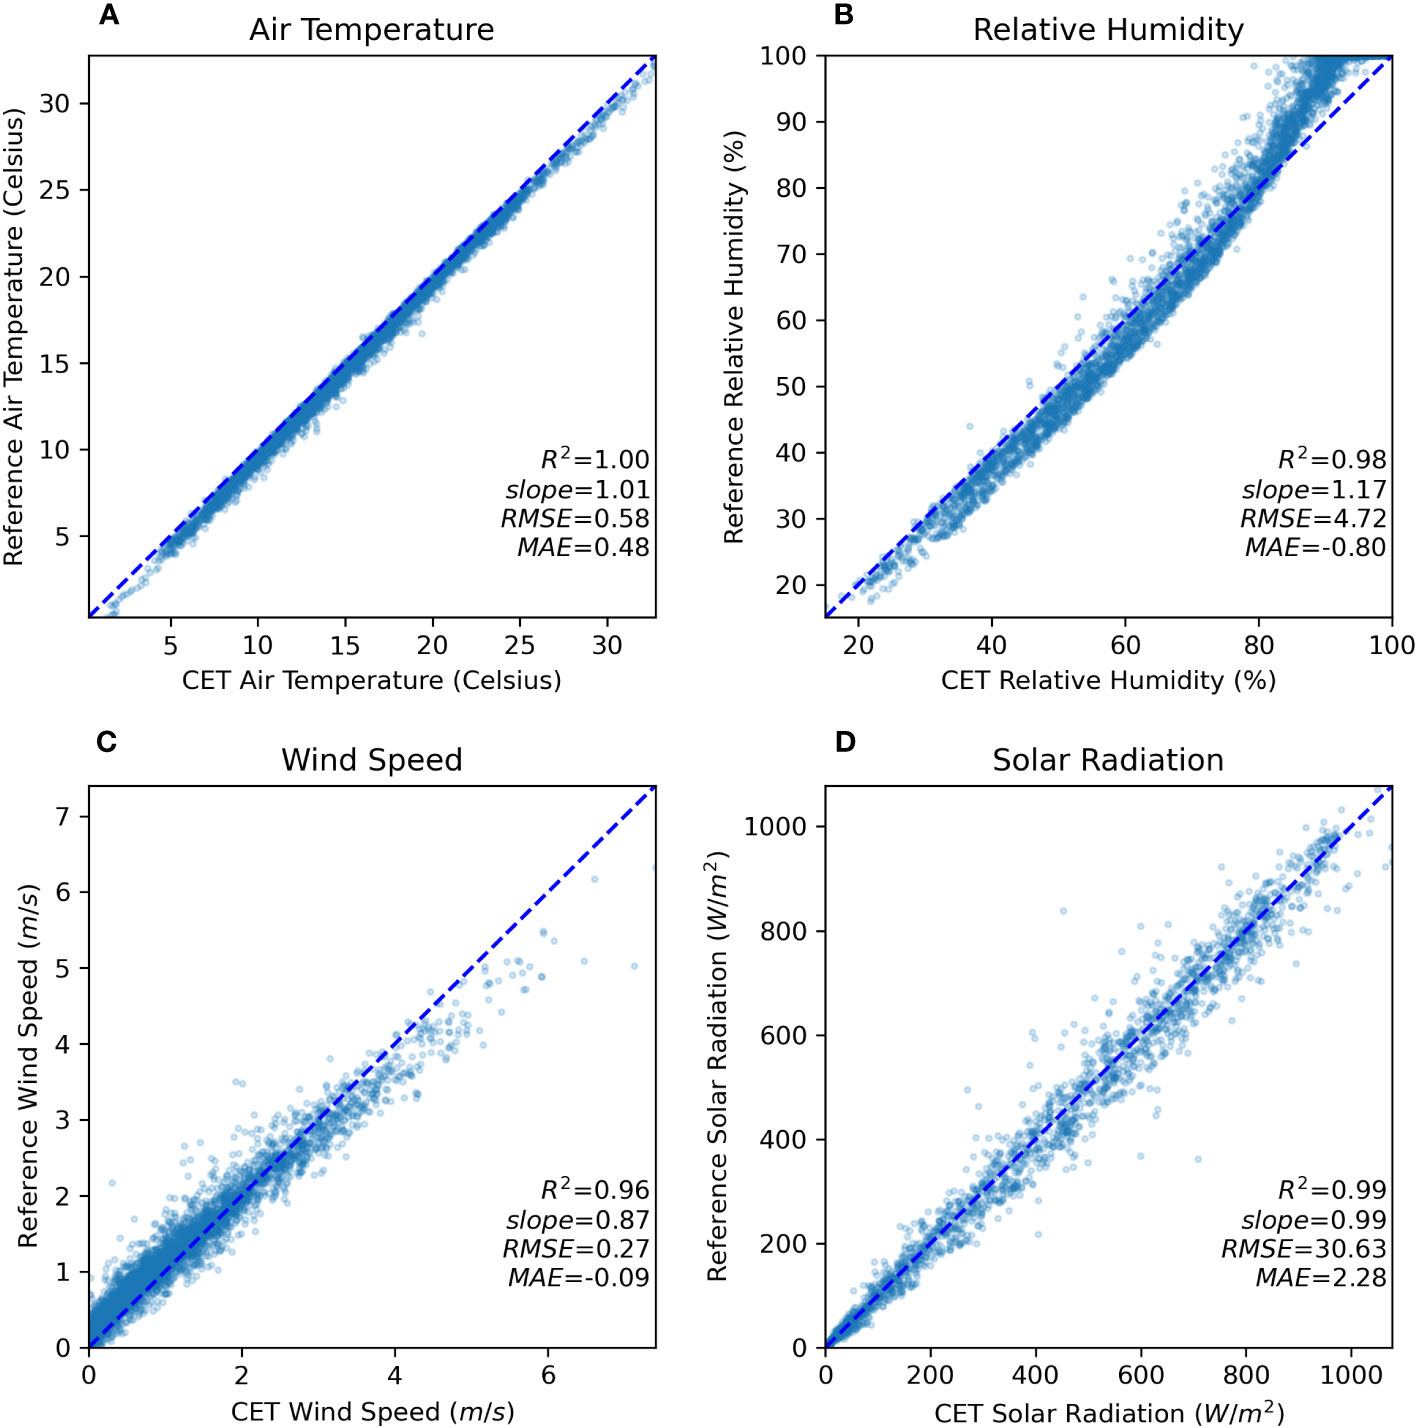
Figure 5 Validation of weather variables for the CORDOVA-ET weather station and a reference, scientificgrade weather station during the campaign of 2021. The plots represent air temperature (A), relative humidity (B), wind speed (C) and solar radiation (D). Each graph shows the R2, slope, root mean square error (RMSE) and mean absolute error (MAE).
3.1.2 Estimation of ETo from weather data
To further investigate the accuracy of the estimation of ETofrom the weather data obtained from the CORDOVA-ET, estimates of ETousing the primary data and calculated using the RefET [https://github.com/WSWUP/RefET] library were compared with the EToreported from the weather station network. The results shown in Figure 6, showed that the EToestimated from the CORDOVA-ET tracked very well the estimates from the reference weather station. The resulting validation showed a slope of 0.99, RMSE=0.20 and MAE=-0.15 mm/day (Table 1).
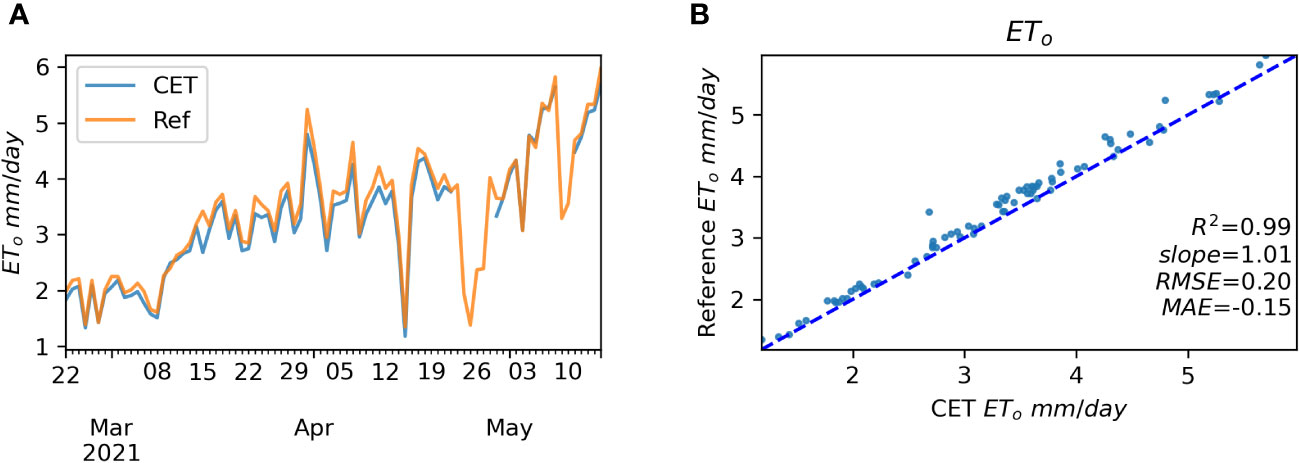
Figure 6 Comparison (A) and validation (B) of reference evapotranspiration (ETo) estimated from the CORDOVA-ET weather station (blue) and the reference weather station (orange). The validation plot (B) shows the R2, slope, root mean square error (RMSE) and mean absolute error (MAE).

Table 1 Validation of weather variables and reference evapotranspiration ETo comparing the commercial and reference weather stations.
3.1.3 Canopy temperature
The infra-red temperature measured on the four sensor nodes with the MLX90614 (Melexis) sensor was compared with a scientific-grade instrument (model IRTS-P, Apogee, USA) to determine the accuracy and repeatability across sensors (Figure 7). The raw temperatures with no emissivity correction (ϵ = 1) were compared and the results showed excellent agreement for all the sensors with RMSE ranging from 0.41 to 0.56 Celsius and slopes from 1.02 to 1.03. These results suggest that the commercial sensors performed very similarly to the scientific-grade device, with no apparent influence by the ambient temperature.
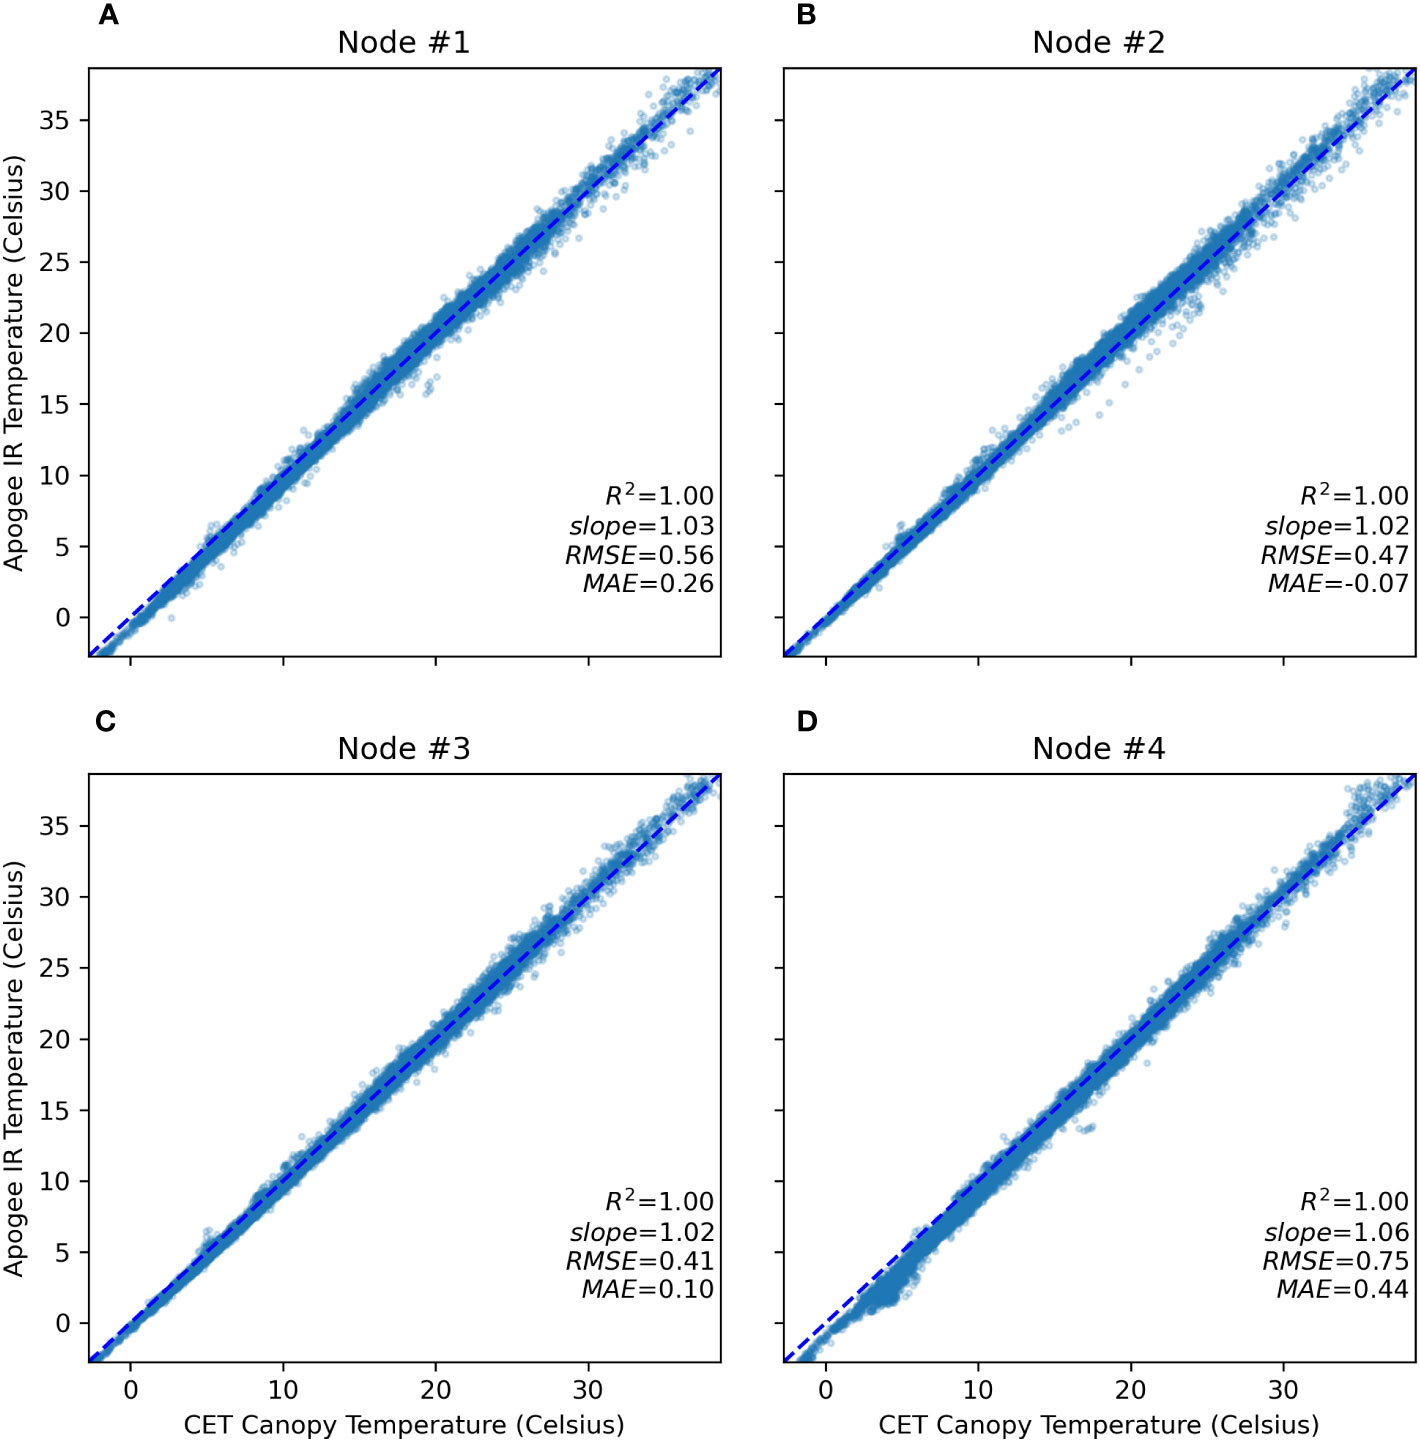
Figure 7 Comparison of the infrared temperature meaured at four nodes (A–D) using a commercial sensor (model MLX90614, Melexis, Belgium), against the infrared temperature measured with a scientific grade infrared thermometer (model IRTS-P, Apogee, USA). Each plot shows the R2, slope, root mean square error (RMSE) and mean absolute error (MAE).
3.2 Validation of energy balance components
The different components of the energy balance (namely Rn, H and LE) were calculated using the data from the CORDOVA-ET and the methodology described above. These results have been compared with the estimates from the eddy covariance before and after applying the energy balance closure correction (Figure 8). Five days in March 2021 were selected to plot the daily course of these variables after the closure correction (Figure 9). Finally, a summary of the average daily values shows the evolution of the fluxes for the entire validation period (except for the data gaps) (Figure 10). A detailed analysis of each component follows in the next subsections.
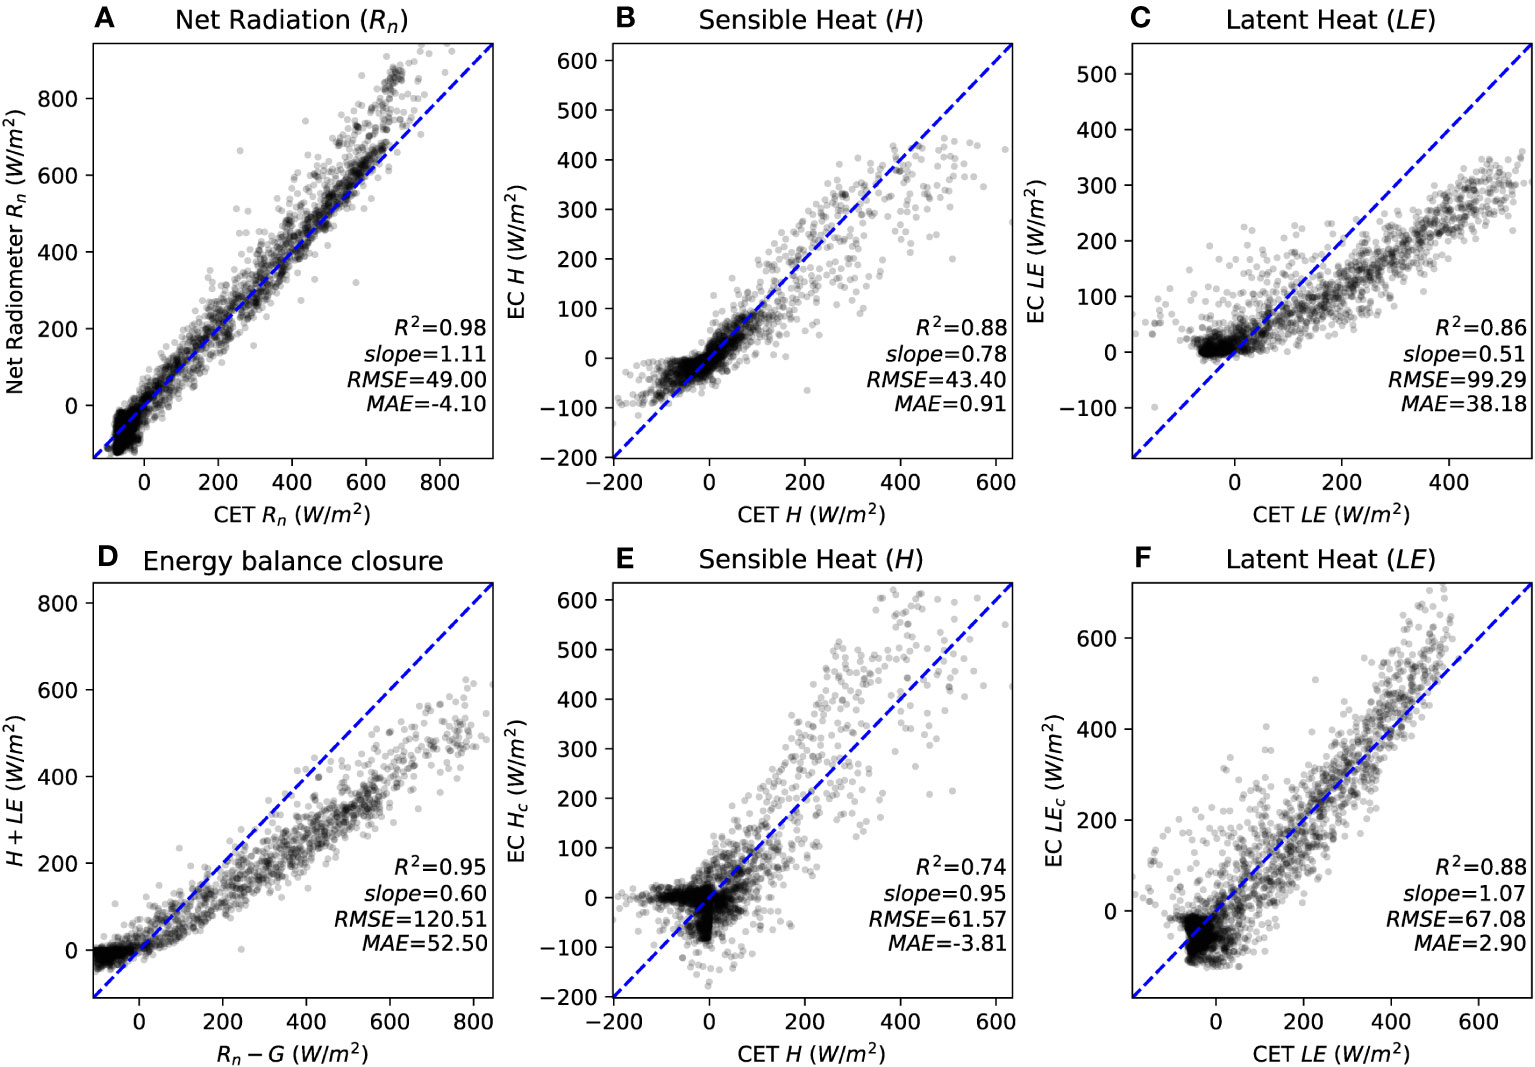
Figure 8 Validation of the energy balance componentes estimated by the CORDOVA-ET (CET), against the measurements of the eddy covariance (EC). The plots show the net radiation (Rn) (A), sensible heat (H) (B), latent heat (H) (C), the energy balance closure of the turbulent fluxes (H + LE) versus the available energy measured from the net radiometer (Rn− G) (D), corrected sensible heat (Hc) (E), and corrected latent heat (LEc) (F). Each plot shows the R2, slope, root mean square error (RMSE) and mean absolute error (MAE).
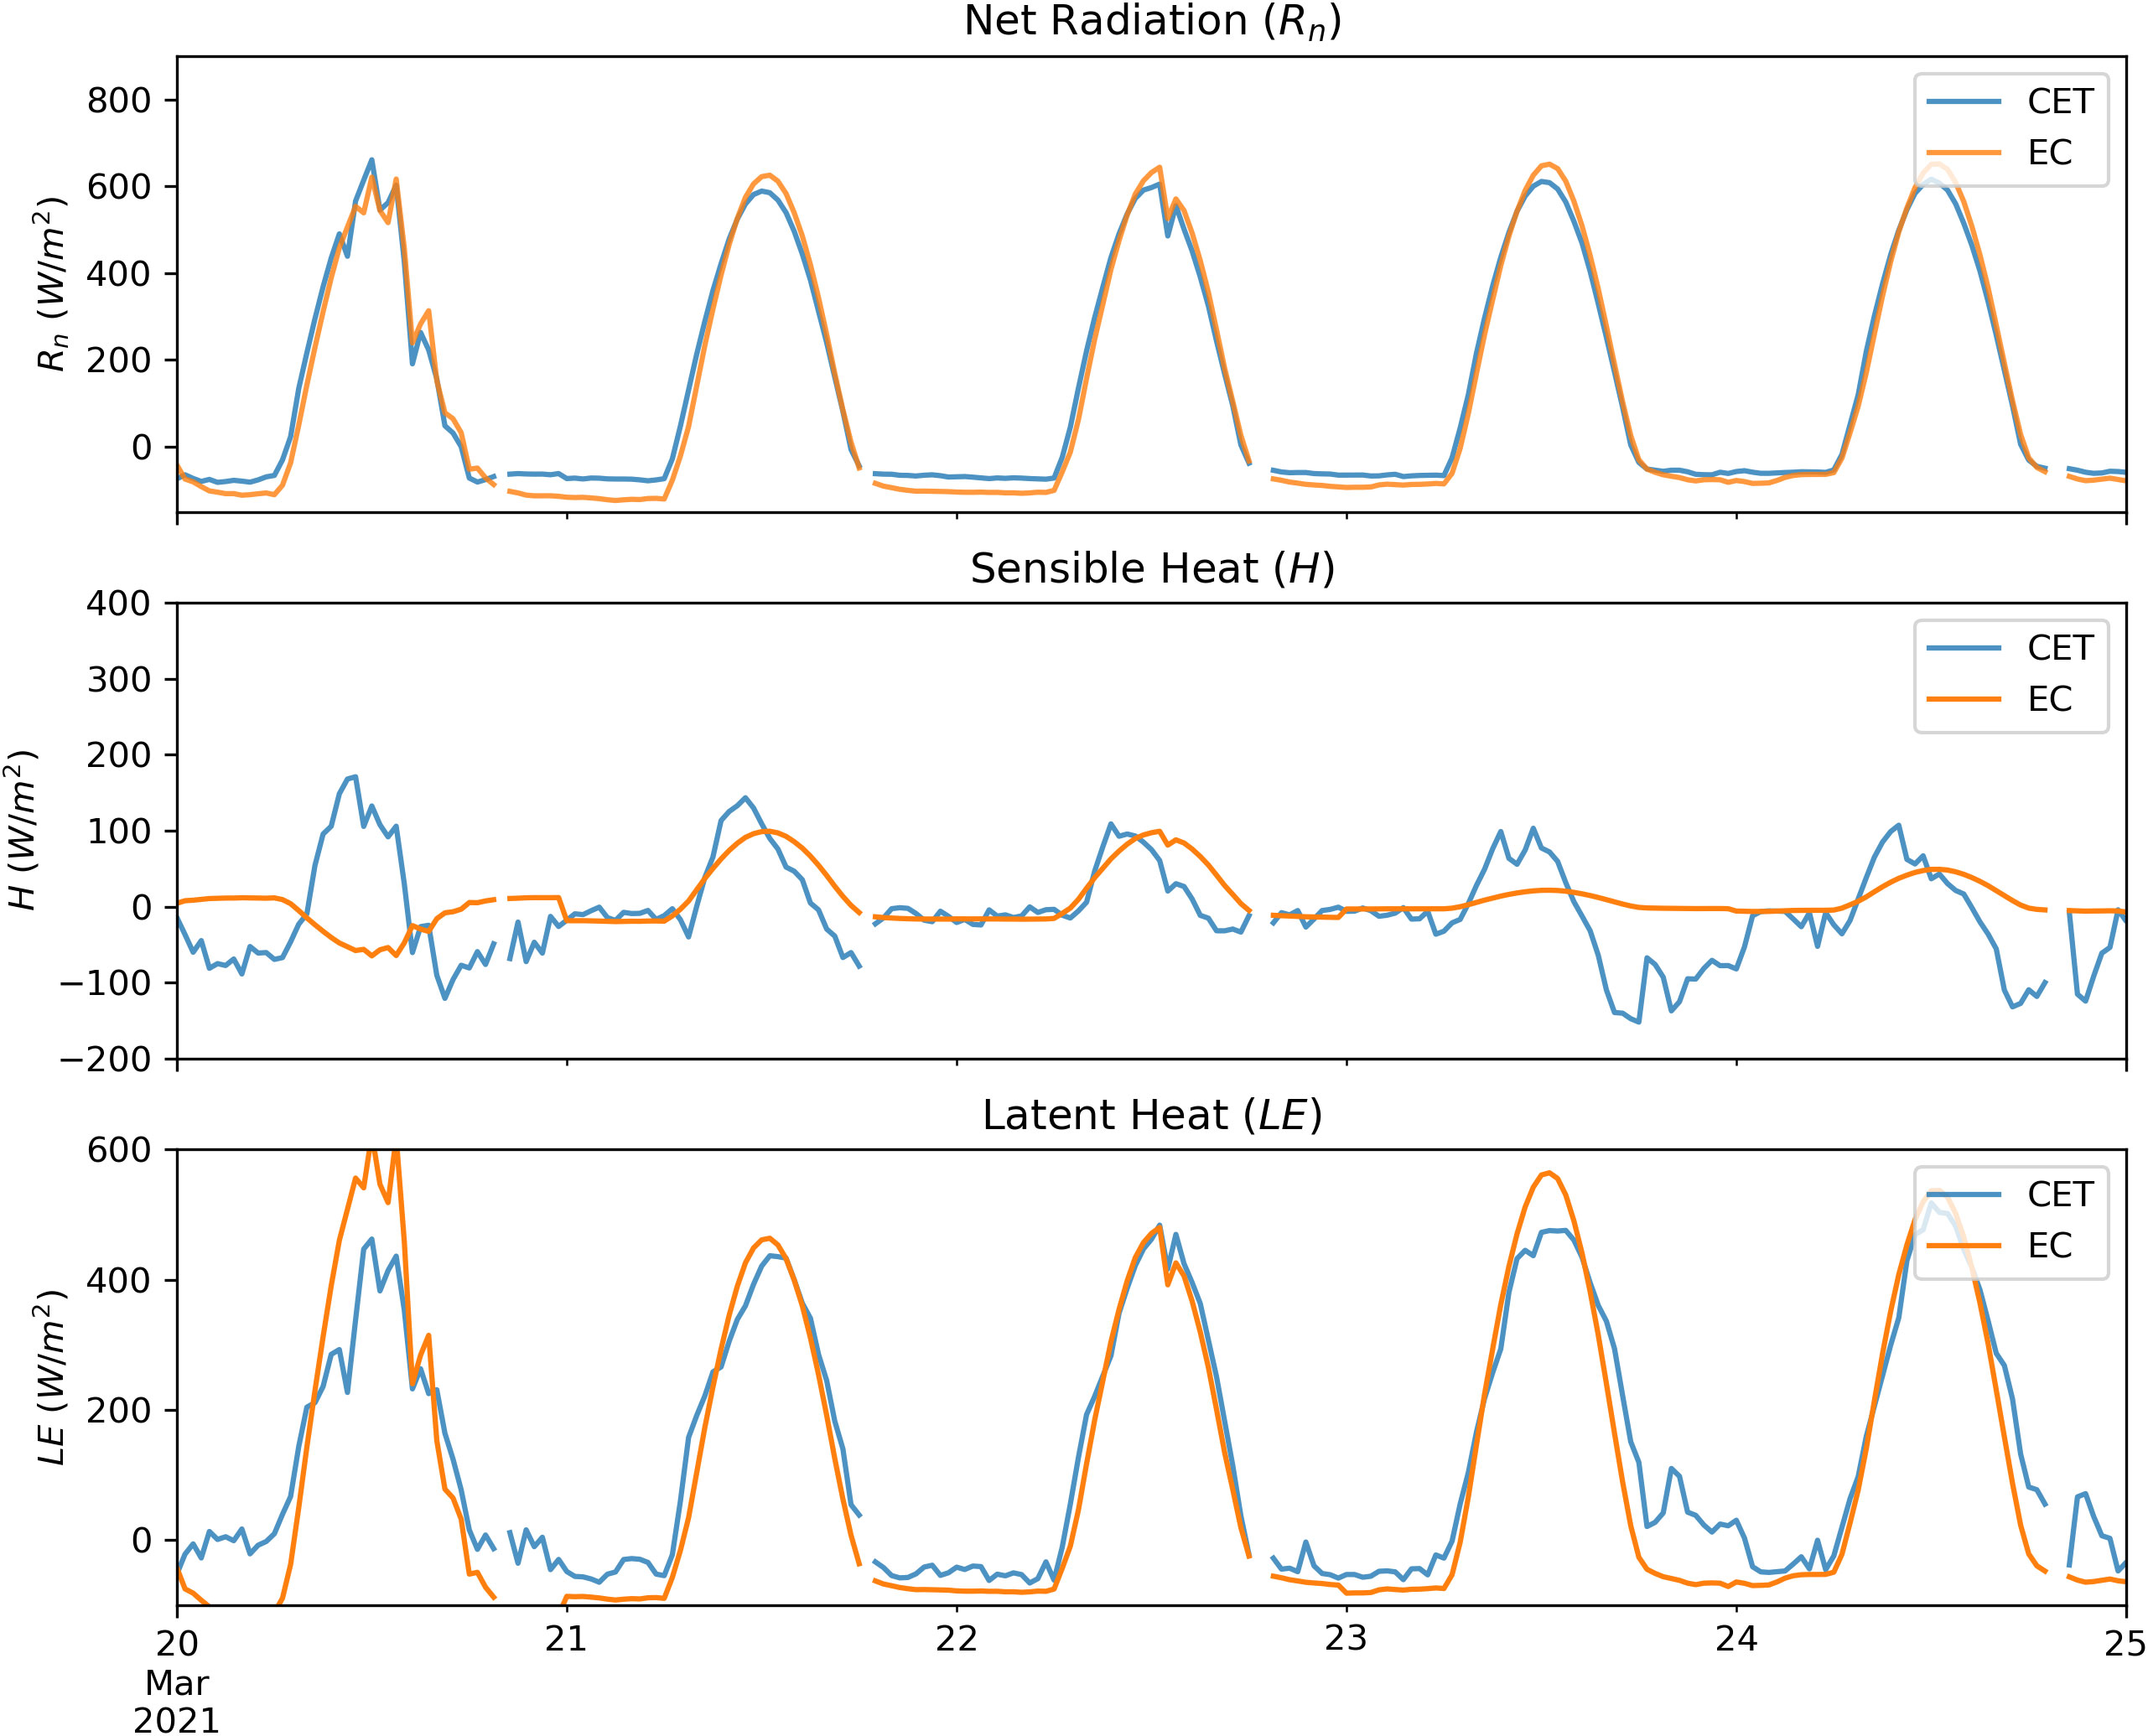
Figure 9 Time course of the energy balance components estimated by the CORDOVA-ET (CET), and measurements of the eddy covariance (EC) after energy balance closure using net radiation.
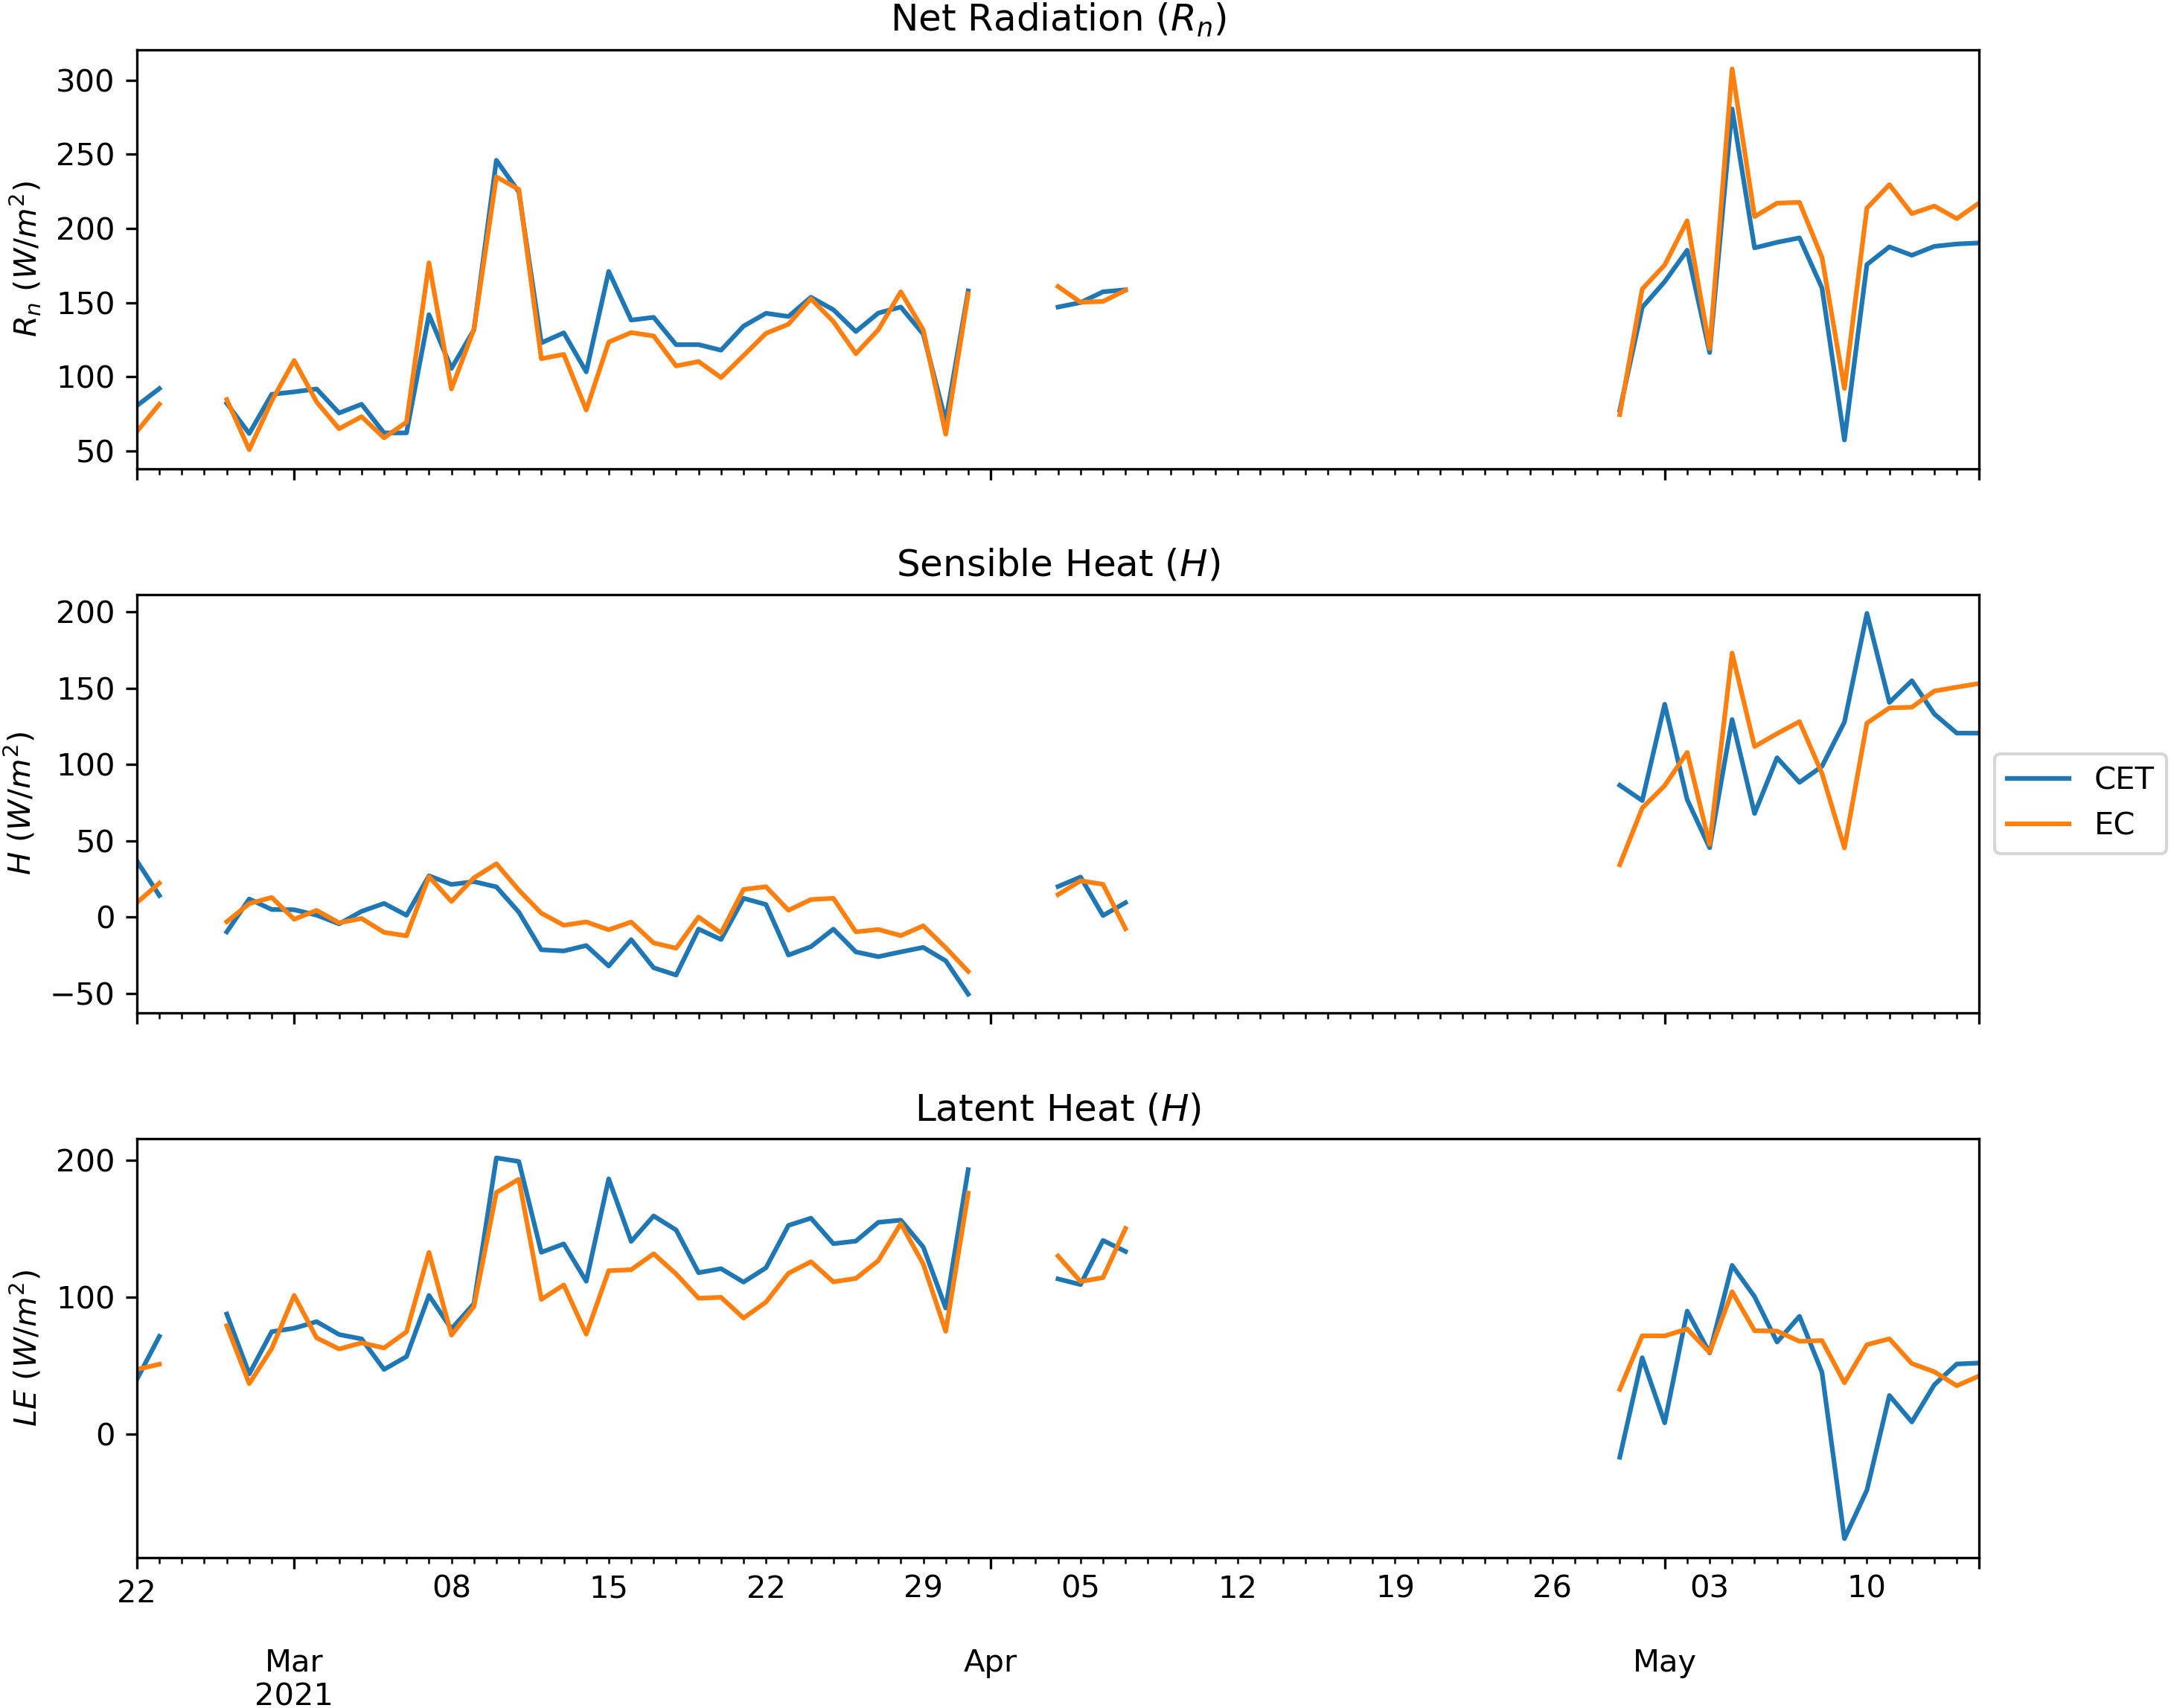
Figure 10 Daily averages of the energy balance componentes estimated by the CORDOVA-ET (CET), and measurements of the eddy covariance (EC) after energy balance closure using net radiation.
3.2.1 Net radiation
The net radiation (Rn) modeled using the equation (7) and the approach described to calculate longwave radiation was compared with the measurements from the four-way net radiometer after removing night-time observations (Figure 8A). The results showed good agreement between the field measurements with the net radiometer and the modeled Rn: R2=0.98, slope=1.12, RMSE=50.28, MAE=4.58 Wm−2. However, it is evident that the values of Rn > 650 showed higher deviation which could be caused by differences between the fixed albedo assumed in the model (α = 0.18) and the actual crop albedo. The daily course of Rn in Figure 9 shows that the modeled values tracked the measurements perfectly, even on days with cloudy conditions.
The analysis of the energy balance closure comparing the sum of the eddy covariance fluxes (H+LE) and the available energy measured with the net radiometer (Rn− G) (Figure 8D) showed a good correlation (R2= 0.95) but a consistent underestimation of the turbulent fluxes (slope=0.60). The poor closure is likely due to the low sensor height, which was adjusted to ensure 90% footprint within the wheat field. However, with a full cover crop like this one, the strategy of correcting the closure error using the ratio of enegy available and energy used ensure the quality of LE and H flux data (Twine et al., 2000). These results highlight the importance of correcting the energy components determined by the eddy covariance using equations (10) and (11) measurements of Rnand G.
3.2.2 Sensible heat
The estimates of H from the CORDOVA-ET showed a high correlation with the measurements from the eddy covariance before closure correction (Figure 8B), with R2 = 0.88, but the modeled H overestimated the measurements by 20% (R2= 0.8), with the results showing a higher scatter at H values higher than 100 Wm−2. Overall, the RMSE before the correction was 43.40 Wm−2. After applying the closure correction using Bowen ratio (Figure 8E), R2 decreases to 0.74 and the RMSE increases to 61.57 Wm−2, while the slope increases to 0.95. A significant scattering is observed at values close to 0 that cause large positive or negative β values due to the very small denominator. In any case, the large dispersion and underestimation of H at higher values suggest that there may be issues with the estimates of the aerodynamic resistance or the emissivity that affects these terms in equation (3).
3.2.3 Latent heat and evapotranspiration
The LE calculated as the residual in equation (2) showed a high correlation (Figure 8C) with the measurements from the eddy covariance before closure correction (R2= 0.86). Still, the slope of 0.51 indicates the need to check for corrected values. After the energy balance correction, there is a much higher agreement between the modeled LE and the updated estimates form the eddy covariance (Figure 8F). After the correction, the slope is closer to 1 (1.07) and the RMSE decreases from 99.29 to 62.08 Wm−2, while the MAE decrease from 38.18 to 2.90 Wm−2 (Table 2).

Table 2 Results of the validation of energy balance components before and after the energy balance closure correction (Hcand LEc).
Actual evapotranspiration (ETa) has been calculated as the daily sum of the half-hourly LE fluxes modeled by the CORDOVA-ET and compared with daily ETo calculated from the weather station data (Figure 11). The results showed that the CORDOVA-ET could track the behavior of ETa over a wheat field, showing an increase in crop ET at the beginning of the season and a decline during senescence.
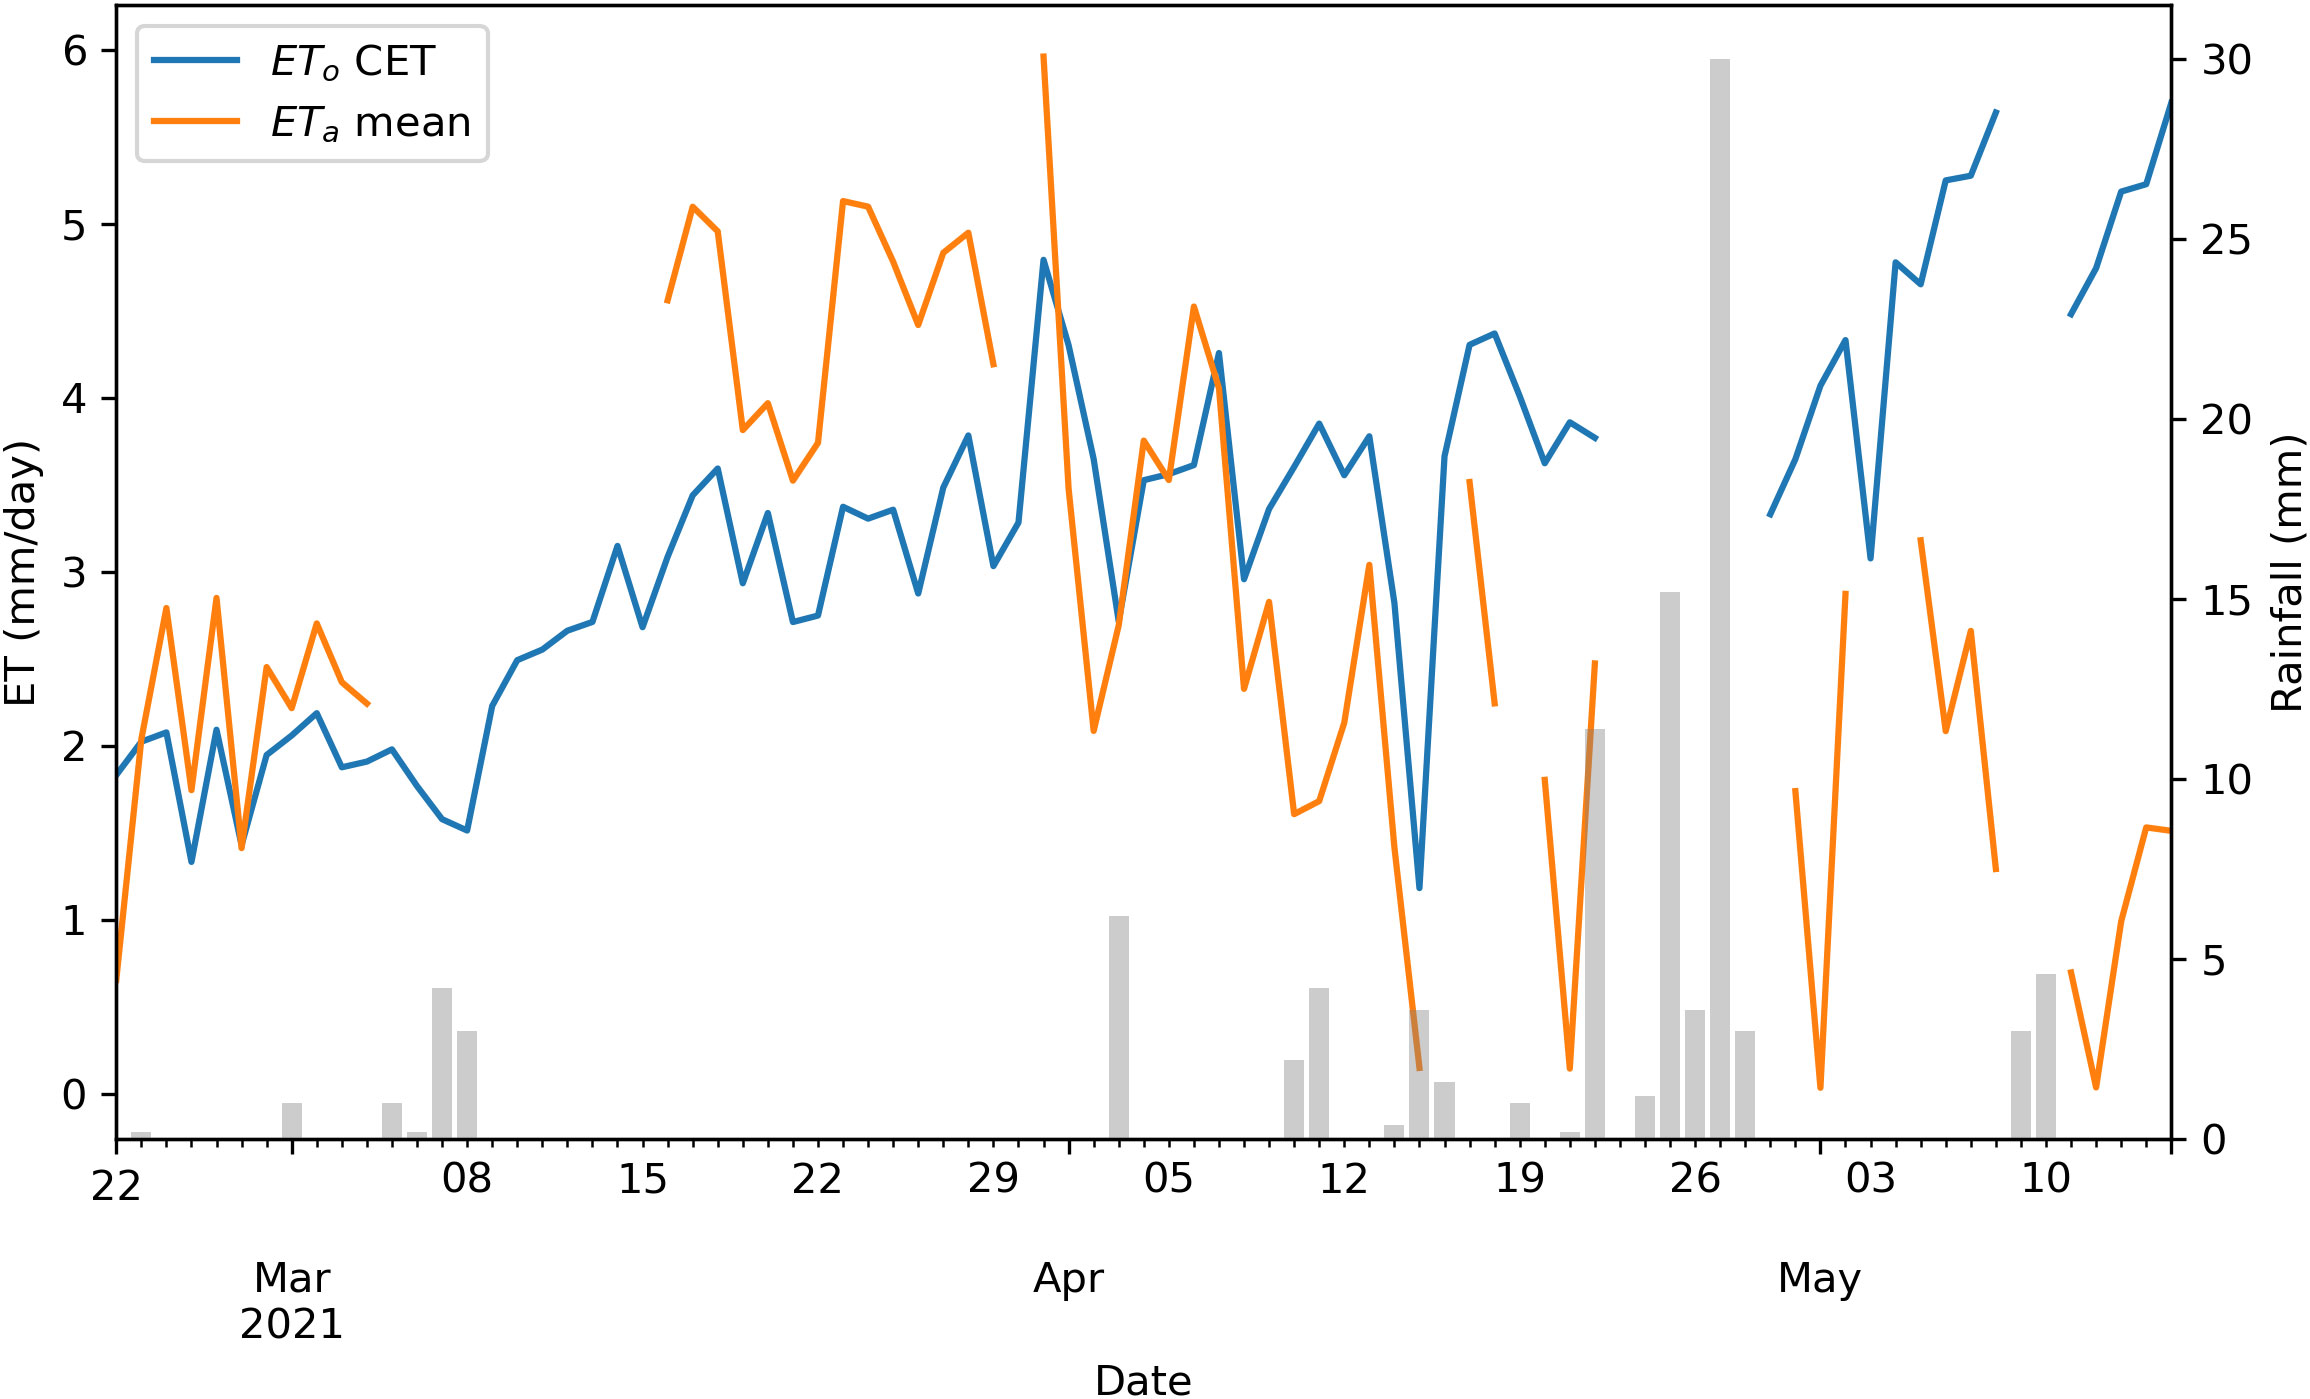
Figure 11 Daily estimates of reference evapotranspiration (ETo) in blue, and actual evapotranspiration (ETa) calculated by the CORDOVA-ET over wheat (mm/day), in orange. Daily rainfall in mm is plotted in grey bars.
4 Discussion
4.1 A simplified and user-friendly approach
The high cost of accurately estimating crop evapotranspiration is a significant obstacle to quantify crop ET in agronomic studies, especially in developing countries or under limited research funding. The equipment for estimating ET using eddy covariance can cost from tens to hundreds of thousands of dollars. While there have been efforts to create low-cost systems (Markwitz and Siebicke, 2019), setting up, maintaining, and processing the data from eddy covariance instrumentation requires substantial expertise. This study aims to provide an affordable solution for researchers and technicians in countries with limited access to this technology. The use of infrared thermometry for measuring plant temperature is becoming widely adopted for estimating drought stress and irrigation management using semi-empirical methods such as the crop water stress index (CWSI) or stress time accumulation, among other methods (Maes and Steppe, 2012). However, using ground-based thermography for estimating actual evapotranspiration is still rare. While recent progress has been made in the use of machine learning for estimating ETa (Pagano et al., 2023), the use of well tested physical models with data acquired with a simpler device can still provide robust estimates of the energy fluxes and evapotranspiration, comparable to the gold standard of eddy covariance, as demonstrated in our results.
4.2 New potential applications
The possibility of calculating both ETo and ETa with the CORDOVA-ET device with results comparable to complex instruments and established methods such as the eddy covariance, opens new avenues and applications such as studying crop coefficients under different irrigation or management strategies. The possibility of using multiple nodes for measuring the canopy temperature of various fields or treatments presents a clear advantage against eddy covariance, where the prevailing winds and instrumental setup determine the observed footprint. With this instrument, the footprint of the canopy temperature measurements can be defined based on the orientation of the sensor and the sensor height, which depending on the sensor’s field-of-view establishes the area of interest. Moreover, having a scalable system with multiple measurements in the same area can also help to characterize the spatial heterogeneity of ET in non-uniform crops. This is paramount in studies focused on validating remote sensing estimates of ET, where satellite imagery’s spatial resolution aggregates pixel heterogeneity.
The CORDOVA-ET system also provides a simple solution for applications such as precise irrigation management. The real-time calculation of both ETo and ETa provides a direct estimate of the water use rates, which could help farmers make decisions on irrigation scheduling. It could also be applied for water stress detection, as each node provides direct measurements of canopy temperature, air temperature and humidity, allowing a straightforward calculation of crop water stress index (CWSI) in each node location. This could be single trees (Berni et al., 2009) or uniform herbaceous crops (O’Shaughnessy et al., 2012). Since the system also provides a complete set of environmental variables, applying a physical approach to CWSI is feasible instead of using empirical baselines (Agam et al., 2013).
4.3 Quality of primary variables and model parameterization
Different studies have focused on the sensitivity analysis of input variables in applying energy balance approaches (Maes and Steppe, 2012) or estimation of reference evapotranspiration (Estévez et al., 2009). Among the critical variables, solar radiation (Rs) is the major contributor to the available energy required for evapotranspiration. In the early versions of this instrument setup, it was clear that the measurements from a commercial weather station were not optimal due to the lack of a cosine diffuser that integrates the total radiation from the sky hemisphere. Modifying the original instrument for integrating an optical diffuser improved the sensor’s performance and provided results similar to the reference pyranometer, with a slope of 0.99 and RMSE and MAE of 42.82 and 6.29 Wm−2 respectively (Figure 12). However, the weather station’s pyranometer, located at 2m, is hard to inspect and clean. Eventually, the adopted solution was to incorporate a commercial pyranometer with a dedicated node. This pyranometer can be installed at a standard and comfortable height for servicing, which ensures high-quality data in the longer term.
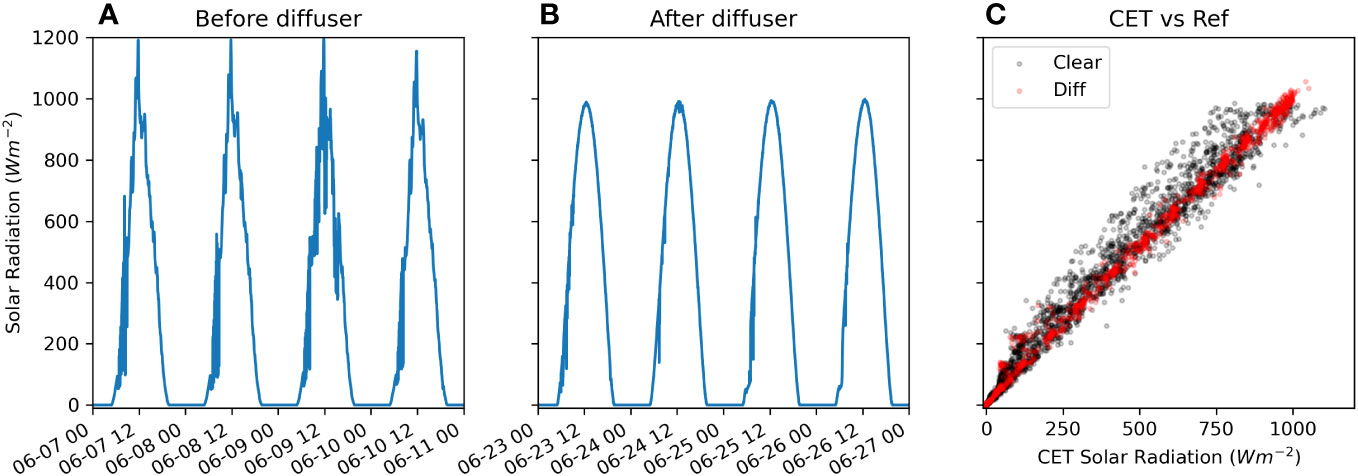
Figure 12 Difference of the commercial weather station without the optical diffuser (A) and after the instalation of the diffuser (B). Plotting the calibrated solar radiation values against the reference weather station (C) shows large scattering without the diffuser (‘Clear’ with black dots) and how the diffuser removes the scattering (‘Diff’ with red dots).
A fundamental parameter in the energy balance modeling is the albedo. The value of α=0.23 is the standard for reference ET calculation using FAO56. However, this value is relatively high for wheat, as reported by Zhang et al. (2012). If fact, it is known that albedo changes along the day as a function of solar elevation, and that it is influenced by canopy height and canopy architecture. In this study, a fixed value of 0.18 has been selected for simplicity. This fixed value can lead to inaccuracies in the estimation of the available energy, especially at times when the solar elevation is low or when the crop starts maturing, and pigment changes can lead to significant changes in reflectance and, therefore, canopy albedo. Figure 13. A exhibits that midday albedo evolves from 0.2 to 0.1 during the validation period, showing values below 0.18 after April (Figure 13A). Moreover, diurnal changes in albedo (Figure 13B) are also very significant and asymmetric as reported in (Zhang et al., 2012). Including an albedometer as part of our system could help track changes in albedo and use measured values instead of a fixed figure. Alternatively, a model could be developed for specific crops using phenology and solar elevation as the inputs or using proxies such as spectral reflectance sensors (Cao et al., 2018).
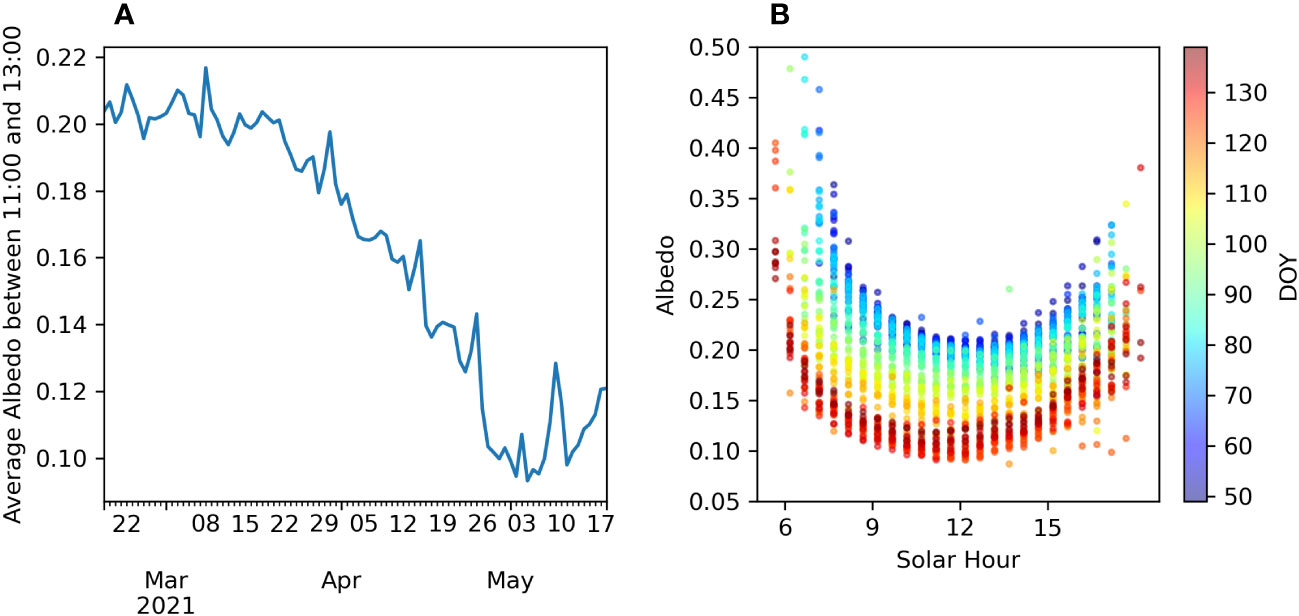
Figure 13 Evolution of albedo measures with the net radiometer. (A) Evolution of the average midday (between 11:00 to 13:00) albedo. (B) daily changes of albedo according to the solar time. Colours represent the day of the year (DOY).
The aerodynamic resistance (ra) plays a crucial role in the H equation ((3)), but direct measurement of this parameter with instruments is not feasible. Therefore, it can only be estimated using models. In our study, we employed the model proposed by Viney (1991) to estimate ra due to its ability to incorporate canopy temperature measurements, which allows for the inclusion of buoyancy effects. It is important to note that using this semi-empirical estimation method provides a practical approach to estimating ra without direct measurements. However, it is essential to consider the limitations of this approach. The empirical parameters used in the model were derived under specific conditions, and their applicability to different field scenarios may vary. While the canopy-air temperature difference for buoyancy correction improves the estimation of ra, it is still necessary to validate the model’s performance under the specific conditions encountered in the field. Furthermore, other parameters influenced by canopy architecture, such as d and zo, could also benefit from more sophisticated parameterization techniques, like the drag partition model utilizing frontal area index (Raupach, 1992), or other simplifications (Verhoef et al., 1997). These alternative approaches may provide more accurate estimations for complex canopies, including tree crops (Berni et al., 2009).
In this instrument, the canopy temperature measured with an infrared thermometer is the basis for calculating H. Here, we assume that the canopy temperature (Tc) measured with the IR radiometer equals the aerodynamic temperature (T0) originally used in equation (3). However, T0 is not directly measurable, and the relationship between Tc and T0 is complex (Colaizzi et al., 2004) and depends on viewing angle, atmospheric stability, vegetation structure, and soil temperature (Maes and Steppe, 2012). While several formulations have been proposed to deal with this discrepancy (Mahrt and Vickers, 2004; Kustas et al., 2007; Kustas and Anderson, 2009; Mallick et al., 2022), the use of off-nadir Tc observations can minimize the differences between Tc and T0 (Huband and Monteith, 1986; Matsushima and Kondo, 1997) and it is possible to assume for close range measurements over full canopy cover. In our case, the sensor is installed at 45 degrees off-nadir, which is close to the optimal 50-70 deg reported by (Huband and Monteith, 1986; Matsushima and Kondo, 1997), while the chances of looking at the sky or soil in trees or row crops.
It is important to note that the methodology presented relies on the big-leaf assumption and requires temperature observations from pure vegetation with minimal soil contamination. This means that if the methodology is used in crops with partial cover or in situations where there are significant differences between the temperature of the canopy and soil, the results of H may be biased. Using multi-source energy balance models could enhance this situation and provide more accurate results (Anderson et al., 1997). This modular system would be able to incorporate multiple temperature measurements for canopy and soil or even multiple viewing angles.
4.4 Importance of open-source
A significant contribution of this study is that all the components required to build the sensors, acquire the data, and process the data for obtaining energy fluxes and crop ET are open-source. Offering an open-source solution for estimating ET seeks to provide a viable alternative to researchers and technicians, particularly in developing countries. This open-source option not only reduces the entry barrier in terms of cost and knowledge. It also provides a reproducible solution where the users can completely control all the processing steps and parameterization in modeling the energy fluxes. Also, this development can serve as a base for future developments for interfacing new sensors. Similarly to how we developed a specific node for interfacing a pyranometer, other researchers could implement developments for interfacing other sensors for measuring soil moisture, canopy height, or spectral reflectance, among different possibilities.
5 Conclusions
Using a combination of commercial, inexpensive, and commercial-off-the-shelf sensors with energy balance modeling provides a cost-effective and reliable solution for estimating crop water use. The CORDOVA-ET (COnductance Recording Device for Observation and VAlidation of ET) system has proven to be a simple yet robust tool for determining both ETo and ETa, needed for a wide range of applications in agronomy. Irrigation advisory services could be set up for making informed decisions on irrigation scheduling. The study also highlights the importance of open-source solutions in reducing entry barriers and providing reproducible results. Despite the low cost of the selected sensors, the accuracy of the measurements was sufficient to ensure the applicability of energy balance models. The model implemented is based on the big-leaf assumption, which requires complete canopy cover to ensure accurate vegetation temperature measurement without interference from soil temperature. Compared with more elaborated models that consider multiple sources for the energy balance, this could limit the applicability in sparse and severely water-stressed crops. It is also essential to emphasize the need for routine maintenance and verification of the device, as the long-term stability of these devices may be compromised by the capacity to endure long-term and the harsh conditions of arid environments.
Data availability statement
The raw data supporting the conclusions of this article will be made available by the authors, without undue reservation.
Author contributions
JJ-B and EF conceptualized the system and drafted the initial version of the manuscript. JJ-B developed the software and hardware, and conducted data analysis with inputs from AC-L. AC-L and AL-G constructed and documented the nodes, and facilitated data acquisition from the CORDOVA-ET. FV and LT collected and processed the validation data obtained from the eddy covariance. All authors contributed feedback to the final version of the manuscript. All authors contributed to the article and approved the submitted version.
Funding
Support through the FAO’s project titled “Implementing the 2030 Agenda for Water Efficiency/Productivity and Water Sustainability in NENA Countries” (GCP/RNE/009/SWE) funded by the Swedish International Development Cooperation Agency (SIDA). Additional funding was provided by Grupo PAIDI AGR-119, Junta de Andalucia and PP-RC-OPI-MODEXTREME-DU.01.3J.21.02 (Universidad de Cordoba, Spain).
Acknowledgments
We want to thank FAO for their valuable support through the project titled “Implementing the 2030 Agenda for water efficiency/productivity and water sustainability in NENA Countries” (GCP/RNE/009/SWE). We are thankful for the encouragement and guidance provided by Domitille Vallée and Pasquale Steduto. Additionally, we extend our appreciation to the network participants who contributed to this research, especially Ayman Ibrahim and Alaa Mosaad from Egypt, Naem Mazahreh and Osama Owaneh from Jordan, Ihab Jomaa from Lebanon, Abla Kettani from Morocco, and Itidel Alaya from Tunisia. Their active involvement and collaboration were instrumental in the success of this project. Special thanks go to Ignacio Calatrava and Rafael del Río for their assistance installing and maintaining the eddy covariance equipment. Their expertise was invaluable in ensuring the accuracy and reliability of our data.
Conflict of interest
The authors declare that the research was conducted in the absence of any commercial or financial relationships that could be construed as a potential conflict of interest.
Publisher’s note
All claims expressed in this article are solely those of the authors and do not necessarily represent those of their affiliated organizations, or those of the publisher, the editors and the reviewers. Any product that may be evaluated in this article, or claim that may be made by its manufacturer, is not guaranteed or endorsed by the publisher.
References
Agam N., Cohen Y., Berni J. A. J., Alchanatis V., Kool D., Dag A., et al. (2013). An insight to the performance of crop water stress index for olive trees. Agric. Water Manage. 118, 79–86. doi: 10.1016/j.agwat.2012.12.004
Allen R., Irmak A., Trezza R., Hendrickx J. M. H., Bastiaanssen W., Kjaersgaard J. (2011). Satellite-based ET estimation in agriculture using SEBAL and METRIC. Hydrol. Process. 25, 40114027. doi: 10.1002/hyp.8408
Allen R. G., Pereira L. S., Raes D., Smith M. (1998). Crop evapotranspiration: guidelines for computing crop water requirements. (Roma: Food; Agriculture Organization of the United Nations).
Anderson M. C., Norman J. M., Diak G. R., Kustas W. P., Mecikalski J. R. (1997). A two-source time-integrated model for estimating surface fluxes using thermal infrared remote sensing. Remote Sens. Environ. 60, 195–216. doi: 10.1016/S0034-4257(96)00215-5
Baldocchi D. (2014). Measuring fluxes of trace gases and energy between ecosystems and the atmosphere - the state and future of the eddy covariance method. Global Change Biol. 20, 3600–3609. doi: 10.1111/gcb.12649
Baldocchi D. D., Hincks B. B., Meyers T. P. (1988). Measuring biosphere-atmosphere exchanges of biologically related gases with micrometeorological methods. Ecology 69, 13311340. doi: 10.2307/1941631
Bastiaanssen W. G. M., Pelgrum H., Wang J., Ma Y., Moreno J. F., Roerink G. J., et al. (1998). A remote sensing surface energy balance algorithm for land (SEBAL).: Part 2: validation. J. Hydrol. 212-213, 213229. doi: 10.1016/S0022-1694(98)00254-6
Berni J. A. J., Zarco-Tejada P. J., Sepulcre-Cantó G., Fereres E., Villalobos F. (2009). Mapping canopy conductance and CWSI in olive orchards using high resolution thermal remote sensing imagery. Remote Sens. Environ. 113, 23802388. doi: 10.1016/j.rse.2009.06.018
Cao C., Lee X., Muhlhausen J., Bonneau L., Xu J. (2018). Measuring landscape albedo using unmanned aerial vehicles. Remote Sens. 10, 1812. doi: 10.3390/rs10111812
Colaizzi P. D., Evett S. R., Howell T. A., Tolk J. A. (2004). "Comparison of aerodynamic and radiometric surface temperature using precision weighing lysimeters", Proc. SPIE 5544, Remote Sensing and Modeling of Ecosystems for Sustainability, (9 November 2004). doi: 10.1117/12.559503
Crawford T. M., Duchon C. E. (1999). An improved parameterization for estimating effective atmospheric emissivity for use in calculating daytime downwelling longwave radiation. J. Appl. Meteorol. 38, 474–480. doi: 10.1175/1520-0450(1999)038<0474:AIPFEE>2.0.CO;2
Deery D. M., Rebetzke G. J., Jimenez-Berni J. A., Bovill W. D., James R. A., Condon A. G., et al. (2019). Evaluation of the phenotypic repeatability of canopy temperature in wheat using continuous-terrestrial and airborne measurements. Front. Plant Sci. 10. doi: 10.3389/fpls.2019.00875
Estévez J., Gavilán P., Berengena J. (2009). Sensitivity analysis of a Penman-Monteith type equation to estimate reference evapotranspiration in southern Spain. Hydrol. Process. 23, 3342–3353. doi: 10.1002/hyp.7439
Evett S. R., Schwartz R. C., Casanova J. J., Heng L. K. (2012). Soil water sensing for water balance, ET and WUE. Agric. Water Manage. 104, 19. doi: 10.1016/j.agwat.2011.12.002
Fereres E., Soriano M. A. (2007). Deficit irrigation for reducing agricultural water use. J. Exp. Bot. 58, 147159. doi: 10.1093/jxb/erl165
Howell T. A., Schneider A. D., Dusek D. A., Marek T. H., Steiner J. L. (1995). Calibration and scale performance of bushland weighting lysimeters. Trans. ASAE 38, 1019–1024. doi: 10.13031/2013.27918
Huband N. D. S., Monteith J. L. (1986). Radiative surface temperature and energy balance of a wheat canopy. Boundary-Layer Meteorol. 36, 1–17. doi: 10.1007/BF00117455
Jimenez-Berni J. A. (2023). OpenAgriTech/opencroplib: v0.1.0 (https://github.com/OpenAgriTech/ope: Zenodo). doi: 10.5281/zenodo.8364969
Jones H. G., Hutchinson P. A., May T., Jamali H., Deery D. M. (2018). A practical method using a network of fixed infrared sensors for estimating crop canopy conductance and evaporation rate. Biosyst. Eng. 165, 59–69. doi: 10.1016/j.biosystemseng.2017.09.012
Krishnan P., Meyers T. P., Hook S. J., Heuer M., Senn D., Dumas E. J. (2020). Intercomparison of in situ sensors for ground-based land surface temperature measurements. Sensors 20, 5268. doi: 10.3390/s20185268
Kustas W., Anderson M. (2009). Advances in thermal infrared remote sensing for land surface modeling. Agric. For. Meteorol. 149, 2071–2081. doi: 10.1016/j.agrformet.2009.05.016
Kustas W. P., Anderson M. C., Norman J. M., Li F. (2007). Utility of radiometric–aerodynamic temperature relations for heat flux estimation. Boundary-Layer Meteorol. 122, 167–187. doi: 10.1007/s10546-006-9093-1
Liu S., Lu L., Mao D., Jia L. (2007). Evaluating parameterizations of aerodynamic resistance to heat transfer using field measurements. Hydrol. Earth Syst. Sci. Discuss. 11, 769–783. doi: 10.5194/hess-11769-2007
Maes W. H., Steppe K. (2012). Estimating evapotranspiration and drought stress with ground-based thermal remote sensing in agriculture: a review. J. Exp. Bot. 63, 4671–4712. doi: 10.1093/jxb/ers165
Mahrt L., Vickers D. (2004). Bulk formulation of the surface heat flux. Boundary-Layer Meteorol. 110, 357–379. doi: 10.1023/B:BOUN.0000007244.42320.1e
Mallick K., Baldocchi D., Jarvis A., Hu T., Trebs I., Sulis M., et al. (2022). Insights into the aerodynamic versus radiometric surface temperature debate in thermal-based evaporation modeling. Geophys. Res. Lett. 49 (15). doi: 10.1029/2021gl097568
Marek T. H., Porter D., Howell T. A., Marek G. W., Brauer D. (2020). The impact and value of accurate evapotranspiration networks in texas high plains production agriculture. Appl. Eng. Agric. 36, 451–455. doi: 10.13031/aea.13913
Markwitz C., Siebicke L. (2019). Low-cost eddy covariance: a case study of evapotranspiration over agroforestry in Germany. Atmos. Measure. Tech. 12, 4677–4696. doi: 10.5194/amt-124677-2019
Matsushima D., Kondo J. (1997). A proper method for estimating sensible heat flux above a horizontal-homogeneous vegetation canopy using radiometric surface observations. J. Appl. Meteorol. Climatol. 36, 1696–1711. doi: 10.1175/15200450(1997)036<1696:APMFES>2.0.CO;2
Ministerio de Agricultura. (2023) Sistema de informacion agroclimatica para el regadio. Available at: https://eportal.mapa.gob.es/websiar/Inicio.aspx.
Monteith J. L. (1965). Evaporation and environment. Symp. Soc Exp. Biol. 19, 205–234. Available at: https://www.ncbi.nlm.nih.gov/pubmed/5321565.
Moore C. J. (1986). Frequency response corrections for eddy correlation systems. Boundary-Layer Meteorol. 37, 17–35. doi: 10.1007/bf00122754
O’Shaughnessy S. A., Evett S. R., Colaizzi P. D., Howell T. A. (2012). A crop water stress index and time threshold for automatic irrigation scheduling of grain sorghum. Agric. Water Manage. 107, 122–132. doi: 10.1016/j.agwat.2012.01.018
O’Shaughnessy S. A., Hebel M. A., Evett S. R., Colaizzi P. D. (2011). Evaluation of a wireless infrared thermometer with a narrow field of view. Comput. Electron. Agric. 76, 59–68. doi: 10.1016/j.compag.2010.12.017
Pagano A., Amato F., Ippolito M., De Caro D., Croce D., Motisi A., et al. (2023). Machine learning models to predict daily actual evapotranspiration of citrus orchards under regulated deficit irrigation. Ecol. Inf. 76, 102133. doi: 10.1016/j.ecoinf.2023.102133
Penman H. L. (1948). Natural evaporation from open water, bare soil and grass. Proc. R. Soc. London. Ser. A. Math. Phys. Sci. 193, 120–145. doi: 10.1098/rspa.1948.0037
Raupach M. R. (1992). Drag and drag partition on rough surfaces. Boundary-Layer Meteorol. 60, 375–395. doi: 10.1007/bf00155203
Schuepp P. H., Leclerc M. Y., MacPherson J. I., Desjardins R. L. (1990). Footprint prediction of scalar fluxes from analytical solutions of the diffusion equation. Boundary-Layer Meteorol. 50, 355–373. doi: 10.1007/BF00120530
Tanner C. B. (1960). Energy balance approach to evapotranspiration from crops. Soil Sci. Soc Am. J. 24, 19. doi: 10.2136/sssaj1960.03615995002400010012x
Trebs I., Mallick K., Bhattarai N., Sulis M., Cleverly J., Woodgate W., et al. (2021). The role of aerodynamic resistance in thermal remote sensingbased evapotranspiration models. Remote Sens. Environ. 264, 112602. doi: 10.1016/j.rse.2021.112602
Twine T. E., Kustas W. P., Norman J. M., Cook D. R., Houser P. R., Meyers T. P., et al. (2000). Correcting eddy-covariance flux underestimates over a grassland. Agric. For. Meteorol. 103, 279–300. doi: 10.1016/S0168-1923(00)00123-4
Verhoef A., McNaughton K. G., Jacobs A. F. G. (1997). A parameterization of momentum roughness length and displacement height for a wide range of canopy densities. Hydrol. Earth System Sci. 1, 81–91. doi: 10.5194/hess-1-81-1997
Viney N. R. (1991). An empirical expression for aerodynamic resistance in the unstable boundary layer. Bound.-Layer Meteorol. 56, 381393. doi: 10.1007/BF00119213
Walter I. A., Allen R. G., Elliott R., Jensen M. E., Itenfisu D., Mecham B., et al. (2000). ASCE’s standardized reference evapotranspiration equation. Watershed Manage. Operations Manage. 2000, 1–11.
Webb E. K., Pearman G. I., Leuning R. (1980). Correction of flux measurements for density effects due to heat and water vapour transfer. Q. J. R. Meteorol. Soc. 106, 85–100. doi: 10.1002/qj.49710644707
Wilson K. B., Hanson P. J., Mulholland P. J., Baldocchi D. D., Wullschleger S. D. (2001). A comparison of methods for determining forest evapotranspiration and its components: Sap-flow, soil water budget, eddy covariance and catchment water balance. Agric. For. Meteorol. 106, 153–168. doi: 10.1016/s0168-1923(00)00199-4
Keywords: evapotranspiration, sensor networks, irrigation management, energy balance, instrumentation
Citation: Jimenez-Berni JA, Cabello-Leblic A, Lopez-Guerrero A, Villalobos FJ, Testi L and Fereres E (2023) Energy balance determination of crop evapotranspiration using a wireless sensor network. Front. Agron. 5:1244633. doi: 10.3389/fagro.2023.1244633
Received: 22 June 2023; Accepted: 25 September 2023;
Published: 16 October 2023.
Edited by:
Francesco Morari, University of Padua, ItalyReviewed by:
Dengpan Xiao, Hebei Normal University, ChinaRay G Anderson, United States Department of Agriculture, United States
Copyright © 2023 Jimenez-Berni, Cabello-Leblic, Lopez-Guerrero, Villalobos, Testi and Fereres. This is an open-access article distributed under the terms of the Creative Commons Attribution License (CC BY). The use, distribution or reproduction in other forums is permitted, provided the original author(s) and the copyright owner(s) are credited and that the original publication in this journal is cited, in accordance with accepted academic practice. No use, distribution or reproduction is permitted which does not comply with these terms.
*Correspondence: Jose A. Jimenez-Berni, YmVybmlAaWFzLmNzaWMuZXM=
 Jose A. Jimenez-Berni
 Arantxa Cabello-Leblic
 Alicia Lopez-Guerrero
 Francisco J. Villalobos1,2
 Luca Testi