 Fruzsina Schmidt
 Herwart Böhm
 Hans-Peter Piepho
 Peer Urbatzka4
 Michael Wachendorf
- 1Grassland Science and Renewable Plant Resources, Faculty of Organic Agricultural Science, Universität Kassel, Witzenhausen, Germany
- 2Institute of Organic Farming, Johann Henrich von Thünen Institute, Federal Research Institute for Rural Areas, Forestry and Fisheries, Westerau, Germany
- 3Biostatistics Unit, Institute of Crop Science, Universität Hohenheim, Stuttgart, Germany
- 4Institute for Organic Farming, Soil and Resource Management, Bavarian State Research Center for Agriculture, Freising, Germany
Introduction: Yield and its stability are both vital characteristics to evaluate the viability of cropping systems. However, the current frames of field research hardly allow an accurate evaluation of short-term effect stability. Therefore, over nine German environments (three years and three locations), first crop, maize, total harvested dry biomass yield (DMY), and maize dry matter content (DMC) variability were evaluated through a risk assessment in an organically managed silage maize experiment comprising 18 cropping systems.
Material and methods: The treatment factors included first crop group (pure legume, legume–cereal mixture), first crop (winter pea, hairy vetch and their mixtures with rye, control), management—incorporating first crop use and tillage (double cropping system no-till, double cropping system reduced till, double-cropped, mulched system terminated with roller-crimper, control), fertilization and mechanical weed control (yes–no), and row width (75 cm, 50 cm).
Results and discussion: The first crop DMY and maize DMC had a positive relationship with its variance, whereas maize DMY and total DMY had a negative relationship. The differences in risks were governed by system (number of crops), management and first crop (group), and followed compatible patterns with what was observed for their influence on the mean of the parameters. The pedological and climatic conditions, especially near maize sowing and establishment, and therefore the length of season are crucial in double cropping and double-cropped, mulched systems. In its current state, the location in the northern region of Germany was not well suited for the studied alternative systems, whereas in the other regions (central and south), double cropping systems with reduced tillage as well as double-cropped systems with pure legume mulches may offer alternative management systems for silage maize. Further optimization of the critical sowing and establishment phase may result in more diversified options for double cropping and double-cropped, mulched systems in the future.
1 Introduction
Maize is a multifunctional crop with great importance worldwide (Chaudhary et al., 2014). However, the sustainability of the traditional (silage) maize production is questioned due to the negative effects associated with its production—e.g., high weed infestation, intensified weed control, soil erosion, and compaction (Peigné et al., 2007; Reckleben, 2011; Carr et al., 2012; Peigné et al., 2015). Furthermore, the observed and projected adverse effects of climate change, like a change in the length of the cropping season and changes in temperature and precipitation patterns as well as increased frequency and intensity of extreme weather events (MEA, 2005a; MEA, 2005b; MEA, 2005c; IPCC, 2014; EEA, 2017) may exacerbate these production-related difficulties. Therefore, several alternative systems emerged to alleviate the negative side effects and enhance system resilience through row width reduction and/or diversification related to cover crop use (Holderbaum et al., 1990; Peigné et al., 2007; Reckleben, 2011; Carr et al., 2012; Graß et al., 2013; Dierauer et al., 2014; Mhlanga et al., 2016; Roucou et al., 2018; Schmidt et al., 2022; Schmidt et al., 2023). Detailed reviews of some alternative management systems can be found in Peigné et al. (2007; 2015) and Carr et al. (2012), whereas Schmidt et al. (2022; 2023) briefly introduce the systems used in this study.
Despite the relative scarcity of peer-reviewed literature on silage maize production under conservation agriculture in organic and European conditions (Mäder and Berner, 2012), there is some information regarding yield and weed control as well as soil, nutrient, and cover crop management in some alternative management systems (Peigné et al., 2007; Carr et al., 2012; Mäder and Berner, 2012; Graß et al., 2013; Dierauer et al., 2014; Peigné et al., 2015; Böhler and Dierauer, 2017; Schmidt et al., 2022; Schmidt et al., 2023). Information on the yield stability of alternative systems, however, is even scarcer (Graß et al., 2013), not just in the European or organic context.
Next to mean yield, its stability is also an important trait to assess treatment suitability (Piepho, 1996; Piepho, 1998; Piepho, 1999; Döring and Reckling, 2018; Reckling et al., 2021). The latter is often defined in terms of yield variation over time, space, or both (Shukla, 1972; Piepho, 1996; Piepho, 1998; Piepho, 1999; Graß et al., 2013; Döring and Reckling, 2018; Reckling et al., 2021). There are several methods to estimate yield stability (Piepho, 1998; Reckling et al., 2021), grouped into different stability of interest (Piepho, 1998; Döring and Reckling, 2018). However, as Piepho (1998) points out, different concepts may be considered as a difference in the defined variance–covariance structures, showing the similarities among the various approaches.
A very important requirement of any stability measurement is the repetition of experiments over environments (years, locations, or both), often with a focus on long-term changes (Grover et al., 2009; Wallace et al., 2017; Döring and Reckling, 2018; Macholdt et al., 2020; Reckling et al., 2021). However, most field trials by the public sector focus on short-term effects and have a usual 2- to 3-year lifespan over one to a few experimental locations. Even if these shorter-term trials may deliver relatively unreliable estimates compared to their long-term counterparts, which are often indicated by wider confidence intervals (Piepho, 1996), their contribution to system and factor evaluations is still of high interest (Graß et al., 2013), especially in the light of climate change (Reckling et al., 2021).
There are several stability measures aiming to quantify different aspects of variability (Piepho, 1998; Reckling et al., 2021) with different handlings of the variance–mean relationship from simple description to adjustment or a combination of both parameters (Döring and Reckling, 2018; Reckling et al., 2021; Pankou et al., 2022). As agronomically both the mean and its stability are of interest in their own right to deduce meaningful information on treatment suitability (Reckling et al., 2021), one may argue that it is preferable to focus the stability analysis on minimizing the risk of a response variable to fall below/above a certain threshold than to disentangle the variance–mean relationship through an adjustment to separately focus on mean and variability. The former, resulting risk assessment (Piepho, 1998; Reckling et al., 2021) provides a meaningful way to combine both mean performance as well as variance into a single measure, i.e., the risk, to describe treatment suitability.
In the framework of the UNSIFRAN project, several aspects of tillage-reduced weed management strategies for organically managed silage maize production are studied over three years and three locations across Germany. It compares alternative cropping systems managed with different winter cover crops (FC—winter pea, hairy vetch or their mixtures with cereal) grouped into different FC group (pure legumes—pure as well as legume–cereal mixtures—Mix) and their management (double cropping system with or without non-inversion tillage—DCS RT and DCS NT; double-cropped, mulched system—DCMS) as well as row width (75 and 50 cm) to a traditionally managed control, sole maize cropping system (SCS) (Schmidt et al., 2022; Schmidt et al., 2023). The results on location-wise yield performance and weed control efficiency with focus on both factor effects and two-way interactions are discussed in Schmidt et al. (2022; 2023).
This article concentrates on first crop, maize and total harvested dry matter yield (DMY) as well as maize dry matter content (DMC) variation across nine environments. The objectives of the analysis were to understand the main factor effects (FC (group), management, row width) and their interactions on yield variation to assist the understanding of guiding principles. The following hypotheses were examined: (1) maize dry matter yield (DMY) in DCS, DCMS is more stable than in SCS; (2) maize DMY is additionally more stable in DCS RT compared to DCS NT as well as (3) in DCMS Pure compared to DCMS Mix; and (4) total harvested DMY is more stable in DCS, DCMS than in SCS.
2 Materials and methods
A field experiment was conducted at three German locations—Trenthorst, Schleswig-Holstein (TRE, 40 m above sea level (ASL), 53.76667° N, 10.51667° E); Neu-Eichenberg, Hessen (NEB, 247 m ASL, 51.37936° N, 9.91365° E); and Puch, Bayern (PUC, 556 m ASL, 48.18333° N, 11.12000° E)—in three consecutive years (2019–2020, 2020–2021, and 2021–2022) to investigate the yield stability of alternative silage maize cropping systems under organic management across these nine environments. The locations have Luvisols, and the annual average temperature is 8.9°C–9.3°C, whereas the annual cumulative precipitation is 635–856 mm. The detailed, environment-specific weather characteristics can be found in Appendix A (Figure A1; Table A1), whereas the soil characteristics are discussed in Schmidt et al. (2022).
The field experiment followed a row–column design (4 × 20 plots, 30 m2 net plot area) with four replications and included 18 shared treatments tested across the environments. The treatments comprised alternative silage maize cropping systems, collected under the terms double cropping system (DCS) and roller–crimper-terminated double-cropped, mulched system (DCMS), and were compared to a traditionally managed sole silage maize cropping system (SCS). Several factors were included, ranging from first crop [FC—pure winter pea (P) or hairy vetch (V) and their mixtures with cereal (V-Mix, P-Mix), control], FC group—pure legumes (Pure) and legume-cereal mixtures (Mix), management—incorporating the subfactors FC use and tillage (NT, RT, Roll, CT), additional slurry fertilization (yes–no) and mechanical weed control (MWC; yes–no)—and row width (75 and 50 cm) in a non-orthogonal and unbalanced manner (Figure 1). Additionally, the maize sowing date and varieties were adjusted to optimize systems to the number of crops. Hence, any difference among SCS and DCS, DCMS is based on the combined effect of maize sowing date, sown variety, and the presence of a winter cover crop. The experimental factors and their combinations as well as the treatment abbreviations are illustrated in Figure 1. Throughout the paper, the discussed factors are written in italics for clarity (Schmidt et al., 2022; Schmidt et al., 2023), and the list of abbreviations can be found in Table 1. The weather conditions were variable during the three years of the experiment. After a mild winter in 2019–2020, a dry period was observed near the maize sowing dates (May–June). Subsequently, the summer remained dry, especially at TRE. On the contrary, 2020–2021 was characterized by cool and wet conditions near the maize sowing dates. Except for NEB, the locations followed long-term weather trends for the rest of the season. The third year (2021–2022) was similar to the first year with a mild winter, followed by a dry spell at maize sowing and establishment (June). The summer was exceptionally warm and dry, especially at NEB, whereas at TRE the precipitation during the summer months was generally following long-term trends (Figure A1; Table A2, updated from Schmidt et al. (2022) with data obtained from Deutscher Wetterdienst Lübeck; Landesbetrieb Landwirtschaft Hessen and Universität Kassel, Section of Soil Science Neu-Eichenberg; and Bayerische Landesanstalt für Landwirtschaft Puch).
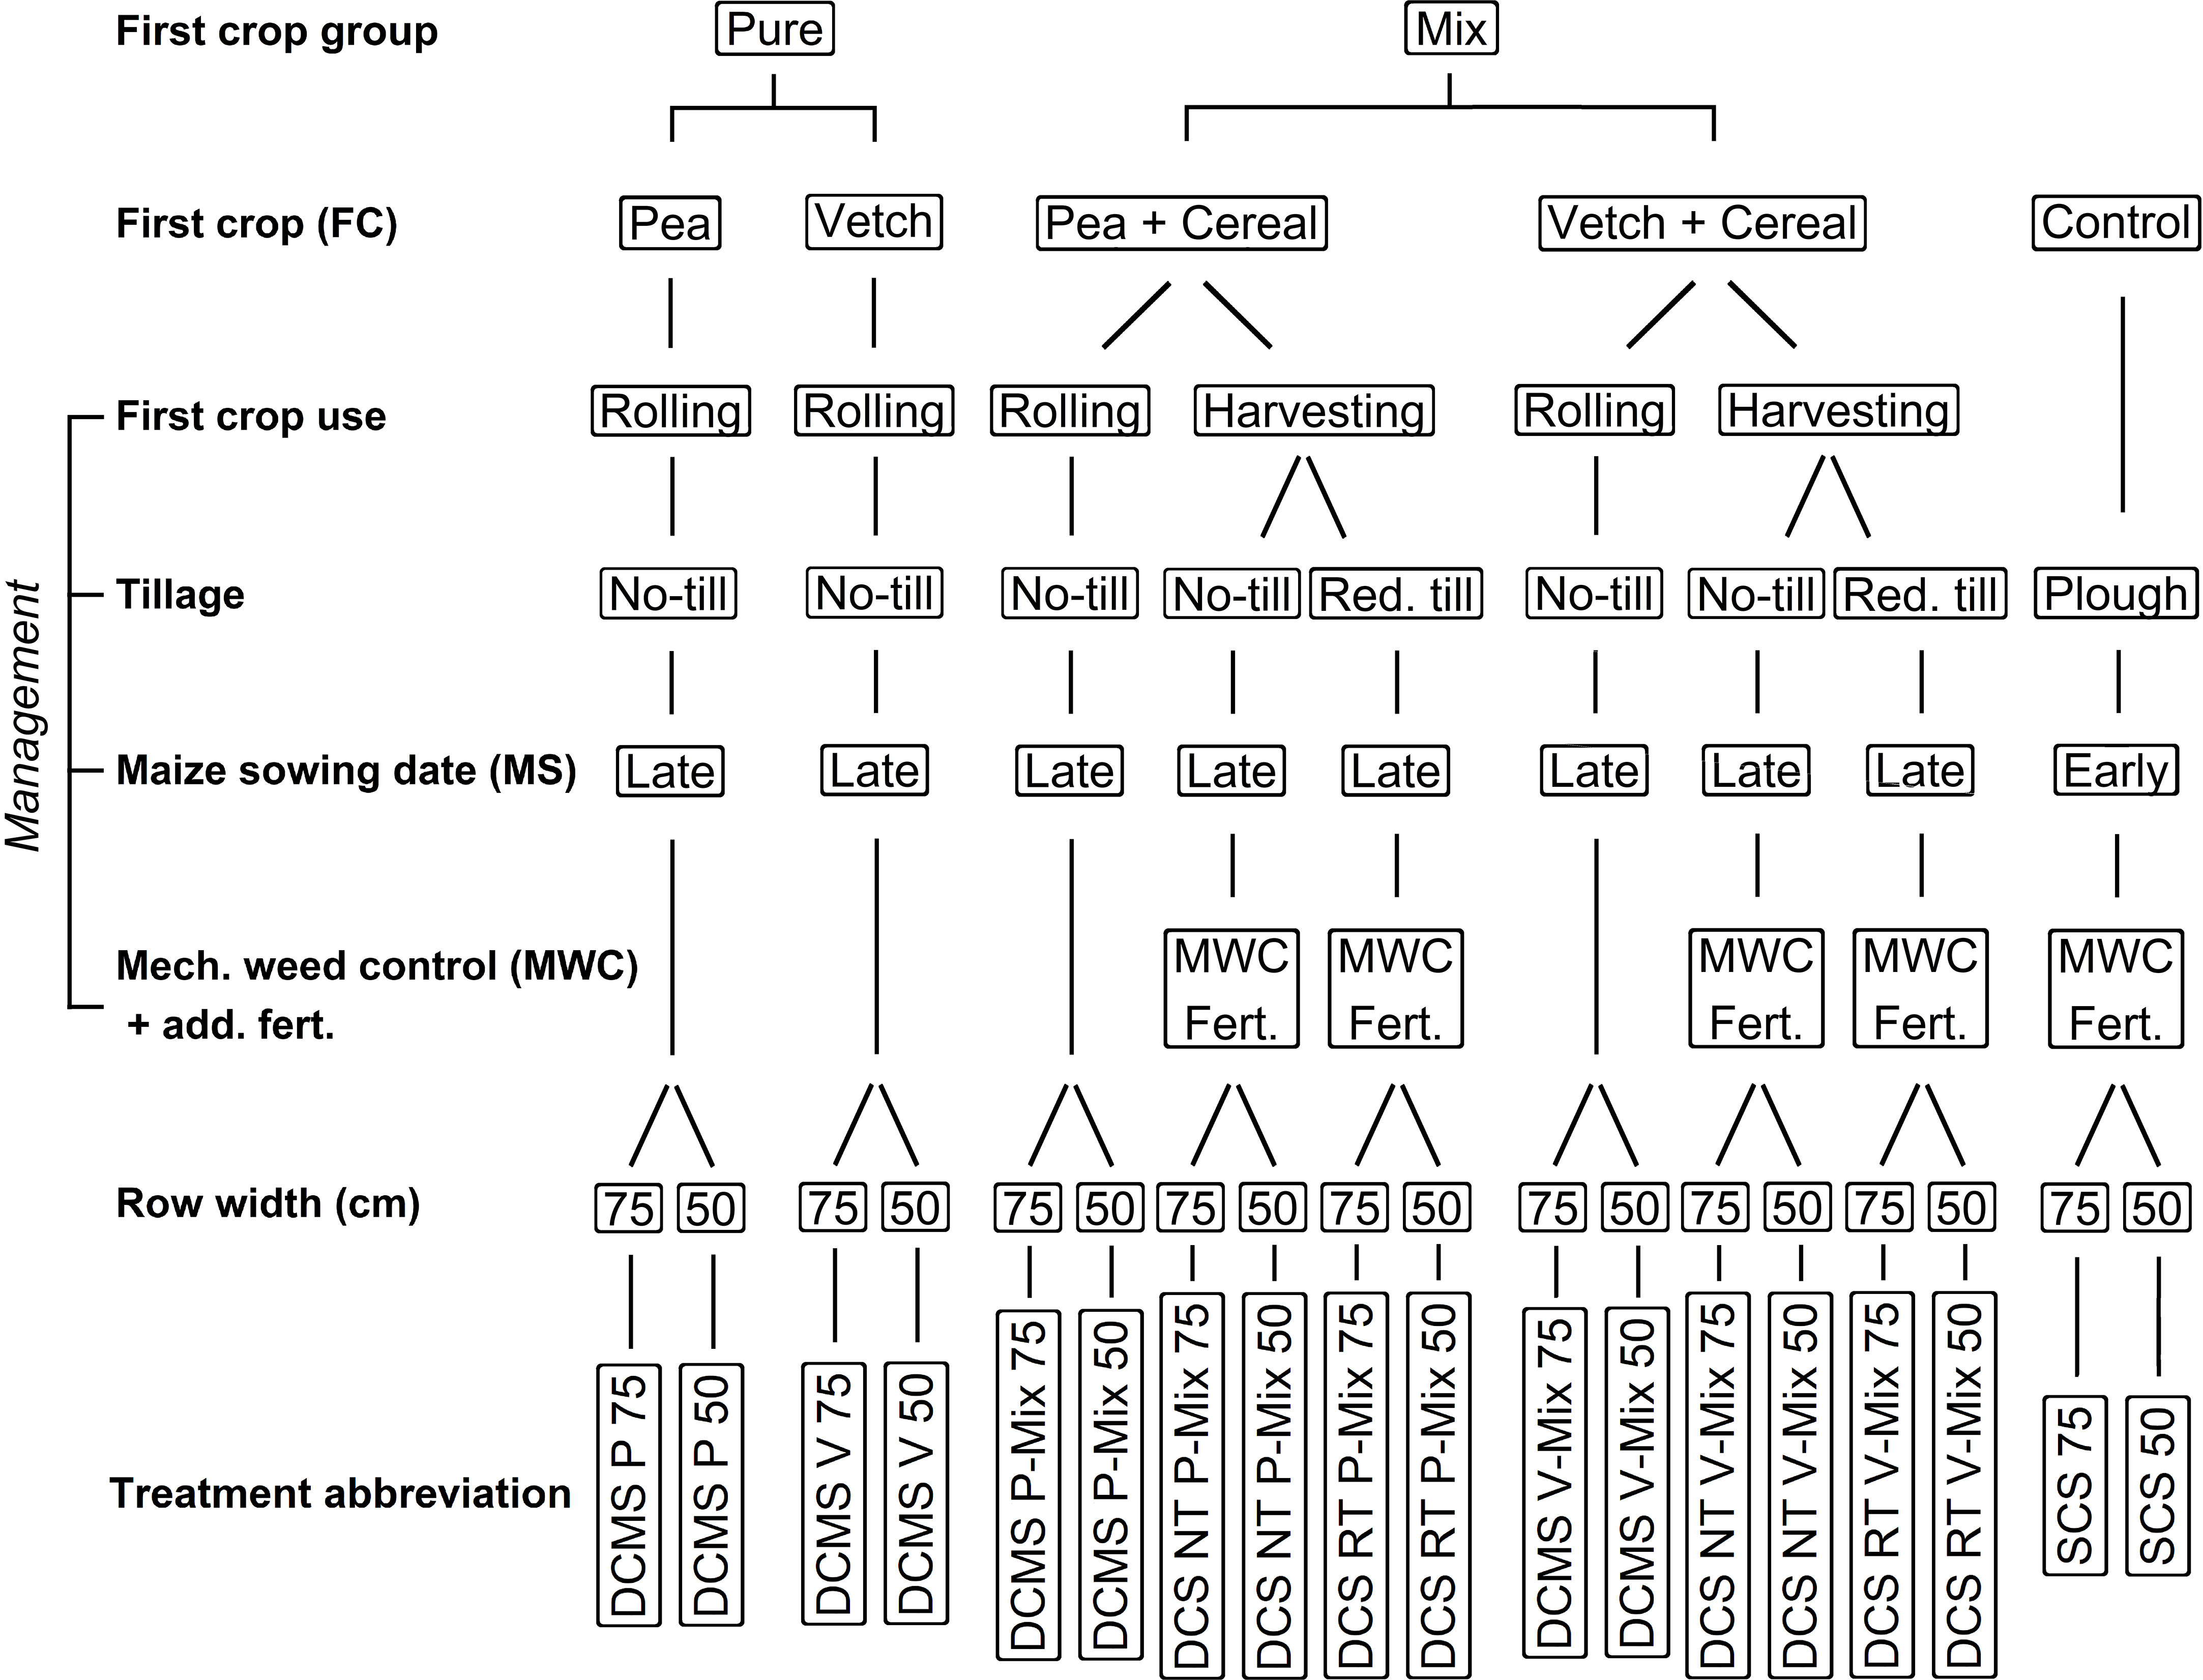
Figure 1 Common treatment combinations at the experimental locations. Red., reduced; till, tillage; add. fert., additional fertilization; DCMS, double-cropped, mulched system; DCS RT, double cropping system with reduced tillage; DCS NT, DCS with no tillage; SCS, control; P, winter pea; P-Mix, winter pea–cereal mixture; V, hairy vetch; V-Mix, hairy vetch–cereal mixture. This figure is modified from Schmidt et al. (2022).
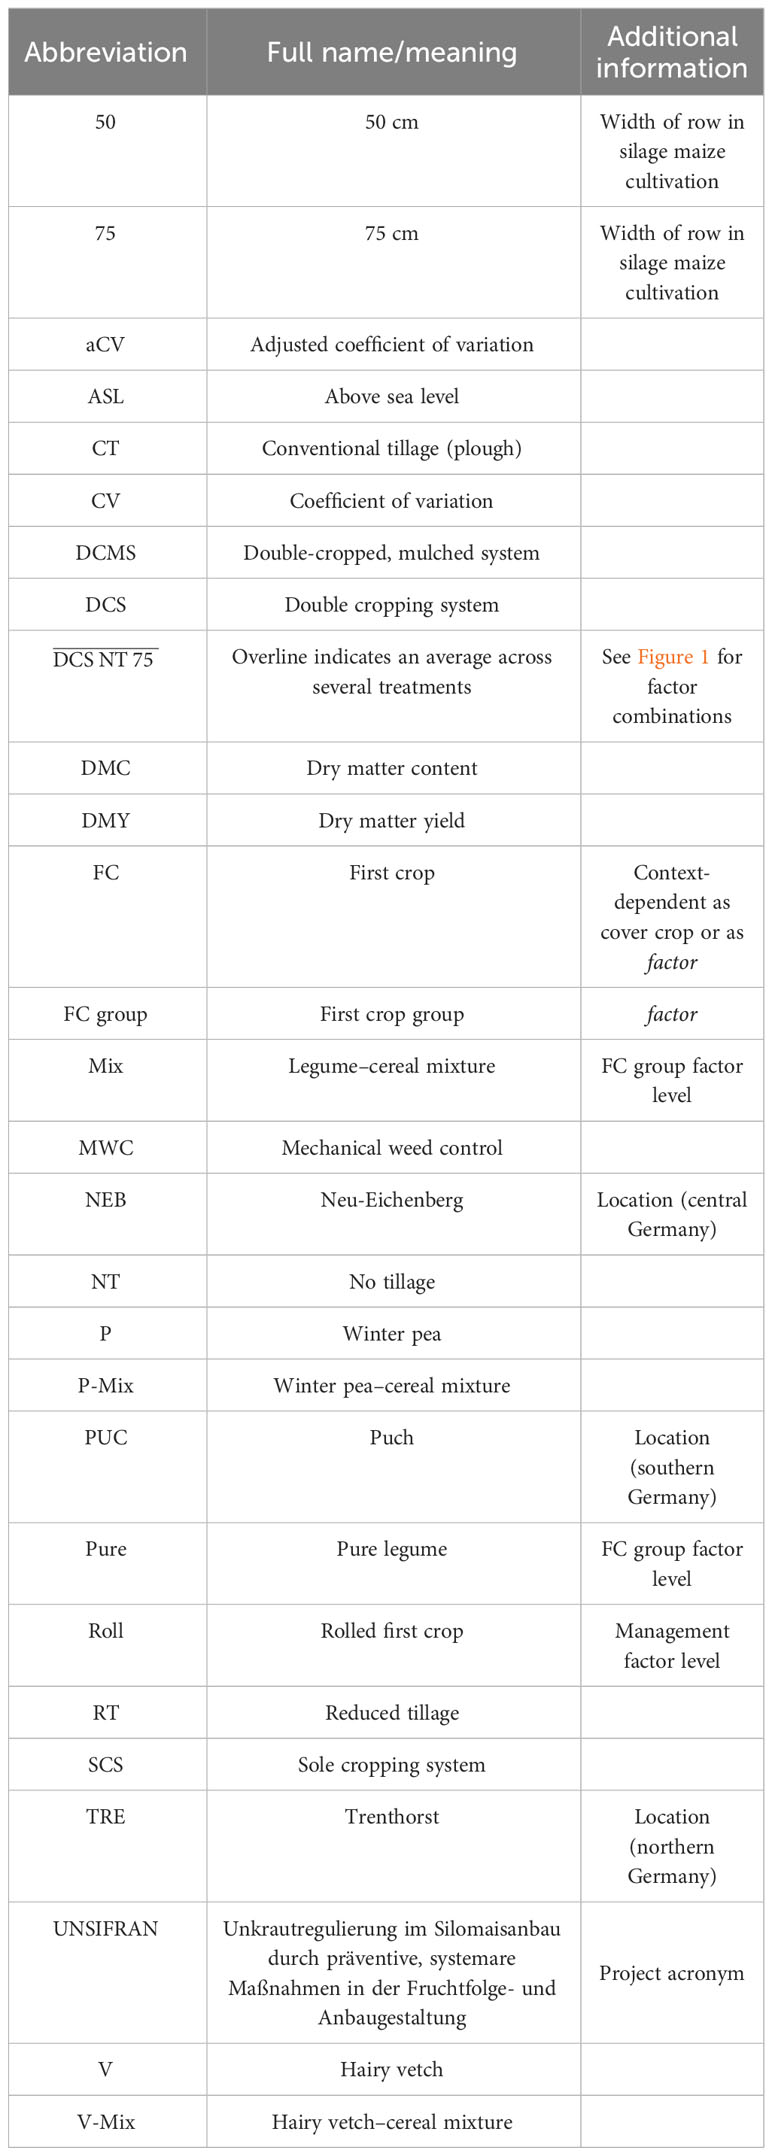
Table 1 Abbreviation list.
Every plot was prepared with conventional tillage (CT) in autumn (September–November). First crops (FCs) were sown within a day and were harvested or rolled in early-to-full bloom (late May–early June of the next year). Maize was sown within a day with non-inversion tillage (DCS RT) or no tillage (DCS NT, DCMS) practices. In the control plots (SCS) without any FCs, maize was sown earlier (beginning of May) after a shallow soil preparation just like in DCS RT. In 2020–2021, there was approximately a month’s delay of maize sowing in SCS at TRE and PUC due to weather circumstances. The FC varieties were identical over locations, but the maize varieties were adjusted for each location and sowing date to get the best results possible (Table 2). DCS and SCS were slurry-fertilized in the first 4 weeks of sowing (40–80 kg N ha-1, location-specific) and hoed, on average two times per season (Table A2). In the DCS 50-cm treatments at NEB, no MWC could be conducted in 2020–2021. Maize harvest took place in September–October at BBCH 83–87. In the first experimental year at TRE, a shallow soil preparation before maize sowing was performed in every DCS plot, and therefore DCS NT was eliminated from the experiment while the representation of DCS RT was doubled (Schmidt et al., 2022). An updated version of the study details of Schmidt et al. (2022) is presented in Table A2, whereas more information on the experimental conduct and design can be found in Schmidt et al. (2022).
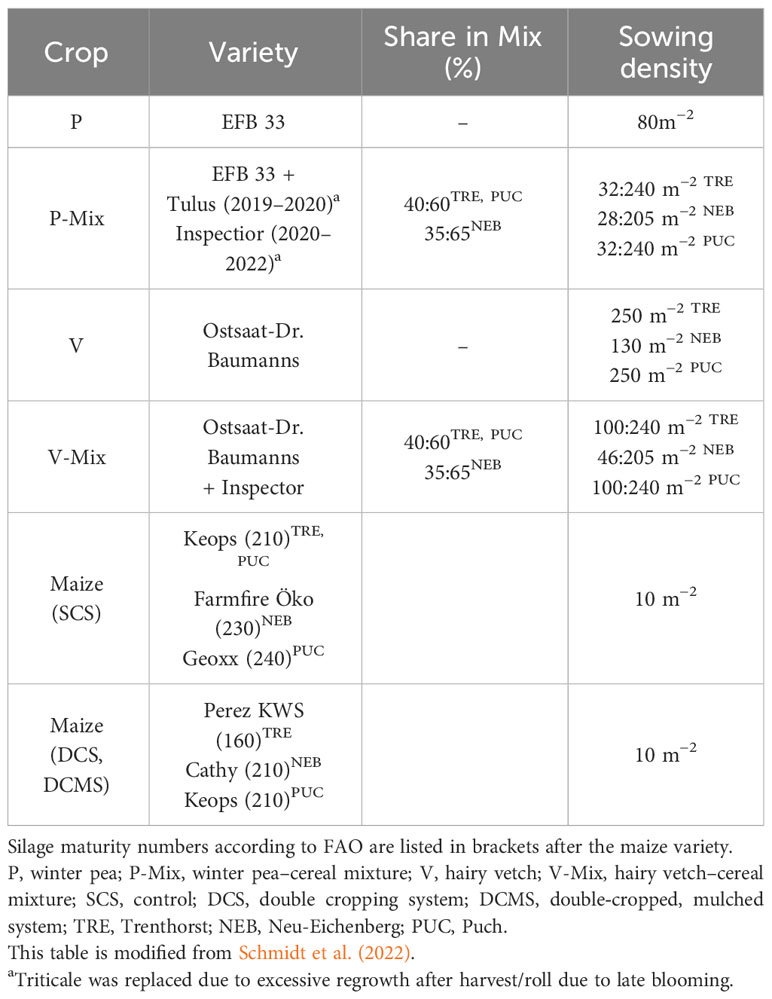
Table 2 Crop varieties and sowing densities across locations.
Shukla’s stability model (Shukla, 1972) was fitted to calculate over-environment treatment means and variances. A graphical inspection of the subsequent variance–mean relationship (Döring and Reckling, 2018; Pankou et al., 2022) as well as risk assessment (Piepho, 1996; Macholdt et al., 2020; Reckling et al., 2021) was adopted to evaluate over-environment stability for first crop, maize and total harvested dry matter yield (DMY), and maize dry matter content (DMC).
The total harvested dry matter yield (t ha−1) was estimated from first crop and maize DMY. First crop biomass samples were taken near full-bloom development stage, whereas maize was in silage maturity. Both were dried at 105°CTRE,NEB or at 60°C and were corrected to 105°CPUC (superscript refers to the location). Dry matter content (%) was calculated from the weight difference between the fresh and dry biomass, respectively. Further specificities can be found in Schmidt et al. (2022).
Microsoft Excel 2016 and R version 4.0.4 (R Core Team, 2021) through RStudio version 1.4.1106 (RStudio Team, 2021) were used for data organization, graphical presentation, and statistical analysis.
Due to the experiment being only repeated at three locations over three years, some restrictions were made: The factors location and year were crossed into environment to enable an analysis with a larger sample size (nine environments) (Piepho, 1996; Piepho, 1998) despite their important individual influence on yield potential. Furthermore, no correlations were assumed among treatments despite their evident presence (Figure 1). The chosen analysis does not allow a statistical comparison of the resulting stability measurements. Nevertheless, it allows a more accurate estimation, and based on this relative accuracy, important information may be deducted.
The stability model of Shukla (1972) was fitted through a pseudo-one-factorial mixed-effect model, as suggested by Piepho (1998); Piepho et al. (2003), and Schaarschmidt and Vaas (2009). The model structure is as follows:
with the indications: fixed + (1|random). The environment effect has the environmental variance, whereas the environment:treatment effect has the stability variance for each treatment (treatment-specific variance across environments), with the restriction of no assumed correlation among treatments (Piepho, 1998). The models were fitted with a normal distribution for FC DMY and maize DMC while with log-normal distribution (data transformation) for maize and total harvested DMY to respect the lower boundary of the original data (Piepho, 1996). The risk assessment was done over a wide range of threshold values (Piepho, 1996; Macholdt et al., 2020). For further model specifications, see Appendix B.
Additionally, location-wise models were fitted as described in Schmidt et al. (2022) to document any possible changes in the factor effects. These models were assuming treatment as fixed and year as a random effect, whereas the models to assess environmental productivity assumed both factors as fixed. The model specifications can be found in Appendix B.
The important packages for the statistical analysis were as follows: glmmTMB (Brooks et al., 2017), DHARMa (Hartig, 2021), and emmeans (Lenth, 2021). A list of further packages and additional information on the analyses can be found in Appendix B. In the Supplementary Materials, an updated version of the results published in Schmidt et al. (2022) is presented as supporting information.
3 Results
Each section contains (1) a short summary of the yield or DMC potential of the given environments (location- and year-wise), followed by (2) a graphical comparison of treatment means on the original scale (environment-wise). Additionally, the relationship among means and variances is inspected on the log10 scale supported by a linear model to check a possible dependence between the features; and lastly, (3) treatments are compared for their probability to yield/reach a DMC below a certain threshold (environment-wise). The reporting coordinates of the risk assessment [critical level, probability] may involve averages over several treatments. This is indicated with an overline—e.g., indicates an average of DCS NT 75 over P-Mix and V-Mix (see Figure 1). The variance components (environmental and stability variance) of Shukla’s stability models and their accuracies are listed in Table A3.
3.1 First crop yield and yield stability
The overall mean first crop dry matter yield (FC DMY, t ha−1) differences across locations compared to TRE were positive (NEB: +28.8%, PUC: +32.3%), just like the overall mean yield differences across years compared to 2019–2020 (2020–2021: +32.4%, 2021–2022: +20.0%). No changes in the location-wise factor pattern compared to Schmidt et al. (2022) were detectable (data not shown).
The first crop yield across environments was lower for pure legumes (P, V) as for their mixtures, whereas the differences between species were low (P: 5.6 t ha−1, V: 5.2 t ha−1; P-Mix: 7.8 t ha−1, V-Mix: 8.1 t ha−1) (Figure 2). The variance followed a similar pattern but with a division between pure legume species. A positive relationship between variance and mean on the log10 scale was present (Figure A2).
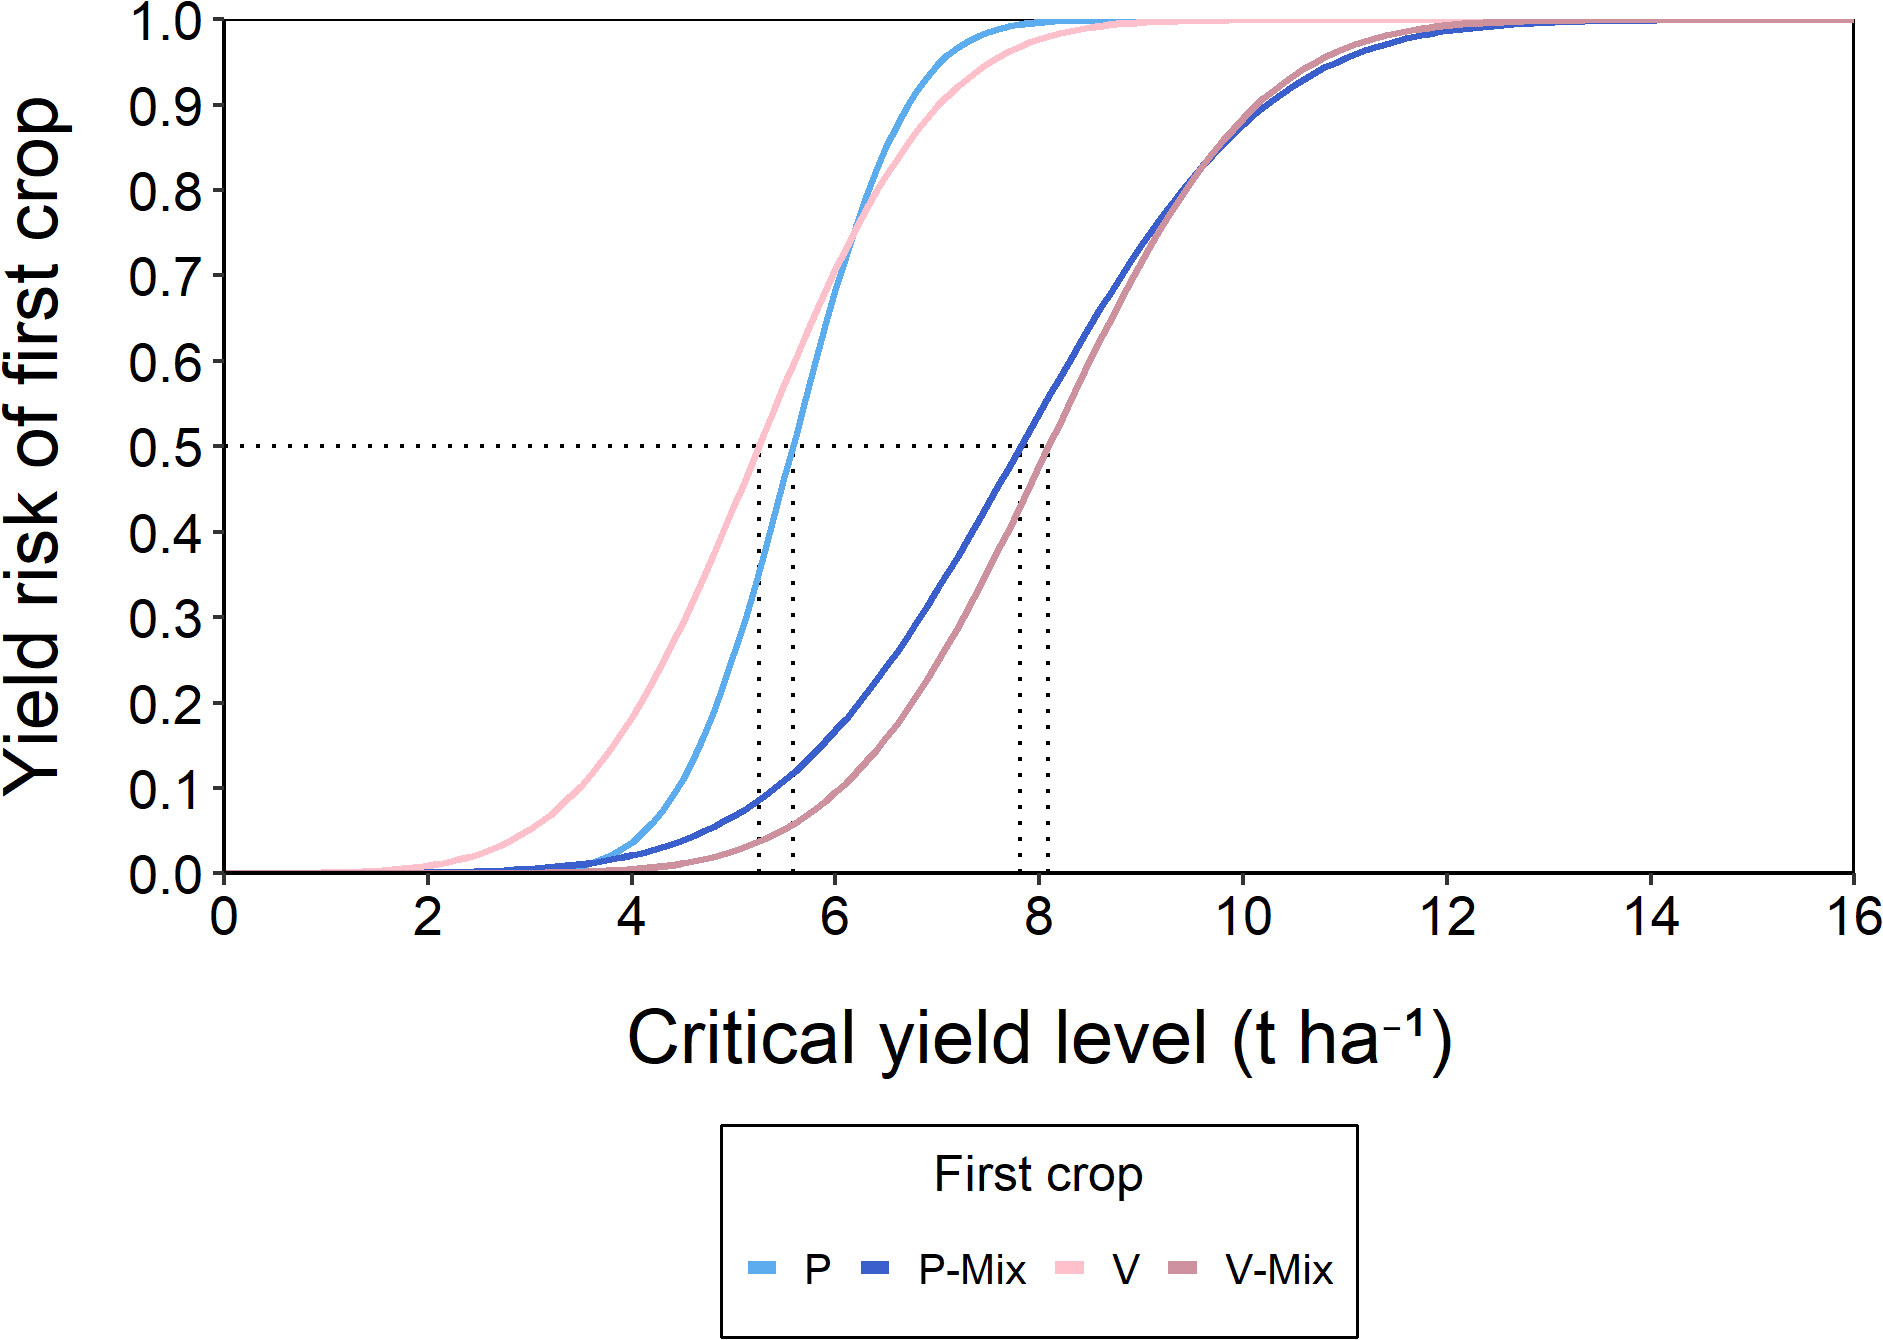
Figure 2 Yield risk (probability to fall below the critical yield level) of first crop across nine environments (three years and three locations) approximated through a cumulative normal distribution. The colour indicates first crop (P, winter pea; P-Mix, winter pea–cereal mixture; V, hairy vetch; V-Mix, hairy vetch-cereal mixture). Please note that in 2020–2021 and 2021–2022 at Puch, Bayern, only a pooled sample for P and V was taken.
The yield risk of the first crops was partitioned by FC group, so the differences were rather more steered by mean yield potential (Figure 2) than by variance. The first crop DMY variance was higher for mixtures than for pure legumes (milder slope), but due to their higher mean yield potential, all mixtures had a high probability to reach at least 4 t ha−1. Due to the low variance (steep slope), P also had a similar probability to reach at least 4 t ha−1 despite its lower mean yield potential.
The cross-over effects for species in the respective FC groups were at a rather high critical level compared to their mean yield potential (cross-over for Pure at [6.1 t ha−1, 72.2%], for Mix at [9.6 t ha−1, 82.2%]).
3.2 Maize yield and dry matter content as well as their stabilities
The overall mean maize DMY (t ha−1) differences across locations compared to TRE were positive (NEB: +65.7%, PUC: +49.7%), whereas the overall yield differences across years compared to 2019–2020 were negative (2020–2021: −8.9%, 2021–2022: −32.7%). Compared to the previously reported results (Schmidt et al., 2022), all DCS, DCMS at NEB decreased in similarity to SCS, whereas the overall pattern across alternative systems remained similar (Figures S1, S2). At PUC, only DCS NT and DCMS Mix increased their separation from SCS. The differences guided by management and FC group became generally sharper, whereas at NEB the previously observed management:FC interaction disappeared.
The maize yield of treatments across environments was divided into three distinct groups: (1) SCS, (2) DCS RT and DCMS Pure, and (3) DCS NT and DCMS Mix with on average, nearly 5 t ha−1 yield-steps among them (Figure 3). The main factor effect of system, management, their interaction, and FC group influenced the mean yield to a high extent, whereas FC and especially row width had marginal effects. Only slight interactions with row width were present. The variance was segregated through similar factors into three groups: (1) SCS, DCS RT and DCMS Pure, (2) DCMS Mix, and (3) DCS NT. Remarkably, there was a negative relationship between variance and mean on the log10 scale (Figure 4A).
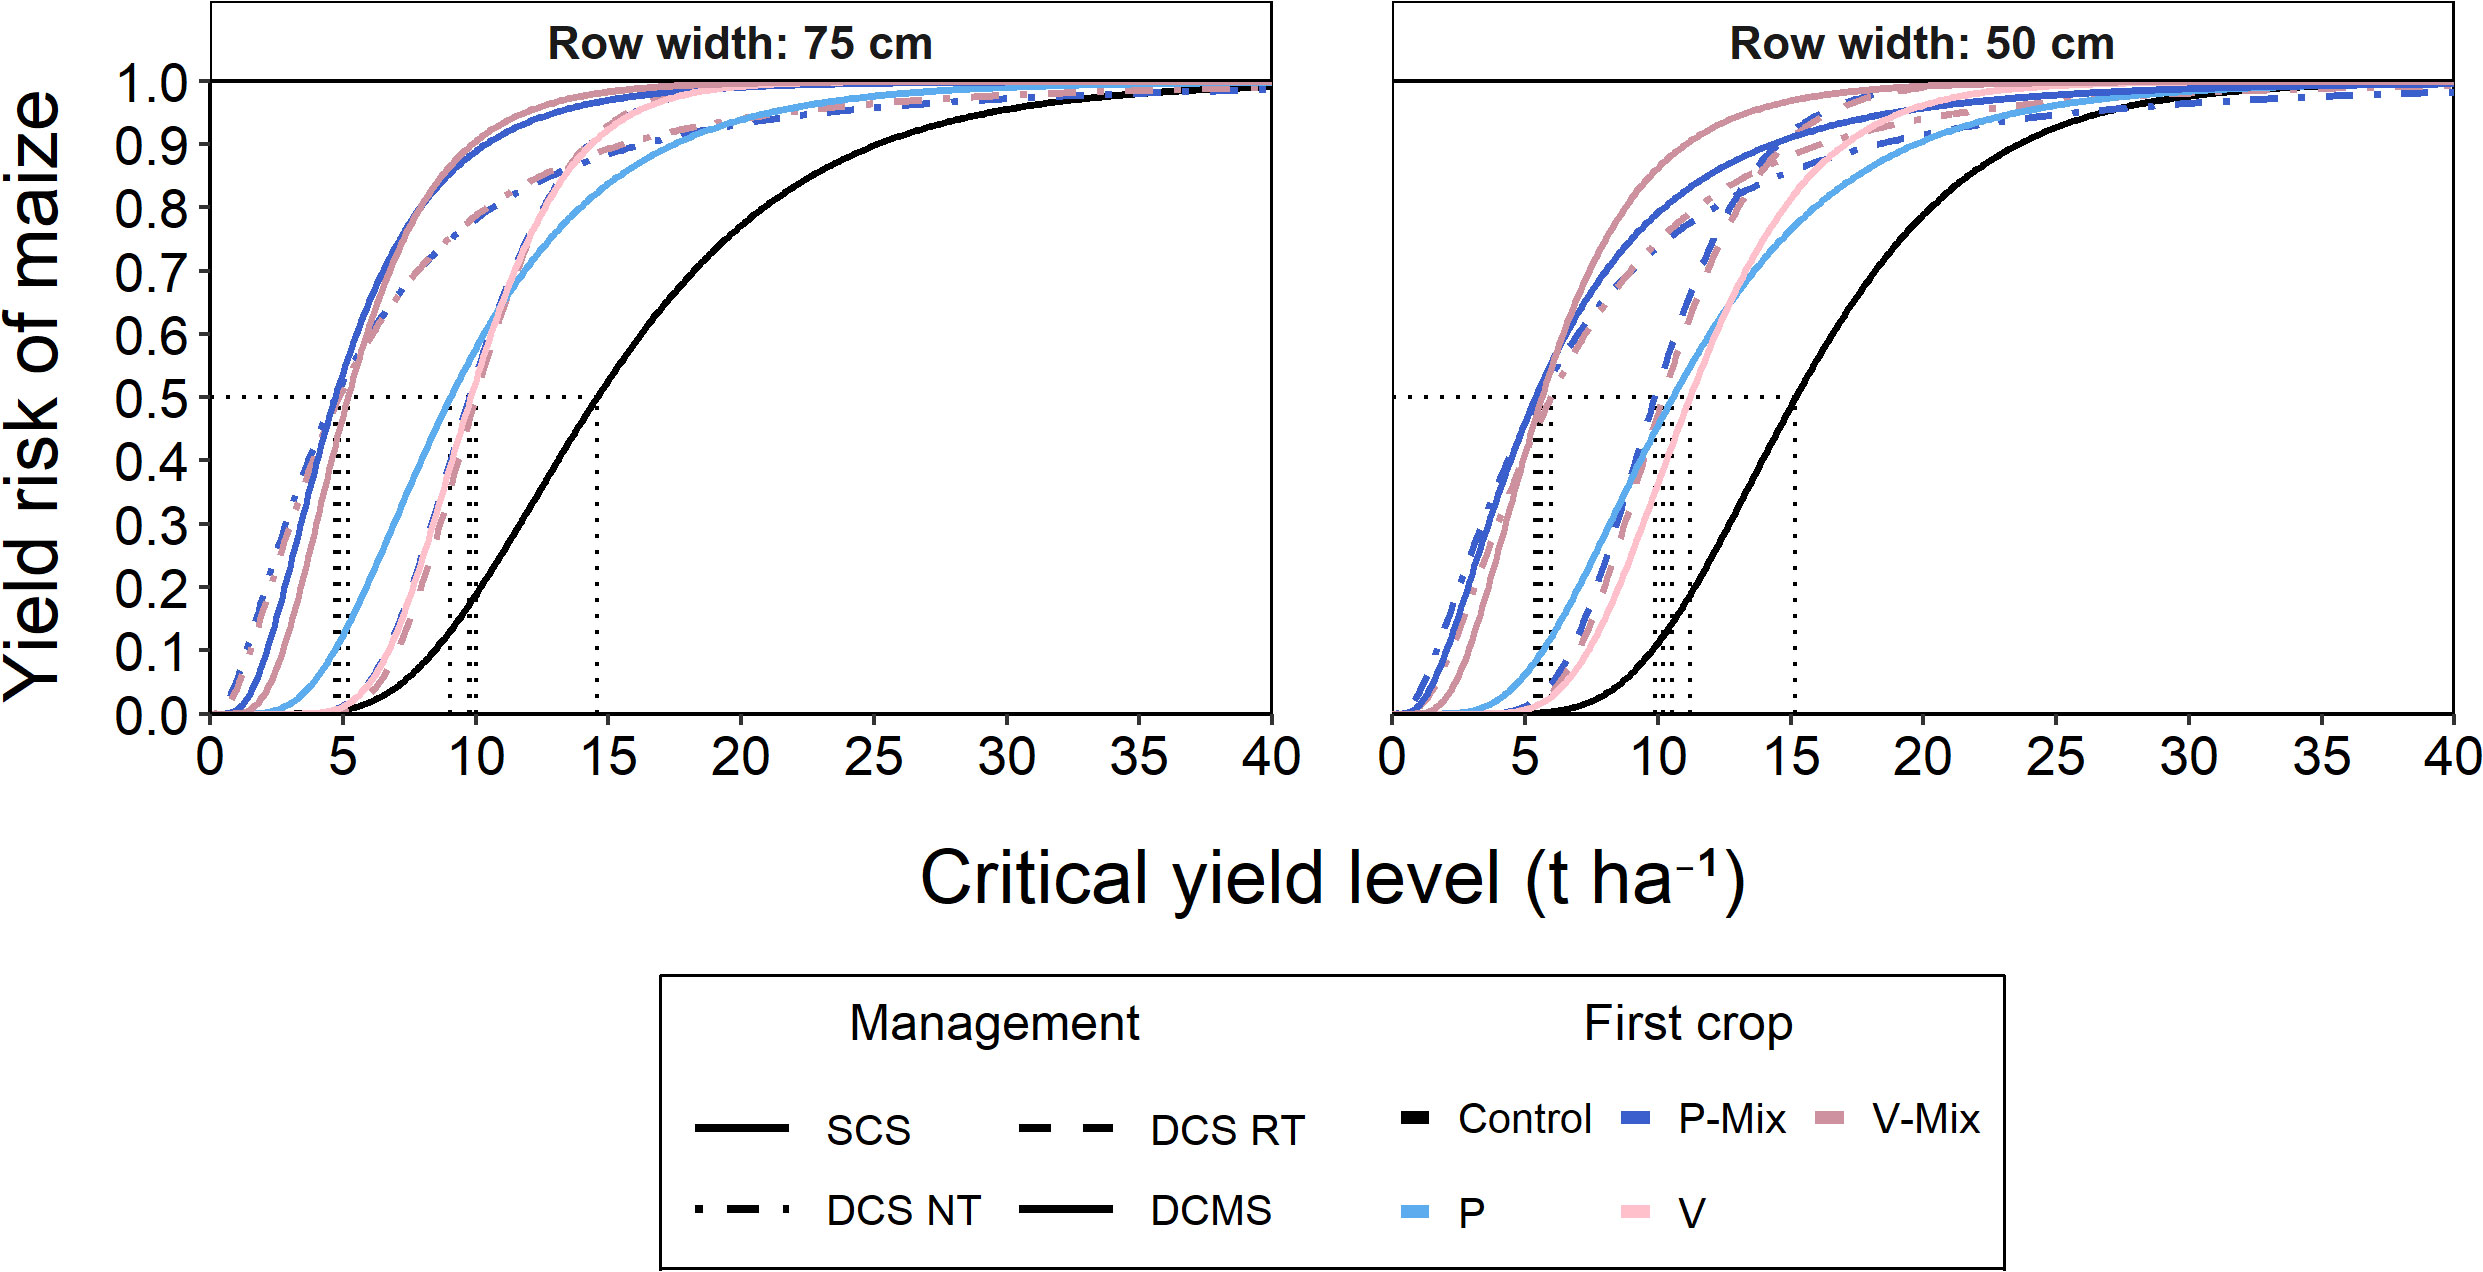
Figure 3 Yield risk (probability to fall below the critical yield level) of maize across nine environments (three years and three locations) approximated through a cumulative log-normal distribution. The results are grouped over row width. Line pattern indicates management (SCS, control; DCS RT, double cropping system with reduced tillage; DCS NT, DCS with no tillage; DCMS, double-cropped, mulched system), whereas colour indicates first crop (P, winter pea; P-Mix, winter pea–cereal mixture; V, hairy vetch; V-Mix, hairy vetch–cereal mixture).
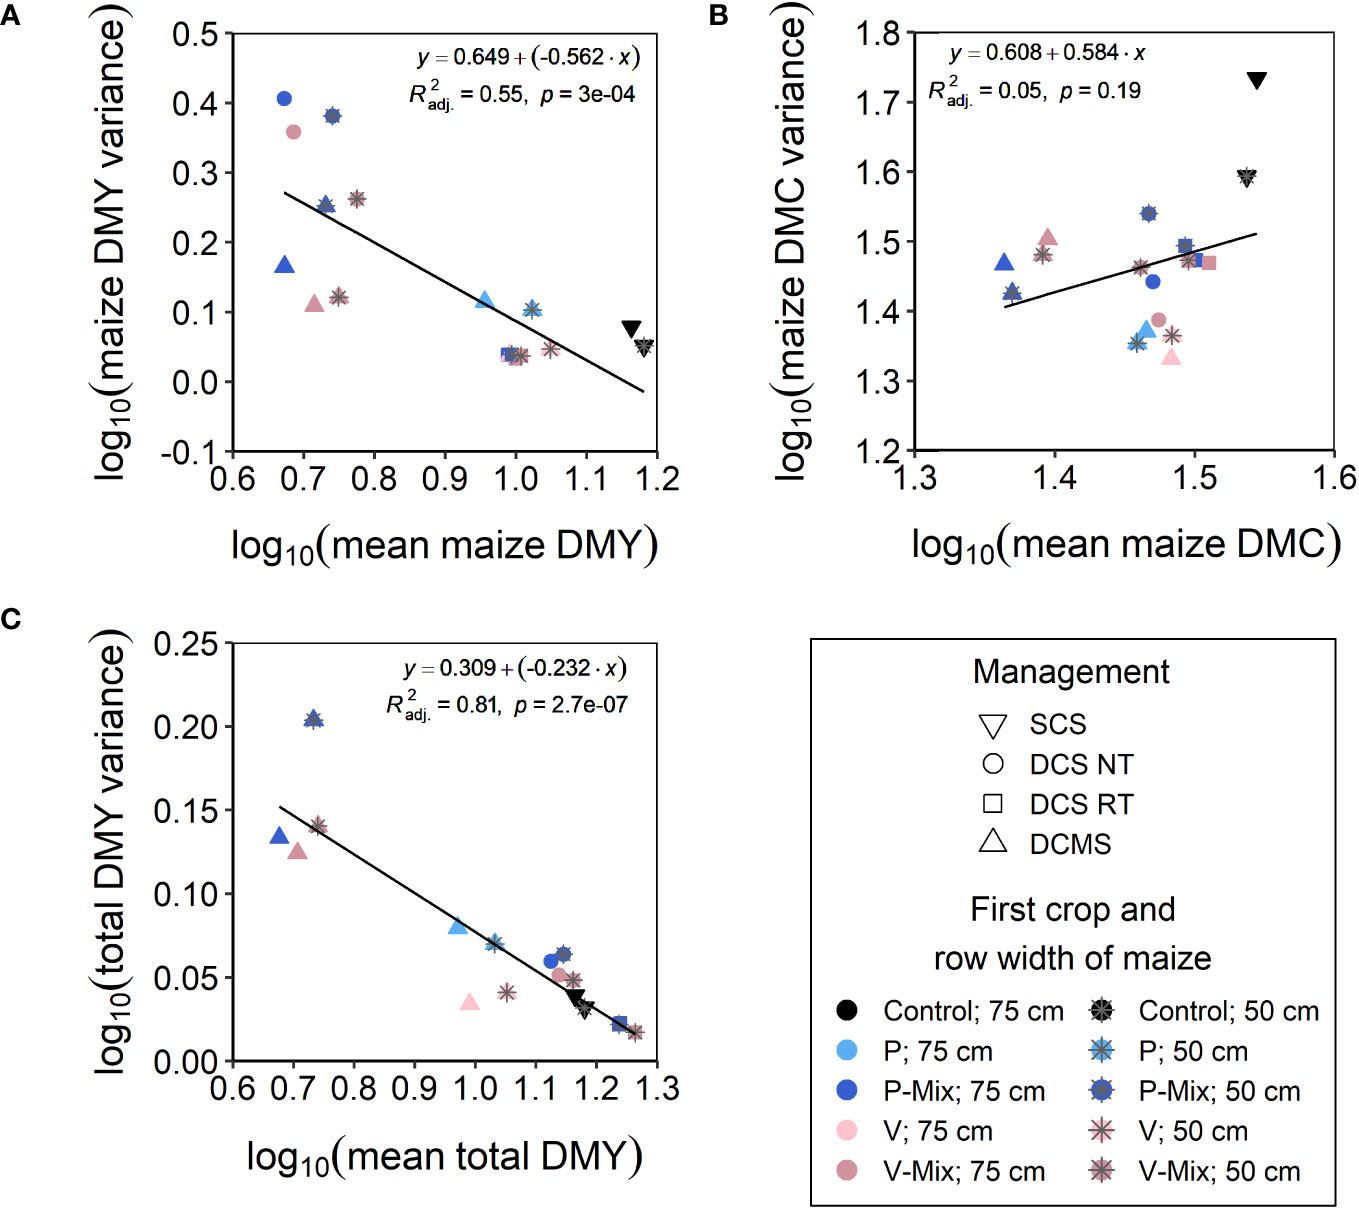
Figure 4 Linear regression of the logarithm of mean with the logarithm of variance for (A) maize dry matter yield (DMY, t ha−1), (B) maize dry matter content (DMC, %), and (C) total harvested DMY (t ha−1) across nine environments (three years and three locations). Line pattern indicates management (SCS, control; DCS RT, double cropping system with reduced tillage; DCS NT, DCS with no tillage; DCMS, double-cropped, mulched system), whereas colour indicates first crop (P, winter pea; P-Mix, winter pea–cereal mixture; V, hairy vetch; V-mix, hairy vetch–cereal mixture) and row width.
The differences in maize yield risk were mainly driven by mean yield. However, among the alternative systems, small differences in variances also showed some importance (cross-overs) (Figure 3). Only SCS, DCS RT and DCMS V had a high probability to reach at least 5 t ha−1 maize yield. There was some separation between DCMS P and V in both mean and variance, resulting in a different outcome for minimum yield potential, especially with a 75-cm row width. Both DCS NT and DCMS Mix had a very low minimum yield potential.
Cross-overs between the 0.3 and 0.7 cumulative probability only occurred in the distinct mean yield groups: among DCMS Mix and DCS NT (cross at [4.6 t ha-1 , 48.5%] for − DCMS PMix75, at [5.8 t ha-1, 58.8%] for − DCMS V-Mix 75,and at [5.5 t ha-1, 48.3%] for () −DCMS V-Mix 50), DCMS P and DCS RT, DCMS V (cross at [11.0 tha-1, 64.9%] for DCMS P 75, at [9.2 tha-1, 38.9%] for DCMS P 50 as well as at [12.6 t ha-1, 64.2%] for DCMS V 50 – DCMS P 50), whereas the cross-overs among DCS NT and DCS RT or DCMS were all above the 0.8 cumulative probability; therefore, these are not listed here.
The overall mean maize DMC (%) differences across locations compared to TRE were positive (NEB: +8.0%) or non-existent (PUC: −0.7%), whereas the overall DMC differences across years compared to 2019–2020 were (slightly) negative (2020–2021: −18.3%, 2021–2022: −2.5%). Compared to the previously reported results (Schmidt et al., 2022), the patterns in alternative systems versus SCS, management, and FC group main effects generally did not change apart from a slight reduction of maize DMC in DCS NT at TRE, but they all increased in accuracy, resulting in some differences becoming statistically significant (Figure S3). The interactions among management, FC, and row width generally disappeared with two exceptions—management:FC at TRE (DCMS Mix) and management:row width at NEB (DCS RT).
The mean maize DMC of treatments across environments was divided into three groups: (1) SCS and the slightly different DCS RT and (2) DCS NT and DCMS Pure, whereas the third group comprised (3) DCMS Mix (Figure 5). The main factor effects of system, management, and FC group influenced the mean DMC to a high extent, whereas the effect of FC and row width was comparatively minuscule. Only slight interactions were present. On the log10 scale, the variance had a positive but rather weak relationship with the mean and was segregated through similar factors into three groups: (1) DCMS Pure, (2) DCMS Mix and DCS RT, and (3) SCS, whereas DCS NT variability was strongly influenced by row width and FC. Hence, the variance is spread across the range for DCS, DCMS (Figure 4B).
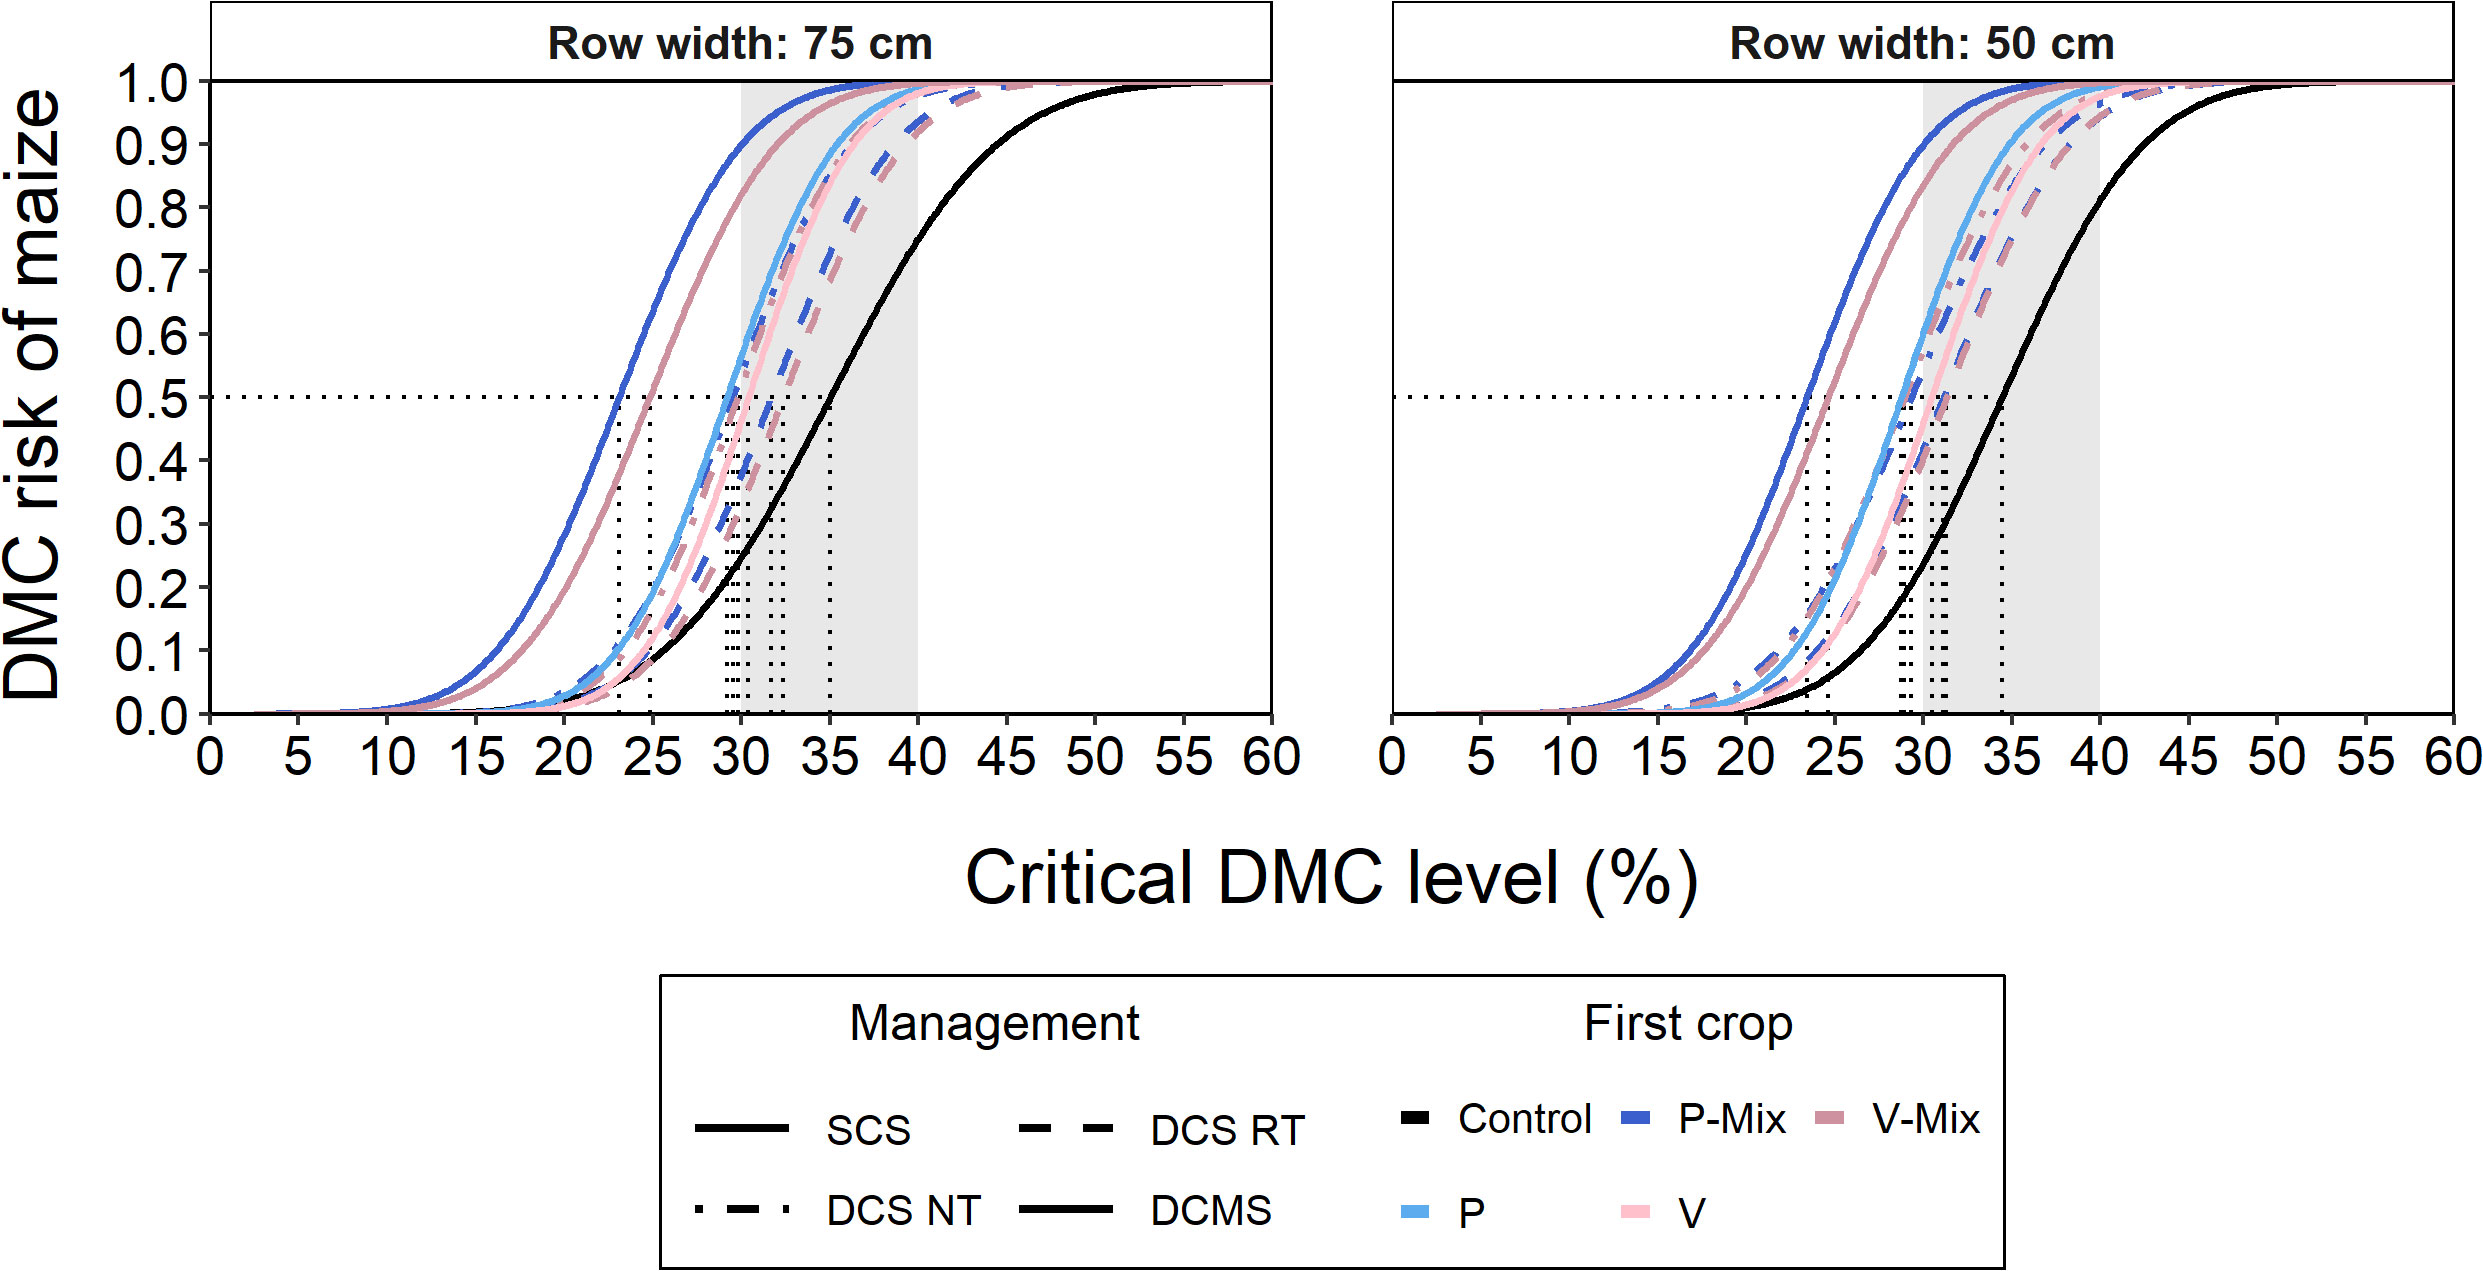
Figure 5 Dry matter content (DMC) risk (probability to fall below the critical yield level) of maize across nine environments (three years and three locations) approximated through a cumulative normal distribution. The results are grouped over row width. Line pattern indicates management (SCS, control; DCS RT, double cropping system with reduced tillage; DCS NT, DCS with no tillage; DCMS, double-cropped, mulched system), whereas colour indicates first crop (P, winter pea; P-Mix, winter pea–cereal mixture; V, hairy vetch; V-Mix, hairy vetch–cereal mixture). The grey background indicates the optimal DMC for silage production (Lusk, 1978; Wiersma et al., 1993).
The differences in maize DMC risk were mainly driven by DMC potential (DCMS Mix versus all others). Except for DCMS Mix, all treatments had nearly the same potential to reach at least 20% DMC, whereas with increasing risk to acquire a lower DMC than a certain critical level, the variance slightly separated the treatments as described in the previous paragraph (Figure 4B). No important cross-over effects occurred.
3.3 Total harvested yield and yield stability
The overall mean of total harvested DMY (t ha−1) differences across locations compared to TRE was positive (NEB: +49.2%, PUC: +50.0%), whereas the overall yield differences across years compared to 2019–2020 were negative (2020–21: −10.1%, 2021–22: −17.0%) among DCS. Generally, there were no differences in factor patterns compared to the previously reported results (Schmidt et al., 2022). However, the model accuracy decreased, which resulted in some effects becoming statistically not significant (Figures S4, S5). Additionally, the previously observed only interaction of management:row width at TRE (DCS NT) disappeared.
The total harvested DMY of treatments across environments were divided into four distinct groups: (1) DCMS Mix, (2) DCMS Pure, (3) DCS NT and SCS, and (4) DCS RT (Figure 6). The main factor effect of management and FC group influenced the mean yield to a high extent, whereas the effect of row width was marginal. Some minor interactions among management, FC, and row width were present. The variance decreased with increasing mean total harvested DMY and was divided into two distinct groups: (1) DCMS Mix and (2) SCS, DCS RT, DCS NT, and DCMS Pure, with a strong effect of FC and row width in DCS NT and DCMS Mix (Figure 4C).
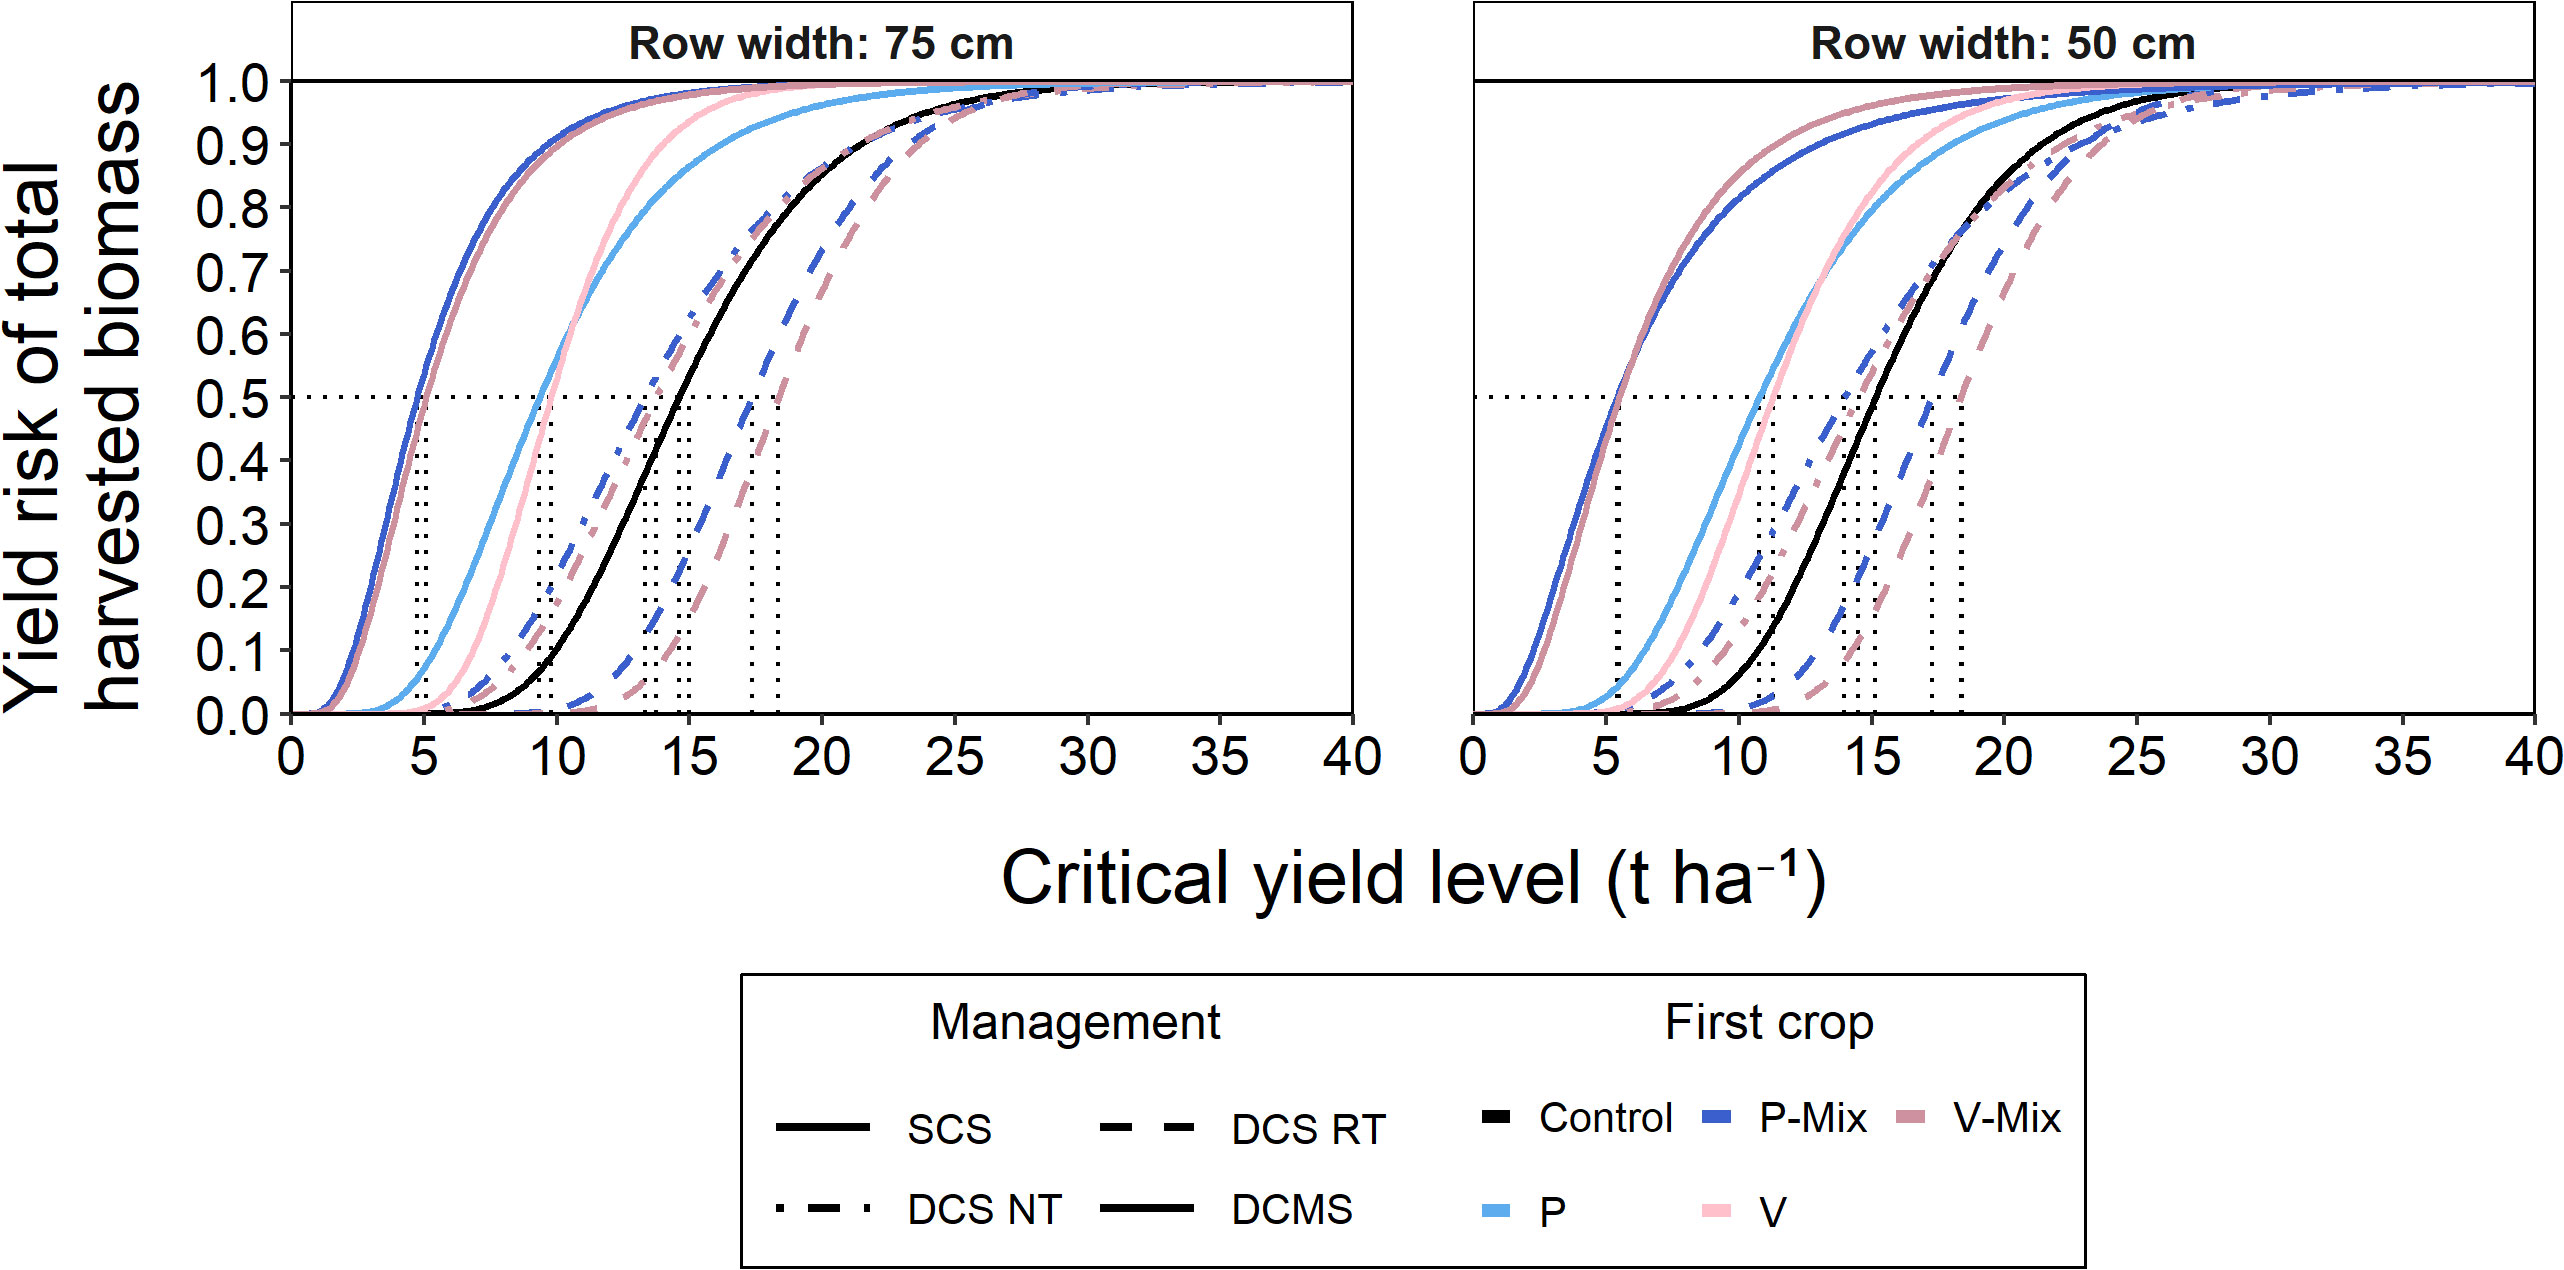
Figure 6 Yield risk (probability to fall below the critical yield level) of total harvested biomass across nine environments (three years and three locations) approximated through a cumulative log-normal distribution. The results are grouped over row width. Line pattern indicates management (SCS, control; DCS RT, double cropping system with reduced tillage; DCS NT, DCS with no tillage; DCMS, double-cropped, mulched system), whereas colour indicates first crop (P, winter pea; P-Mix, winter pea–cereal mixture; V, hairy vetch; V-Mix, hairy vetch–cereal mixture).
The differences in total harvested DMY risk were mainly governed by yield potential (Figure 6). Nevertheless, there were some cross-overs across DCMS with different first crops in the respective FC group, pointing to some small importance of variance (described in Section 3.2). DCS NT could reach a similar risk curve as SCS, whereas DCS RT even surpassed it (lower risk to reach the same critical level).
4 Discussion
The discussion focuses on yield stability evaluated through risk assessment, as the mean yield responses are thoroughly discussed in Schmidt et al. (2022).
Among locations, NEB and PUC were generally similar, whereas TRE had a somewhat lower yield potential. These differences were mainly guided by DCS and DCMS rather than by SCS (Figure S1). Among the years, two (2019–2020 and 2021–2022) had warm and dry conditions, whereas one (2021–2022) had cool and wet conditions, especially near the maize sowing dates (for more detailed information on the yearly weather differences, see Section 2 or Appendix A).
4.1 First crop yield and yield stability
The first crop yield variance had a positive correlation with its mean; hence, some mathematical artefacts may be present. However, due to the low number of observations (four FC), the relationship cannot be estimated with high accuracy (Döring and Reckling, 2018). Variance fluctuated across FC (group) with a pattern of P< V< V-Mix< P-Mix. The differences among individual species in FC group suggest an environment-wise variation related to weather patterns and associated with sowing dates rather than species suitability (Sierra, 1997; Krauss et al., 2010; Urbatzka et al., 2012; Gronle et al., 2015; Schmidt et al., 2022). The highest difference of variance among species in the respective FC group was found in pure legumes, and it may be attributed to the location-wise rather than year-wise differences (Schmidt et al., 2022), as both hairy vetch (Holderbaum et al., 1990; Snapp et al., 2005) variety Ostsaat-Dr. Baumanns (Bundessortenamt, 2022) and the winter pea variety EFB 33 (Urbatzka et al., 2012; Gronle et al., 2015) are known for their generally good winter hardiness. However, this may be refuted by the heterogeneous development and worse overwintering of P—in 2021–2022, up to 50% winterkill in some plots—at TRE. Nevertheless, the yield difference between P and V was comparatively moderate, suggesting that EFB 33 can compensate for the winter losses.
Furthermore, caution is advised when interpreting this observed strength of divergence between pure legume species considering the strong influence of V in 2019–2020 at PUC (Figure A3). The four corresponding raw values were very low, indicating an outlying environment:FC effect due to V being resown ca. 25 days later as a consequence of initial bad establishment (Table A2), resulting in a development lag. Biomass harvest took place in early-bloom rather than full-bloom development stage that year. As the conditions were ideal at the first sowing date and as the general pattern of P > V for FC DMY prevailed in all years, these agronomically relevant observations were included in the analysis despite their strong influence in the model.
4.2 Maize yield and dry matter content as well as their stabilities
Maize yield variance was negatively correlated with its mean, suggesting that systems with high yield potential tend to be more stable. However, the distribution supports (Figures 3, 4) that the mean has a stronger influence. Deviations among variances were driven by system, management, and FC group. DCS NT had a slightly higher variation than any other treatment, whereas the sowing date of SCS per se did not show an effect (data now shown; six environments only, 75-cm row width). As hypothesized by Schmidt et al. (2022), differences in soil conditions near maize sowing may influence the uniformity and reliability of maize emergence and establishment (Dabney et al., 2001; Videnović et al., 2011; Dierauer et al., 2014). However, these differences in tillage are generally weak (Knapp and van der Heijden, 2018) and have a possibly high dependence on weather circumstances (Videnović et al., 2011; Gaudin et al., 2015; Knapp and van der Heijden, 2018; Huynh et al., 2019). This would suggest that especially the northern location (TRE) is the least suitable for this system (Dabney et al., 2001; Olesen et al., 2011; EEA, 2017) (Supplementary Figure S2). The divergence between Roll and NT may point to a persistent problem in N provision under and from the mulch of mixed residue (Holderbaum et al., 1990; Snapp et al., 2005; Parr et al., 2011; Perrone et al., 2020; Schmidt et al., 2022). Only to a lower extent is this influenced by weather (Gaudin et al., 2015).
The maize DMC variance had a rather weak positive relationship with its mean. The effect of yearly weather variation on maize DMC is already highlighted by Schmidt et al. (2022) and is assumed to be influenced by the timing and conditions at maize sowing and therefore, by maize development and the length of season (Graß et al., 2013; Schmidt et al., 2022). Despite the relatively small differences, there are some notable effects by different factors. SCS had a somewhat higher DMC variation than any other system (Figures 4B, 5). This effect is reduced by the later sowing date of SCS (data not shown; six environments only, 75-cm row width) or reduced row width, which could point to the higher probability of good maize establishment in warmer conditions or more equal spatial distribution in the early season to acquire resources. Management and FC group also affected maize DMC stability to a slight extent, further highlighting the importance of the processes influencing maize development through the soil water, temperature, and mineralization complex (Holderbaum et al., 1990; Sierra, 1997; Drinkwater et al., 1998; FAO, 1998; Dabney et al., 2001; Watson et al., 2002; Lammerts van Bueren et al., 2002; Mäder et al., 2002; Snapp et al., 2005; Dahiya et al., 2007; Peigné et al., 2007; Schwartz et al., 2010; Videnović et al., 2011; Messmer et al., 2012; Dierauer et al., 2014; Schmidt et al., 2022).
4.3 Total harvested yield and yield stability
There is an assumed higher yield security in DCS due to the prolonged growing season and its division between two crops (Graß et al., 2013) as supported by the reduction of yield variability in DCS RT and especially in DCS NT (Figure 4C). Graß et al. (2013) also found that DCS RT generally significantly increased the yield and year-wise yield stability over seven German locations compared to SCS despite the lack of a linear relationship between them. However, little is known about yield stability in DCS NT systems. The negative relationship between mean and variability and the increased yield through the FC DMY suggests an increased yield security. However, this is not based on a possible negative relationship between the two yield components.
4.4 Stability measures
Each stability measure has different advantages and disadvantages in handling the variance–mean relationship observed—e.g., the mere description of the relationship for discussion, adjustment of a potentially agronomically non-relevant, mathematic artefact related to this relationship (increasing variance with increasing mean, also called Taylor’s power law) or the inclusion of both parameters to describe the distribution of the response variable (Döring and Reckling, 2018; Reckling et al., 2021; Pankou et al., 2022). In an agronomic sense, both the mean and its variance are of importance (Döring and Reckling, 2018), and treatment performance can be assessed through the probability of the response variable to fall below/above a certain threshold. With a combination of several thresholds (critical levels), the cumulative (log-)normal distribution of the response variable potentially delivers the whole estimated response spectrum, hence more information to compare treatments through their distributions, guided by both mean and variance (Macholdt et al., 2020; Reckling et al., 2021). Risk assessment can be conducted with any variance–mean relationship scenarios, which results in a universally employable measure. The description of this relationship is still necessary and useful (Reckling et al., 2021; Pankou et al., 2022).
During the analysis of the current dataset, alongside the graphical inspection of the variance–mean relationship and risk assessment, an adjusted coefficient of variation (aCV) as proposed by Döring and Reckling (2018) was calculated for comparison. This measure accounts for the variance–mean relationship found in a myriad of contexts and areas of sciences (Döring and Reckling, 2018; Reckling et al., 2021; Pankou et al., 2022). In two cases (maize and total harvested DMY), the variance–mean relationship was significantly negative, resulting in no need to adjust the variance or the raw CV values (Döring and Reckling, 2018; Pankou et al., 2022). If one, nevertheless, wants to calculate the CV and adjust it for a CV–mean relationship, the regression fit observed especially for total DMY provokes some concerns regarding aCV. The adjustment has an immense dependence on the regression fit (Döring and Reckling, 2018), which may therefore create an unwanted, fit-dependent artefact. An extreme example occurs when all observations fit perfectly on the regression line, in which case all aCV values would be exactly the same, suggesting that the stability (variance–mean tradeoff) is equal in each treatment. However, when the variance–mean relationship is negative, it is clear that the treatment with the largest mean is also preferable in terms of stability. This is a highly unlikely case, but a similar fit would occur for total harvested DMY (Figure 4C; Figure A4C).
5 Conclusions
The visualization of the variance–mean relationship coupled with a risk assessment was suitable to examine treatment performance, irrelevant of the aforementioned relationship’s nature.
The first crop DMY variance had most likely a positive relationship with its mean and was dependent on FC (group). Based on more detailed information, the differences were likely influenced by location to a high extent. Therefore, introduction of a new FC at a specific location should start with a test phase. The maize DMY variance had a negative relationship, whereas the maize DMC variance had a somewhat positive relationship, with their respective means. Next to an environment-wise variation, slight separations were following system, FC (group), and management factors. Observed patterns were well integrated into the assumptions made for the ones in location-wise mean responses (Schmidt et al., 2022). This includes differences created in the soil conditions near maize sowing, which influence temperature and mineralization as well as water content and consequently affect maize sowing date, development, and the length of season. The total harvested DMY variance had a negative relationship with its mean. The prolonged growing season and production risk divided between two crops in DCS reduced their variability compared to maize DMY, especially in the most variable DCS NT.
Each alternative system had a generally lower mean maize DMY and stability than SCS, whereas the mean maize DMC was lower but more stable in the alternative systems. However, in individual locations, DCMS Pure and especially DCS RT showed more comparable results to SCS, the latter even out-yielding SCS with biomass from two crops. This indicates the importance of general compatibility of the systems with the pedological and climatic conditions, especially at maize sowing. The compatibility of DCS and DCMS depends on FC group and management factors and a clear location-wise pattern (represented by three locations), suggesting that the northern regions of Germany are not (yet) suitable for these alternative systems. By further adjustment of the FC management and prolonging the maize phase of DCS and DCMS, these systems may achieve higher yields, which would hypothetically lead to enhanced maize DMY and DMC stability.
Data availability statement
The raw data supporting the conclusions of this article will be made available by the authors, without undue reservation.
Author contributions
Conceptualization: RG, HB, and PU; statistical methodology: H-PP and FS; investigation: HB, PU, and FS; data curation, software, formal analysis, and visualization: FS; writing—original draft preparation: FS; writing—review and editing: RG, MW, HB, PU, and H-PP; fieldwork supervision: HB, PU, RG, and FS; project administration: RG; funding acquisition: RG, HB, PU, and MW. All authors contributed to the article and approved the submitted version.
Funding
This research was funded by the Federal Ministry of Food and Agriculture (BMEL) based on a decision of the parliament of the Federal Republic of Germany via the Federal Office for Agriculture and Food (BLE) under the Federal Programme for Ecological Farming and Other Forms of Sustainable Agriculture (BÖLN) (grant numbers 2815OE128, 2815OE093, and 2815OE129).
Acknowledgments
Special sowing machinery adapted for sowing under a mulch cover was provided at two locations by AMAZONEN-WERKE H. DREYER SE & Co. KG. The authors thank the companies for providing technical support in conducting the field trials.
Conflict of interest
The authors declare that the research was conducted in the absence of any commercial or financial relationships that could be construed as a potential conflict of interest.
Publisher’s note
All claims expressed in this article are solely those of the authors and do not necessarily represent those of their affiliated organizations, or those of the publisher, the editors and the reviewers. Any product that may be evaluated in this article, or claim that may be made by its manufacturer, is not guaranteed or endorsed by the publisher.
Supplementary material
The Supplementary Material for this article can be found online at: https://www.frontiersin.org/articles/10.3389/fagro.2023.1235034/full#supplementary-material
References
Böhler D., Dierauer H. (2017). Direktsaat von Mais in überwinternde Begrünungen unter Biobedingungen: Messerwalze statt Glyphosat. Landwirtschaft Ohne Pflug (LOP) 5, 39–43.
Brooks M. E., Kristensen K., van Benthem K. J., Magnusson A., Berg C. W., Nielsen A., et al. (2017). glmmTMB balances speed and flexibility among packages for zero-inflated generalized linear mixed modeling. R J. 9 (2), 378–400. doi: 10.32614/RJ-2017-066
Bundessortenamt (2022) Beschreibende Sortenliste Getreide, Mais Öl- und Faserpflanzen Leguminosen Rüben Zwischenfrüchte 2022. Available at: https://www.bundessortenamt.de/bsa/media/Files/BSL/bsl_getreide_2021.pdf.
Carr P. M., Mäder P., Creamer N. G., Beeby J. S. (2012). Editorial: Overview and comparison of conservation tillage practices and organic farming in Europe and North America. Renewable Agric. Food Syst. 27 (1), 2–6. doi: 10.1017/S1742170511000536
Chaudhary D. P., Kumar S., Yadav O. P. (2014). “Nutritive value of maize: improvements, applications and constraints,” in Maize: Nutrition Dynamics and Novel Uses. Eds. Chaudhary D. P., Kumar S., Langyan S. (New Delhi: Springer), 3–17. doi: 10.1007/978-81-322-1623-0
Dabney S. M., Delgado J. A., Reeves D. W. (2001). Using winter cover crops to improve soil and water quality. Commun. Soil Sci. Plant Anal. 32 (7–8), 1221–1250. doi: 10.1081/CSS-100104110
Dahiya R., Ingwersen J., Streck T. (2007). The effect of mulching and tillage on the water and temperature regimes of a loess soil: Experimental findings and modeling. Soil Tillage Res. 96 (1–2), 52–63. doi: 10.1016/j.still.2007.02.004
Dierauer H., Hegglin D., Böhler D. (2014). Direktsaat von Mais im Biolandbau, FiBL (Frick, CH: FiBL = Forschungsinstitut für biologischen Landbau).
Döring T. F., Reckling M. (2018). Detecting global trends of cereal yield stability by adjusting the coefficient of variation. Eur. J. Agron. 99, 30–36. doi: 10.1016/j.eja.2018.06.007
Drinkwater L. E., Wagoner P., Sarrantonio M. (1998). Legume-based cropping systems have reduced carbon and nitrogen losses. Nature 396 (6708), 262–265. doi: 10.1038/24376
EEA (2017). Climate Change, Impacts and Vulnerability in Europe 2016. An indicator-based Report (Luxemburg: EEA: European Environment Agency). doi: 10.2800/534806
FAO (1998). Crop evapotranspiration - Guidelines for computing crop water requirements - FAO Irrigation and drainage paper 56, Crop evapotranspiration - Guidelines for computing crop water requirements - FAO Irrigation and drainage paper 56. Ed. Allen R. G., Pereira L. S., Raes D., Smith M. (Viale delle Terme di Caracalla, 00100 Rome, Italy: FAO). Available at: https://www.fao.org/3/x0490e/x0490e00.htm#Contents.
Gaudin A. C. M., Tolhurst T. N., Ker A. P., Janovicek C., Tortora K., Martin R. C., et al. (2015). Increasing crop diversity mitigates weather variations and improves yield stability. PloS One 10 (2), e0113261. doi: 10.1371/journal.pone.0113261
Graß R., Heuser F., Stülpnagel R., Piepho H.-P., Wachendorf M. (2013). Energy crop production in double-cropping systems: Results from an experiment at seven sites. Eur. J. Agron. 51, 120–129. doi: 10.1016/j.eja.2013.08.004
Gronle A., Heß J., Böhm H. (2015). Effect of intercropping normal-leafed or semi-leafless winter peas and triticale after shallow and deep ploughing on agronomic performance, grain quality and succeeding winter wheat yield. Field Crops Res. 180, 80–89. doi: 10.1016/j.fcr.2015.05.017
Grover K. K., Karsten H. D., Roth G. W. (2009). Corn grain yields and yield stability in four long-term cropping systems. Agron. J. 101 (4), 940–946. doi: 10.2134/agronj2008.0221x
Hartig F. (2021) DHARMa: Residual Diagnostics for Hierarchical (Multi-level/mixed) Regression Models. Available at: https://cran.r-project.org/package=DHARMa.
Holderbaum J. F., Decker A. M., Messinger J. J., Mulford F. R., Vough L. R. (1990). Fall-seeded legume cover crops for no-tillage corn in the humid east. Agron. J. 82 (1), 117–124. doi: 10.2134/agronj1990.00021962008200010026x
Huynh H. T., Hufnagel J., Wurbs A., Bellingrath-Kimura S. D. (2019). Influences of soil tillage, irrigation and crop rotation on maize biomass yield in a 9-year field study in Müncheberg, Germany. Field Crops Res. 241, 107565. doi: 10.1016/j.fcr.2019.107565
IPCC (2014). Climate Change 2014: Synthesis Report. Contribution of Working Groups I, II and III to the Fifth Assessment Report of the Intergovernmental Panel on Climate Change, Contribution of Working Groups I, II and III to the Fifth Assessment Report of the Intergovernmental Panel on Climate Change. Eds. Pachaurii R. K., Meyer L. A. (Geneva, Switzerland: IPPC Core Writing Team). doi: 10.1046/j.1365-2559.2002.1340a.x
Knapp S., van der Heijden M. G. A. (2018). A global meta-analysis of yield stability in organic and conservation agriculture. Nat. Commun. 9 (3632), 9. doi: 10.1038/s41467-018-05956-1
Krauss M., Berner A., Burger D., Wiemken A., Niggli U., Mäder P. (2010). Reduced tillage in temperate organic farming: Implications for crop management and forage production. Soil Use Manage. 26 (1), 12–20. doi: 10.1111/j.1475-2743.2009.00253.x
Lammerts van Bueren E. T., Struik P., Jacobsen E. (2002). Ecological concepts in organic farming and their consequences for an organic crop ideotype. Netherlands J. Agric. Sci. 50, 1–26. doi: 10.1016/S1573-5214(02)80001-X
Lenth R. V. (2021) emmeans: Estimated Marginal Means, aka Least-Squares Means. Available at: https://cran.r-project.org/package=emmeans.
Lusk J. W. (1978). “The use of preservatives in silage production,” in Fermentation of silage — A review. Ed. McCullough M. E. (Des Moines, IA: National Feed Ingrediants Association), 201–232.
Macholdt J., Styczen M. E., Macdonald A., Piepho H.-P., Honermeier B. (2020). Long-term analysis from a cropping system perspective: Yield stability, environmental adaptability, and production risk of winter barley. Eur. J. Agron. 117, 126056. doi: 10.1016/j.eja.2020.126056
Mäder P., Berner A. (2012). Development of reduced tillage systems in organic farming in Europe. Renewable Agric. Food Syst. 27 (1), 7–11. doi: 10.1017/S1742170511000470
Mäder P., Fließbach A., Dubois D., Gunst L., Fried P., Niggli U. (2002). Soil fertility and biodiversity in organic farming. Science 296 (5573), 1694–1697. doi: 10.1126/science.1071148
MEA (2005a). “Drivers of ecosystem change: summary chapter,” in Ecosystems and human well-being: Current State and Trends (Washington, DC: Island Press), 73–76.
MEA (2005b). Ecosystems and human Well-being: Synthesis. Washington (DC: Island Press). doi: 10.1196/annals.1439.003
MEA (2005c). “Food,” in Ecosystems and Human Well-being: Current State and Trends. Eds. Balisacan A. M., Gardiner P. (Washington, DC: Island Press). doi: 10.1007/s00384-011-1330-5
Messmer M., Hildermann I., Thorup-Kristensen K. (2012). “Nutrient Management in organic farming and consequences for direct and indirect selection strategies,” in Organic Crop Breeding, 1st edn. Eds. Lammerts van Bueren E. T., Myers J. R. (Hoboken, NJ, USA: John Wiley & Sons), 15–38.
Mhlanga B., Chauhan B. S., Thierfelder C. (2016). Weed management in maize using crop competition: A review. Crop Prot. 88, 28–36. doi: 10.1016/j.cropro.2016.05.008
Olesen J. E., Trnka M., Kersebaum K. C., Skjelvåg A. O., Seguin B., Peltonen-Sainio P., et al. (2011). Impacts and adaptation of European crop production systems to climate change. Eur. J. Agron. 34 (2), 96–112. doi: 10.1016/j.eja.2010.11.003
Pankou C., Koulymboudi L., Papathanasiou F., Gekas F., Papadopoulos I., Sinapidou E., et al. (2022). Testing Taylor’s Power Law association of maize interplant variation with mean grain yield. J. Integr. Agric. 21 (12), 3569–3577. doi: 10.1016/j.jia.2022.08.103
Parr M., Grossman J. M., Reberg-Horton S. C., Brinton C., Crozier C. (2011). Nitrogen delivery from legume cover crops in no-till organic corn production. Agron. J. 103 (6), 1578–1590. doi: 10.2134/agronj2011.0007
Peigné J., Ball B. C., Roger-Estrade J., David C. (2007). Is conservation tillage suitable for organic farming? A review. Soil Use Manage. 23 (2), 129–144. doi: 10.1111/j.1475-2743.2006.00082.x
Peigné J., Lefèvre V., Vian J. F., Fleury P. H. (2015). “Conservation agriculture in organic farming: Experiences, challenges and opportunities in Europe,” in Conservation Agriculture, 1st edn. Eds. Farooq M., Siddique K. H. M. (Heidelberg, New York, Dordrecht, London: Springer Cham), 559–578.
Perrone S., Grossman J., Liebman A., Sooksa-nguan T., Gutknecht J. (2020). Nitrogen fixation and productivity of winter annual legume cover crops in Upper Midwest organic cropping systems. Nutrient Cycling Agroecosystems 117 (1), 61–76. doi: 10.1007/s10705-020-10055-z
Piepho H.-P. (1996). A simplified procedure for comparing the stability of cropping systems 52 (1), 315–320. doi: 10.2307/2533168
Piepho H.-P. (1998). Methods for comparing the yield stability of cropping systems - A review. J. Agron. Crop Sci. 180 (4), 193–213. doi: 10.1111/j.1439-037X.1998.tb00526.x
Piepho H.-P. (1999). Stability analysis using the SAS system. Agron. J. 91 (1), 154–160. doi: 10.2134/agronj1999.00021962009100010024x
Piepho H.-P., Büchse A., Emrich K. (2003). A hitchhiker’s guide to mixed models for randomized experiments. J. Agron. Crop Sci. 189, 310–322. doi: 10.1046/j.1439-037X.2003.00049.x
R Core Team (2021). ‘R: A Language and Environment for Statistical Computing (Vienna, AT: R Foundation for Statistical Computing). Available at: https://www.r-project.org/.
Reckleben Y. (2011). Cultivation of maize - which sowing row distance is needed? Landtechnik 66 (5), 370–372.
Reckling M., Ahrends H., Chen T. W., Eugster W., Hadasch S., Knapp S., et al. (2021). ‘Methods of yield stability analysis in long-term field experiments. A review’ Agron. Sustain. Dev. 41, 27. doi: 10.1007/s13593-021-00681-4
Roucou A., Violle C., Fort F., Roumet P., Ecarnot M., Vile D. (2018). Shifts in plant functional strategies over the course of wheat domestication. J. Appl. Ecol. 55 (1), 25–37. doi: 10.1111/1365-2664.13029
RStudio Team (2021). ‘RStudio: Integrated Development Environment for R’ (PBC, Boston, MA: RStudio). Available at: http://www.rstudio.com.
Schaarschmidt F., Vaas L. (2009). Analysis of trials with complex treatment structure using multiple contrast tests. HortScience 44 (1), 188–195. doi: 10.21273/hortsci.44.1.188
Schmidt F., Böhm H., Piepho H.-P., Urbatzka P., Wachendorf M., Graß R. (2022). Management Effects on the performance of double cropping systems — Results from a multi-site experiment. Agronomy 12 (9), 2104. doi: 10.3390/agronomy12092104
Schmidt F., Böhm H., Graß R., Wachendorf M., Piepho H.-P. (2023). Management effect on the weed control efficiency in double cropping systems. Agronomy 13 (2), 467. doi: 10.3390/agronomy13020467
Schwartz R. C., Baumhardt R. L., Evett S. R. (2010). Tillage effects on soil water redistribution and bare soil evaporation throughout a season. Soil Tillage Res. 110 (2), 221–229. doi: 10.1016/j.still.2010.07.015
Shukla G. K. (1972). Some statistical aspects of partitioning genotype-environmental components of variability. Heredity 29 (2), 237–245. doi: 10.1038/hdy.1972.87
Sierra J. (1997). Temperature and soil moisture dependence of N mineralization in intact soil cores. Soil Biol. Biochem. 29 (9/10), 1557–1563. doi: 10.1016/S0038-0717(96)00288-X
Snapp S. S., Swinton S. M., Labarta R., Mutch D., Black J. R., Leep R., et al. (2005). Evaluating cover crops for benefits, costs and performance within cropping system niches. Agron. J. 97 (1), 322–332. doi: 10.2134/agronj2005.0322a
Urbatzka P., Graß R., Haase T., Schüler C., Heß J. (2012). Influence of different sowing dates of winter pea genotypes on winter hardiness and productivity as either winter catch crop or seed legume. Eur. J. Agron. 40, 112–119. doi: 10.1016/j.eja.2012.03.001
Videnović Ž., Simić M., Srdić J., Dumanović Z. (2011). Long term effects of different soil tillage systems on maize ( Zea mays L .) yields. Plant Soil Environ. 57 (4), 186–192. doi: 10.17221/443/2010-PSE
Wallace J. M., Williams A., Liebert J. A., Ackroyd V. J., Vann R. A., Curran W. S., et al. (2017). Cover crop-based, organic rotational no-till corn and soybean production systems in the mid-atlantic United States. Agriculture 7 (4), 34. doi: 10.3390/agriculture7040034
Watson C. A., Atkinson D., Gosling P., Jackson L. R., Rayns F. W. (2002). Managing soil fertility in organic farming systems. Soil Use Manage. 18 (s1), 239–247. doi: 10.1111/j.1475-2743.2002.tb00265.x
Keywords: silage maize, organic agriculture, winter cover crop, roller-crimper, tillage, row width, risk assessment, adjusted coefficient of variation
Citation: Schmidt F, Böhm H, Piepho H-P, Urbatzka P, Wachendorf M and Graß R (2023) Yield stability of silage maize double cropping systems across nine German environments. Front. Agron. 5:1235034. doi: 10.3389/fagro.2023.1235034
Received: 05 June 2023; Accepted: 25 September 2023;
Published: 19 October 2023.
Edited by:
Giovanni Mauromicale, University of Catania, ItalyReviewed by:
Charles M. Geddes, Agriculture and Agri-Food Canada (AAFC), CanadaAndres Berger, National Institute for Agricultural Research (INIA), Uruguay
Copyright © 2023 Schmidt, Böhm, Piepho, Urbatzka, Wachendorf and Graß. This is an open-access article distributed under the terms of the Creative Commons Attribution License (CC BY). The use, distribution or reproduction in other forums is permitted, provided the original author(s) and the copyright owner(s) are credited and that the original publication in this journal is cited, in accordance with accepted academic practice. No use, distribution or reproduction is permitted which does not comply with these terms.
*Correspondence: Fruzsina Schmidt, ZnJ1enNpbmEuc2NobWlkdEB1bmkta2Fzc2VsLmRl