 Raimundo Henrique Ferreira Rodrigues
 Luciana Barboza Silva*
 Maria Carolina Faria Silva
 José Wellington Batista LopesEdivania Araujo LimaRonny Sobreira BarbosaLorrana Francisca Oliveira Almeida
- Programa de Pós-graduação em Ciências Agrárias - Universidade Federal do Piauí, Bom Jesus Piauí, Brazil
Studies on the spatiotemporal dynamics of crop pests enable the determination of their colonization pattern and dispersion in the landscape. Geostatistics is an efficient tool to determine the spatial distribution pattern of the pest in the crops and to visualize them in appropriate maps. Analysis of these maps across the crop developmental stages can be a helpful tool in precision agriculture programs. The aim of this study was to determine the spatiotemporal distribution of Bemisia tabaci whitefly adults and nymphs in commercial soybean crops from planting to harvest. Infestation by the whitefly adults and nymphs started between 30 and 50 days after plant emergence. The maximum population density of ten adults per plant and two nymphs per leaf occurred between 90 and 101 days after plant emergence. In Kriging maps, it was possible to observe the distribution pattern for both adults and nymphs. The colonization of soybean plants by B. tabaci may be divided into three stages: beginning infestation (at the outermost parts of the crop), whole area colonization, and dispersion colonization (when the whole crop area is infested). The density of adult insects was positively correlated with rainfall and relative humidity. Wind speed positively affected the dispersion of adult whiteflies. The distribution pattern of B. tabaci in the soybean crop was aggregated. Climatic factors, such as wind speed, increase the dispersion radius of the whitefly in the crop. Contribution to the field.
Introduction
Bemisia tabaci (Gennadius) Middle East -Asia Minor 1 - MEAM1 (Hemiptera: Aleyrodidae), commonly known as whitefly, is one of the most destructive pests for global agriculture, causing significant yield losses in commercial crops (Oliveira et al., 2013; Lima et al., 2017). This insect has high fecundity and fertility rates, it is polyphagous and occurs in areas of temperate, subtropical, and tropical climates (Byrne et al., 1997; De Barro et al., 2011; Cruz and Baldin, 2017). The whitefly has a wide host range; thus, crops such as cotton, beans, squash, melon, and tomato may serve as alternate host plants for B. tabaci infesting soybean crops.
The whitefly causes several problems in Brazilian crops, and the insect may cause direct damage by sucking phloem sap. Indirect damage is linked to the excretion of honeydew, which serves as a substrate for the growth of opportunistic fungi (Capnodium sp.) (Stansly and Naranjo, 2010; Li et al., 2011). B. tabaci may inhibit the gathering of carotenoids and chlorophyll, affecting the photosynthetic rate of plants (Masuda et al., 2016). In soybean [Glycine max (L.) Merr., Fabaceae], B. tabaci is the vector for the cowpea mild mottle virus (CpMMV) (Marubayashi et al., 2010).
In recent years, soybean has been highly attacked with high whitefly populations, mainly in the reproductive stages of the plant. Until very recently, this species was only seen as an occasional pest; however, it is now considered a key pest in soybean. Although the importance of the whitefly B. tabaci MEAM1 has increased its incidence in soybean cultivars (Vieira et al., 2011; Czepak et al., 2018; Da Silva Oliveira et al., 2018), there is no sampling method currently defined for this pest in this crop. The recommendations do not specify the sample numbers, area size to be sampled, location of the different stages, or the most suitable evaluation forms. In general, management is based on information obtained from other countries and in other crops, such as cotton (Naranjo and Flint, 1995; Ellsworth et al., 1995; Ellsworth and Martinez-Carrillo, 2001) and melon (Palumbo et al., 1994), in the state of Arizona, USA, in the cucumber and watermelon crop in Brazil (Moura et al., 2003; Lima et al., 2017; Lima et al., 2018).
The spatiotemporal dynamics of insects using geostatistics can provide important information about the pattern of colonization, aggregation, and dispersion of pests in the field (Pias et al., 2017; Galdino et al., 2017; Lima et al., 2018; Suekane et al., 2018; Martins et al., 2018; Felicio et al., 2019). This statistical tool uses a method that characterizes spatial variation by comparing similarities between distant and proximal points. This technique provides results that allow colonization maps to be produced, zoning the different densities, and determining the pattern of spatial distribution of the insects in the field (Pias et al., 2017; Lima et al., 2018). A sequence of these maps during crop development may indicate areas that demand greater attention to pest sampling and control in time and space (Sciarretta and Trematerra, 2014; Macfadyen et al., 2015; Martins et al., 2018).
In the context of precision agriculture, spatiotemporal dynamics studies of crop pests facilitate the reduction of the following: 1) production costs; 2) economic losses; and 3) environmental impacts of the unnecessary use of pest control methods. These advances come as a consequence of these studies, which indicate the places and times more favorable to the pests, and in which parts of the crops it is necessary to control these organisms. Considering the importance of studying the spatiotemporal dynamics of insect pests and to the best of our knowledge, there are few published studies on B. tabaci in soybean. Thus, the aim of this study was to determine the spatiotemporal distribution of adults and nymphs of B. tabaci in soybean crops from planting to harvest by using geostatistics and verifying abiotic factors (temperature, relative humidity, wind, and rainfall) that affect the dispersion of these insects.
Materials and methods
The experiment was carried out at Celeiro Seeds Farm, where grains and soybean seeds are produced. The experiment was conducted in two seasons, the first, from November 2017 to the end of March 2017, and the second start in from November 2018 to the end of March 2019. The farm is located in the municipality of Monte Alegre do Piauí and Serra do Quilombo, in the Brazilian state of Piaui (09°21’12” S; 45°07’42” W, 642 m) (Figure 1A).
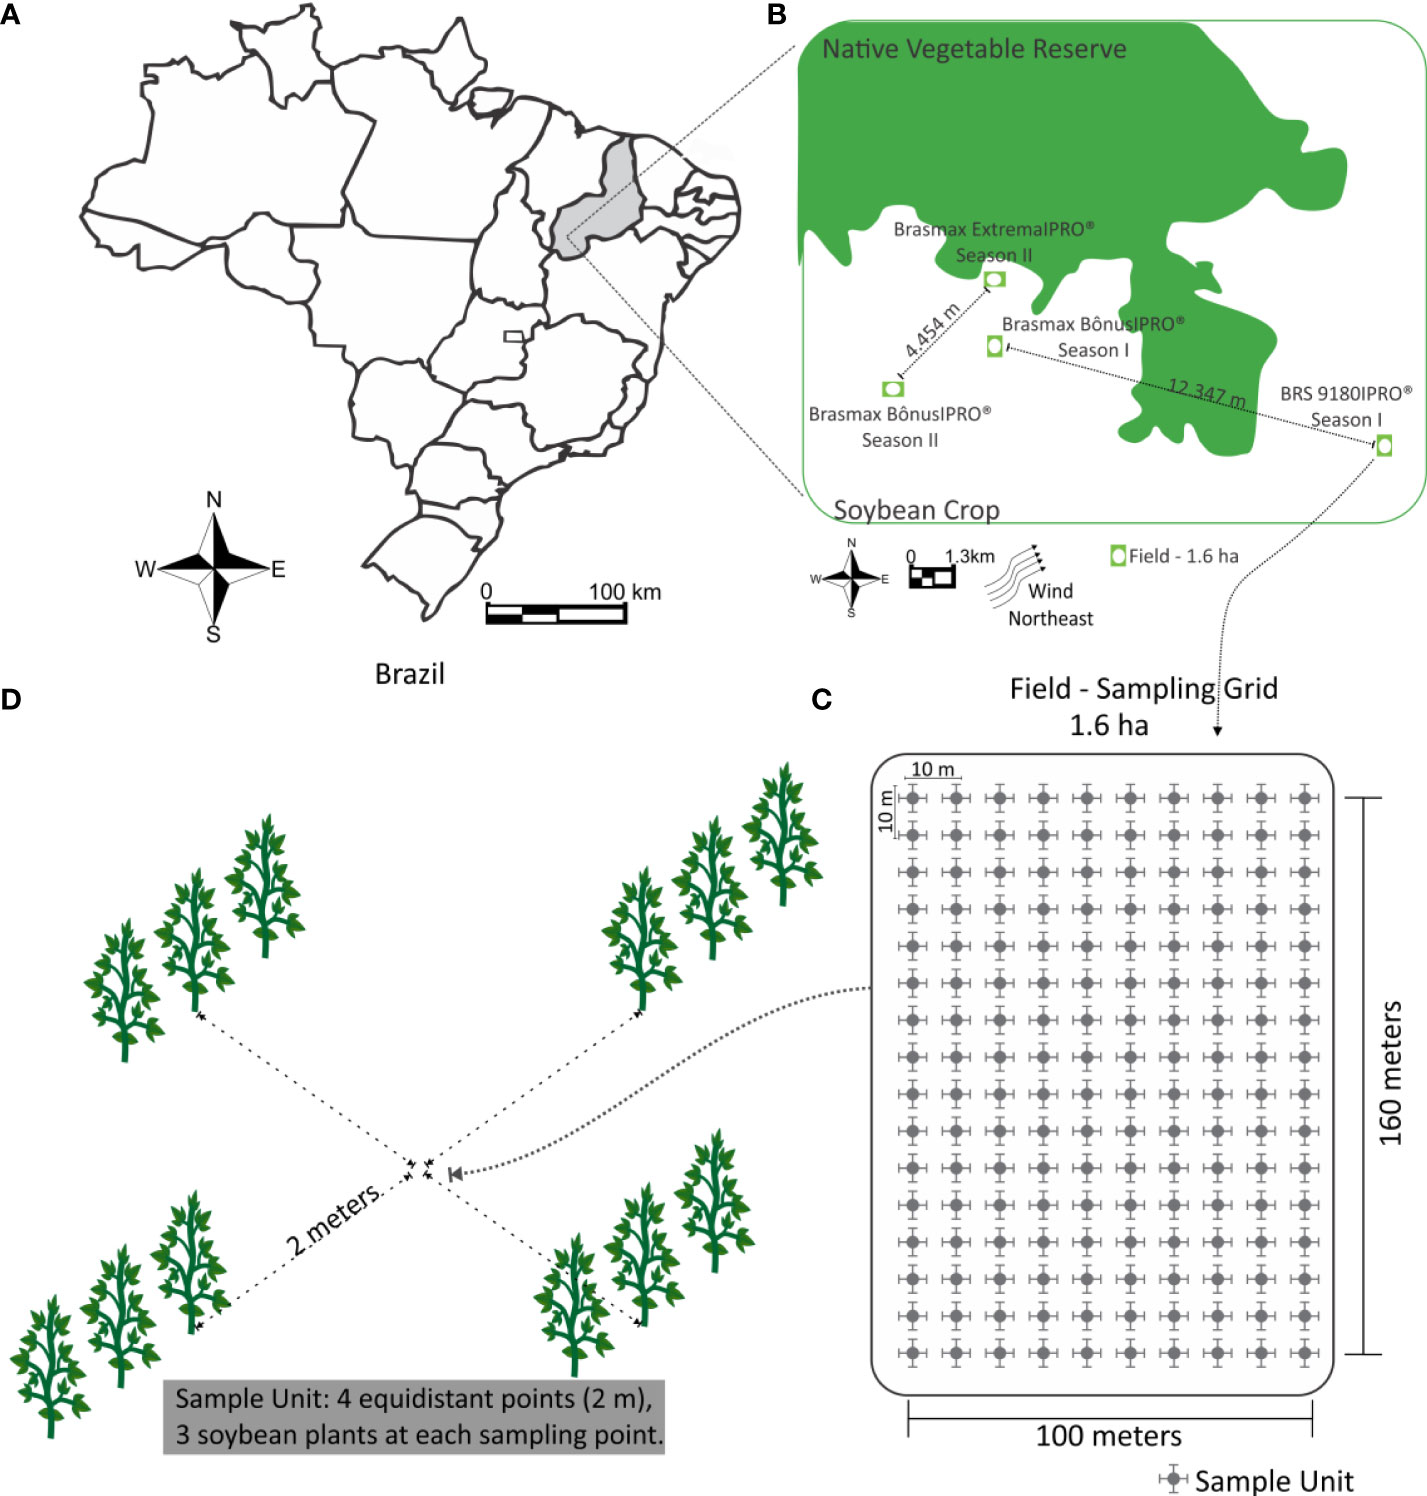
Figure 1 Location where the research was conducted (A) Brazil map showing Monte Alegre do Piauí, Piauí. (B) Location of field within the area, the distance between each field within an inside season. (C) Sample grid of the evaluated points and geographic location. (D) Sampling unit (3 plants equidistant from the central point, total of 12 plants per unit).
The region’s soil is characterized as a yellow Latosol (Oxisol), and the climate is tropical with a dry winter season, Aw, according to the Köppen-Geiger classification 29 (Kottek et al., 2006). Climatic data such as the mean air temperature (°C), relative humidity (%), wind speed (m/s) and wind direction were obtained from NIMET (National Institute of Meteorology), and rainfall data were obtained with a rainfall meter during the period of execution of the experiment in each field (Figure 2).
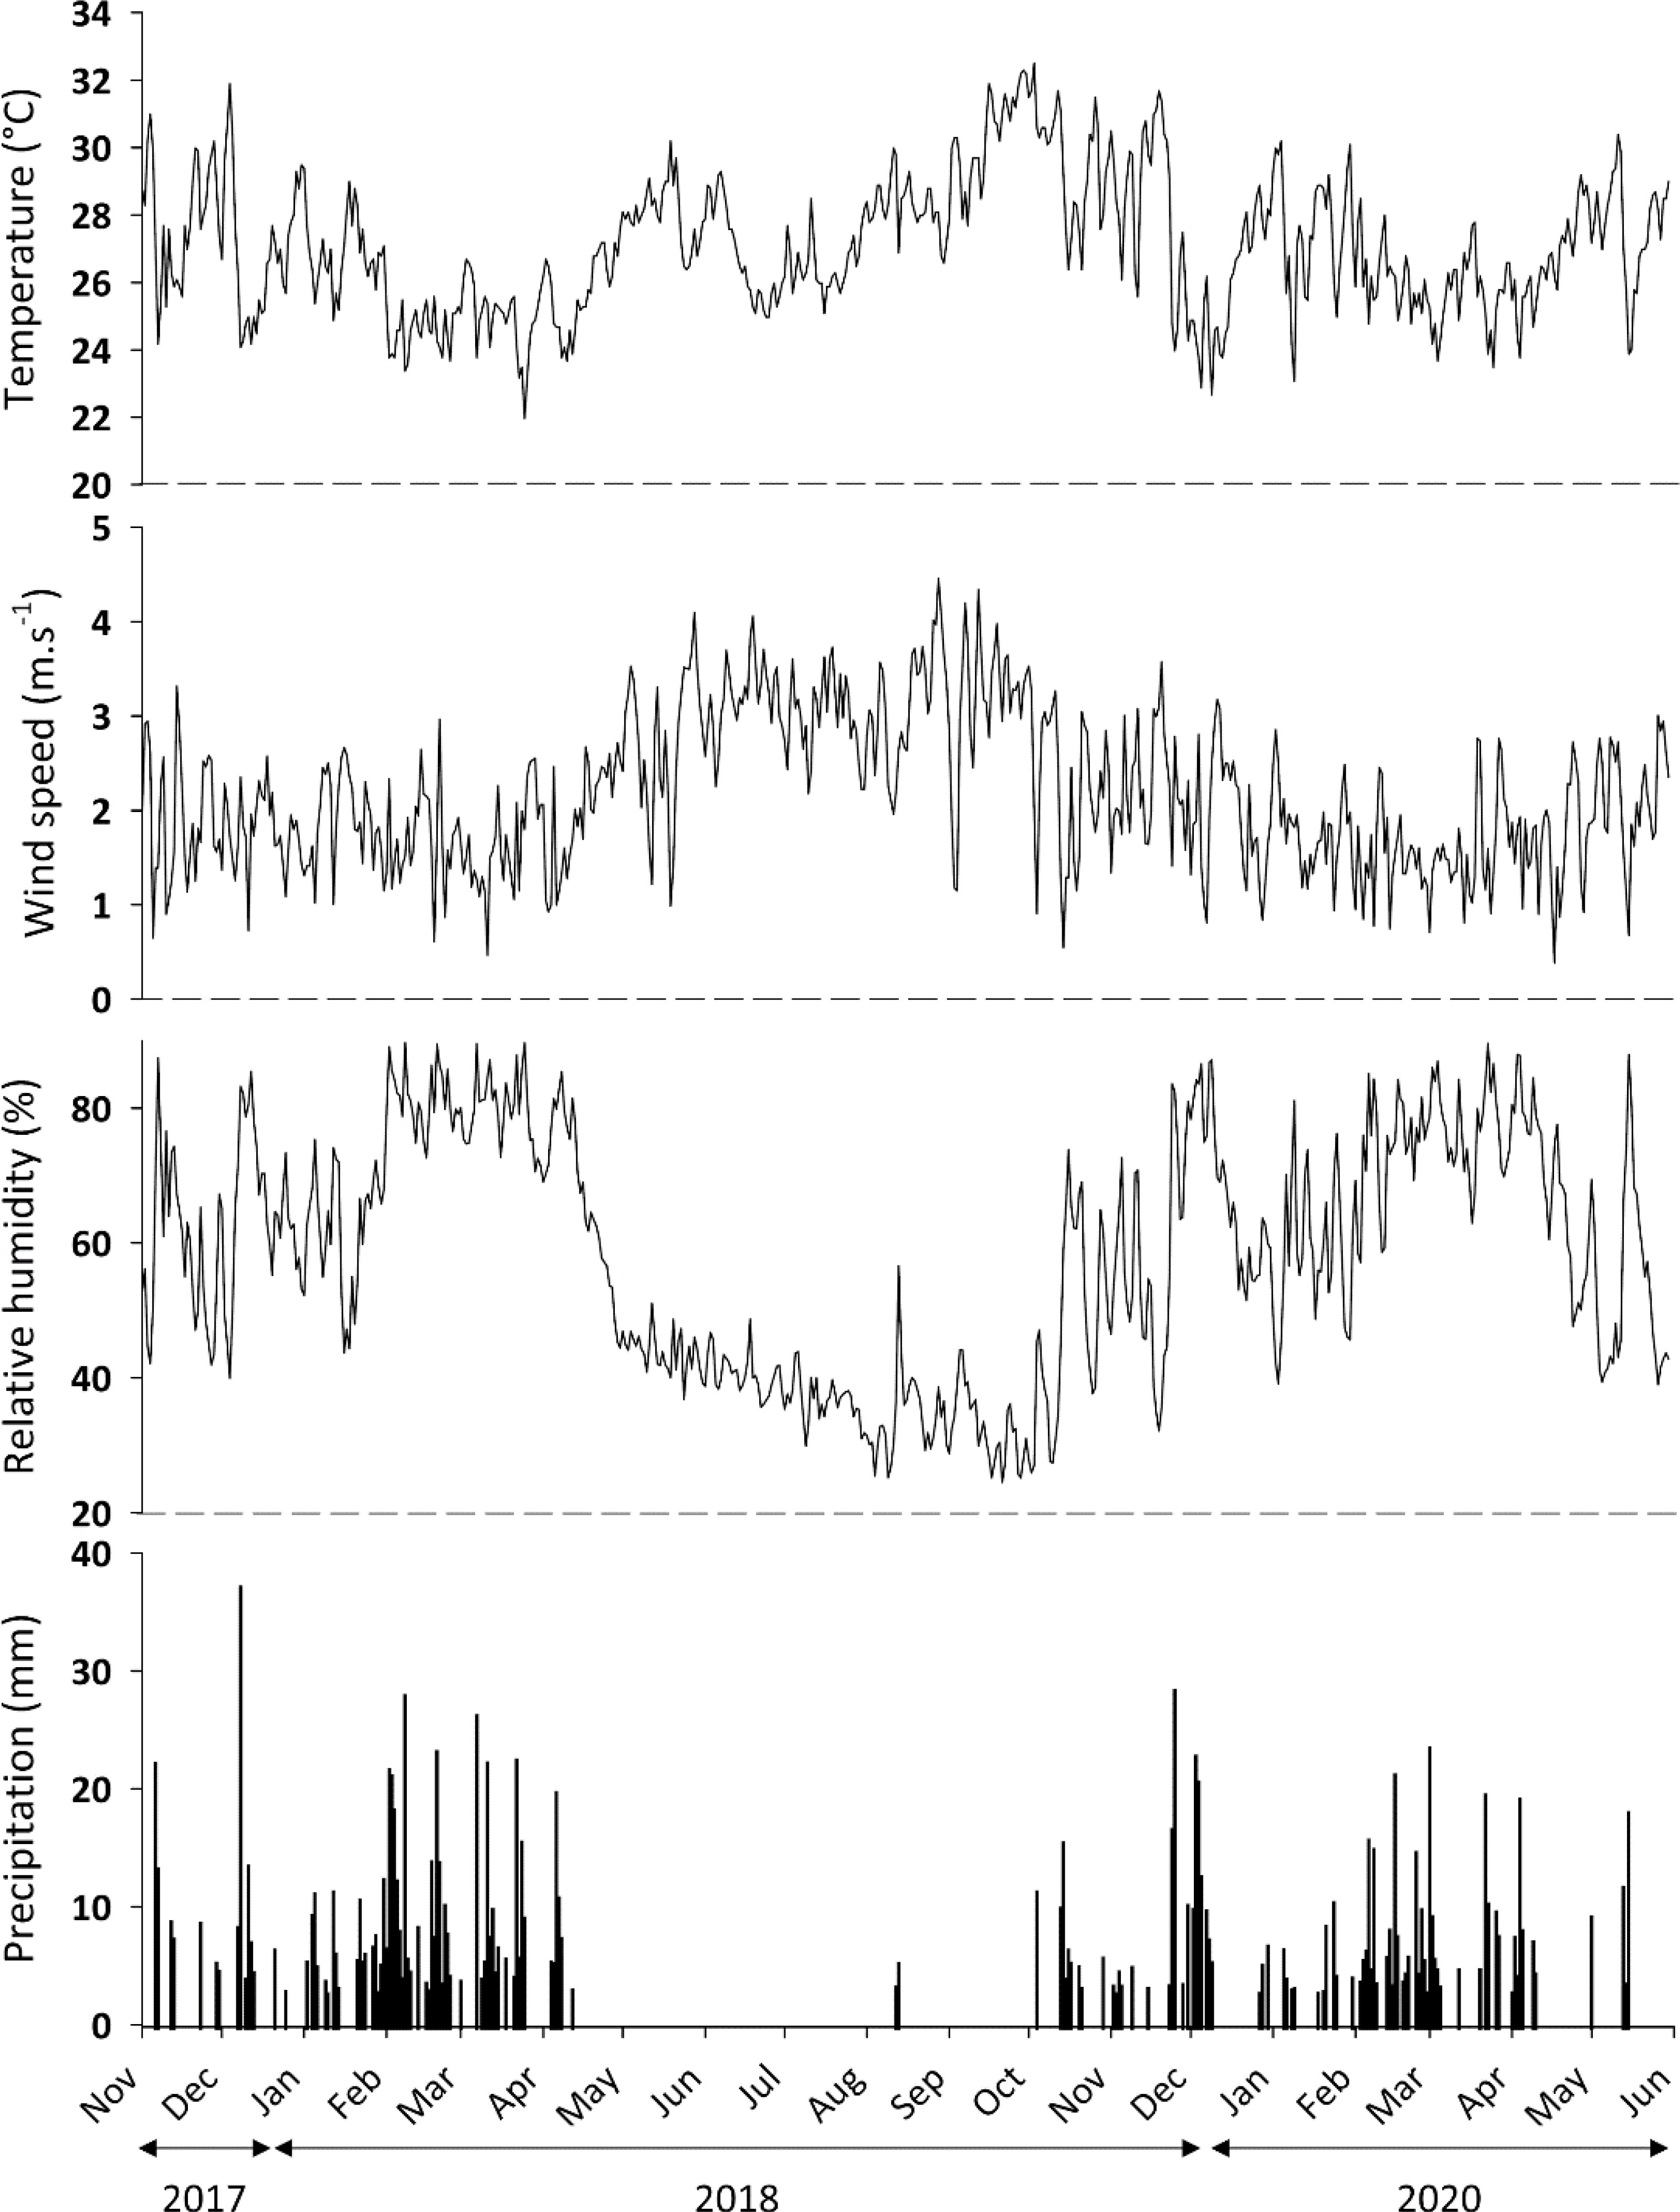
Figure 2 Daily variation in the mean air temperature, mean wind speed, mean relative air humidity, and total rainfall at Celeiro Seed Farm, Serra do Quilombo, Monte Alegre do Piauí. National Institute of Meteorology (INMET) data.
During the first season the work was conducted (2017/2018), the cultivars Brasmax Bonus IPRO® and BRS 9180IPRO® were used; in the second season (2018/2019), the cultivars were Brasmax Bonus IPRO® and Brasmax Extreme IPRO®. The characteristics of the cultivars are shown in Table 1. In the first season, the distance the fields the Brasmax Bonus IPRO® and BRS 9180IPRO® between was 12.347 meters (Figure 1B). In the second season, the distance the fields the Brasmax Bonus IPRO® and BRS 9180IPRO® between was 4.454 meters (Figure 1B).
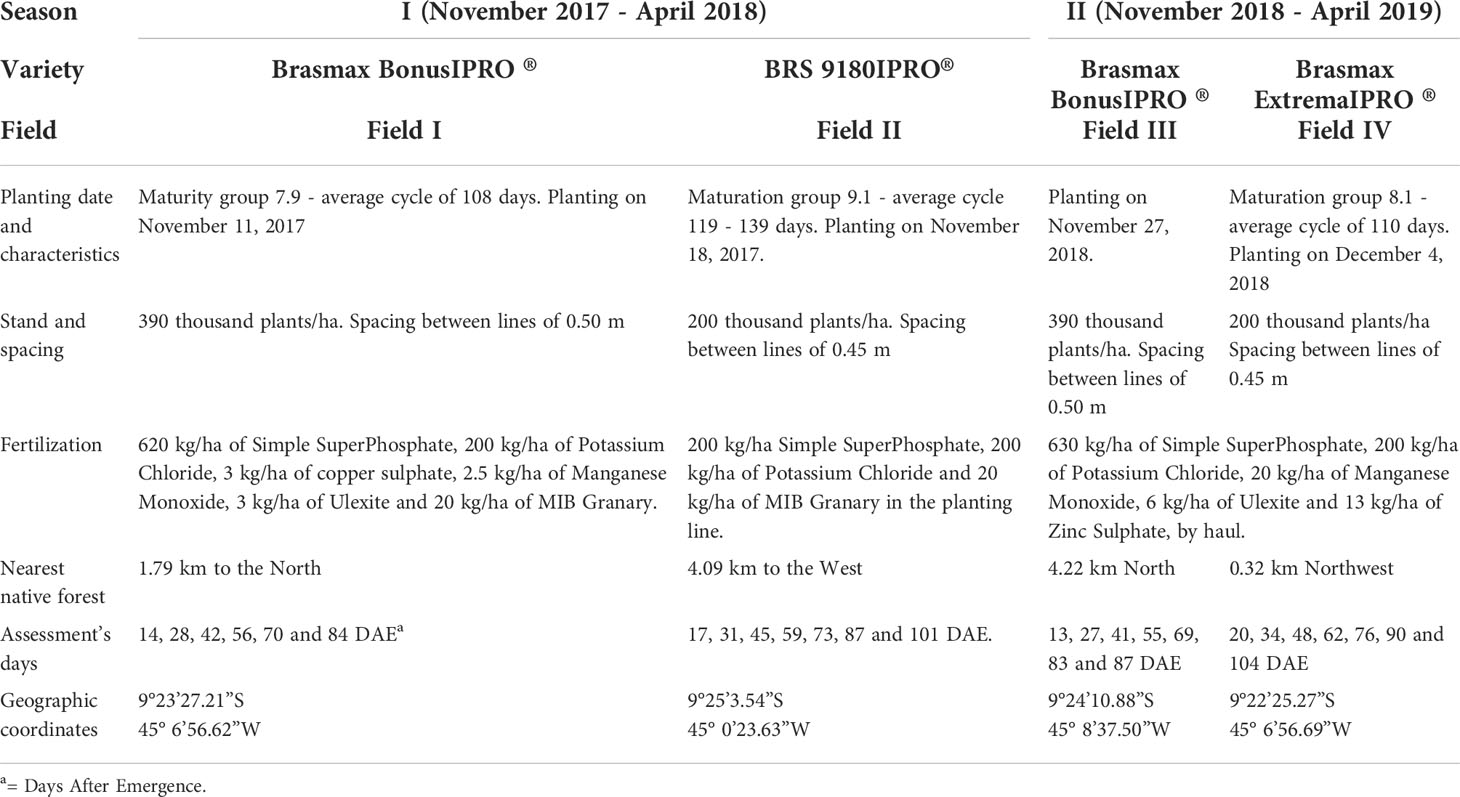
Table 1 Phenological cycle, fertilization, plant population, planting date, distance from cultivars to the nearest native forest, and evaluation days by cultivar in the two seasons studied.
An area of 1.6 ha (16,000 m²), with 100 m length and 160 m width, was divided into 160 sampling units, with 10 m2 (Figure 1). In the center of each sample unit, sets of four ordered points, equally spaced 2 m from a central point, were used to improve the estimate of the nugget effect (Figure 1). Each sampling point was georeferenced using a GPS device model GPSMAP 60CS®x (Garmin). The distance from each field to the nearest native vegetation is described in Table 1.
Whitefly population
The population density of insects was evaluated in the sampling grid of 160 points previously georeferenced (Figure 1B). At each georeferenced point, 12 plants were evaluated; 4 subsamples of 3 plants were taken (sampling unit). The subsamples were 2.0 m equidistant from the central point (Figure 1C). The evaluated plants were positioned along a regular grid pattern throughout the crop cycle to obtain systematic sampling points and avoid directional trends.
The third leaflet from top to bottom (apical third) of each plant was evaluated by direct counting (Naranjo and Flint, 1995; Pereira et al., 2004). Leaves were handled with care, and the nymphs and adults of B. tabaci were counted. A magnifying glass (40x) was used to count the number of nymphs. We evaluated these leaves using a direct counting method because these are appropriate technique for assessing the density of B. tabaci nymphs and adults in soybean crops (Naranjo and Flint, 1995; Pereira et al., 2004). The sampling schedule was standardized; the evaluations started at 7 am and ended at 11 am. The sampling schedules for each cultivar are described in Table 1.
Analysis of the whitefly spatial distribution
Phytosanitary management
The crop management practices were used in the region, including the application of pesticides against stinkbugs and whiteflies. In the 2017/2018 season, Field I received applications of Imidacloprid and Acetamiprid + Bifenthrin, while Chlorpyrifos and Bifenthrin + Carbosulfan were applied in the other field (Table 1). In the 2018/2019 season, Chlorpyrifos, Imidacloprid, or Imidacloprid + Beta-cyfluthrin were applied as needed in the fields. The insecticide label rate was used in all applications.
Data analysis
The data on adult and nymph densities of B. tabaci were submitted to statistical analysis. Subsequently, principal component analysis was performed between the range and density of whitefly adults with climatic parameters (temperature, relative humidity, wind speed, and rainfall). The PCA was used to analyze the interrelationships between the variables studied, and if there is any effect of climatic parameters on the distribution and density of whitefly adults and nymphs. These analyses were performed using Package ‘psych’ in R® software (R Core, 2020). All geostatistical procedures were performed using the Geostatistical Analyst Tool for ArcGIS 10.5 (ESRI). The steps in this procedure are follows: map and examination of data; preprocess of data if necessary (transform, detrend, decluster); definition of spatial structure model; definition of search strategy; prediction of values at unsampled locations; quantification of uncertainty of the predictions; checking if the model produces reasonable results for predictions and uncertainties, and using the information in risk analysis and decision making.
Subsequently, geostatistical analysis was performed; the spatial patterns and interpolations were determined using the parameters of adjusted experimental semivariograms and ordinary kriging, respectively. The semivariograms were calculated from the primary collected data, allowing us to detect differences between pairs of sampled points in relation to the distances (this procedure was used to adjust the theoretical semivariogram). Once the semivariance increases, there is a spatial dependence relationship between the densities of B. tabaci and the sampled points. The nugget effect and the sill value were calculated for each of the adjusted models (spherical, exponential, and Gaussian).
The experimental semivariograms were adjusted to the theoretical models, and the selection was made based on the cross-validation parameters, in which the measured and estimated values were compared using the standard mean error (SME) and the root mean square standardized error (RMSSE).
The kriging indicator was applied to spatial distribution maps of the insect in the crops, with the objective of modeling the probability of unsampled locations exceeding the quality reference values (QRVs). The kriging indicator does not use normal distribution assumptions, because it transforms the original data into binary values and, consequently, into cumulative distribution functions from pre-established values, in this case the QRVs (Chakraborty et al., 2017; Richer-de-Forges et al., 2017). The data were transformed into log-normal values to minimize distribution errors and meet the requirements of common kriging based on the rejection of the null hypothesis of the Kolmogorov-Smirnov test for normal distribution. Spatial variability was determined from isotropic and anisotropic semivariograms. Anisotropic calculations were performed in four directions (0, 45, 90 and 135°).
To obtain reliable estimates, the theoretical model needs to show SME values close to 0 and RMSSE close to 1 (Bahrami Jovein and Hosseini, 2017). The Akaike information criterion (AIC) was used as the last selection criterion. The spatial dependence rate (SDR) was calculated according to the formula: [C0/(C0 + C1) × 100] (Cambardella et al., 1994). A nugget effect less than or equal to 25% of the plateau was considered strong. The value was considered moderate when it was between 25 and 75% and weak when it was above 75%. Variables that showed SDR less than one unit were not considered. Spatial distribution maps of B. tabaci adults and nymphs were prepared for each crop.
Results
The variance values were within the range 0 to 7.52 and were predominantly positive. Where the peak of the normality curve of the results was higher than the standard value, the distribution curves were classified with positive asymmetries, and the coefficient of variation values were predominantly greater than 30%. In the two seasons evaluated, the infestation by adults and nymphs of B. tabaci generally started between 30 and 50 days after the emergence of the plants. The maximum population density of ten adults per plant in the BRS 9180IPRO® were recorded 101 days after plant emergence, and approximately four nymphs per leaflet in Brasmax ExtremaIPRO® were recorded 90 days after plant emergence (Figure 3).
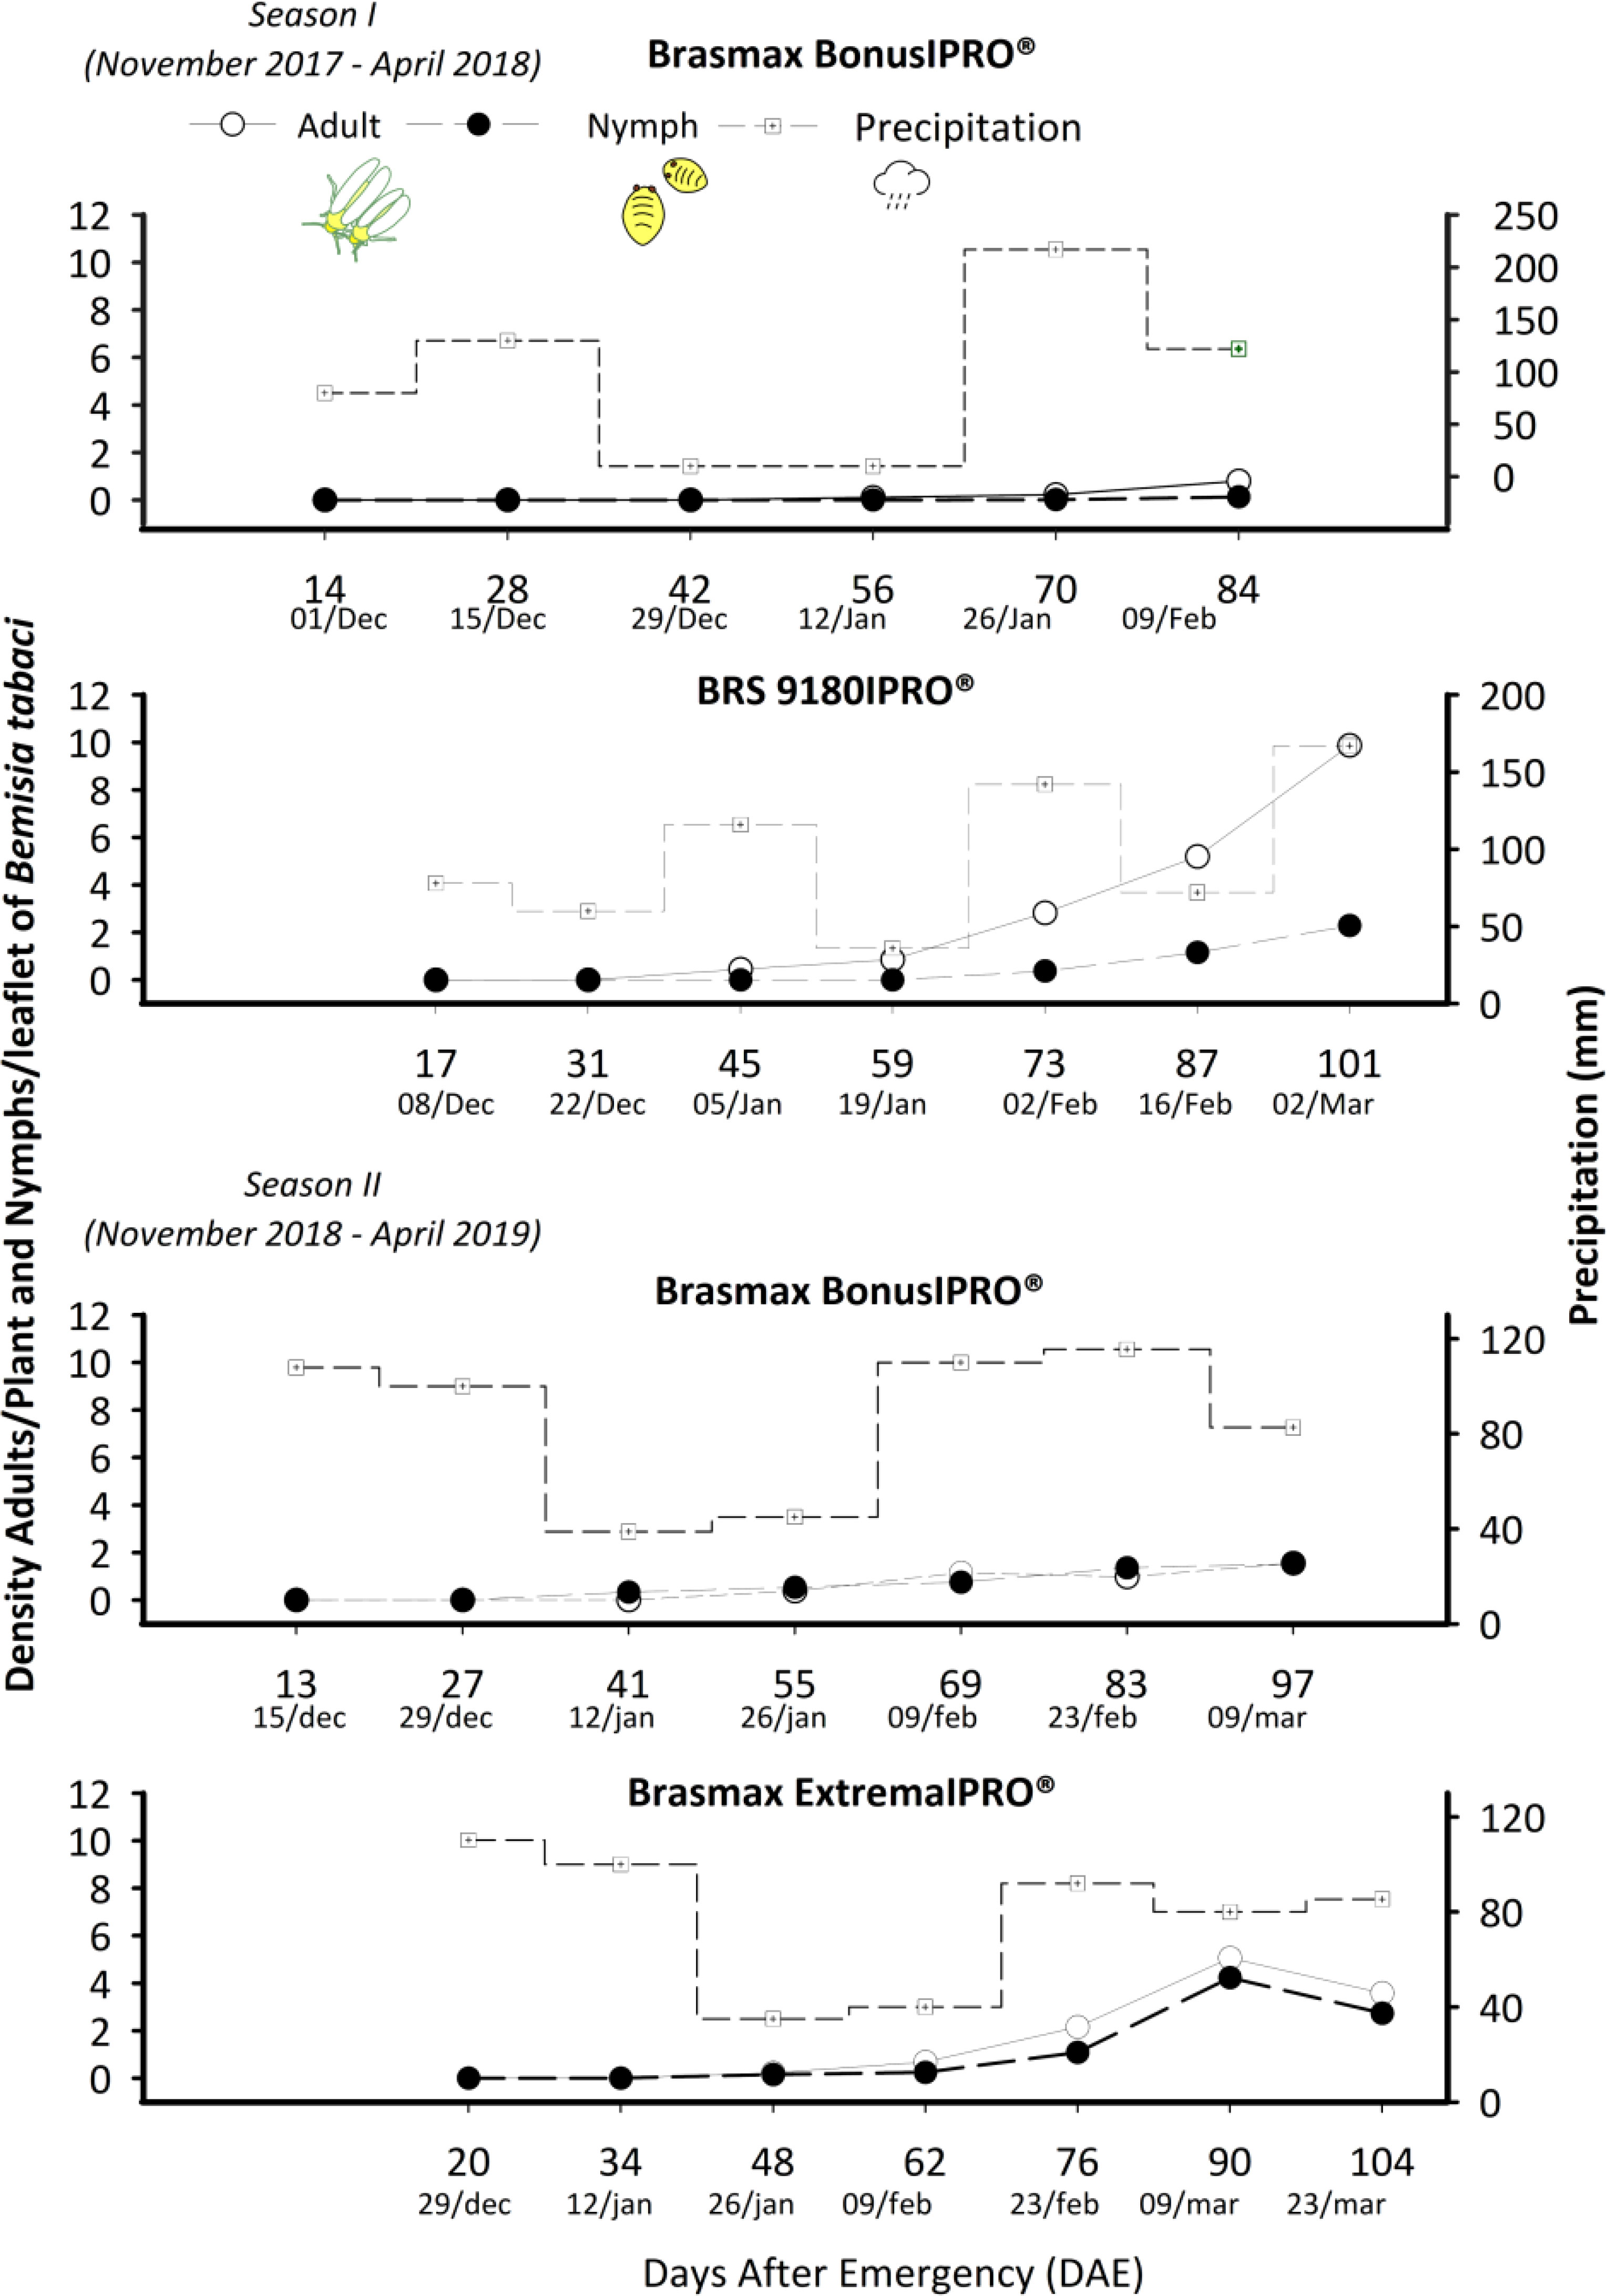
Figure 3 Population density of Bemisia tabaci adults and nymphs in the Brasmax Bonus IPRO®, BRS 9180IPRO® and Brasmax ExtremaIPRO® cultivars in seasons I and II and rainfall.
The results that showed a strong or moderate degree of spatial dependence (SDR) were subjected to geostatistical models and chosen based on cross-validation parameters using the standard mean error (SME) and the root mean square standardized error (RMSSE). Of the 126 models that were processed, 33 were selected, of which 13 were exponential, 10 Gaussian, 10 spherical, and 36 pure nugget effects (Table 2). All selected models were isotropic (i.e., the spatial autocorrelation was the same in all directions).
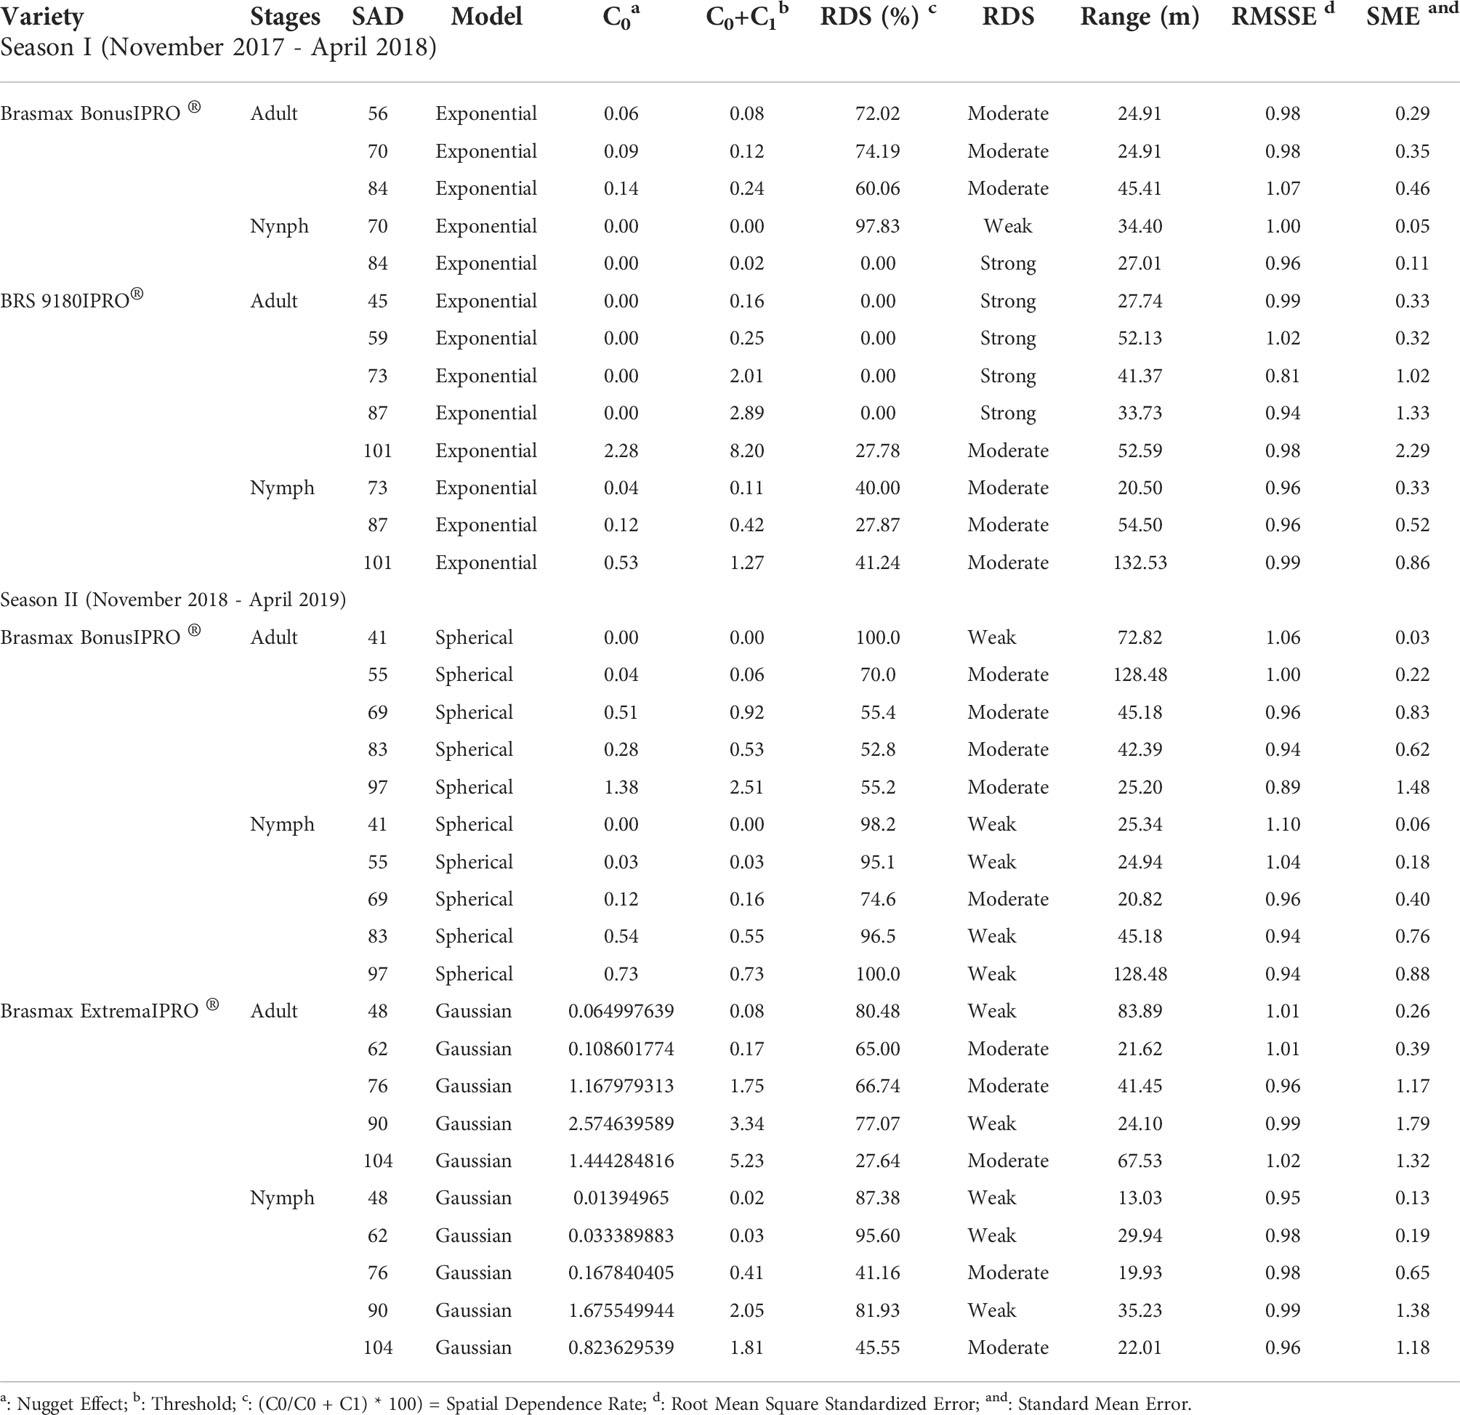
Table 2 Models and parameters estimated by semivariogram for Bemisia tabaci adults and nymphs in the cultivars Brasmax BonusIPRO®, BRS 9180IPRO® and Brasmax ExtremaIPRO.
Differences in the variogram parameters (nugget, sill, and range) were observed in the three cultivars in the two sampled seasons. A nugget effect was observed in the variograms, always at a low density of B. tabaci adults or nymphs (Figures 4, 5). The SDR of the models ranged from 0 to 100. This shows a significant effect of the nugget effect on the interpolation for some sampled days. These proportions showed that the spatial component accounted for 66% of the total spatial variance. From the selected models, 15.15% showed a strong SDR (<0.25), 51.52% moderate SDR (between 0.25 and 0.75), and 33.33 weak SDR (Table 2).
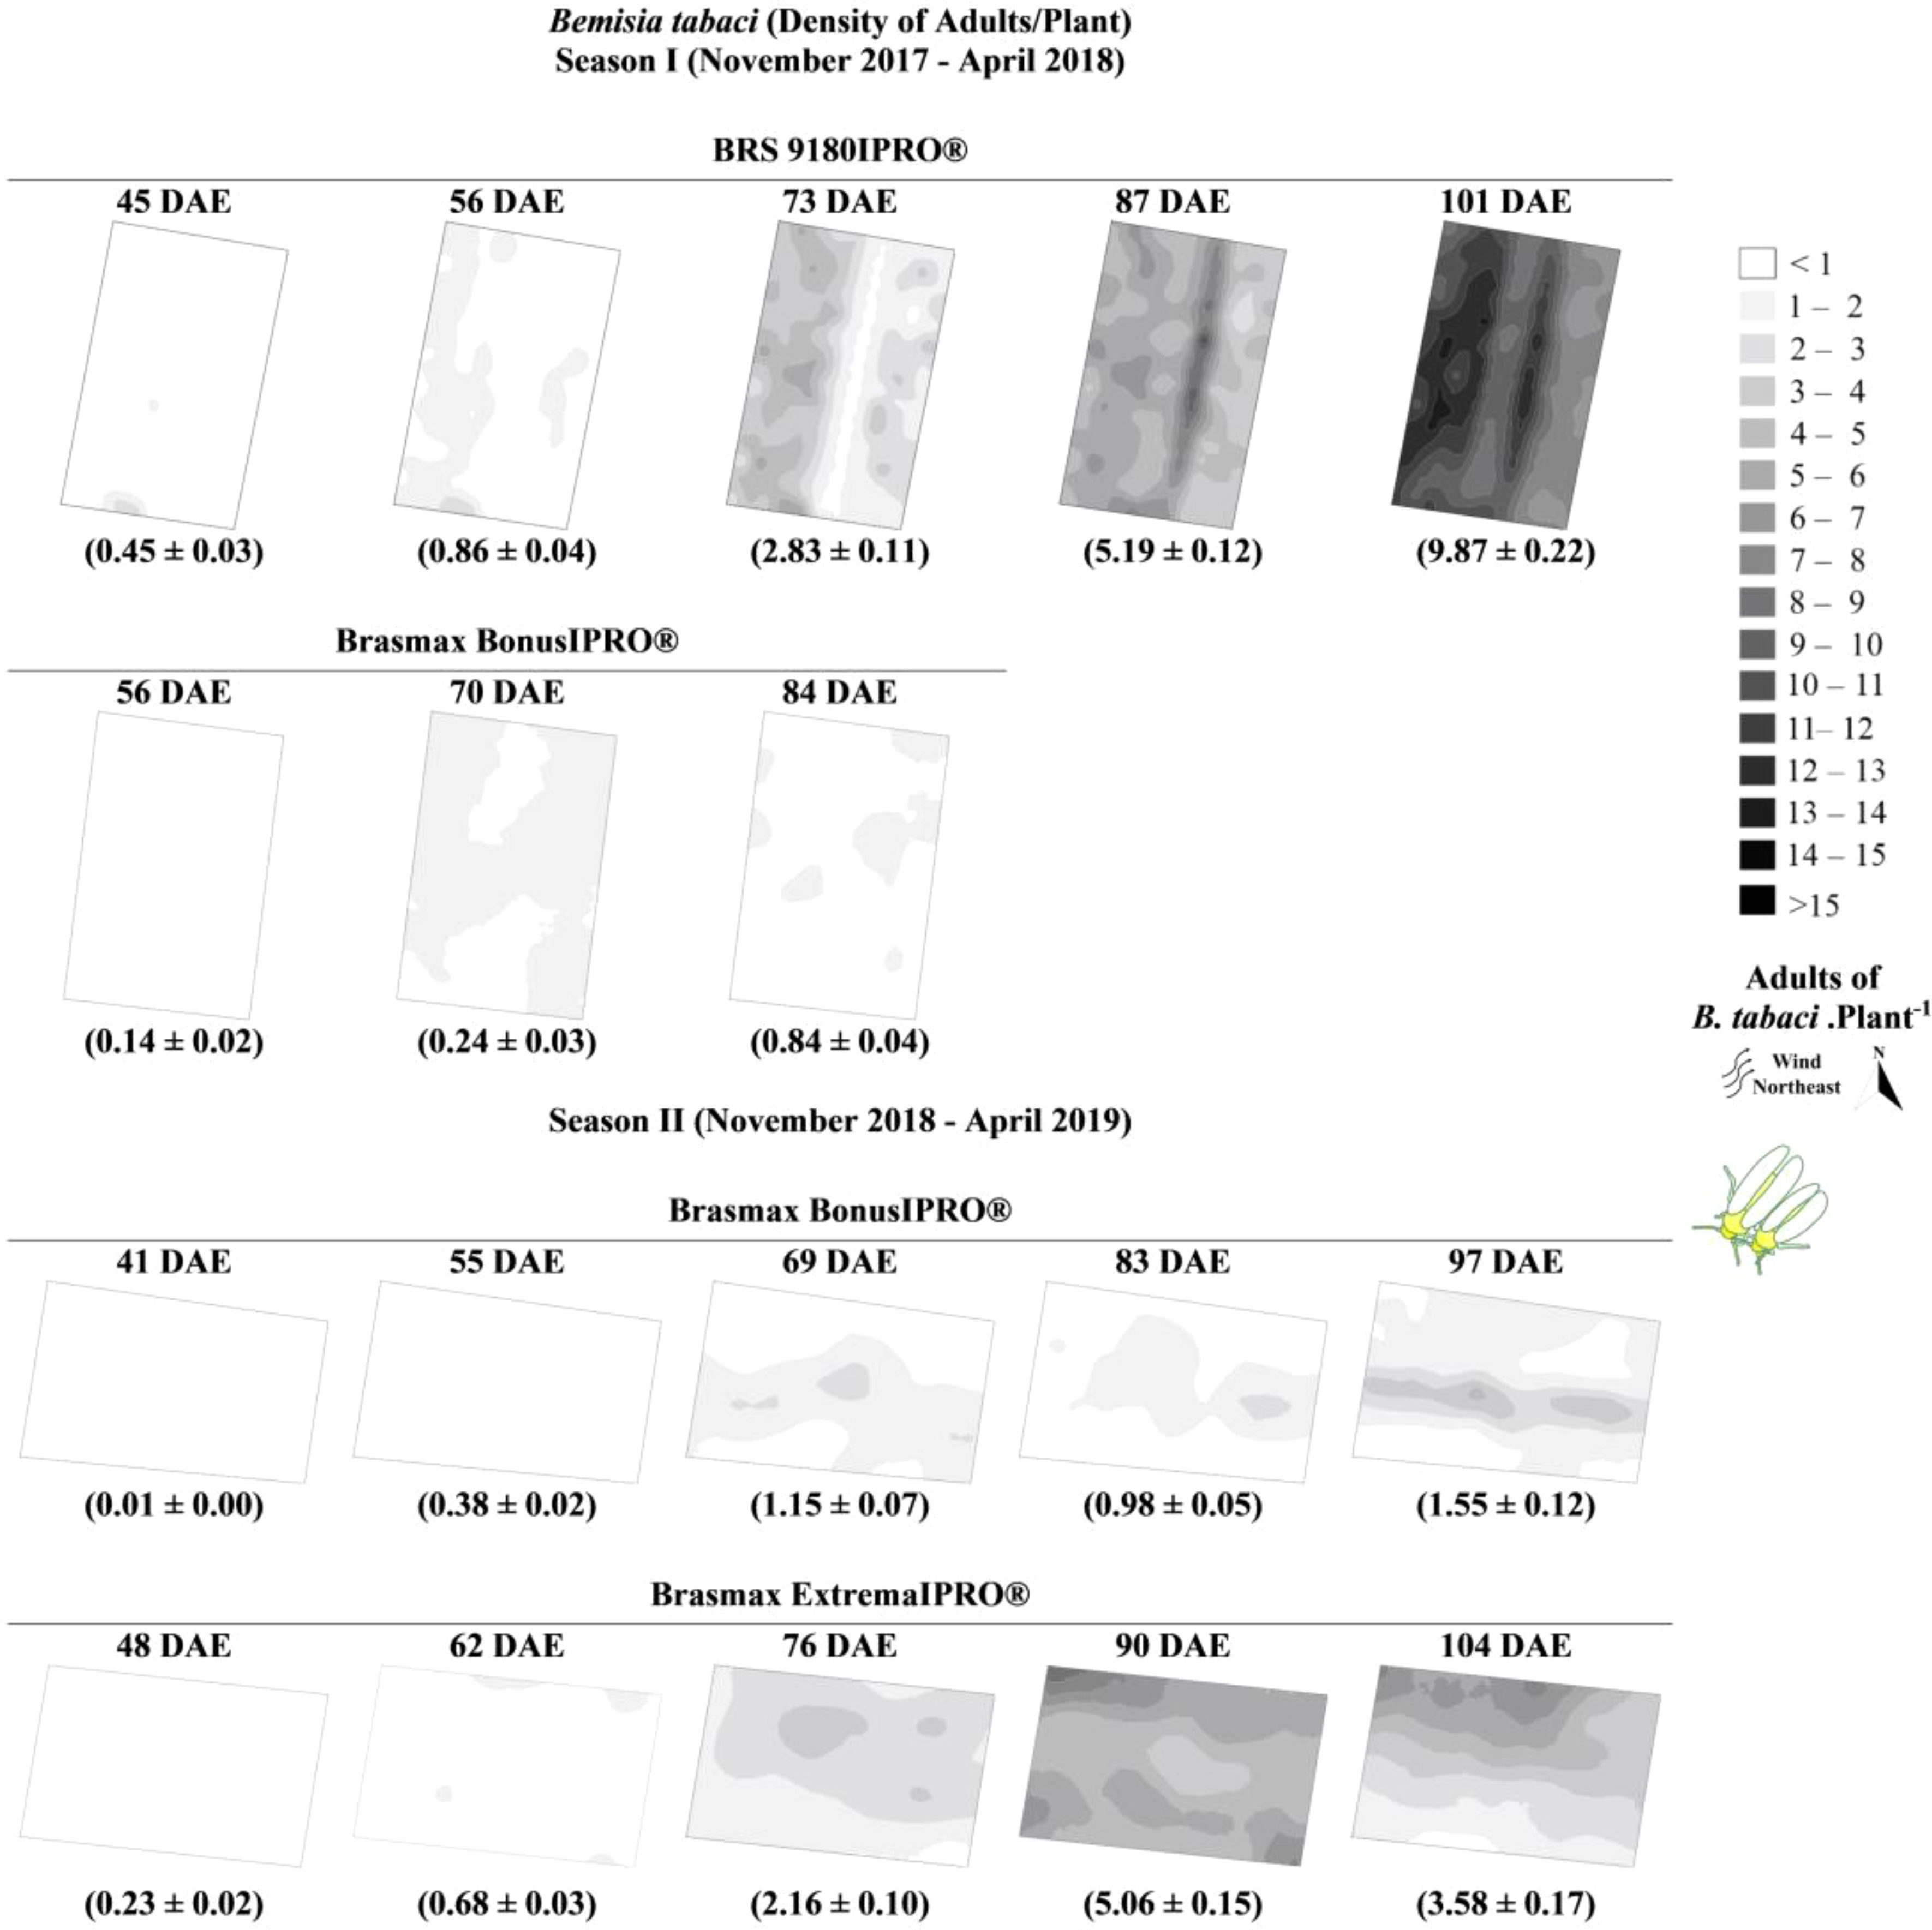
Figure 4 Kriging maps for the spatial variability of Bemisia tabaci adults in the Brasmax BonusIPRO®, BRS 9180IPRO® and Brasmax ExtremaIPRO® cultivars in 2017/2018 seasons I and 2018/2019 season II.
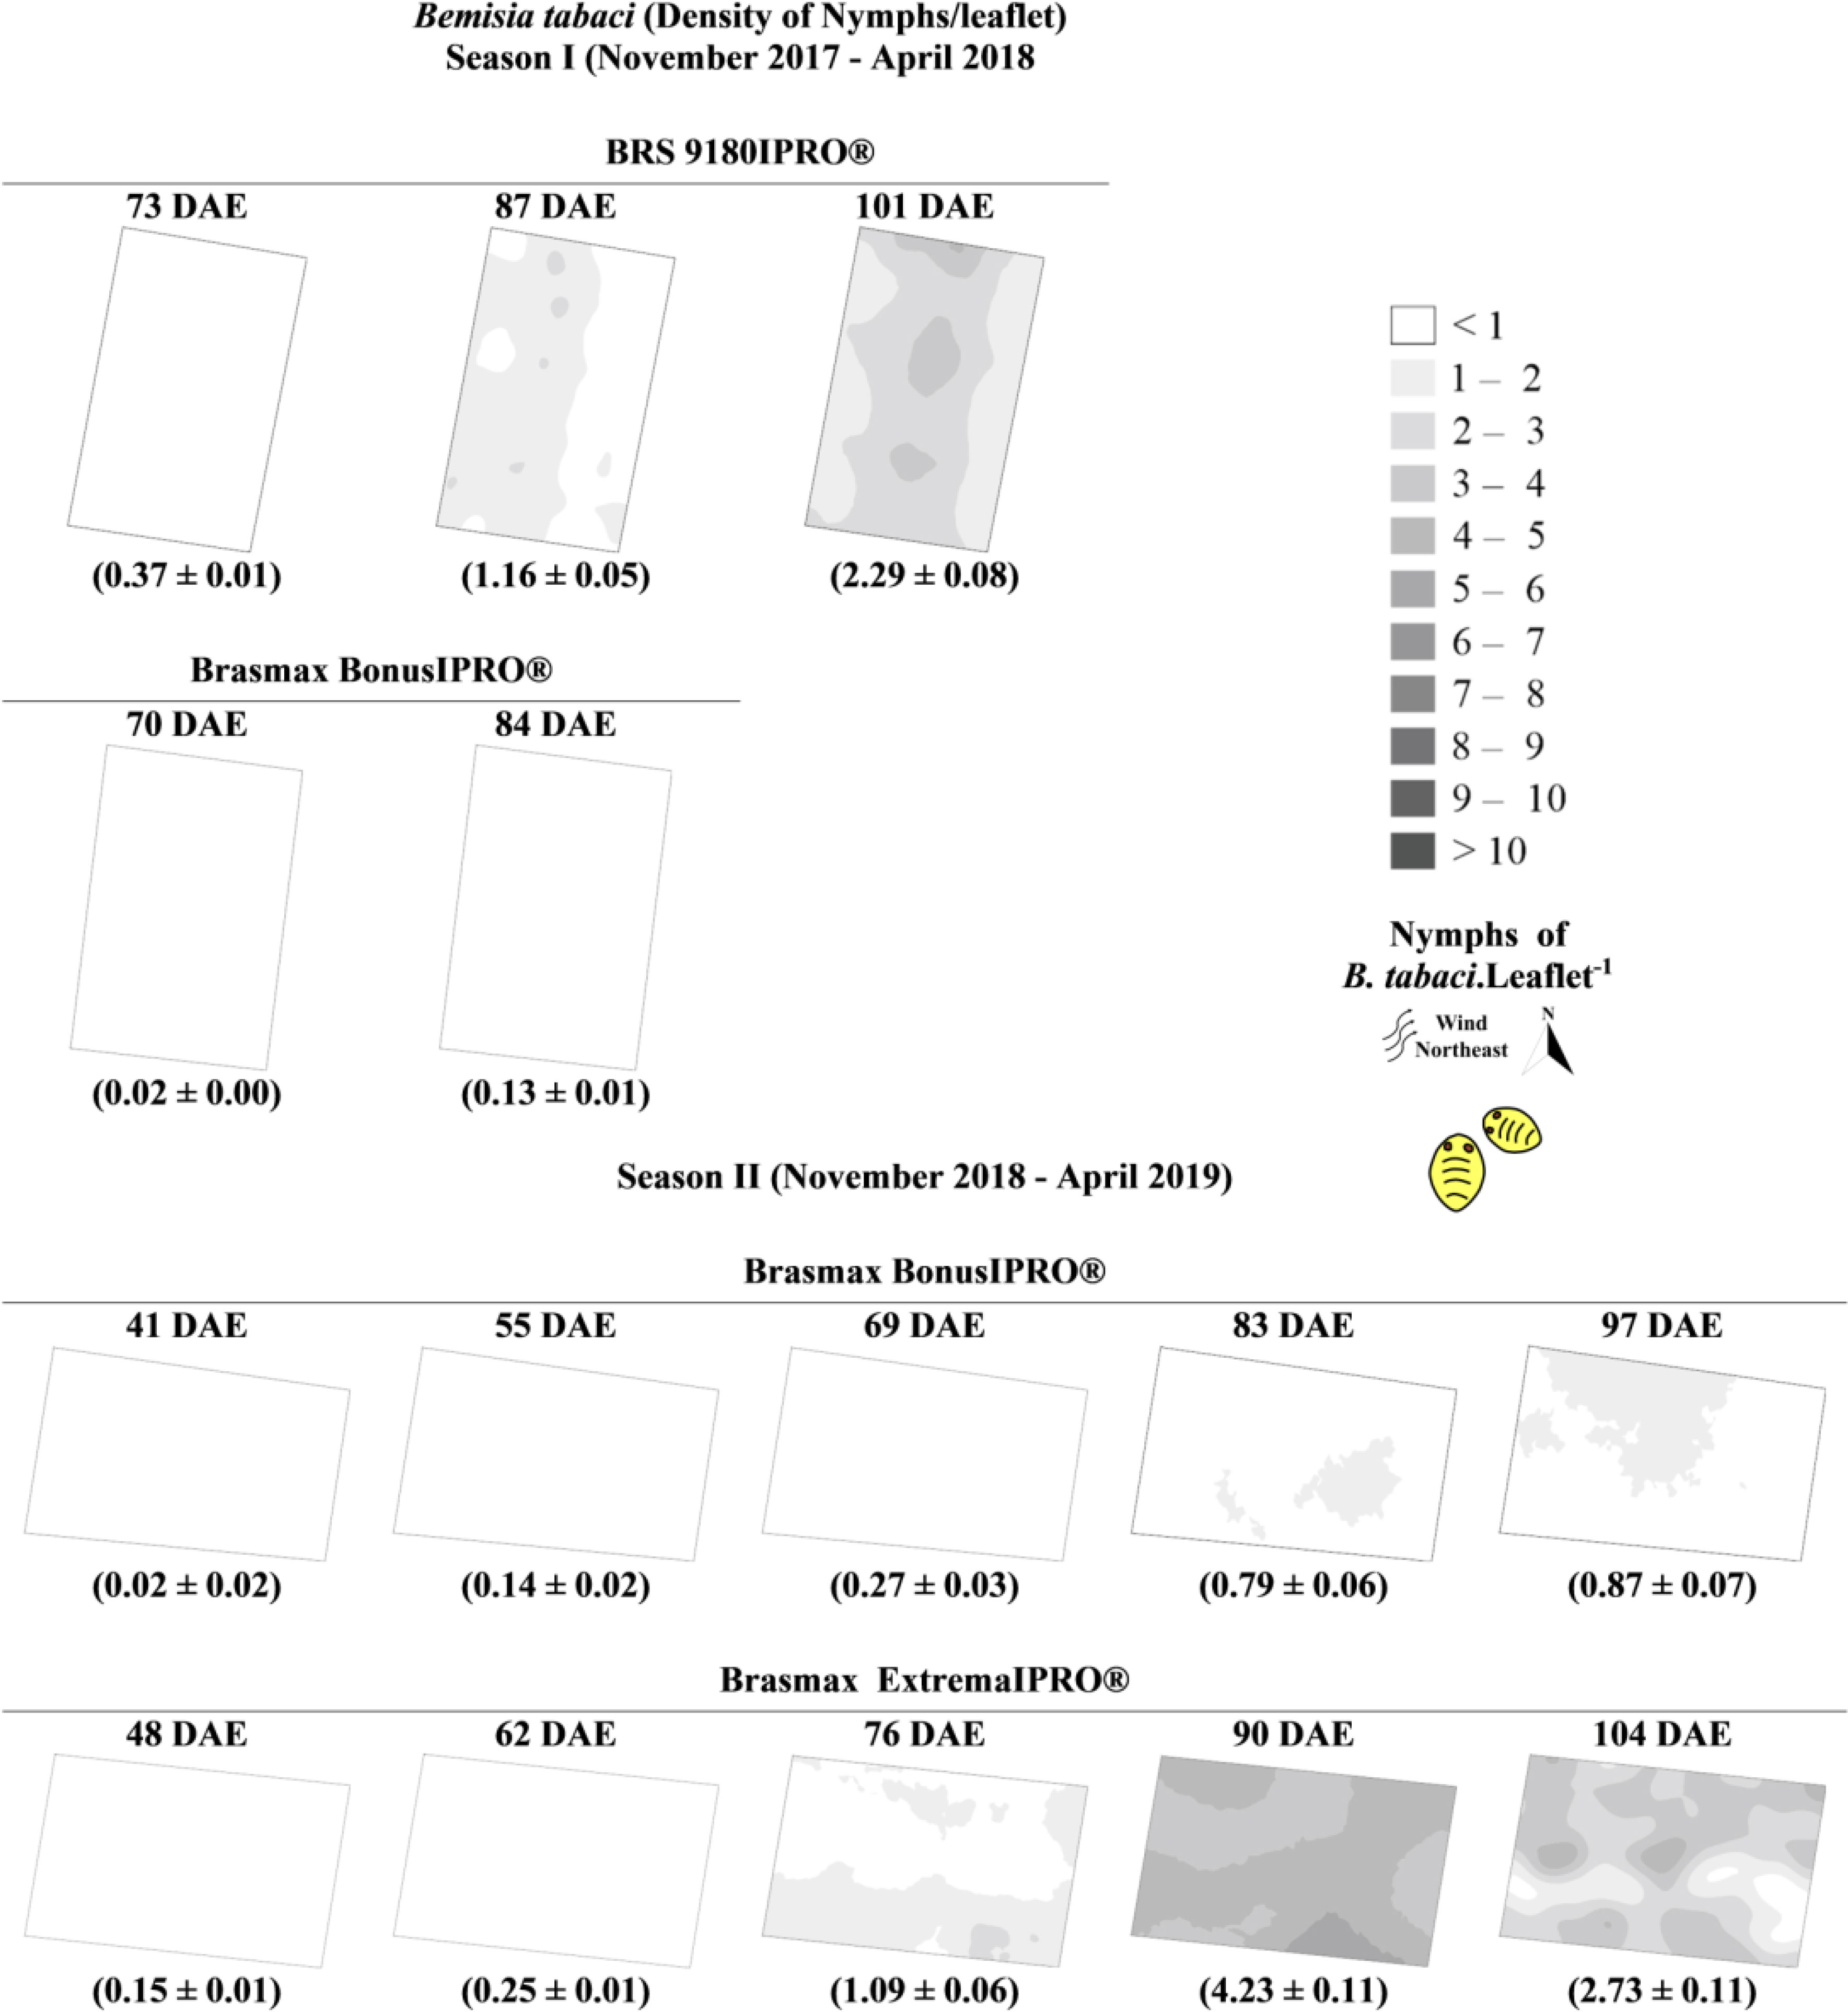
Figure 5 Kriging maps referring to the spatial variability of Bemisia tabaci nymphs in the Brasmax BonusIPRO®, BRS 9180IPRO® and Brasmax ExtremaIPRO® cultivars in 2017/2018 seasons I and 2018/2019 season II.
The ranges of the models varied from 13.03 to 132.53 m, and the maximum range obtained for adults was 67 m at 104 DAE in the Brasmax ExtremaIPRO® cultivar and approximately 130 m for nymphs 101 DAE in the BRS 9180IPRO® cultivar (Table 2).
We observed that colonization of soybean plants by B. tabaci may be divided into three stages: the start of infestation, colonization of the area, and dispersion in the area. The adults of B. tabaci began to infest the experimental area from the outermost area; in season I, the insects came from the west, and in season II, the insects originated from the north (Figure 4).
Colonization by B. tabaci nymphs occurs as adults disperse in the area. Near the end of the crop cycle, adults, and nymphs of B. tabaci had already colonized the whole experimental area. With the colonization of the total area, adults began the process of migration to nearby areas (Figures 4, 5).
The soybean cultivars may be divided into three groups according to the density of the pest. In the first group (Brasmax BonusIPRO®), the lowest densities of the pest (2 adults and 1 nymph per leaf) were observed. In the second group (Brasmax ExtremaIPRO®), lands with a higher density of nymphs (up to 10 nymphs per leaf) were observed. In the third group (BRS 9180IPRO®), plants exhibited the highest densities of adults (up to 15 adults per leaf) (Figures 4, 5).
We observed two patterns of variation in the densities of B. tabaci throughout the development of the plants. The first occurred in Brasmax BonusIPRO®, where the pest population varied little over time and remained at low density. The second pattern occurred in Brasmax ExtremaIPRO® and BRS 9180IPRO®, where the pest population increased over time and was distributed throughout the crop area (Figures 4, 5).
The mean air temperature was high (29-33°C) during the cropping period. On the other hand, rainfall ranged from 10 to 127 mm per month during the cropping period (Figure 2). The winds during the experimental periods occurred predominantly in the northeast direction in 70% of cases with a maximum speed of 2.1 m/s. Performing the main component analysis, it was observed that the two axes explained 74.79% and 86.99 of the date variance for adults and nymphs respectively. There were positive correlations between the range and wind speed, and positive correlations were also observed between adult whitefly densities and rainfall and relative humidity (Figure 6A). Furthermore, there were positive correlations between nymph density with range, as well as precipitation and relative humidity (Figure 6B).
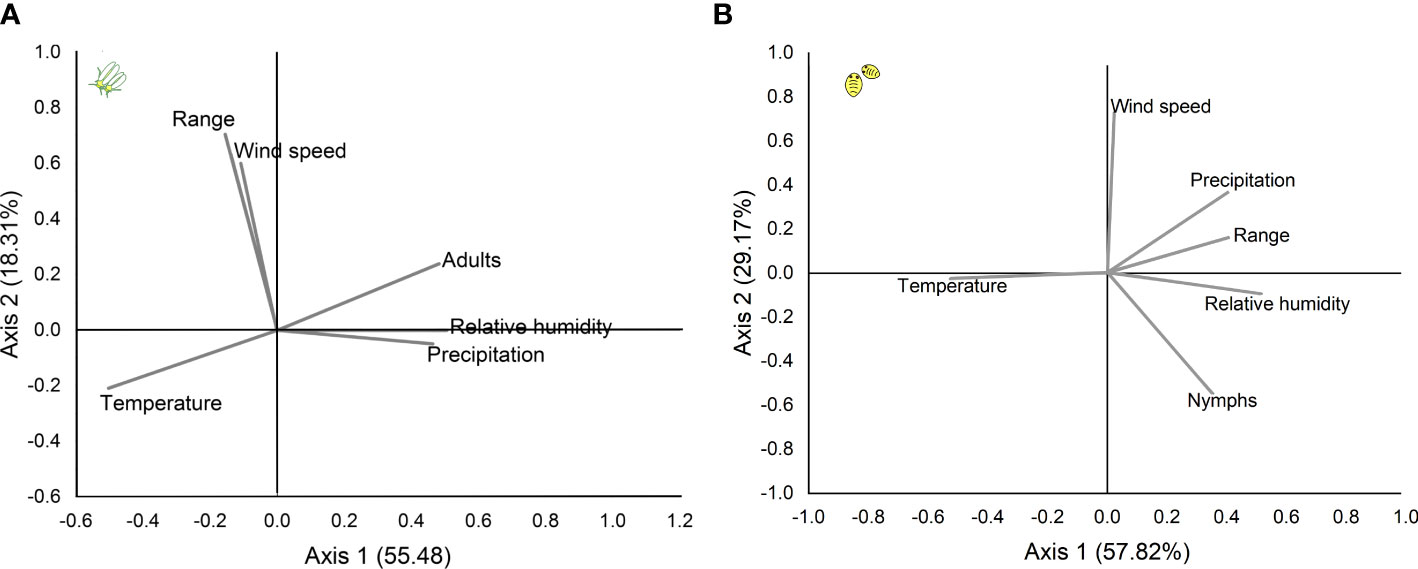
Figure 6 Principal component analysis of the effects of rainfall and climate elements on the range and abundance of (B) tabaci in soybean crops (A) for adults and (B) for nymphs. The first and second axes explained 74.79% and 86.99 of the date variance for adults and nymphs, respectively.
Discussion
The data presented here provide information on the spatiotemporal dynamics of B. tabaci in commercial soybean crops. The initial foci of colonization by adults occurred near the end of the vegetative stage of the crop, and it is common to observe the occurrence of nymphs and adults of B. tabaci at this stage of plant development. Thus, in regions of similar conditions, whitefly monitoring should be intensified from the end of the vegetative stage and the beginning of the reproductive stage (R1). The peak infestation by adults and nymphs recorded in the present study was relatively low compared to other studies (Vieira et al., 2013; Suekane et al., 2018).
In previous experiments in the greenhouse, the cultivar Brasmax BonusIPRO ® had greater attractiveness for adults, colonization by nymphs and oviposition by B. tabaci, when compared to the cultivar BRS 9180IPRO® (Rodrigues et al., 2021). In our study, there was low infestation in the two evaluated seasons, which may indicate that cultivars of an early cycle with early planting may escape the whitefly attack (Ameen et al., 2019) and as mentioned above B. tabaci infestation was more severe in late February and early March. Whereas the attractiveness of the cultivars in relation to the whitefly, reconciles with the fact that there is a large number of cultivars available on the market, the variations of cultivars planted over the years by the producers, the planting time in each region, are issues that should be considered.
Bemisia tabaci showed an aggregated distribution in the soybean crops, indicating that there were factors that influenced this outcome. Information about the type of distribution and range of the whitefly is essential for the elaboration of the monitoring plans, mainly in the definition of the distance between the sampling points. Because depending on the number of points per hectare, the population can be underestimated or overestimated. Here we found that: (1) the distribution max range is related to the level of infestation by adults and nymphs of B. tabaci; (2) the type of aggregate distribution indicates that the level of infestation shows little variation within the area of infestation, and (3) the maximum range of 130 m was observed for adults and nymphs. This distance should be considered in monitoring plans. The spatial distribution of pest insects in crops is a consequence of the colonization and dispersion of these organisms at these sites (Rosado et al., 2015; Martins et al., 2018). Climate elements, terrain topography, characteristics of insect species, and landscapes are among the factors influencing the spatial distribution of pest insects in crops (Silva et al., 2011; Rusch et al., 2013; Carrière et al., 2017; Ludwig et al., 2017; Czepak et al., 2018; Martins et al., 2018).
Some results obtained for B. tabaci adults and nymphs showed a weak degree of spatial dependence. This finding is characterized as a pure nugget effect (total absence of spatial dependence), probably due to the low infestation by adults and whitefly nymphs in each evaluation, making the in geostatistical analyses imperceptible (Reay-Jones et al., 2010; Pias et al., 2017). These results are a common finding in this type of study; other authors with experiments on the spatial distribution of Euschistus heros (Fabricius, 1798) (Hemiptera: Pentatomidae) in soybean have made similar observations (Pias et al., 2017; De Souza et al., 2018).
According to the semivariograms, whitefly adults and nymphs had an isotropic distribution. This finding confirms the premise that B. tabaci disperses across the field in a diffusion pattern, achieving an equal or similar number of adults throughout the sampling points regardless of direction, with the center of origin as the beginning of the evaluation (Byrne et al., 1997). Isotropic and aggregate pattern distributions were observed for adults and nymphs, and a reduction in range (dispersion radius) was observed as the density of adults per plant increased, while for nymphs, the opposite effect was verified. Other authors have observed the same pattern of whitefly distribution in soybean and other crops (Byrne et al., 1997; Lima et al., 2018; Suekane et al., 2018). The spatial distribution of B. tabaci in commercial watermelon crops, established that the dispersion of the insect was not influenced by a physical barrier or height gradient (Lima et al., 2018).
The kriging maps made possible to verify that colonization of the area by B. tabaci proceeded in the western and northern regions. Near the experimental area, there is a permanent preservation area, native forest. Therefore, when favorable environmental conditions existed, the infestation of B. tabaci in soybean crops was to be expected. Migration from the native vegetation to the crop occurs when there is abundant food and shelter (Macfadyen et al., 2015). However, the northeast winds were predominant in both seasons; the adults of B. tabaci may fly upwind searching for food or be dispersed by the wind given their small body size (Reinecke and Hilker, 2014).”
Geostatistics allowed us to verify the movements of B. tabaci adults and nymphs during the evaluations and soybean cycle. As previously explored, there are factors that can affect the distribution of pests in the field, features linked to insect characteristics such as population growth (reproduction, mortality) and dispersion (immigration, colonization, emigration) (Byrne et al., 1997; Sciarretta and Trematerra, 2014; Pias et al., 2017; Suekane et al., 2018; De Souza et al., 2018). B. tabaci may fly to a height of up to 7 m and a distance of 7 km (Isaacs and Byrne, 1998). Climatic factors such as rainfall and the relative humidity of the air favored an increase in the density of whitefly adults and nymphs, while wind speed favored the dispersion of adults, according to the literature (Byrne et al., 1997; Lima et al., 2018). Perhaps it is possible to manage the insect pest accurately before weather conditions favor the spread of the insect throughout the site; if the climatic conditions of the region always favor the distribution of the insect pest, control can be chosen as early as the presence of the insect in the place is verified. The present study provides important information about the pattern of aggregation and distribution of B. tabaci, which may be used in future work to assist in the sampling method in soybean grown in tropical or subtropical regions.
Conclusion
The results of this research help in the understanding of the spatiotemporal dynamics of B. tabaci populations in soybean crops. The colonization of B. tabaci had two patterns. In the first, colonization started at end of the vegetative phase at the outermost parts of the crop. In the second, the insects occupied the whole area of the crop since the beginning of cultivation. The adult whitefly density on soybean crops was positively correlated with rainfall, relative humidity, and wind speed. Bemisia tabaci adults and nymphs have an aggregate distribution, with a dispersion radius dependent on the density of the insects and the stage of crop development.
Data availability statement
The datasets presented in this article are not readily available because there are no restrictions. Requests to access the datasets should be directed to Luciana Barboza Silva, bHViYXJib3NhYmlvQHVmcGkuZWR1LmJy.
Author contributions
RR: conceptualization, data curation, and writing- original draft preparation. LS: supervision and writing- original draft preparation. MS: visualization and investigation. JL: software and validation. EL: software and validation; RB: software and validation; LA: data curation, and writing- original draft preparation. All authors contributed to the article and approved the submitted version.
Funding
We thank the National Council for Scientific and Technological Development — CNPq — Brazil for financial support.
Acknowledgments
We also thank the Coordination for the Improvement of Higher Education Personnel (CAPES), Brazil and the Piauí State Research Foundation (FAPEPI) for the scholarships and resources provided. To the Federal University of Piauí, Brazil, for providing logistical support. We also thank the Celeiro Seeds Farm for the supply of the area and inputs.
Conflict of interest
The authors declare that the research was conducted in the absence of any commercial or financial relationships that could be construed as a potential conflict of interest.
Publisher’s note
All claims expressed in this article are solely those of the authors and do not necessarily represent those of their affiliated organizations, or those of the publisher, the editors and the reviewers. Any product that may be evaluated in this article, or claim that may be made by its manufacturer, is not guaranteed or endorsed by the publisher.
References
Ameen N., Amjad M., Murtaza B., Abbas G., Shahid M., Imran M., et al. (2019). Biogeochemical behavior of nickel under different abiotic stresses: toxicity and detoxification mechanisms in plants. Environ. Sci. pollut. Res. 26 (11), 10496–10514. doi: 10.1007/s11356-019-04540-4
Bahrami Jovein E., Hosseini S. M. (2017). Predicting saltwater intrusion into aquifers in vicinity of deserts using spatio-temporal kriging. Environ. Monit. Assess. 189 (2), 1–16. doi: 10.1007/s10661-017-5795-8
Byrne D. N., Rathman R. J., Orum T. V., Palumbo J. C. (1997). Localized migration and dispersal by the sweet potato whitefly, Bemisia tabaci. Oecology 105 (3), 320−328. doi: 10.1007/BF00328734
Cambardella C. A., Moorman T. B., Novak J. M., Parkin T. B., Karlen D. L., Turco R. F., et al. (1994). Field-scale variability of soil properties in central Iowa soils. Soil Sci. Soc. America J. 58 (5), 1501–1511. doi: 10.2136/sssaj1994.03615995005800050033x
Carrière Y., Degain B., Liesner L., Dutilleul P., Palumbo J. C. (2017). Validation of a landscape-based model for whitefly spread of the cucurbit yellow stunting disorder virus to fall melons. J. Econ. Entomol. 110 (5), 2002−2009. doi: 10.1093/jee/tox213
Chakraborty S., Man T., Paulette L., Deb S., Li B., Weindorf D. C., et al. (2017). Rapid assessment of smelter/mining soil contamination via portable X-ray fluorescence spectrometry and indicator kriging. Geoderma 306, 108−119. doi: 10.1016/j.geoderma.2017.07.003
Cruz P., Baldin E. (2017). Performance of Bemisia tabaci biotype b on soybean genotypes. Neotrop. Entomol. 46 (2), 210−215. doi: 10.1007/s13744-016-0445-3
Czepak C., Coelho A. S. G., Rezende J. M., Le Senechal Nunes M., Weber I. D., Silvério R. F., et al. (2018). Bemisia taba ci MEAM 1 population surveys in soybean cultivation. Entomol. Exp. Appl. 166 (3), 215–223. doi: 10.1111/eea.12656
Da Silva Oliveira C. E., Floride Carneiro D. E., Toscano L. C., Ferreira dos santos R. M. (2018). Population dynamics of Bemisia tabaci biotype b (Gennadius 1889) in transgenic soybean. Rev. Agric. Neotrop. 5 (2), 1–5. doi: 10.32404/rean.v5i2.1425
De Barro P. J., Liu S. S., Boykin L. M., Dinsdale A. B. (2011). Bemisia tabaci: a statement of species status. Annu. Rev. Entomol. 56, 1–19. doi: 10.1146/annurev-ento-112408-085504
De Souza L. A., Barbosa J. C., Aguirre-Gil O. J., de Lima Viana D., Dos Santos L. S., Busoli A. C. (2018). Spatial distribution of nymphs and adults of Euschistus heros (Fabricius 1794) (Heteroptera: Pentatomidae) in transgenic soybean cultivars of different maturing cycles. Semina: Agric. Sci. 39 (3), 905–920. doi: 10.5433/1679-0359.2018v39n3p905
Ellsworth P. C., Diehl J. W., Naranjo S. E. (1995). “Sampling sweetpotato whiteflies in cotton. university of Arizona, college of agriculture and life sciences,” in Cooperative extension IPM series, vol. 2. (Tucson, Arizona: University of Arizona, College of Agriculture and Life Sciences, Cooperative Extension). Available at: http://cals.arizona.edu/crops/cotton/insects/wf/ipm6.htm.
Ellsworth P. C., Martinez-Carrillo J. L. (2001). IPM for Bemisia tabaci: a case study from north America. Crop Prot. 20 (9), 853–869. doi: 10.1016/S0261-2194(01)00116-8
Felicio T. N. P., Costa T. L., Sarmento R. A., Ramos R. S., Pereira P. S., da Silva R. S., et al. (2019). Surrounding vegetation, climatic elements, and predators affect the spatial dynamics of Bemisia tabaci (Hemiptera: Aleyrodidae) in commercial melon fields. J. Econ. Entomol. 112 (6), 2774–2781. doi: 10.1093/jee/toz181
Galdino T. V. D. S., Ferreira D. D. O., Santana Júnior P. A., Arcanjo L. D. P., Queiroz E. A., Sarmento R. A., et al. (2017). The role of the beetle Hypocryphalus mangiferae (Coleoptera: Curculionidae) in the spatiotemporal dynamics of mango wilt. J. Econ. Entomol. 110 (3), 865–874. doi: 10.1093/jee/tox063
Isaacs R., Byrne D. N. (1998). Aerial distribution, flight behaviour and eggload: Their inter-relationship during dispersal by the sweetpotato whitefly. J. Anim. Ecol. 67 (5), 741–750. doi: 10.1046/j.1365-2656.1998.00236.x
Kottek M., Grieser J., Beck C., Rudolf B., Rubel F. (2006). World map of the köppen-Geiger climate classification updated. Meteorol. Z. 15, 259–263. doi: 10.1127/0941-2948/2006/0130
Lima C. H., Sarmento R. A., Galdino T. V., Pereira P. S., Silva J., Souza D. J., et al. (2018). Spatiotemporal dynamics of whitefly Bemisia tabaci (Hemiptera: Aleyrodidae) in commercial watermelon crops. J. Econ. Entomol. 111 (4), 1895–1903. doi: 10.1093/jee/toy110
Lima C. H., Sarmento R. A., Pereira P. S., Galdino T. V., Santos F. A., Silva J., et al. (2017). Feasible sampling plan for Bemisia tabaci control decision -making in watermelon fields. Pest Manage. Sci. 73 (11), 2345–2352. doi: 10.1002/ps.4621
Li J. M., Ruan Y. M., Li F. F., Liu S. S., Wang X. W. (2011). Gene expression profiling of the whitefly (Bemisia tabaci) middle East – Asia minor 1 feeding on healthy and tomato yellow leaf curl China virus -infected tobacco. Insect Sci. 18 (1), 11–22. doi: 10.1111/j.1744-7917.2010.01386.x
Ludwig M., Schlinkert H., Meyhöfer R. (2017). Wind-modulated landscape effects on colonization of Brussels sprouts by insect pests and their syrphid antagonists. Agric. For. Entomol 20, 141−149. doi: 10.1111/afe.12237
Macfadyen S., Hopkinson J., Parry H., Neave M. J., Bianchi F. J. J. A., Zalucki M. P., et al. (2015). Early-season movement dynamics of phytophagous pest and natural enemies across a native vegetation-crop ecotone. Agric. Ecosyst. Environ. 200, 110–118. doi: 10.1016/j.agee.2014.11.012
Martins J. C., Picanço M. C., Silva R. S., Gonring A. H., Galdino T. V., Guedes R. N. (2018). Assessing the spatial distribution of Tuta absoluta (Lepidoptera: Gelechiidae) eggs in open -field tomato cultivation through geostatistical analysis. Pest Manage. Sci. 74 (1), 30–36. doi: 10.1002/ps.4664
Marubayashi J. M., Yuki V. A., Wutke E. B. (2010). Transmission of cowpea mild mottle virus by the whitefly Bemisia tabaci biotype b to bean and soybean plants. Summa Phytopathol. 36, 158–160. doi: 10.1590/S0100-54052010000200009
Masuda K., Kato M., Saito T. (2016). Reduction in carotenoid and chlorophyll content induced by the sweet potato whitefly. Bemisia tabaci. Sci. Horticult. 200, 102–104. doi: 10.1016/j.scienta.2016.01.010
Moura M. F. D., Picanço M. C., Silva É.M.D., Guedes R. N. C., Pereira J. L. (2003). Sampling plan of the biotype b of Bemisia tabaci in the cucumber crop. Pesqui. Agropecuária Bras. 38, 1357–1363. doi: 10.1590/S0100-204X2003001200001
Naranjo S. E., Flint H. M. (1995). Spatial distribution of adult Bemisia tabaci (Homoptera: Aleyrodidae) in cotton and development and validation of fixed-precision sampling plans for estimating population density. Environ. Entomol. 24 (2), 261–270. doi: 10.1093/ee/24.2.261
Oliveira C. M., Auad A. M., Mendes S. M., Frizzas M. R. (2013). Economic impact of exotic insect pests in Brazilian agriculture. J. Appl. Entomol. 137 (1-2), 1–15. doi: 10.1111/jen.12018
Palumbo J., Tonhasca A., D. Byrne D. (1994). Sampling plans and action thresholds for whiteflies on spring melons (Online. Coop. Ext. IPM Series 1. Publ. No. 194021. University of Arizona, College of Agriculture and Life Sciences, Cooperative Extension, Tucson, Arizona). Available at: http://cals.arizona.edu/crops/vegetables/insects/wf/wfmelons.html.
Pereira M. F., Boiça A. L. Jr., Barbosa J. C. (2004). Amostragem seqüencial (presença-ausência) para bemisia tabaci (Genn.) biótipo b (Hemiptera: Aleyrodidae) em feijoeiro (Phaseolus vulgaris l.). Neotrop. Entomol. 33, 499–504. doi: 10.1590/S1519-566X2004000400016
Pias O. H. D. C., Cherubin M. R., Berghetti J., Kuss C. C., Santi A. L., Basso C. J. (2017). Sampling grids for monitoring Euschistus heros infestation in soybean. Bragantia 76, 386–397. doi: 10.1590/1678-4499.2016-261
R Core. (2020). “Team r: A language and environment for statistical computing,” in R foundation for statistical computing. (Vienna, Austria). Available at: https://www.r-project.org.
Reay-Jones F. P. F., Toews M. D., Greene J. K., Reeves R. B. (2010). Spatial dynamics of Stink bugs (Hemiptera: Pentatomidae) and associated boll injury in southeastern cotton fields. Environ. Entomol. 39 (3), 956–969. doi: 10.1603/EN09237
Reinecke A., Hilker M. (2014). Plant semiochemicals – perception and behavioral responses by insects. Annu. Plant Rev. Online 47, 115–153. doi: 10.1002/9781118829783.ch4
Richer-de-Forges A. C., Saby N. P., Mulder V. L., Laroche B., Arrouays D. (2017). Probability mapping of iron pan presence in sandy podzols in south-West France, using digital soil mapping. Geoderma. Reg. 9, 39–46. doi: 10.1016/j.geodrs.2016.12.005
Rodrigues R. H. F., Silva L. B., Almeida L. F. O., da Silva S. R., Sobrinho N., Maggioni K., et al. (2021). Vertical distribution of bemisia tabaci on soybean and attractiveness of cultivars. Entomol. Exp. Appl. 169 (7), pp.610–pp.622. doi: 10.1111/eea.13051
Rosado J. F., Picanço M. C., Sarmento R. A., Pereira R. M., Pedro-Neto M., Galdino T. V. S., et al. (2015). Geostatistics as a tool to study mite dispersion in physic nut plantations. Bull. Entomol. Res. 105 (4), 381–389. doi: 10.1017/S0007485315000310
Rusch A., Valantin-Morison M., Sarthou J. P., Roger-Estrade J. (2013). Effect of crop management and landscape context on insect pest populations and crop damage. Agric. Ecosyst. Environ. 166, 118–112. doi: 10.1016/j.agee.2011.05.004
Sciarretta A., Trematerra P. (2014). Geostatistical tools for the study of insect spatial distribution: practical implications in the integrated management of orchard and vineyard pests. Plant Prot. Sci. 50 (2), 97–110. doi: 10.17221/40/2013-PPS
Silva G. A., Picanço M. C., Bacci L., Crespo A. L. B., Rosado J. F., Guedes R. N. C. (2011). Control failure likelihood and spatial dependence of insecticide resistance in the tomato pinworm. Tuta absoluta. Pest Manage. Sci. 67, 913–920. doi: 10.1002/ps.2131
Stansly P. A., Naranjo S. E. (2010). Bemisia: Bionomics and management of a global pest Vol. 1 (Springer Netherland), 540.
Suekane R., Degrande P. E., Melo E. P. D., Azambuja T. M., Menegati C. T. (2018). Spatial distribution of soybean plants infested with whitefly Bemisia tabaci (Gennadius 1889) (Hemiptera: Aleyrodidae). Arch. Biol. Inst. 85, 122–128. doi: 10.1590/1808-1657000642016
Vieira S. S., Bueno A. F., Boff M. I. C., Bueno R. C. O. F., Hoffman-Campo C. B. (2011). Resistance of soybean genotypes to Bemisia tabaci (Genn.) biotype b (Hemiptera: Aleyrodidae). Neotrop. Entomol. 40 (1), 117–122. doi: 10.1590/S1519-566X2011000100018
Keywords: aleyrodidae, dispersion, geostatistics, glycine max, hemiptera, whitefly
Citation: Ferreira Rodrigues RH, Silva LB, Silva MCF, Lopes JWB, Araujo Lima E, Sobreira Barbosa R and Oliveira Almeida LF (2022) Population fluctuation and distribution of bemisia tabaci MEAM1 (Hemiptera: Aleyrodidae) in soybean crops. Front. Agron. 4:958498. doi: 10.3389/fagro.2022.958498
Received: 31 May 2022; Accepted: 08 August 2022;
Published: 29 August 2022.
Edited by:
Eliseu José Guedes Pereira, Universidade Federal de Viçosa, BrazilReviewed by:
Oscar Fernando Santos Amaya, University of Pamplona, ColombiaClerison Regis Perini, Federal University of Santa Maria, Brazil
Copyright © 2022 Ferreira Rodrigues, Silva, Silva, Lopes, Araujo Lima, Sobreira Barbosa and Oliveira Almeida. This is an open-access article distributed under the terms of the Creative Commons Attribution License (CC BY). The use, distribution or reproduction in other forums is permitted, provided the original author(s) and the copyright owner(s) are credited and that the original publication in this journal is cited, in accordance with accepted academic practice. No use, distribution or reproduction is permitted which does not comply with these terms.
*Correspondence: Luciana Barboza Silva, bHViYXJib3NhYmlvQHVmcGkuZWR1LmJy