 Srinivasa Rao Pinnamaneni
 Saseendran S. Anapalli
 William Molin2
- 1Oak Ridge Institute for Science and Education, Oak Ridge, TN, United States
- 2Crop Production Systems Research Unit, USDA-ARS, Stoneville, MS, United States
- 3Sustainable Water Management Research Unit, USDA-ARS, Stoneville, MS, United States
Considerable variations in farm productivity were reported across soils and climates when winter cover crops (CC) were rotated with summer main cash crops. Hence, a three-year field study (2019-2021) was conducted on Dundee silt loam in a humid climate to assess soybean growth and yield, weed control, and profitability under no-till conditions in response to (i) no CC (NC), (ii) winter rye CC rolled when green, followed by soybean planting and desiccation by paraquat (GR) and iii) winter rye CC desiccated using paraquat and rolled followed by soybean planting (BR). No differences in phenological growth stages of soybean were observed among the treatments. Measured leaf area index was comparable among the treatments across the three seasons. The rate of rye CC biomass decay estimated eight weeks after planting (WAP) was much higher than at four WAP. In 2019, at eight WAP plant residue ranged from 29.3% under NC to 52.9% under GR, indicating the paraquat desiccated natural winter vegetation decays faster than the desiccated rye CC biomass. The weed biomass was 72% higher at eight WAP (0.29 Mg ha-1) than that of four WAP (0.17 Mg ha-1) and NC plots had higher weed biomass at both four WAP and eight WAP over CC plots. Field established soybean stand in the GR plots were consistently higher than the NC plots by 8%, 30%, and 22% in 2019, 2020, and 2021, respectively. Soybean yield in NC plot was 13% higher than GR and 15% higher than BR plots in 2019. However, in 2020 and 2021, soybean yield from BR and GR plots was significantly higher than NC plots (10% and 13%, respectively). In the three-year study, net returns from soybean with rye CC (regardless of GR or BR) in the first year was negative. In the second and third year, net returns in GR and BR were positive and comparable to NC. There were no differences in soybean yield and net returns between rye CC rolled green (GR) and rye CC desiccated (BR) prior to planting. These results show that a rye CC–based soybean conservation production system could be an economically a viable choice after the first year with an invaluable potential for carbon sequestration, weed suppression and positive impact on summer soybean productivity.
Introduction
Winter cover crop (CC) rotations with summer main cash crops can help in enhancing soil physicochemical and biological properties pertaining to soil health, suppress weeds, reduce soil erosion and nutrients loss through surface runoff and leaching, and foster beneficial insects and nutrient scavenging in agriculture (Ryan et al., 2011; Reberg-Horton et al., 2012; Lal, 2015; Abdalla et al., 2019; Jian et al., 2020; Qin et al., 2021). Crop management practices like no-till or reduced tillage along with CC cultivation are expected to reduce labor costs, and potentially lower external chemical and water inputs (Leuthold et al., 2021). These ecological benefits can be achieved when the CC grows for longer periods during the winter fallow period to accumulate higher biomass resulting in larger residues on the soil surface before the summer cash crop is planted. However, the CC might also cause competition for nutrients and water and reduce cash crop yield (Noland et al., 2018). A global meta-analysis of data from 106 studies in various soils and climates across the globe revealed that planting non-legume CC could significantly decrease cash crop yield by competing for water and nutrients especially N availability in early growth stages of the following cash crops (Abdalla et al., 2019). Studies in the Midwest U.S.A., on the benefits of CC on the productivity of the maize (Zea mays L.)-soybean (Glycine max L.) rotation system reported large uncertainties, specifically across different soils, climate conditions, and soil-water management practices (Qin et al., 2021).
In Mississippi, soybean is the most widely grown crop with an acreage of 0.91 M ha, and a production of about 3.2 M Mg in 2021 (USDA-NASS, 2022). However, the adoption of winter CC in this region is low, leaving the soil exposed to heavy winter-spring rains, leading to heavy nutrient loss, mostly through surface runoff and leaching. This, in general, is because most of the growers in this region believe that the winter CC interferes with farm operations and can result in delayed planting of summer cash crops, which may ultimately result in lower economic yields. Furthermore, lack cost-benefit analysis of growing CC in regards to natural resources conservation and management could be another reason for the non-adoption of CC by growers (Myers and Watts, 2015; Basche and Roesch-McNally, 2017). Rye (Secale cereale L.), is the most winter-hardy of all the small grains (Geiger and Miedaner, 2009), and it is the most widely-used CC due to its potential for high biomass accumulation, ease of establishment, overwinter growth, and suppression of weeds. Prior research on CC in Mississippi reported beneficial effects such as weed suppression (Reddy, 2001), enhanced soil health through increased soil carbon, water aggregate stability and bulk density (Adeli et al., 2019). Increased microbial population and enzyme activities associated with nutrient cycling have also been reported (Tyler, 2020). However, these studies also revealed an inconsistent effect of the winter rye crop on the summer cash crop. For example, about 21% grain yield reduction of soybean was observed when rye was the CC in a two-year study (Reddy, 2001) and a 6% reduction in one year and in another year yield levels were similar (Tyler, 2020) at Stoneville. A three-year study on cotton found CC enhanced lint yield by 6.5% (Adeli et al., 2019). However, the information on the effects of rye residues on soybean crop stand establishment, phenological growth stages, canopy development, photosynthesis and other yield contributing traits, and net returns is lacking. Hence, a three-year field experiment was conducted (2018-2021) to evaluate rye CC for it’s biomass production potential, and it impact on soybean productivity, weed suppression and soybean photosynthesis on a silt loam soil in the lower Mississippi delta region. Furthermore, we hypothesized that rolling the rye CC green at planting followed by planting soybean and desiccation by paraquat will affect soybean productivity compared with rye CC desiccation a week prior to planting followed by rolling at planting of soybean.
Materials and methods
Study location and experimental design
The field study was conducted from fall 2018 to fall 2021 on a Dundee silt loam (fine silty, mixed, active, thermic Aeric Ochraqualf) at the USDA-ARS, Crop Production Systems Research Unit’s farm located in Stoneville, Mississippi, USA (33° 42′ N, 90° 55′ W). The soil (top 30 cm) in the experimental field was sampled (2 samples per plot) and characterized at the beginning of the season: pH: 6.71, organic matter: 1.21%, nitrogen: 0.08%, CEC: 16.5 cmolc kg-1, bulk density: 1.29 Mg m-3 and soil textural fractions of 27.5% sand, 54.6% silt and 17.2% clay. The field saturated hydraulic conductivity, measured using a Saturo infiltrometer using the appropriate protocol (METER Group, Inc. USA), ranged between 0.86 and 1.31 cm hr-1.
The site was managed with no-tillage. The randomized complete block experiment was established in the fall of 2018. The study included six replicates of three treatments: i) no cover crop (NC), ii) rye was rolled green with a rear mounted Dickey-Vator bedder roller (DickeyVator LLC, AR, USA) on a John Deere 5300 tractor at planting and desiccated with paraquat after soybean planting (GR), and iii) rye desiccated initially with paraquat a week prior to planting and rolled with a Dickey-Vator bedder roller (DickeyVator LLC, AR, USA) before soybean planting (BR). Rolling was done as standing cover crop residue is more susceptible to wrapping around coulters, shanks or disks, which may hinder field operations.
Trial management
The rye CC was planted on October 17 in 2018, November 06 in 2019, and October 27 in 2020. About 112 kg seeds ha-1 were planted using a John Deere 750 seed drill at 2 cm depth in rows spaced 0.19 m apart. Each plot was 24.4 m long and 16.3 m wide (16 rows for soybean and 86 for rye). The herbicide paraquat (1,1’-dimethyl-4,4’-bipyridinium dichloride) was applied at 1.12 kg ai ha–1 using a tractor-mounted sprayer in NC plots and BR plots one week before soybean planting, while the GR plots were applied on the day of soybean planting. The CC desiccation dates are: April 24, 2019, April 28, 2020 and May 7, 2021. Soybean seeds were planted using an Almaco Cone Plot planter (Allen Machine Company, Nevada, IA) to achieve an overall plant population of approximately 336,000 plants ha-1. Plots were maintained weed-free using post-emergence herbicide programs (Pinnamaneni et al., 2020b). Both the GR and BR plots were planted at 4 cm depth while NC plots were planted at 2.5 cm depth as the rye residue cover is preventing planting at lower depths in CC plots. Soybean was planted on May 8 in 2019, May 11 in 2020, and May 14 in 2021. AquaSpy soil moisture probes with 12 sensors spaced at 10 cm intervals across 120 cm in length to monitor soil water content (AquaSpy Inc, San Diego, CA) were installed in selected representative plots. The probes were set up to record sensor readings every 15 minutes and periodically upload them to the manufacturer’s website (https://agspy.aquaspy.com) via telemetry. Irrigations were scheduled based on a soil matrix potential of about -90 kPa at 45 cm soil depths, as described by Plumblee et al. (2019). The irrigation water applied in each plot was measured using a flow meter (Mc Propeller flowmeter, McCrometer, CA). In 2019, a total of 53 mm of water was applied on August 1 and August 21; in 2020, a total of 59.5 mm of irrigation water was applied on July 21 and August 11; and in 2021, a total of 59 mm of water was applied on July 14 and August 17 (Figure 1). Irrigation was stopped at the R6 growth stage in all three years. Weather data were collected from a weather station located within 1.6 km from the experiment plots (- 33.43122°N, -90.91077°S, Delta Research and Extension Center, Stoneville, MS). Differences in weather parameters during the three cropping seasons in 2019-2021 were observed (Figures 1, 2). The precipitation during the vegetative phase (May-June) was 417, 163, and 189 mm, while the reproductive growth and pod development period (July-September) was 196, 240, and 314 mm in 2019, 2020 and 2021, respectively. The average temperatures were 27.8, 27.5, and 26.9°C. The mean solar radiation during the reproductive phase was 21.74, 21.14, and 20.75 MJ m-2 day-1. The computed GDD were 1173, 1219 and 1258 in 2019, 2020 and 2021, respectively. Though the growing season in 2019 received 12.1% more rainfall than the 2020 and 2021 seasons, the rainfall received during the soybean reproductive period (July-August) coincided with periods of lower rainfall, that is, 22.5% and 30.8% lower than rainfall received during the crop seasons in 2020 and 2021, respectively. Lower air temperatures, as reflected in computed seasonal mean minimum and maximum air temperatures were also observed in 2019. Both the lower-than-normal crop season rainfall and lower than optimum air temperature for crop growth probably contributed to the lower soybean productivity in 2019. Growing degree days (GDD) were calculated using a base temperature (T base) of 10°C, as detailed in Pinnamaneni et al., (2020a).
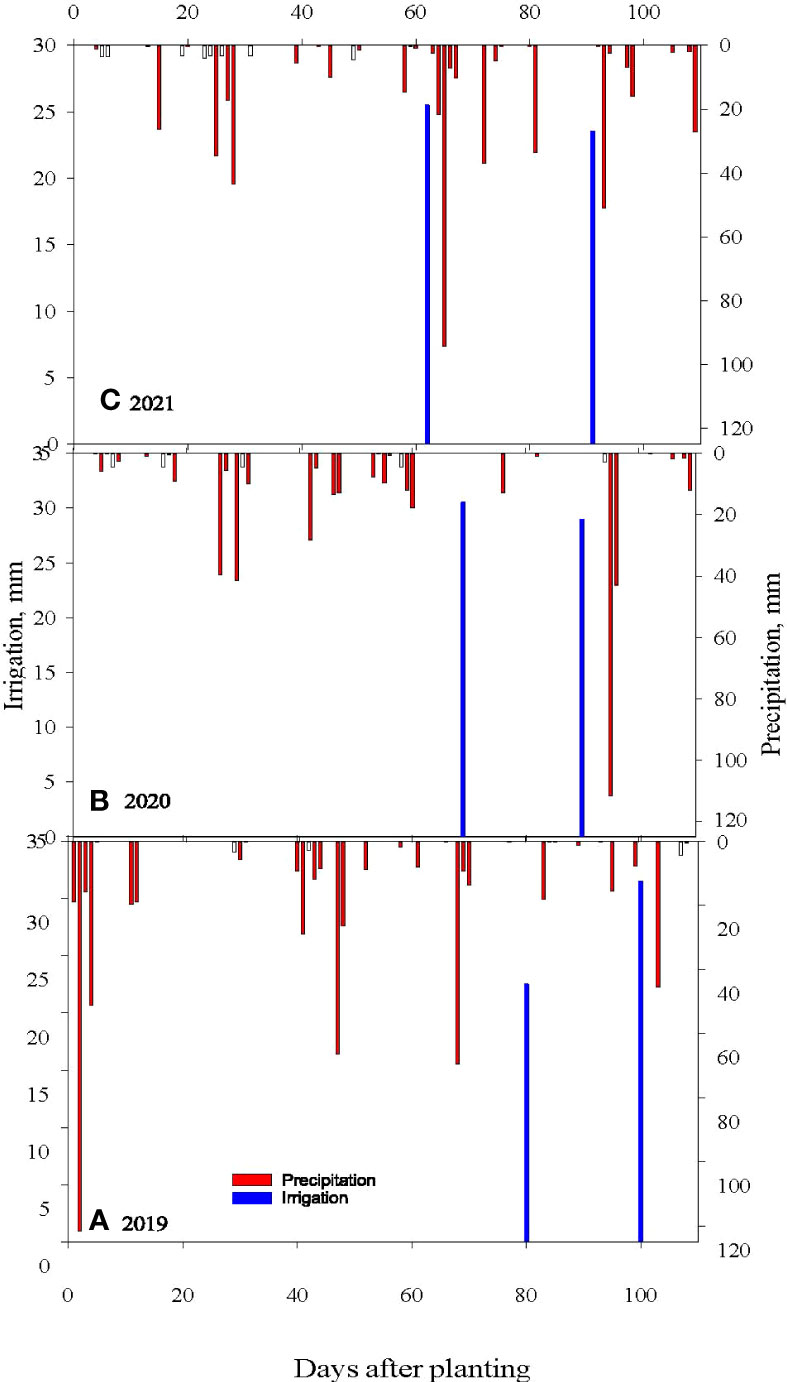
Figure 1 Measured daily precipitation and irrigation for (A) 2019, (B) 2020 and (C) 2021 soybean growing seasons at Stoneville, MS.
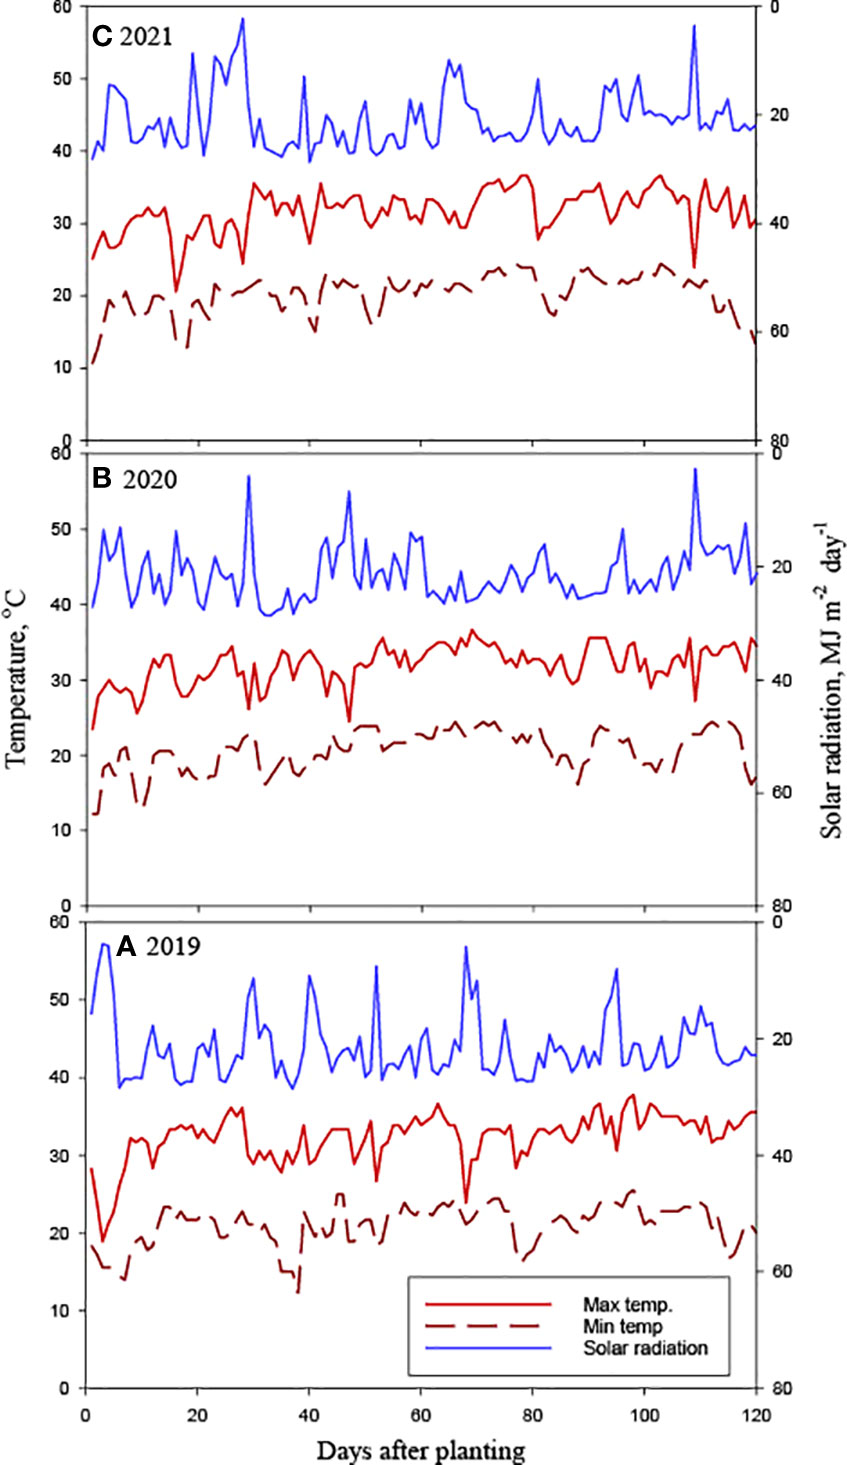
Figure 2 Measured daily maximum and minimum air temperature and daily solar radiation for (A) 2019, (B) 2020 and (C) 2021 soybean growing seasons at Stoneville, MS.
The observed duration of phenological events across the seasons did not vary much as the difference in crop duration (from plant emergence to physiological maturity) among the three seasons was only four calendar days, and the computed differences in GDD was only 43°C.
Biomass data
The biomass (rye and natural vegetation) was collected in 1 m2 quadrats at two random locations in each plot before desiccation. The collected biomass was dried at 60°C in a forced-air oven till constant weight was recorded. The plant residues were collected in the same way 4 weeks after soybean planting (WAP) and 8 WAP. Weeds germinated in 1 m2 quadrants were harvested to ground level at two random locations, duly avoiding border rows in the GR, BR NC plots at 4 WAP and 8 WAP. Weed biomass also was dried at 60°C in a forced-air oven till constant weight was recorded. The grain yields were determined by harvesting the center six rows of each plot (141.3 m2) with a Massey 8XP 2 row plot combine with Harvest Master weighing system and grain moisture analyzer on September 26, October 2 and September 27 in 2019, 2020 and 2021, respectively, and adjusted for moisture content at 13%.
Crop growth data
An LP-80 LAI Ceptometer (Decagon Devices, Inc., Pullman, WA, USA) was used to measure leaf area index (LAI) on non-cloudy days using the methodology described by Pinnamaneni et al., (2021a). Soybean crop height was measured and used as a proxy for estimating crop growth - average crop height was determined from 10 random plants in the center rows of each plot, at the R8 growth stage in September. At the physiological maturity growth stage (R8), soybean plants were harvested at ground level from random 1 m2 quadrants of each plot, avoiding the row ends for yield component-traits analysis. The number of pod-bearing nodes, pods per node, and grains per pod were counted. The harvested plants were dried for a week in the greenhouse and threshed using Almaco soybean thresher to collect grain and biomass yield, and 100-seed weight. Harvest index was as the ratio of grain yield to total biomass (including grain). as described in the earlier report (Pinnamaneni et al., 2021).
Photosynthetic light response curves
The data on soybean photosynthetic response to light levels were measured using an LI-6800 photosynthesis measurement system (LI-COR Biosciences, Lincoln, NE). Carbon dioxide (CO2) concentration inside the open-flow gas exchange chamber was maintained at 400 ppm with a constant air flow rate of 500 ml min−1. Relative humidity in the chamber was maintained between 55 and 65%. The leaf temperature was set at 28°C, and the minimum measurement waiting time was 60 s. The photosynthetic photon flux densities (PPFD) of light inputs for the LRC measurements ranged from 0 to 2000 mmol m2 s–1. Measurements were on fully expanded terminal leaves on 3 randomly selected plants per plot at V6 and R5 stages. The leaves were allowed to adapt to each light level for 10 min before measurement. The LI 6800 outputs of maximum photosynthetic rate at light saturation (Amax) [μmol CO2 m−2 s−1], quantum yield (Φ) [μmol CO2 μmol−1 (photons)], and dark respiration rate (Rd) [μmol CO2 m−2s−1] calculated by considering PPFD as independent variable following Hanson et al. (1987) were used in the analysis.
Net returns
The year-wise total estimated cost of production of soybean was determined using Mississippi State University, Department of Agricultural Economics’ soybean budget estimates (Department of Agricultural Economics, 2019; Department of Agricultural Economics, 2020; Department of Agricultural Economics, 2021), excluding cost for land. The production cost for CC includes costs for rye seed (cv. Elbon), planting, and paraquat SL 2.0 + surfactant spray, which comes to $153, $160, and $147 ha-1 in 2019, 2020 and 2021, respectively. It also involves cost towards deeper planting of soybean seeds in rye CC plots in 2020 and 2021. The market prices of soybean were taken from the crop values published on the website of the USDA-NASS Mississippi Field Office (USDA-NASS, 2022). The growers realized soybean prices were 323.34 USD Mg-1 in 2019, 374.78 USD Mg-1 in 2020 and 466.65 USD Mg-1 in 2021).
Statistical analysis
The analysis of variance (ANOVA) for agronomic variables and yield components was performed using JMP Pro v. 15.1.0 software (SAS Institute, Cary, NC) following the PROC MIXED model. Year, cover crop treatments, and interactions were considered fixed effects, and replicates within a year were considered as random effects. Fisher’s Protected LSD test was used for mean comparisons at P≤ 0.05. Sigma plot v 14.0 (Systat USA) was used to construct graphs.
Results
Phenology
Differences were observed for days for occurrences of different phenological stages from emergence (VE) to physiological maturity (R8) during three crop seasons (2019-2021) (Table 1). The days to maturity were 108, 109 and 112 in 2019, 2020 and 2021, respectively. The required GDD for reaching R8 stages were noticeably close to each other, viz., 1769, 1723 and 1761. However, we did not notice any measurable differences in phenological events among the NC, BR, and GR treatments in the same season.
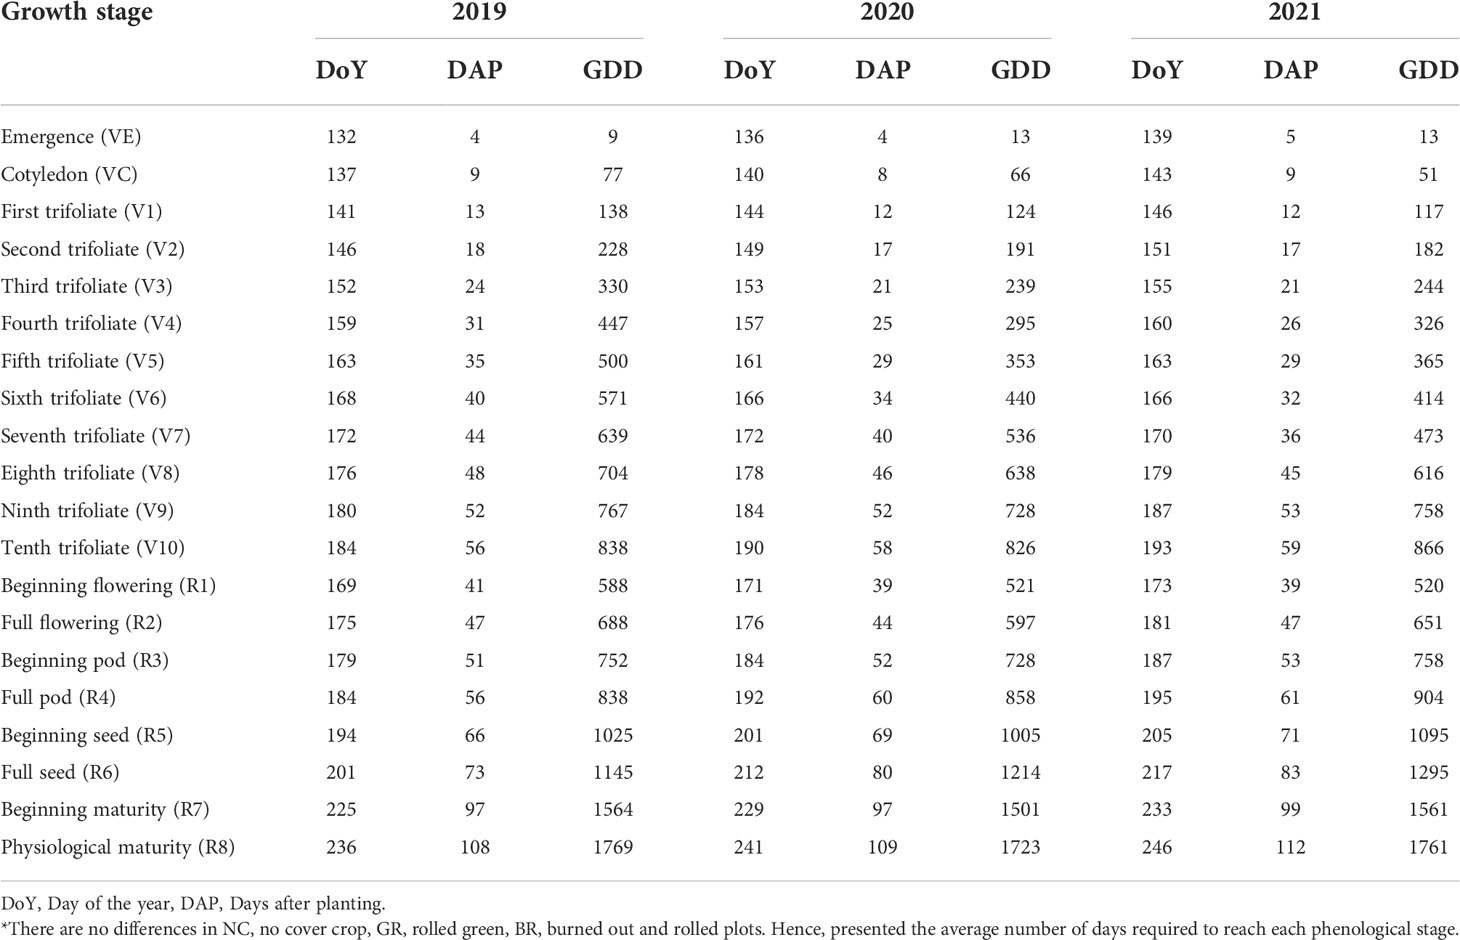
Table 1 Visually observed soybean phenology* and growing degree days (GDD) during 2019, 2020 and 2021 crop seasons at Stoneville, Mississippi.
Leaf area index
We measured soybean LAI at different growth stages throughout the growing season. The measured LAI was similar among the treatments from about V1 to V5 growth stages of the crop in all three seasons. However, in 2019, LAI in NC plots recorded were significantly higher from the V6/R1 stage onwards till R6 stage. Nonetheless, such differences in LAI between the different stages were not observed in the BR and GR treatments (Figure 3). In 2020, GR plots consistently recorded higher LAI than NC. The highest LAI measured in GR plots was from about leafful flowering stage (R2) until the full pod phase (R4) of the crop, and in BR plots highest LAI was observed during the R3- R5 stages. In 2021, BR plots recorded higher LAI during R4 to R5 stages.
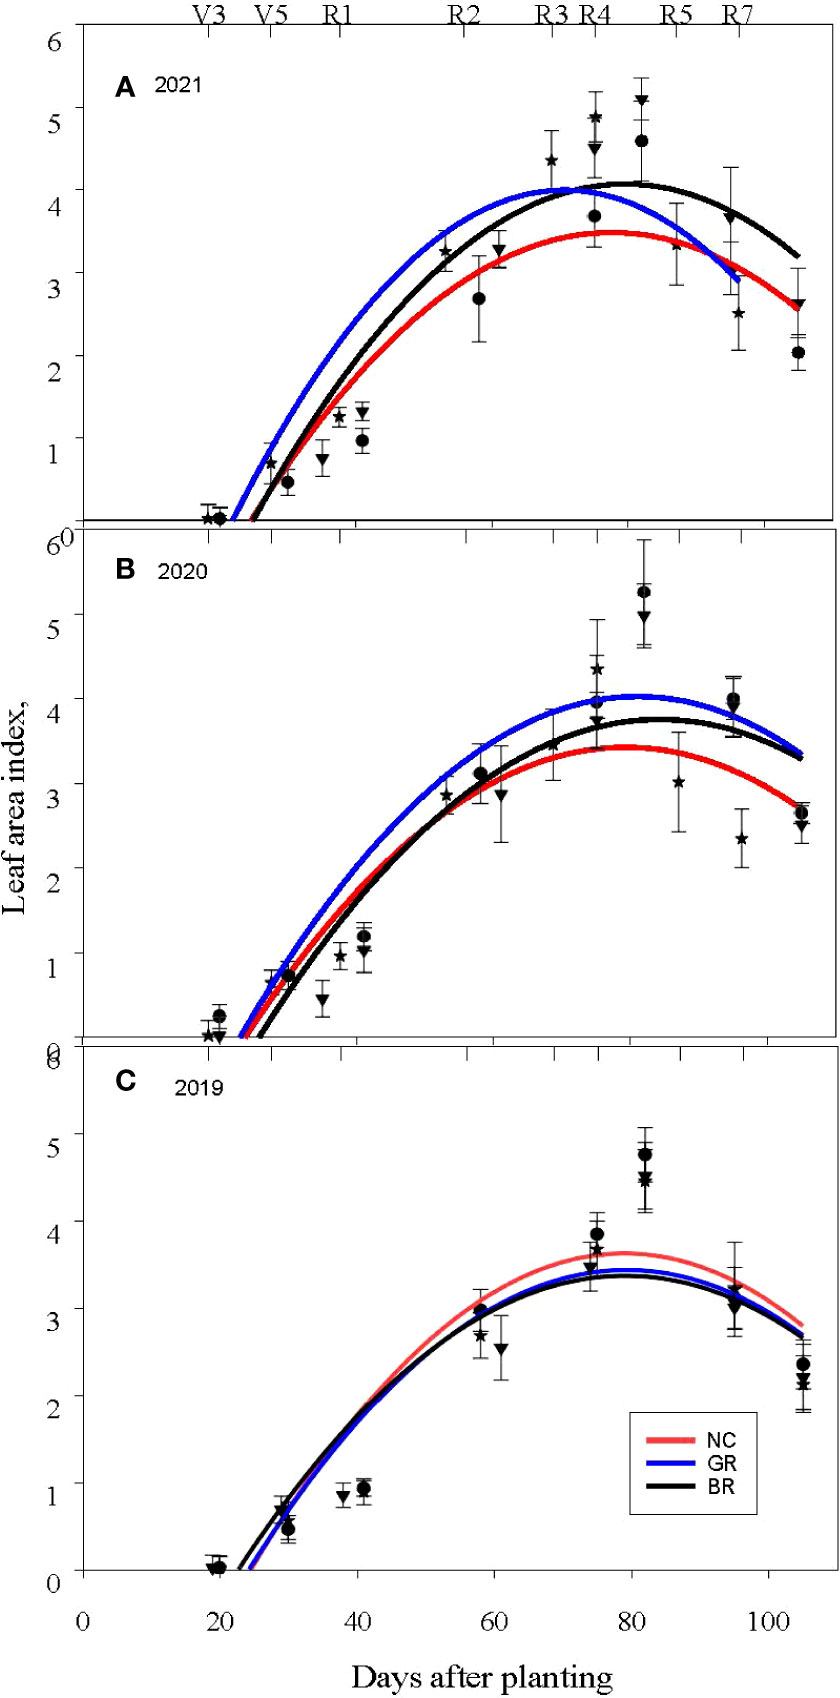
Figure 3 Soybean leaf area index measured in the (A) 2019, (B) 2020 and (C) 2021 growing seasons (NC- no cover crop; GR-rolled green; and BR- burned out and rolled) at Stoneville, MS. Error bars represent one standard deviation from the plotted mean LAI values.
Light response curves
The measured LRC exhibited a significantly higher CO2 assimilation rate around the R5 stage than the V6 stage in all the treatments and across the seasons and reached a plateau in response to PPFD between 1300-1500 μmol m−2 s−1 (Figure 4). The derived parameters from the LRC, that are, Amax, Φ and Rd, exhibited significant differences across NC, GR and BR treatments (Table 2). In all the seasons and treatments, Amax was higher in the R5 than the V6 stage in two CC treatments, with increases ranging from 17.6% (GR in 2021) to 30% (BR in 2020). Measured Φ values were higher by 2% (GR in 2021) to 45% (GR in 2020), while a reduction of 14.3% was observed for NC plots of 2021. The Rd increased between 2.5% (BR in 2019) and 15.6% (GR in 2019), while NC and GR plots were reduced by 1 to 2.5% in the 2021 season.
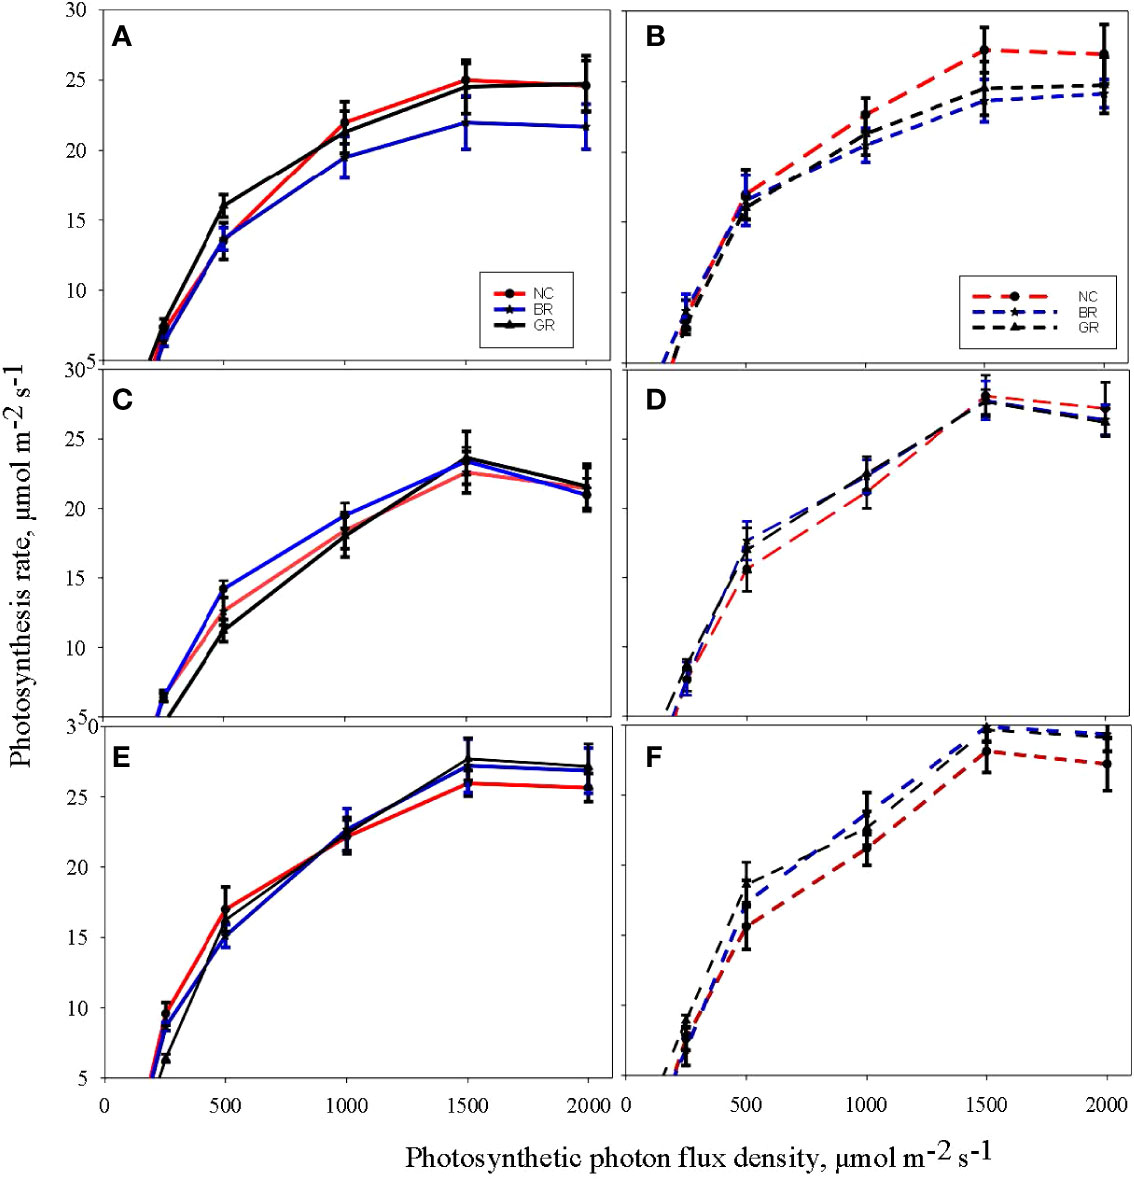
Figure 4 Light response curves of soybean measured at the sixth leaf (V6) stage (A, C, E) and beginning seed set (R5) stage (B, D, F) during the crop growing seasons in 2019 (A, B), 2020 (C, D) and 2021 (E, F) at treatments (NC - no cover crop; GR-rolled green and BR- burned out and rolled).
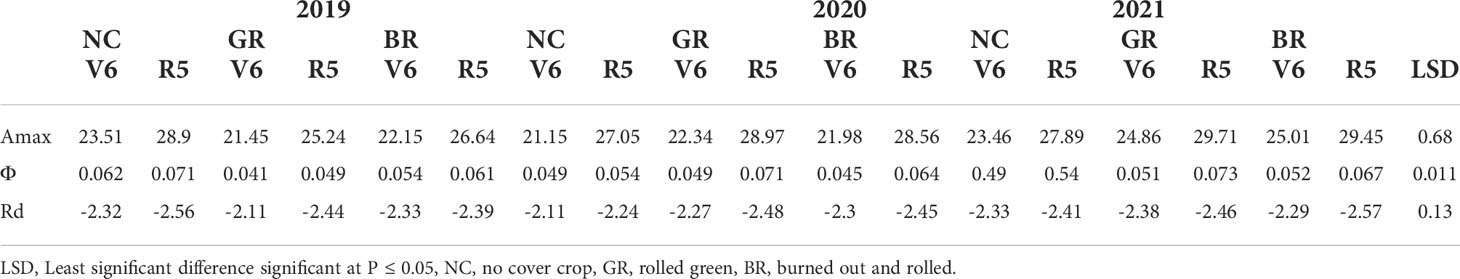
Table 2 Influence of cover crop treatments on maximal photosynthetic rate (Amax), apparent quantum efficiency (Φ), and dark respiration rate (Rd) in sixth leaf stage (V6) and beginning seed set stage (R5) in soybean during the crop seasons 2019, 2020, and 2021.
CC residues and weed biomass
The rye CC produced biomass between 4.62 and 5.43 Mg ha-1, which are significantly higher than the biomass, between 1.55 and 1.98 Mg ha-1, produced by the natural vegetation in the NC plots (Table 3). The biomass produced by the rye CC also varied significantly amongst the years, which are, 5.37, 4.85 and 4.76 Mg ha-1 in 2019, 2020 and 2021, respectively. The reduction of rye CC biomass amongst the treatments across the seasons due to decomposition, with time, was significant at four WAP, ranging between 3 and 15%; however, the biomass decay rate apparently increased with time as reflected by the higher decomposition rate measured at eight WAP (Table 4). The undecayed residue ranged between 29% under NC in 2019 to 53% under GR in 2019, indicating the paraquat desiccated natural vegetation decays at a higher rate than the desiccated rye biomass.
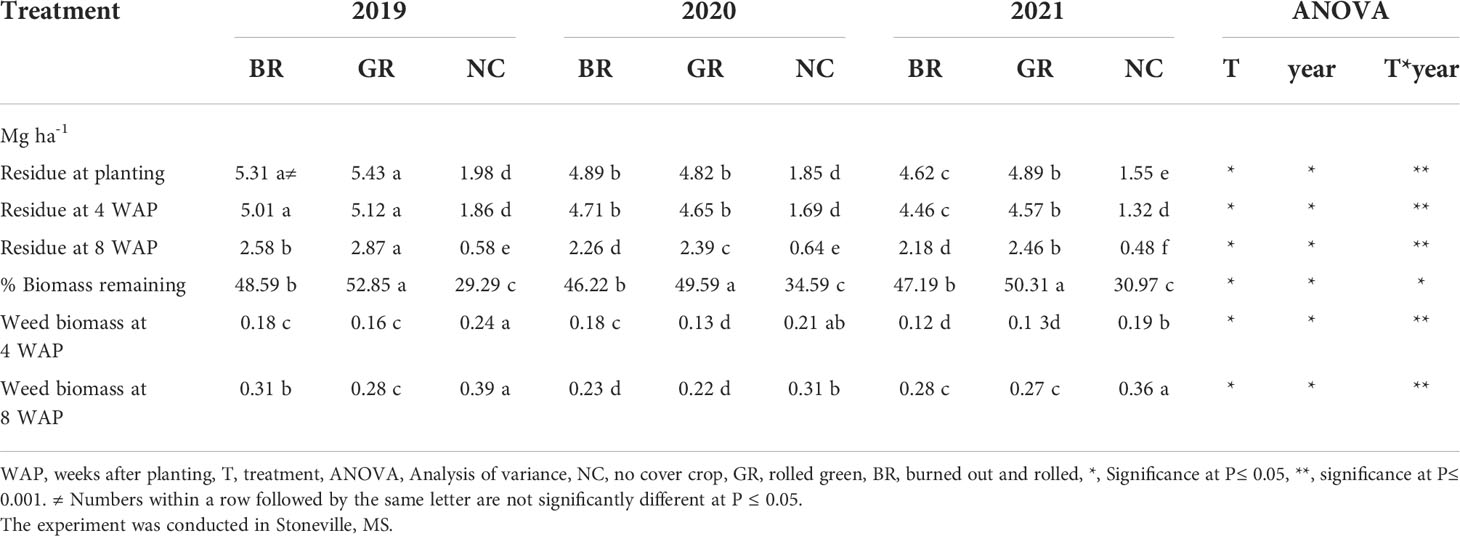
Table 3 Effect of rye cover crop treatments on cover crop residue and weed biomass in 2019, 2020 and 2021.
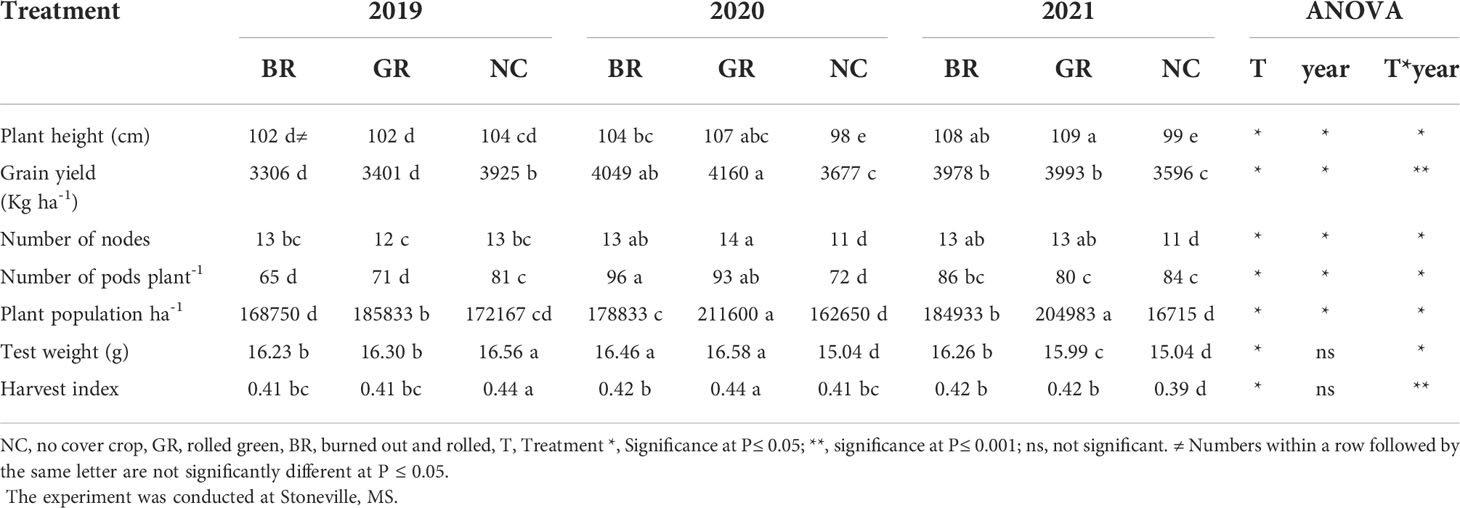
Table 4 Effect of rye cover crop on soybean grain yield and associated parameters in 2019, 2020 and 2021.
Weed growth was observed in all the treatments despite the postemergence herbicide programs. Although the amount of weed biomass is small relative to the rye CC residue, the dried weed biomass did vary substantially, ranging from 0.12-0.24 Mg ha-1 at four WAP and 0.22-0.36 Mg ha-1 at eight WAP (Table 3). Across the three seasons, the weed biomass was consistently and significantly higher in NC plots than those measured in BR or GR plots. Except for the 2020 season at four WAP, the GR and BR plots have recorded similar weed biomass levels, however significantly lower weed biomass over NC plots. The weed biomass was 72% higher at eight WAP (0.29 Mg ha-1) than that of four WAP (0.17 Mg ha-1).
Yield and yield attributes
In BR and GR treatments, the measured plant growth traits were significantly different within and across seasons (Table 4). Plant heights ranged from 98 to 109 cm and soybean height in CC plots was higher than NC plots except for 2019 crop season. The range for the number of nodes per plant was between 11 and 14, while the number of pods per plant varied from 65 to 96. In the case of established soybean stand, the range was between 162,650 and 211,600 plants per ha. The GR has consistently recorded a higher population than the NC plots by 8%, 30%, and 23% in 2019, 2020 and 2021, respectively. The 100-grain weight ranged from 15.04 g to 16.58 g and except for 2019, the BR and GR plots recorded higher 100-grain weight by 0.2% to 10.6% over the NC plots. The harvest index ranged from 0.39 to 0.44 and the treatment and year interaction were significant. The grain yield ranged from 3306 to 3925 kg ha-1, from 3677 to 4160 kg ha-1 and from 3596 to 3993 kg ha-1 in 2019, 2020 and 2021, respectively, among treatments. The yields from soybean grown in NC plots was 13% higher than GR and 16% higher than BR in the 2019 season, while in the 2020 and 2021 seasons, the BR and GR plots recorded 10% to 13% higher grain yield over the NC plots. However, no differences among the treatments were observed for number of pods per node and number of seeds per pod in the three years.
Net returns
A summary of production costs, grain revenue based on the prevailing market prices, and profit estimates are presented in Table 5. The fluctuation in year-to-year soybean price led to a profit scenario in all the treatment combinations in 2021 as the soybean prices increased by 44% to 466 USD Mg-1 from 323 USD Mg-1 in 2019. The CC production cost declined due to a reduction in rye seed cost and paraquat price and it ranged from 147 USD in 2021 to 160 in 2020. The total production costs varied between 1152 to 1489 USD ha-1. The net returns from NC plots were positive in 2019, while GR and BR were negative for that year. However, GR plots gave 21 USD (43%) additional returns per ha over NC plots in 2020 while the highest profit of 38 USD (7%) was realized in GR plots over NC plots in 2021 season.
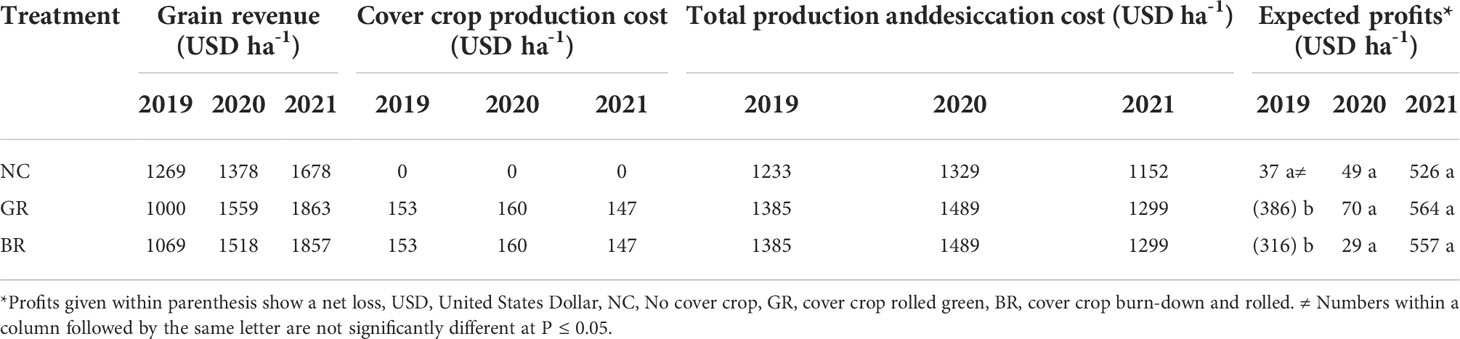
Table 5 Effects of rye cover crop on soybean profitability in 2019, 2020 and 2021 seasons at Stoneville, MS.
Discussion
Prior studies on CC in Mississippi demonstrated that CC provided better weed suppression, soil physical properties, and microbial biomass and enzyme activities (phosphatase, β-glucosidase, N-acetylglucosaminidase, and fluorescein diacetate hydrolysis) in soybean ecosystems (Tyler, 2020). Synergistic interactions between reduced till or no-till soil management and winter CC were observed (Tyler, 2021). The current study primarily focused on how rye CC termination at the late reproductive phase affects the summer cash crop, soybean- agronomy, yield attributes, photosynthesis, and net returns. Further, we attempted to understand the rye CC residue deterioration and weed biomass production over time. The weed biomass was quantified as it gives the quantitative effect of weed growth despite adhering to the standard postemergence weed control program, assuming weed biomass is directly proportional to crop-weed competition as detailed in another study (Reddy, 2001).
Higher LAI was observed during the full pod (R4) and full seed (R6) stages. Similar observations of the highest LAI during the reproductive phase was reported earlier by Pinnamaneni et al. (2020b; 2021) in soybean and by Zhang et al. (Zhang et al., 2014) in cotton, which probably resulted in higher radiation interception and CO2 assimilation. The higher grain yields of NC soybean in 2019 and GR soybean in 2020 and 2021 corresponded with the observed higher LAI in those plots. Similarly, the rate of rye CC residue or desiccated winter weed biomass decay depends on several factors such as the physical and chemical composition of the residue, weather, soil microbe dynamics, and soil-water-crop management. The residue may interfere with heat and water transfer between soil and air by acting as an insulator for direct heating of soil by the sun and its further entry into the soil, thus influencing both weed and crop growth. This differential water and heat dynamics due to crop or weed residue on the soil surface apparently caused the differential decay of natural vegetation and CC residue under no-till conditions in the three seasons, in which, rye residue remaining on the soil surface was between 46% to 53%, while the residue from natural vegetation remaining was only between 29% and 35%. This observation corroborates with the report of Reddy (2001), who showed greater persistence of rye residues on the soil surfaces when CC was desiccated 2-3 weeks prior soybean planting, with 67% of rye biomass remaining nine weeks after soybean planting in the Mississippi Delta. Furthermore, it can be noted that CC residues in tilled conditions degrade faster due to better contact with soil microbes than under no-till, where these residues sit on the soil surface for longer periods and act as a mulch. (Krueger et al., 2011; Lal, 2015; Basche et al., 2016; Basche and Roesch-McNally, 2017; Tyler, 2020). The current study revealed the higher photosynthetic rates and quantum efficiency in CC plots (BR and GR) in the 2020 and 2021, while soybean in NC plots has recorded higher values for the said parameters. It is not clear what has contributed to these differences. However, a two-year study in Poland revealed that the photosynthesis rate in spring wheat after the CC yellow lupine (Lupinus luteus L.) and field pea (Pisum sativum L.) increased under conventional till while there was no difference under no-till conditions (Niewiadomska et al., 2020). The same study reported differential response to CC in spring wheat for transpiration, stomatal conductance, and internal CO2 concentration.
The plant stand at physiological maturity was consistently higher in CC plots in 2020 and 2021 years, but it was lower than GR plots only in the first year of study (2019). In the second and third years (2020 and 2021), the plant stand established in the GR plots were significantly higher than the NC plots, probably due to better weed suppression and moisture conservation, contrary to the observations of Acharya et al. (2019) who reported 25-33% height increase in conventional till than no till in Louisiana but no impact of CC on soybean height. This observation contrasts with the reported allelopathic effects of rye on following cash crop yield reduction due to reduced plant stand (Kessavalou and Walters, 1999), but conforms with the report of enhanced microbial activity under winter rye CC (Tyler, 2020). Few studies reported that rye CC termination at its reproductive stages will reduce its root’s allelopathic effects on summer cash crops (Teasdale et al., 2012; Vollmer et al., 2020). In this study, winter rye CC was terminated in late spring when it was in the post-flowering stage, close to physiological maturity which probably avoided any allelopathic effect, if any on following summer soybean. The increased plant stand (reflection on the absence of any allelopathic affect from the terminated rye CC), higher 100-seed weight, a greater number of pods per plant, and higher harvest index apart from reduced crop-weed competition in plots (BR and GR) in 2020 and 2021 has probably contributed to enhanced grain yields in soybean under the no-till conditions of our study, contrary to the earlier reports by, for example, Reddy (2001); Tyler (2020) but conforms with increased soybean yields reported by some other studies (Moore et al., 1994; Mischler et al., 2010; Moore et al., 2014). It is relevant here to note that Adeli et al. (2019) reported 6.5% higher cotton lint yield from a cotton-rye rotation experiment in the humid climate of Mississippi. The net returns due to cover cropping in the first year of this study were negative in both BR and GR plots: the BR plots returned 20 USD lower than the NC plots. However, in the second year of the study, the GR plots returned profits of about 21 USD over the NC plots. Nonetheless, due to increased soybean prices in 2021, the net returns in all the treatments were very high and the difference among the treatments was insignificant.
This study demonstrated that in conservation agriculture with no-till and CC soil management in soybean cropping systems, the cash crop yields are not compromised in second- and third-year while suppressing weeds. Studies elsewhere also demonstrated the benefits of no-till farming with CC in preventing soil erosion and runoff (Krueger et al., 2011; Moore et al., 2014). Our study further demonstrated that farmers could have a flexible approach of desiccating the CC either before or after soybean planting. This model can be scaled up in Mississippi Delta with producers’ involvement for large scale studies to develop a holistic strategy of conservation agriculture. Further, it is worthwhile to explore studies with diverse CCs like winter wheat, oat, canola, hairy vetch, Austrian winter peas, penny cress and crimson clover etc. with not only soybean but also with other summer cash crops like corn and cotton.
Conclusions
A winter rye – summer soybean CC rotation system in a humid climate gave mixed results in this three-year study. In two out of three years, the summer cash crop-soybean recorded higher productivity when grown after rye CC due to increased plant stand, better weed suppression, higher number of pods per plant, and increased seed weight. Growing rye CC (GR and BR) was not economical in first year and net returns were comparable in second and third year compared to NC. The present study demonstrated that rye CC followed by summer soybean cash crop is agronomically and economically feasible from the second year of initiation of this system albeit with challenges like need for deep planting of soybean seeds in summer due to a thick layer of rye residue on soil surface and additional effort in irrigation as residue is blocking free gravity flow of irrigation water particularly during first irrigation. We also propose that the focus should move beyond the short term localized studies to large scale and long term studies involving CC and no-till practices to harness agro-ecological benefits of conservation agriculture in Mississippi Delta.
Data availability statement
The raw data supporting the conclusions of this article will be made available by the authors, without undue reservation.
Author contributions
SP, data curation, software, investigation, methodology, visualization, formal analysis, and writing—original draft preparation; SA, funding acquisition, project administration, visualization, and writing—review and editing; MW, conceptualization, and writing—review and editing; KR, conceptualization, resources, supervision, and writing—review and editing. All authors contributed to the article and approved the submitted version.
Funding
This work was supported by the U. S. Department of Agriculture. Agriculture Research Service through project number 6066-22000-089-000D.
Author disclaimer
Trade names are necessary to report factually on available data; however, the USDA neither guarantees nor warrants the standard of the product or service. The use of the name by USDA implies no approval of the product or service to exclude others that may also be suitable.
Conflict of interest
The authors declare that the research was conducted in the absence of any commercial or financial relationships that could be construed as a potential conflict of interest.
Publisher’s note
All claims expressed in this article are solely those of the authors and do not necessarily represent those of their affiliated organizations, or those of the publisher, the editors and the reviewers. Any product that may be evaluated in this article, or claim that may be made by its manufacturer, is not guaranteed or endorsed by the publisher.
Acknowledgments
The authors appreciate the technical assistance provided by Mr. Russell Coleman and Mr. Efren Ford, Agricultural Science Research Technicians, Stoneville, MS. The authors thank Dr. Quentin D. Read, Area Statistician Southeast Area for help in statistical analysis.
References
Abdalla M., Hastings A., Cheng K., Yue Q., Chadwick D., Espenberg M., et al. (2019). A critical review of the impacts of cover crops on nitrogen leaching, net greenhouse gas balance and crop productivity. Global Change Biol. 25, 2530–2543. doi: 10.1111/gcb.14644
Acharya B. S., Dodla S., Gaston L. A., Darapuneni M., Wang J. J., Sepat S., et al. (2019). Winter cover crops effect on soil moisture and soybean growth and yield under different tillage systems. Soil Tillage Res. 195, 104430. doi: 10.1016/J.STILL.2019.104430
Adeli A., Brooks J. P., Read J. J., Shankle M. W., Feng G., Jenkins J. N. (2019). Poultry litter and cover crop integration into no-till cotton on upland soil. Agron. J. 111, 2097–2107. doi: 10.2134/agronj2018.05.0328
Basche A. D., Kaspar T. C., Archontoulis S. V., Jaynes D. B., Sauer T. J., Parkin T. B., et al. (2016). Soil water improvements with the long-term use of a winter rye cover crop. Agric. Water Manage. 172, 40–50. doi: 10.1016/j.agwat.2016.04.006
Basche A. D., Roesch-McNally G. E. (2017). Research topics to scale up cover crop use: Reflections from innovative Iowa farmers. J. Soil Water Conserv. 72, 59A–63A. doi: 10.2489/jswc.72.3.59A
Department of Agricultural Economics, M. S. U. B. . 02 2020 P (2021). Soybeans 2021 planning budgets.
Department of Agricultural Economics, M. S. U. B. R.-02 P. 2019 P (2020). Soybeans 2020 planning budgets. Available at: https://www.agecon.msstate.edu/whatwedo/budgets/archive.php.
Department of Agricultural Economics, M. S. U. B. R.-02 P. 2020 P (2019). Soybeans 2019 planning budgets. Available at: https://www.agecon.msstate.edu/whatwedo/budgets/archive.php.
Desclaux D., Roumet P. (1996). Impact of drought stress on the phenology of two soybean (Glycine max l. merr) cultivars. Field Crops Res. 46, 61–70. doi: 10.1016/0378-4290(95)00086-0. Available at: https://www.agecon.msstate.edu/whatwedo/budgets/archive.php.
Hanson P. H., McRoberts R. E., Isebrands J. G., Dixon R. K. (1987). Determining CO2 exchange rate as a function of photosynthetic photon flux density. Photosynthetica 21, 98–101.
Jian J., Du X., Stewart R. D. (2020). Quantifying cover crop effects on soil health and productivity. Data Brief 29, 105376. doi: 10.1016/j.dib.2020.105376
Kessavalou A., Walters D. T. (1999). Winter rye cover crop following soybean under conservation tillage: Residual soil nitrate. Agron. J. 91, 643–649. doi: 10.2134/agronj1999.914643x
Krueger E. S., Ochsner T. E., Porter P. M., Baker J. M. (2011). Winter rye cover crop management influences on soil water, soil nitrate, and corn development. Agron. J. 103, 316–323. doi: 10.2134/agronj2010.0327
Lal R. (2015). Soil carbon sequestration and aggregation by cover cropping. J. Soil Water Conserv. 70, 329–339. doi: 10.2489/jswc.70.6.329
Leuthold S. J., Quinn D., Miguez F., Wendroth O., Salmeron M., Poffenbarger H. (2021). Topographic effects on soil microclimate and surface cover crop residue decomposition in rolling cropland. Agricult Ecosyst. Environ. 320, 107609. doi: 10.1016/j.agee.2021.107609
Mischler R. A., Curran W. S., Duiker S. W., Hyde J. A. (2010). Use of a rolled-rye cover crop for weed suppression in no-till soybeans. Weed Technol. 24, 253–261. doi: 10.1614/WT-D-09-00004.1
Moore M. J., Gillespie T. J., Swanton C. J. (1994). Effect of cover crop mulches on weed emergence, weed biomass, and soybean (Glycine max) development. Weed Technol. 8, 512–518. doi: 10.1017/S0890037X00039609
Moore E. B., Wiedenhoeft M. H., Kaspar T. C., Cambardella C. A. (2014). Rye cover crop effects on soil quality in no-till corn silage–soybean cropping systems. Soil Sci. Soc. America J. 78, 968–976. doi: 10.2136/sssaj2013.09.0401
Myers R., Watts C. (2015). Progress and perspectives with cover crops: Interpreting three years of farmer surveys on cover crops. J. Soil Water Conserv. 70, 125A–129A. doi: 10.2489/jswc.70.6.125A
Niewiadomska A., Majchrzak L., Borowiak K., Wolna-Maruwka A., Waraczewska Z., Budka A., et al. (2020). The influence of tillage and cover cropping on soil microbial parameters and spring wheat physiology. Agronomy 10, 200. doi: 10.3390/agronomy10020200
Noland R. L., Wells M. S., Sheaffer C. C., Baker J. M., Martinson K. L., Coulter J. A. (2018). Establishment and function of cover crops interseeded into corn. Crop Sci. 58, 863–873. doi: 10.2135/cropsci2017.06.0375
Pinnamaneni S., Anapalli S. S., Fisher D. K., Reddy K. N. (2020a). Irrigation and planting geometry effects on cotton (Gossypium hirsutum l.) yield and water use. J. Cotton Sci. 24, 87–96.
Pinnamaneni S. R., Anapalli S. S., Fisher D. K., Reddy K. N. (2021). Water use efficiencies of different maturity group soybean cultivars in the humid Mississippi delta. Water 13, 1496. doi: 10.3390/w13111496
Pinnamaneni S. R., Anapalli S. S., Reddy K. N., Fisher D. K., Quintana-Ashwell N. E. (2020b). Assessing irrigation water use efficiency and economy of twin-row soybean in the Mississippi delta. Agron. J. 112, 4219–4231. doi: 10.1002/agj2.20321
Plumblee M. T., Dodds D. M., Krutz L. J., Catchot A. L. Jr., Irby J. T., Jenkins J. N. (2019). Determining the optimum irrigation schedule in furrow irrigated cotton using soil moisture sensors. Crop Forage Turfgrass Manage. 5, 1–6. doi: 10.2134/cftm2018.06.0047
Qin Z., Guan K., Zhou W., Peng B., Villamil M. B., Jin Z., et al. (2021). Assessing the impacts of cover crops on maize and soybean yield in the US Midwestern agroecosystems. Field Crops Res. 273, 108264. doi: 10.1016/j.fcr.2021.108264
Reberg-Horton S. C., Grossman J. M., Kornecki T. S., Meijer A. D., Price A. J., Place G. T., et al. (2012). Utilizing cover crop mulches to reduce tillage in organic systems in the southeastern USA. Renewable Agric. Food Syst. 27, 41–48. doi: 10.1017/S1742170511000469
Reddy K. N. (2001). Effects of cereal and legume cover crop residues on weeds, yield, and net return in soybean (Glycine max). Weed Technol. 15, 660–668. doi: 10.1614/0890-037X(2001)015[0660:EOCALC]2.0.CO;2
Ryan M. R., Curran W. S., Grantham A. M., Hunsberger L. K., Mirsky S. B., Mortensen D. A., et al. (2011). Effects of seeding rate and poultry litter on weed suppression from a rolled cereal rye cover crop. Weed Sci. 59, 438–444. doi: 10.1614/WS-D-10-00180.1
Teasdale J. R., Rice C. P., Cai G., Mangum R. W. (2012). Expression of allelopathy in the soil environment: Soil concentration and activity of benzoxazinoid compounds released by rye cover crop residue. Plant Ecol. 213, 1893–1905. doi: 10.1007/s11258-012-0057-x
Tyler H. L. (2020). Winter cover crops and no till management enhance enzyme activities in soybean field soils. Pedobiologia 81–82, 150666. doi: 10.1016/J.PEDOBI.2020.150666
Tyler H. L. (2021). Single-versus double-species cover crop effects on soil health and yield in Mississippi soybean fields. Agronomy 11, 2334. doi: 10.3390/agronomy11112334
USDA-NASS M. F. O. (2022). Mississippi Crop values 2. Available at: https://www.nass.usda.gov/Statistics_by_State/Mississippi/Publications/County_Estimates/index.php.
Vollmer K. M., VanGessel M. J., Johnson Q. R., Scott B. A. (2020). Influence of cereal rye management on weed control in soybean. Front. Agron. 2. doi: 10.3389/fagro.2020.600568.
Keywords: soybean, cover crop burndown, plant residue addition, weed biomass, net returns, photosynthetic characteristics
Citation: Pinnamaneni SR, Anapalli SS, Molin W and Reddy KN (2022) Effect of Rye cover crop on weed control, soybean (Glycine max L.) yield and profitability. Front. Agron. 4:907507. doi: 10.3389/fagro.2022.907507
Received: 29 March 2022; Accepted: 28 June 2022;
Published: 22 July 2022.
Edited by:
ML Jat, International Maize and Wheat Improvement Center, MexicoReviewed by:
Ilias Travlos, Agricultural University of Athens, GreeceCledimar Rogério Lourenzi, Federal University of Santa Catarina, Brazil
Copyright © 2022 Pinnamaneni, Anapalli, Molin and Reddy. This is an open-access article distributed under the terms of the Creative Commons Attribution License (CC BY). The use, distribution or reproduction in other forums is permitted, provided the original author(s) and the copyright owner(s) are credited and that the original publication in this journal is cited, in accordance with accepted academic practice. No use, distribution or reproduction is permitted which does not comply with these terms.
*Correspondence: Srinivasa Rao Pinnamaneni, c3JpLnBpbm5hbWFuZW5pQHVzZGEuZ292