
95% of researchers rate our articles as excellent or good
Learn more about the work of our research integrity team to safeguard the quality of each article we publish.
Find out more
HYPOTHESIS AND THEORY article
Front. Agron. , 27 June 2022
Sec. Climate-Smart Agronomy
Volume 4 - 2022 | https://doi.org/10.3389/fagro.2022.903340
 Victor O. Sadras1,2*
 Nicolas Giordano3
 Adrian Correndo3
 C. Mariano Cossani1,2
 Juan M. Ferreyra4
 Octavio P. Caviglia5
 Jeffrey A. Coulter6
 Ignacio A. Ciampitti3
 Romulo P. Lollato3
Nitrogen management is central to the economic and environmental dimensions of agricultural sustainability. Yield response to nitrogen fertilisation results from multiple interacting factors. Theoretical frameworks are lagging for the interaction between nitrogen and air temperature, the focus of this study. We analyse the relation between yield response to nitrogen fertiliser and air temperature in the critical period of yield formation for spring wheat in Australia, winter wheat in the US, and maize in both the US and Argentina. Our framework assumes (i) yield response to nitrogen fertiliser is primarily related to grain number per m2, (ii) grain number is a function of three traits: the duration of the critical period, growth rate during the critical period, and reproductive allocation, and (iii) all three traits vary non-linearly with temperature. We show that “high” nitrogen supply may be positive, neutral, or negative for yield under “high” temperature, depending on the part of the response curve captured experimentally. The relationship between yield response to nitrogen and mean temperature in the critical period was strong in wheat and weak in maize. Negative associations for both spring wheat in Australia and winter wheat with low initial soil nitrogen (< 20 kg N ha-1) in the US highlight the dominant influence of a shorter critical period with higher temperature; with high initial soil nitrogen (> 120 kg N ha-1) that favoured grain number and compromised grain fill, the relation between yield response to nitrogen and temperature was positive for winter wheat. The framework is particularly insightful where data did not match predictions; a non-linear function integrating development, carbon assimilation and reproductive partitioning bounded the pooled data for maize in the US and Argentina, where water regime, previous crop, and soil nitrogen overrode the effect of temperature on yield response to nitrogen fertilisation.
An agricultural system is sustainable if it is profitable, accounts for environmental and social expectations, and delivers safe products (Sadras et al., 2009). Nitrogen fertilisation is central to both the economic and environmental dimensions of agricultural sustainability. These dimensions are intricately linked, as over fertilisation releasing reactive nitrogen to the environment is more likely in heavily subsidised systems and in more profitable industries such as horticulture, and under fertilisation leading to soil mining and yield gaps is more common in less profitable sectors (Jobbágy and Sala, 2014; Zhang et al., 2015; Angus and Grace, 2017; Cassman and Dobermann, 2022).
The response of yield to the interaction between nitrogen and air temperature, the focus of this study, is attracting attention in the context of climate change, and involves further interactions with genotype and water availability (Ordóñez et al., 2015; Slafer and Savin, 2018; Cossani and Sadras, 2021); the interaction with air CO2 concentration is important but is beyond the scope of this paper (Miglietta et al., 1996; Kimball et al., 2001; Zong et al., 2021). Lack of theoretical frameworks hinders the interpretation of the interaction between nitrogen and temperature. Here we investigate overlooked aspects of crop physiology to help understanding, modelling, and managing the response of grain yield to nitrogen interacting with temperature.
Flowering plants overproduce flowers and ovules (Stephenson, 1981), and yield of annual crops correlates tightly with grain number (Sadras, 2021). Grain number is particularly responsive to stress in species-specific developmental stages (Darwin, 1859; Andrade et al., 2005; Sadras and Dreccer, 2015). Temperature and daylength drive development, and thus the timing and duration of the critical period for yield formation in most crops including wheat and maize (Otegui et al., 2021a; Slafer et al., 2021). Irrespective of the source, namely sowing date, location, season or climate change, there are two physiologically distinct aspects of elevated temperature affecting yield: non-stressful elevated temperature that primarily affects the rate of phenological development, shortening key developmental periods, and stressful temperature that disrupts reproduction and grain growth (Rattalino Edreira et al., 2011; Sadras and Dreccer, 2015).
The pairing of cultivar and sowing time is an active topic of research as an adaptation to climate change, to accommodate an extended sowing program in large farms, and to manage trade-offs, e.g., between frost and heat, or between drought and insect herbivory (Caviglia et al., 2014; Hunt et al., 2019; Lake et al., 2021; Otegui et al., 2021b). Yield of late-sown cereals is usually less responsive to nitrogen fertiliser for at least two reasons: increased availability of soil nitrogen through mineralisation, and a shorter critical period that restricts yield potential (Caviglia et al., 2014; Cossani and Sadras, 2021). This is illustrated in two examples with wheat and maize, the target crops in this study. Wheat crops with experimental sources of variation including sowing time, cultivar, fertiliser rate, season and location in South Australia yielded between 0.01 and 6 t ha-1; the critical period shortened with increasing temperature and accounted for three-quarters of the variation in yield (Cossani and Sadras, 2021). Fertilised crops (100-200 kg N ha-1) outyielded their unfertilised counterparts when mean temperature during the critical period was below ~ 13°C, and unfertilised controls were superior above this threshold. An empirical link was thus established between temperature during the critical period and yield response to nitrogen. Of interest, long days increase wheat floret autophagy and reduce grain number in comparison to short days independently of resource availability (Ghiglione et al., 2008). We thus speculate that, in addition to the shortening of the critical period, a direct developmental effect of long days is to reduce wheat grain number and yield in late-sown crops.
Maize in Argentina has traditionally been sown in early spring (September–October), reaching the critical period in mid-summer, with peak evaporative demand and erratic rainfall compromising yield and yield reliability (Caviglia et al., 2014; Otegui et al., 2021b). Crops sown in late-spring (November–December) reach the critical period under a more favourable water balance in late summer but are susceptible to lepidopteran pests. With Bt-maize, late sowing became feasible and widespread, with a current acreage ratio of early-to-late sown crops close to 1 (Otegui et al., 2021b). In a comparison of fertilised (200 kg N ha-1) and unfertilised Bt-maize crops sown in September and December, late sowing increased soil nitrogen availability, shortened the critical period, reduced biomass, improved crop nitrogen status measured as the nitrogen nutrition index, and reduced yield response to fertilisation (Caviglia et al., 2014).
In this study, we use agronomically diverse data for spring wheat in Australia, winter wheat in the US, and maize in both the US and Argentina to explore the temperature-driven developmental modulation of yield response to nitrogen. We analyse yield response to nitrogen against a framework that assumes (i) yield response to nitrogen is primarily related to grain number, (ii) grain number is a function of three traits: the duration of the critical period, growth rate during the critical period, and reproductive allocation (Fischer, 1984; Andrade et al., 2005; Otegui et al., 2021a; Slafer et al., 2021), and (iii) all three traits vary non-linearly with temperature (Kim et al., 2007; Lohraseb et al., 2017). Where the main effect of elevated temperature is shortening the critical period, our hypothesis is that yield response to nitrogen fertiliser correlates negatively with temperature. For wheat, we also hypothesise that long days further reduce yield response to nitrogen (Ghiglione et al., 2008). The effect of temperature on the dynamics of soil nitrogen are beyond the scope of this study.
We explored the relationship between yield response to nitrogen and mean air temperature in the critical period in four data sets – spring wheat in Australia, winter wheat in the US, and maize in the US and Argentina. For wheat in Australia, we also explored associations with daylength. Yield response to nitrogen was calculated as 100 · (YN-Y0)/Y0, where Y is grain yield and subscripts indicate fertilised (N) and unfertilised control (0). The critical period was calculated as 300°Cd before to 100°Cd after anthesis with base temperature 4.5°C for wheat (Fischer, 1985; Slafer et al., 2021), and 200°Cd before to 250°C after anthesis with base temperature 8°C for maize (Otegui et al., 2021a).
Figure 1 summarises frequency distributions of yield, yield response to nitrogen, duration of critical period and mean temperature in the critical period. Data sets were larger and more scattered for maize than for wheat (Figure 1). This was associated with a larger and more diverse sample of environments for maize (Figure 2) compared with wheat (see below). Supplementary Figures 1, 2 present yield components of wheat; yield components were not available for maize.
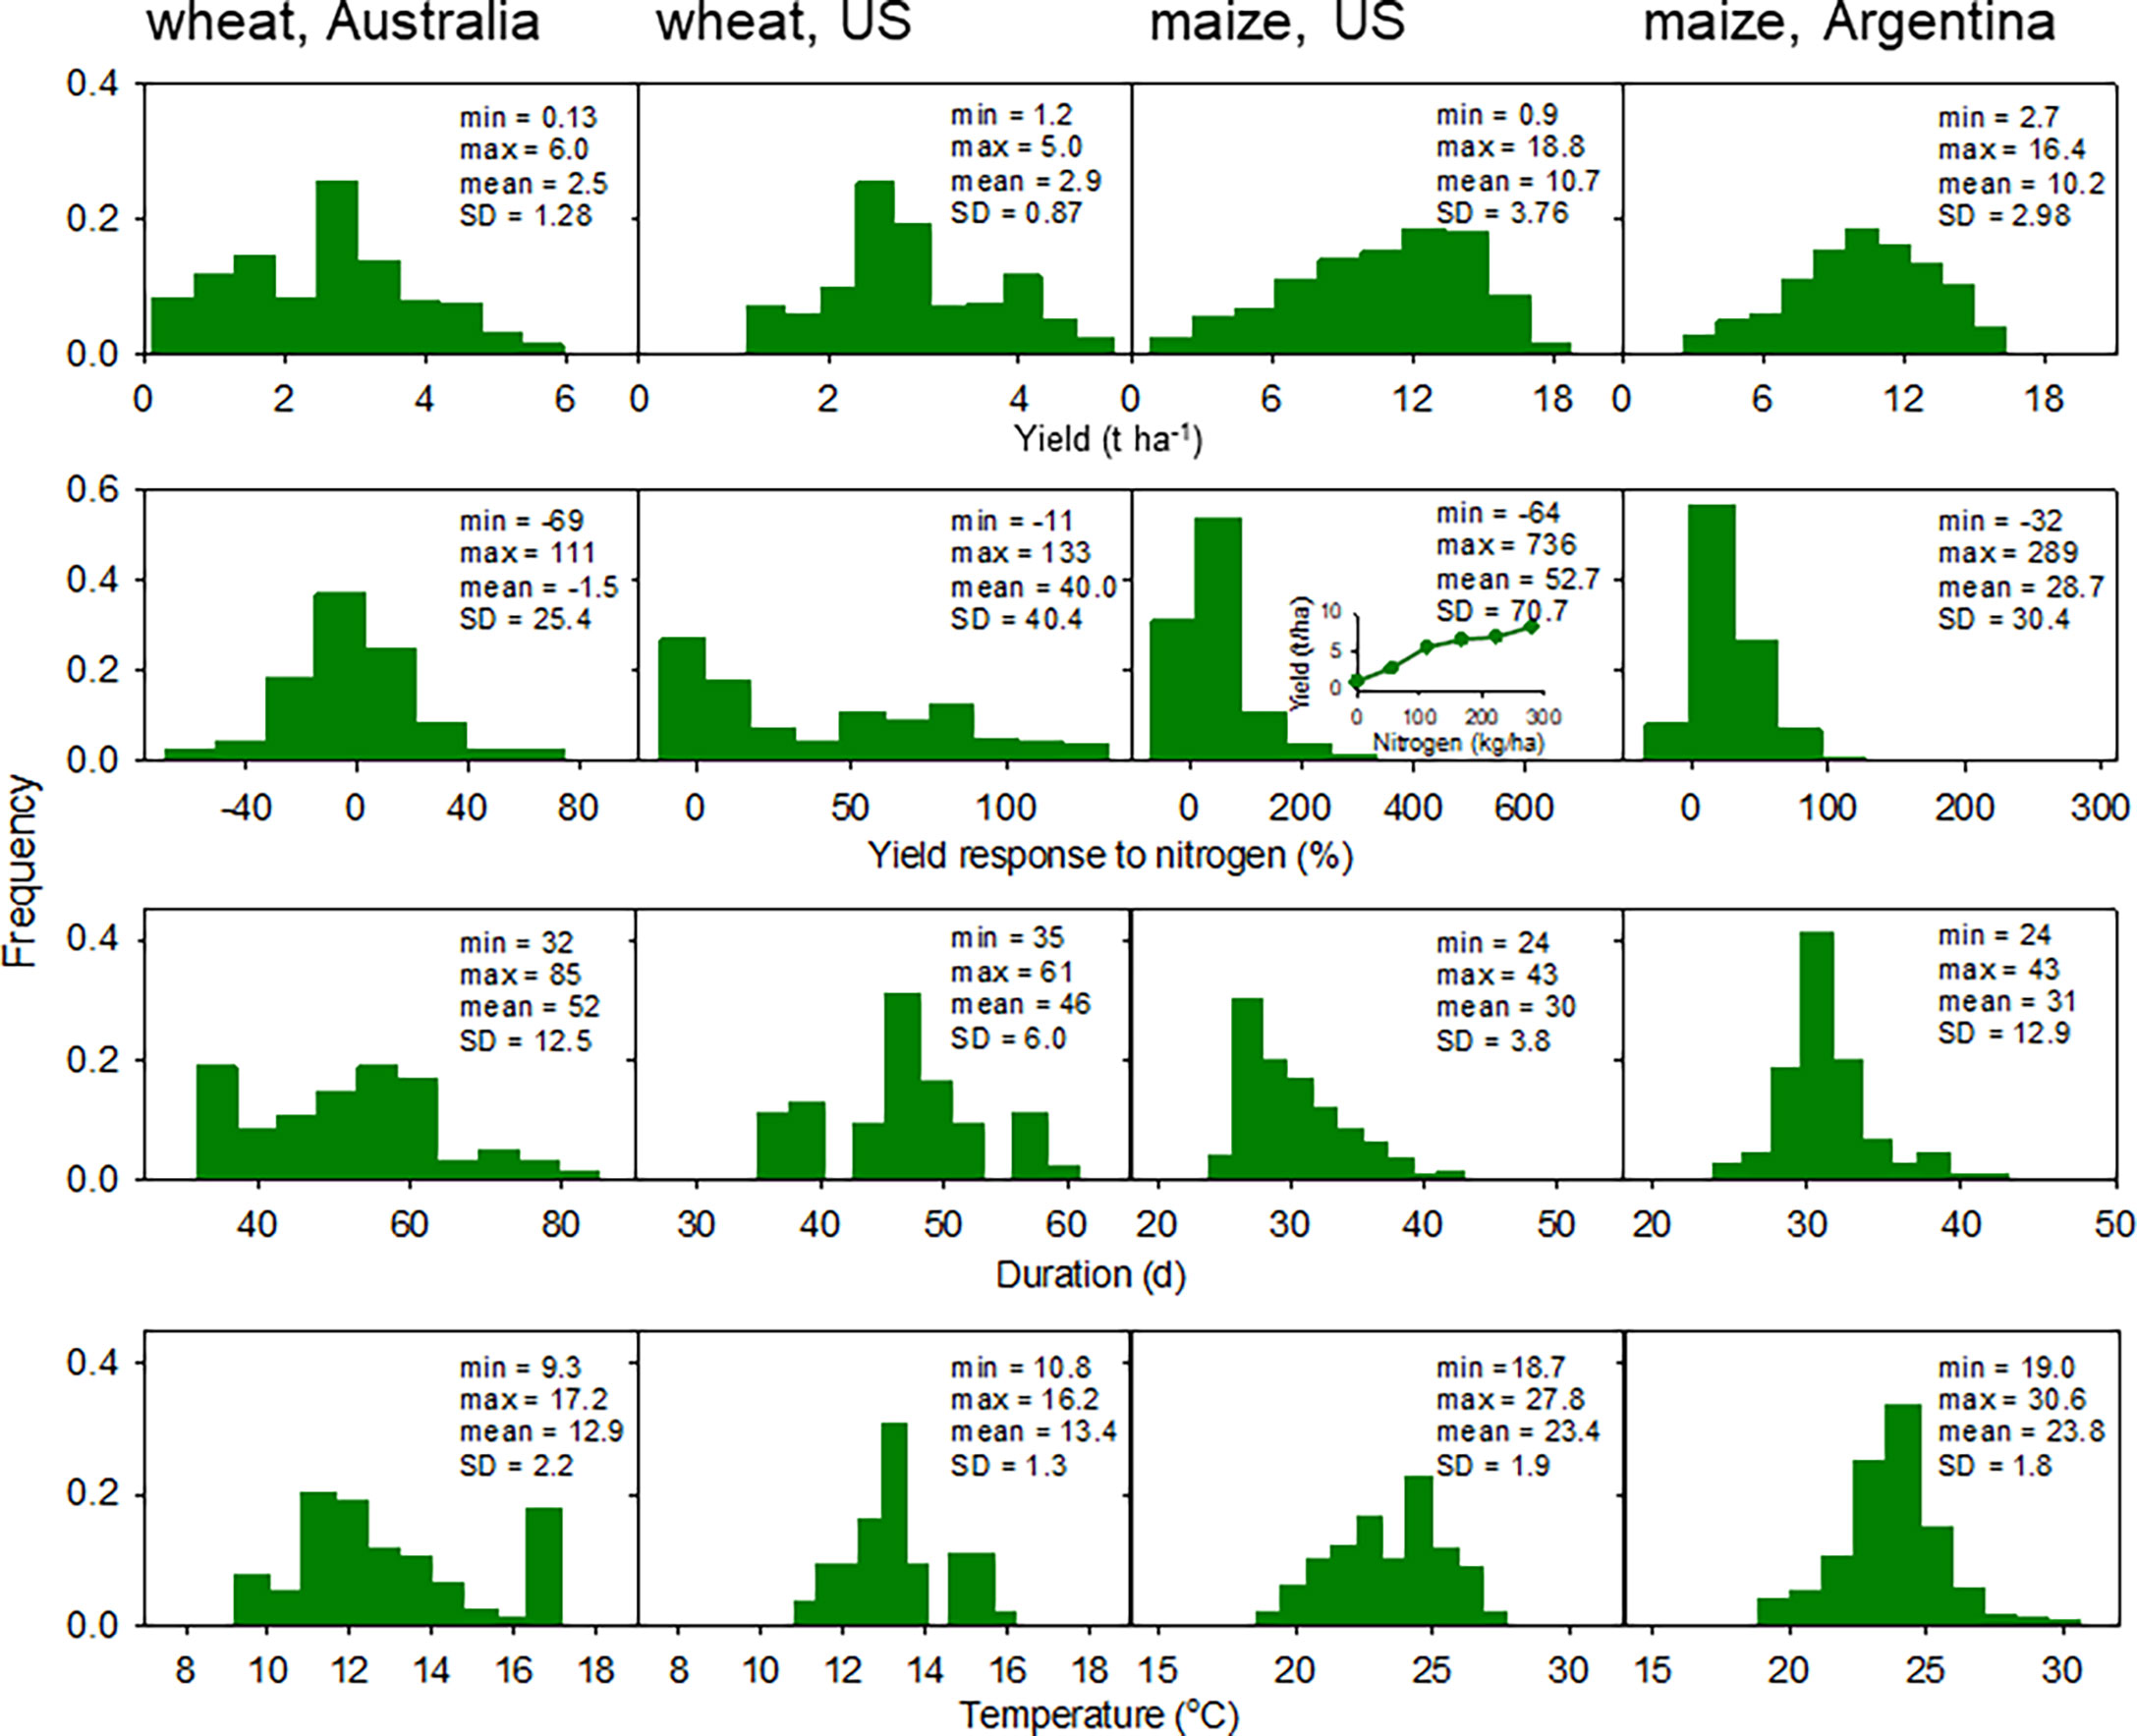
Figure 1 Frequency distribution of yield, yield response to nitrogen, duration of the critical period and mean temperature during the critical period for spring wheat in Australia (n = 384), winter wheat in US (n = 224), maize in the US (n = 1165), and maize in Argentina (n = 984). Yield response to nitrogen is 100 · (YN-Y0)/Y0, where Y is grain yield and subscripts indicate fertilised (N) and unfertilised control (0). Inset for yield response to nitrogen for maize in the US highlights the large response for rainfed crops after cereal in a sandy soil with low organic matter, where yield increased 8-fold from unfertilised control to crops with 280 kg N ha-1.
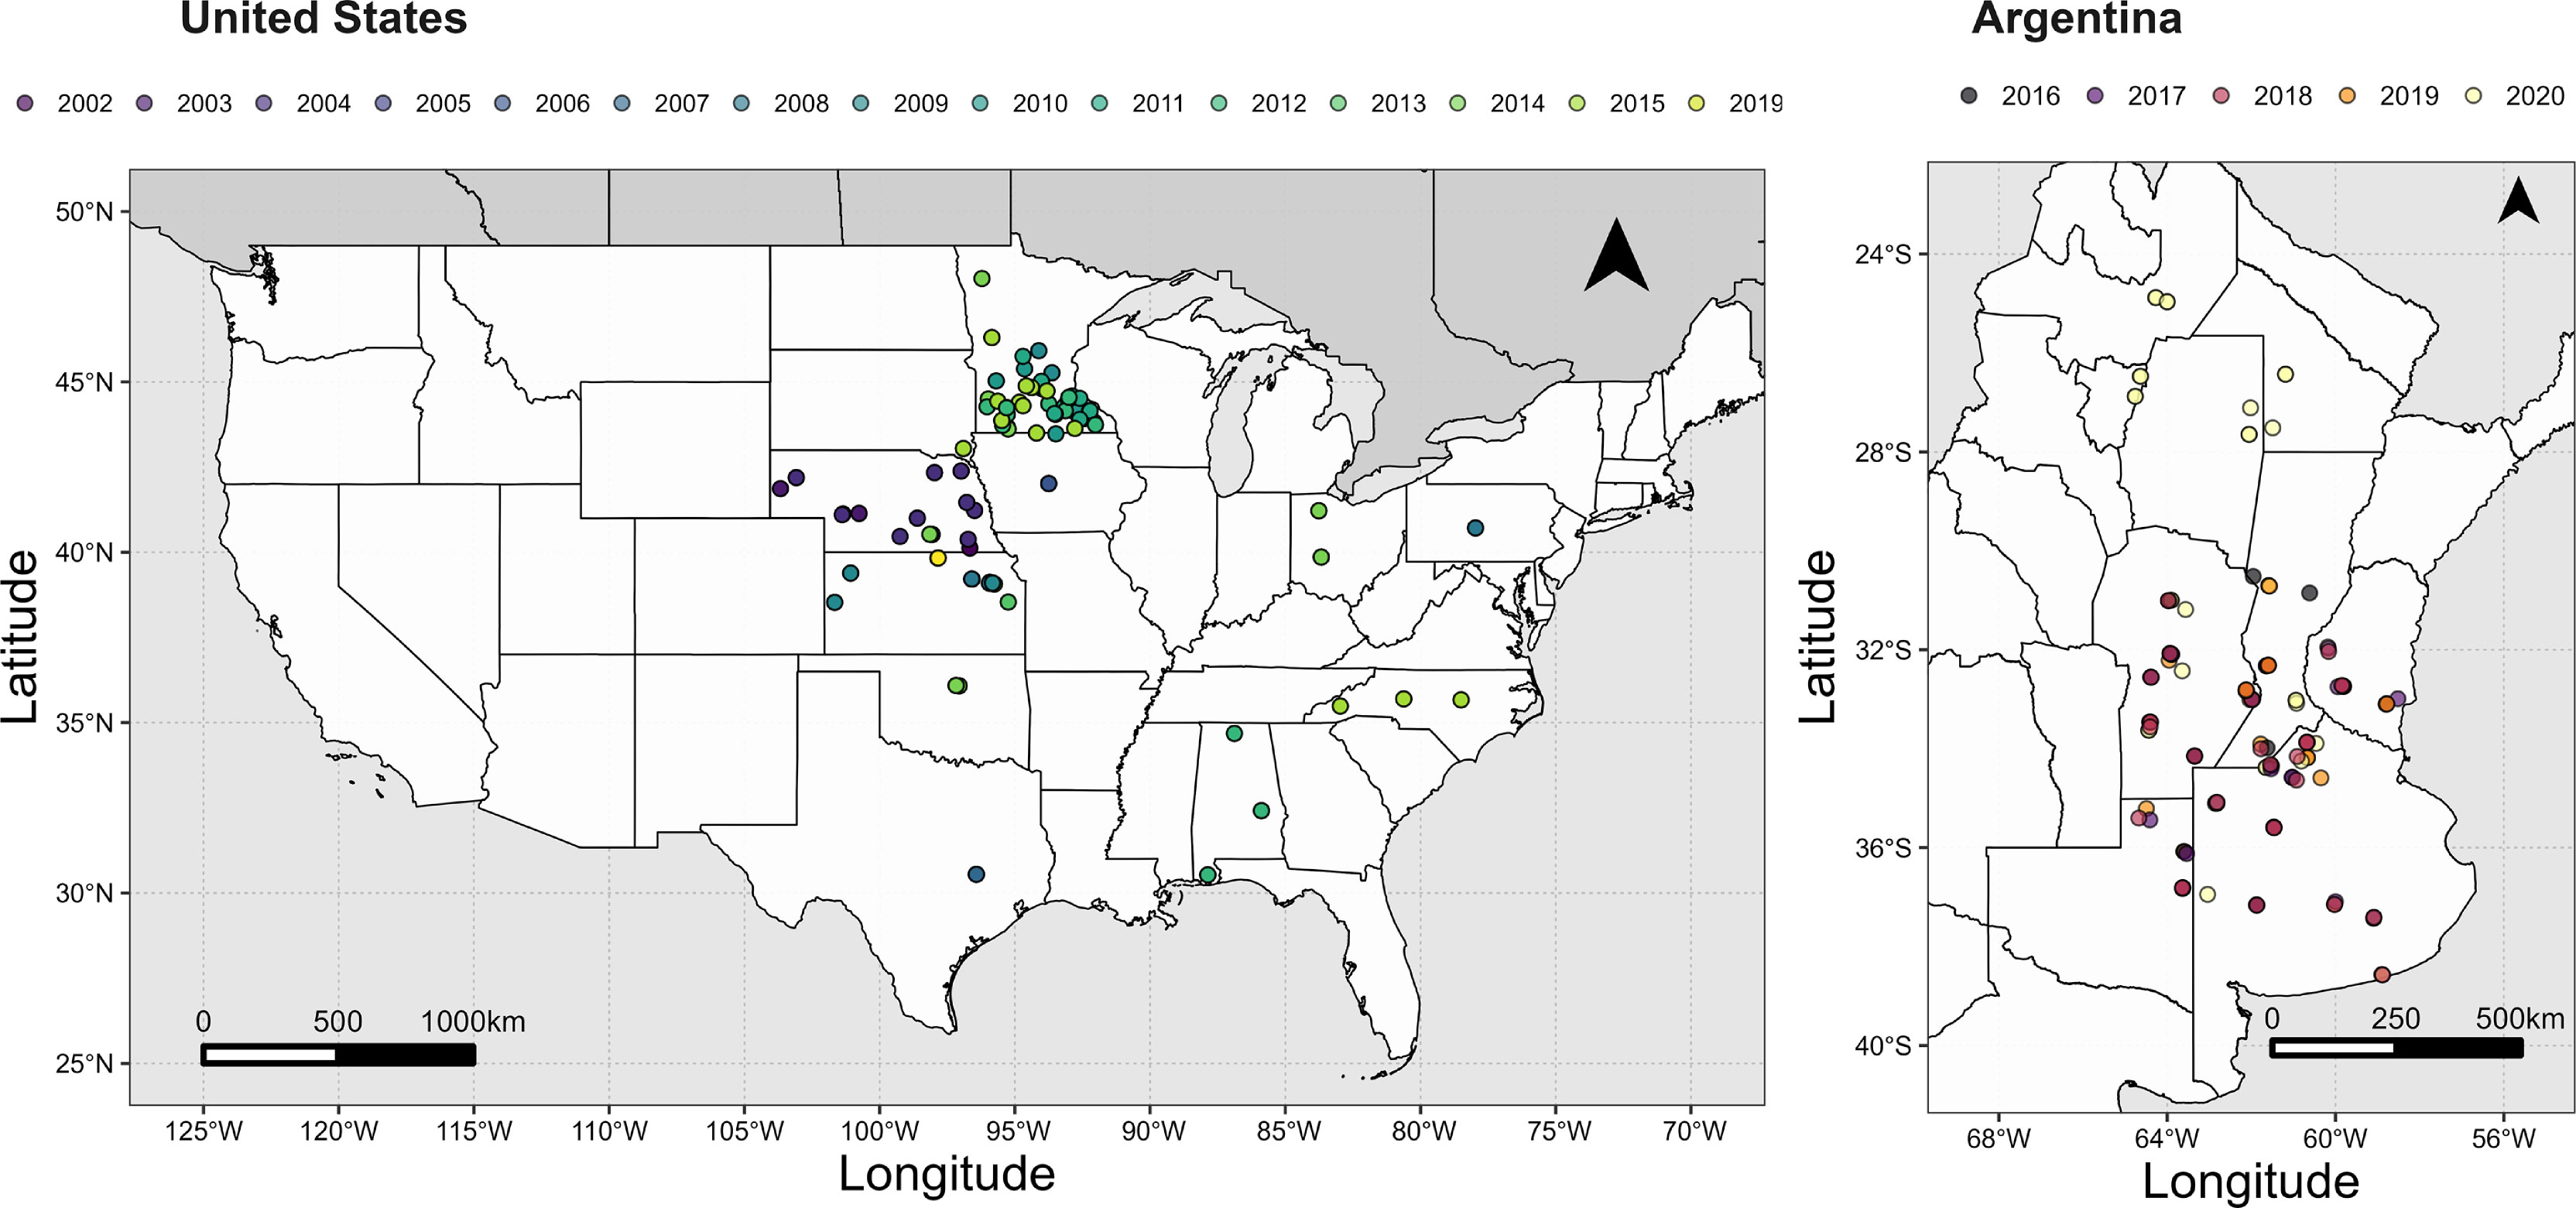
Figure 2 Locations and seasons for maize trials in the US and Argentina.
We analysed a data set of 384 rainfed wheat crops resulting from the combination of four location-seasons, four nitrogen treatments (unfertilised control, and crops fertilised with 50, 100 or 200 kg N ha-1), four sowing dates at approximately fortnightly intervals from mid-May to late-June, early July, and six cultivars. Full details are in Cossani and Sadras (2021). Briefly, locations were Hart (-33.76°, 138.42°) and Turretfield (- 34.55°, 138.79°) in 2017, and Roseworthy (-34.54°, 38.69°) and Mintaro (-33.88, 138.77) in 2018. The soils were a clay loam Calcarosol at Hart, sandy loam over medium clay on rock Sodosol at Turretfield, a calcareous loam Calcarosol at Roseworthy, and a medium-heavy clay Vertosol at Mintaro (Isbell, 1996). Urea was applied manually between sowing and shortly before stem elongation to establish the nitrogen treatments. Cultivars varied in phenology from Axe (average time to flowering 111 d after sowing, range from 84 to 161 d depending on time of sowing and location) to Trojan (average time to flowering 122 d after sowing, range from 92 to 173 d), with intermediate varieties Cobra, Mace, Scout and Spitfire. Treatments were arranged in a split-split-plot design with three replicates; sowing time was allocated to the main plot, cultivar to the sub-plot, and nitrogen rate to the sub-sub plot. Plant density was 180 plants m-2, and inter-row space was 0.34 m at Turretfield, 0.23 m at Hart, and 0.26 m at Mintaro and Roseworthy. The experimental unit consisted of six rows, between 5 and 12.5 m long. Seasonal rainfall varied from 113 mm to 290 mm and available soil water at sowing from 7 to 161 mm. Initial nitrogen, including inorganic soil nitrogen at sowing and fertiliser, ranged from 51 kg N ha-1 to 571 kg N ha-1. At maturity, we sampled shoot biomass from centre rows in four 0.5-m sections. Samples were oven-dried at 65°C for 48 h and threshed to determine grain yield. Grain weight was determined in 300-grain subsamples. Daily weather data were sourced from the meteorological station of SILO climate database (https://www.longpaddock.qld.gov.au/silo/) closest to the experimental site. Weeds, insects, and diseases were monitored and controlled with the protocols of National Variety Trials (https://nvt.grdc.com.au/).
We analysed a data set of 224 rainfed winter-wheat crops resulting from the factorial combination of four locations in Kansas, four nitrogen treatments (unfertilised control, and crops fertilised with 45, 90, and 134 kg N ha-1) and 14 cultivars. Locations were Ashland Bottoms (39.14°, -96.63°), Great Bend (39.82°, -97.67°), Hutchinson (37.93°, -98.02°) and Viola (37.31°, -97.67°). The experiment is fully described elsewhere (Giordano and Lollato, 2021) and Supplementary Table 1 summarises soil properties and management operations. Briefly, treatments were established in a split-plot design with nitrogen rate allocated to plot and cultivar to the sub-plot. Crops were sown in October 2018 at a rate of 297 seeds per m2, adjusting for seed size. Experimental units consisted of seven 19-cm spaced rows, approximately 9 m long. Phenology was monitored using the scale of Zadoks et al. (1974) (Supplementary Table 2). After winter dormancy, at GS2.3, crops were fertilised with gypsum (22 kg S ha-1) to avoid the interaction between nitrogen and sulphur documented for these environments (Jaenisch and Lollato, 2019), and with urea to establish the nitrogen treatments. Foliar fungicide was applied when the earliest maturing varieties reached GS6.1 to avoid the confounded effect of variation in resistance to diseases among cultivars. At harvest maturity, plants were clipped at the ground level from a 0.19 m2 area for measurement of yield components and nitrogen concentration to estimate total nitrogen uptake. The entire experimental unit was harvested with a self-propelled small plot combine to determine grain yield. Daily weather data were retrieved from a nearby weather monitoring station from the Kansas Mesonet (Patrignani et al., 2020) located < 100 m from the experiment at Ashland Bottoms, Great Bend, and Hutchinson, and 9 km from the experiment at Viola.
We analysed a data set of 1165 maize crops resulting from the combination of seasons, locations, and fertiliser rate treatments. Data were gathered from 23 data sources, including published and unpublished studies, representing a total of 217 trials. The database spans from 30.43° to 48.03° latitude and from -103.67° to -77.97° longitude (Figure 2). Sowing date ranged from early March to early June. Relative maturity of maize hybrids ranged from 83 to 127 CRM units. Fertiliser treatments included at least four rates, from an unfertilised control to a maximum rate ranging from 168 to 336 kg N ha-1. Fertiliser sources were urea-ammonium nitrate (32-0-0), ammonium nitrate (34-0-0), urea (46-0-0), or anhydrous-ammonia (82-0-0), and application timing ranged between pre-sowing to V6. Grain yield was the average of 3-5 replications. Daily maximum and minimum temperature were accessed via the Daymet (Thornton et al., 2019) API-client source developed for R-software (package daymetr) using latitude-longitude coordinates of the trial or nearest town with a spatial resolution of 1 km2. Further details on data sources and experiments are in Supplementary Table 3.
We analysed a data set of 984 rainfed crops resulting from the combination of seasons and locations across a latitudinal transect from -38.57° to -24.88° (Figure 2), a range of sowing dates from early September to late January, and fertiliser treatments. The data are from Bayer Argentina network of trials; full details are in https://cultivio.com. Briefly, crops were grown in a range of soils, but predominately Typic Argiudolls and Typic Hapludolls. Coarse-textured Entisols were represented in the south of Córdoba province and north of La Pampa province in the centre of the country, and Vertisols featured in the eastern Entre Ríos province (Figure 2). Each experiment included an unfertilised control and five fertiliser rates: 30, 60, 90, 180 kg N ha-1; the fifth rate corresponding to the maximum rate was 270 kg N ha-1 in 89% of the experiments and 210 kg N ha-1 in the remaining. Urea was applied manually between sowing and V2 (Ritchie et al., 1986) to achieve the nominal rates above. Fertilisation treatments were randomly allocated in a block design with 3-4 replicates. Single cross hybrids with a relative maturity ranging from 119 to 125 d were sown at 6 to 8 plant m-2 in rows 0.52 m apart as usual in the region (ReTAA, 2021). The smallest experimental unit had four rows, 10 m long. Plots were harvested mechanically and threshed to measured grain yield and grain moisture. Daily maximum and minimum temperature were accessed via the Nasapower (Sparks, 2018) API-client source developed for R-software (package nasapower) using latitude-longitude coordinates of the trial or nearest town with a spatial resolution of approx. 50 km2.
Mathematical functions relating plant traits and environmental factors are the core of crop simulation models. These functions are termed reaction norms in developmental biology and their slopes are a measure of phenotypic plasticity (Woltereck, 1909; Sadras and Richards, 2014). Here we use reaction norms relating developmental, assimilation, and partitioning traits and temperature to aid the interpretation of the empirical relations between yield response to nitrogen and temperature. For both wheat and maize, we used our data to derive functions relating duration of critical period and mean air temperature during the critical period.
For wheat, we used the curves of Lohraseb et al. (2017) relating three traits with ambient temperature between 11 and 29°C: (i) the relative rate of developmental processes, (ii) daily net CO2 assimilation, and (iii) daily net CO2 assimilation per unit of developmental time normalised to 20°C, AN20C (Figures 4B, C). The response of harvest index to temperature from ~10 to 14°C was taken from Batts et al. (1997).
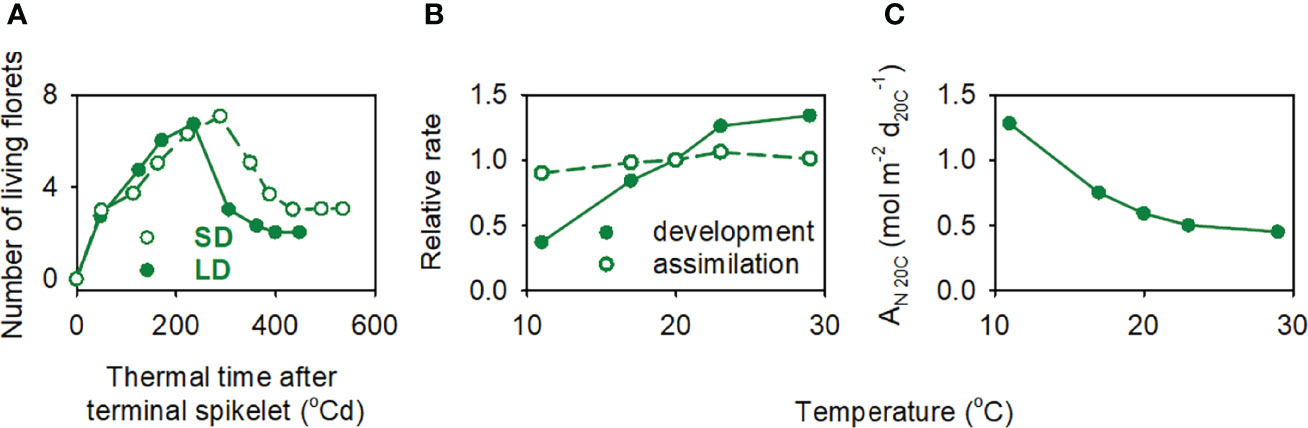
Figure 4 (A) Developmental effect of daylength on floret survival of field-grown wheat, where short-day (SD) was the natural photoperiod of the growing season (approximately 12.5 h) and long day (LD) was the natural photoperiod extended by 6 h with a mixture of incandescent and fluorescent lamps. The photosynthetic photon flux density (400–700 nm) of the supplementary light was 4 mol m-2 s-1. (B) Relative rate of developmental processes and CO2 assimilation normalised to 20 °C in response to ambient temperature. (C) Daily net CO2 assimilation per unit of developmental time, AN20C, as a function of temperature. Data sources: (A) Ghiglione et al. (2008); (B, C) Lohraseb et al. (2017).
For maize, we used the curves of Kim et al. (2007) relating two traits, canopy carbon exchange rate and ear-to-biomass ratio, and temperature between 17.0 and 36.5°C (Figure 7C). Of the two CO2 treatments in Kim et al. (2007), we used the curves at CO2 concentration = 370 mmol mol-1. A third reaction norm was derived that relates the product of three traits – duration of critical period, canopy carbon exchange rate, and ear-to-biomass ratio – and temperature (red curve in Figure 7C).
Yield ranged from 129 kg ha-1 to 6 t ha-1 (Figure 1). Yield response to nitrogen varied from -69 to 111%, with 61% of crops between -6 and 12% (Figure 1). Biomass varied 4.6-fold, harvest index 17.3-fold, grain number 40-fold, and grain weight 2.2-fold (Supplementary Figure 1). Grain protein concentration varied from 7.1 to 16.3% and nitrogen uptake at maturity from 34 to 167 kg ha-1 (Supplementary Figure 1). The duration of the critical period varied from 32 to 85 d, with an average mean temperature from 9.3 to 17.2 °C (Figure 1). Crop nitrogen status, quantified with the nitrogen nutrition index, varied from 0.33 to 1.80, and water status, quantified with carbon isotope composition, from -27.95 to -23.37‰ (Supplementary Figure 1). The relations between yield and both nitrogen nutrition index and carbon isotope composition have been analysed elsewhere (Cossani and Sadras, 2021; Cossani and Sadras, 2022); here we focus on overlooked aspects of crop development.
Grain yield declined with shorter critical period (Figure 3A). Both higher temperature and longer days shorten wheat critical period (Slafer et al., 2021). Temperature and daylength are correlated but the correlation depends on location and time of the year (Aphalo and Sadras, 2021). For a given daylength, the critical period for the crops in our data set was hotter for Roseworthy and Turretfield than in the other locations (Figure 3B). In experiments where daylength was manipulated independently of temperature and supply of resources, long days reduced floret viability (Figure 4A). As expected from the causal links between duration of critical period and yield, and between the duration of critical period and temperature, yield declined with higher temperature in the critical period (Figure 3C). The correlation was slightly stronger with temperature-to-daylength ratio (Figure 3D), consistent with the expectation of a direct developmental effect of daylength on grain set (Figure 4A). Grain number, the main yield component, correlated slightly better with temperature-to-daylength ratio (F1,382 = 502.8, r = -0.75) than with temperature (F1,382 = 453.1, r = -0.73).
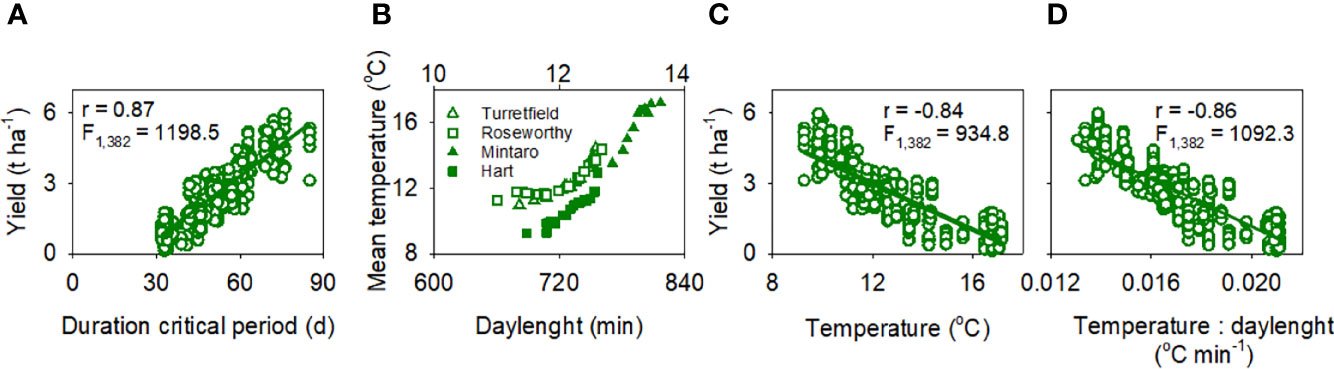
Figure 3 (A) Spring-wheat yield was proportional to the duration of the critical period, from 300°Cd before to 100°Cd after flowering (base temperature = 4.5°C). (B) The correlation between mean temperature during the critical period and daylength at flowering varied with location and time of the year; the top x-axis shows daylength in hours. Grain yield correlated with (C) mean temperature in the critical period, and (D) temperature-to-daylength ratio. In (A, C, D) lines are least squares regressions, all with p < 0.0001.
Pooling the data for crops fertilised with 100 and 200 kg N ha-1, yield response to nitrogen increased with the duration of the critical period at a rate of 1.05 ± 0.116% d-1 (F1,190 = 81.6, r = 0.55, p < 0.0001) and correlated closely with the response of grain number to nitrogen (F1,190 = 758.3, r = 0.89, p < 0.0001). The response of yield to nitrogen fertiliser declined with increasing mean temperature in the critical period at -5.5 ± 0.68%°C -1 and shifted from positive to negative at 12.5 ± 2.21°C (Figure 5A). The slope of the least square regression between yield response to nitrogen and temperature in the critical period was steeper with higher fertiliser rate (Table 1); it was -6.2%°C-1 (F1,94 = 34.1; p < 0.0001) for 200 kg N ha-1, -4.9%°C-1 (F1,94 = 24.7; p < 0.0001) for 100 kg N ha-1, and -2.0%°C-1 for 50 kg N ha-1 (F1,94 = 3.9; p = 0.051).
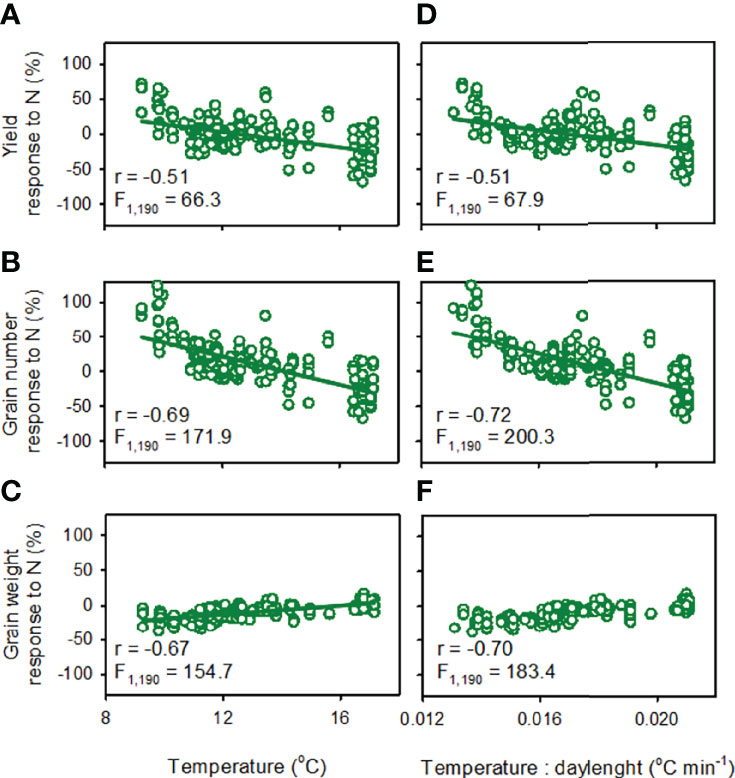
Figure 5 Response to nitrogen fertilisation of spring wheat (A, D) yield, (B, E) grain number and (C, F) grain weight as a function of (A–C) mean temperature during the critical period and (B, E, F) temperature: daylenght ratio. Response to nitrogen is: 100 · (XN-X0)/X0 where X is the trait (yield, grain number, grain weight), subscript N indicates fertilised (100 or 200 kg N ha-1), and subscript 0 indicates unfertilised control. The critical period is from 300°Cd before to 100 °Cd after flowering (base temperature = 4.5°C). Lines are least squares regressions, all with p < 0.0001.
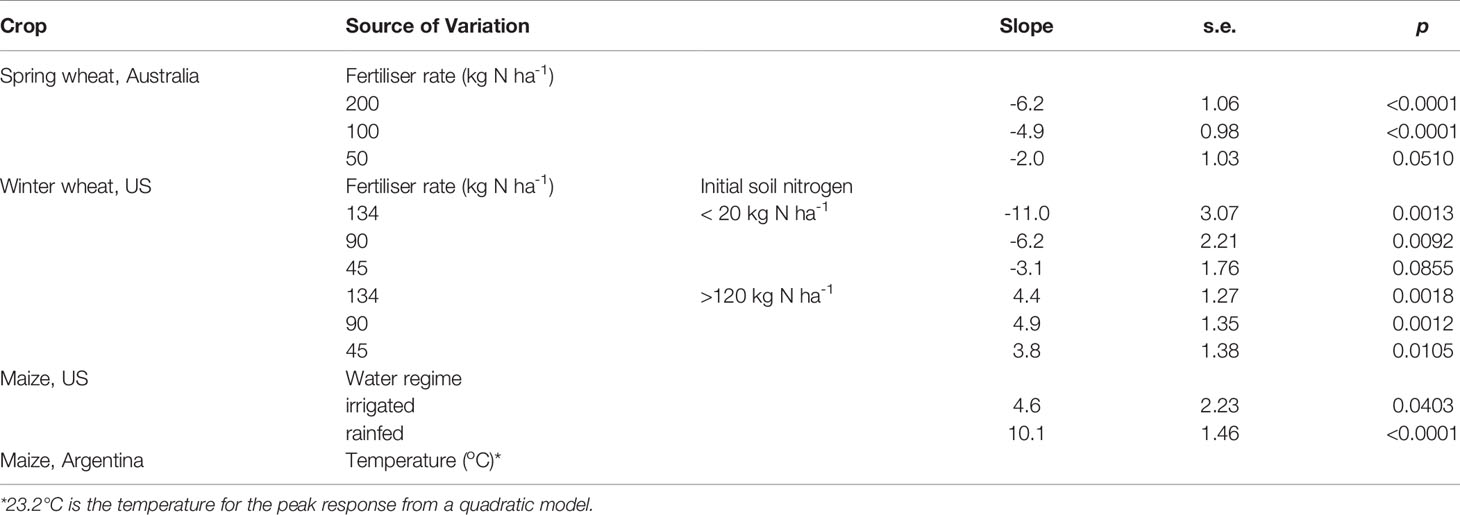
Table 1 Slope, standard error and p of the least squares regression between yield response to nitrogen and mean air temperature in the critical period of spring wheat in Australia, winter wheat in the US, and maize in the US and Argentina.
For crops fertilised with 100 and 200 kg N ha-1, the response of grain number to nitrogen varied from 67% reduction to 124% increase, declined with increasing mean temperature in the critical period at a rate of 10.1 ± 0.77%°C-1, and shifted from positive to negative at 14.1 ± 1.47°C (Figure 5B). The response to nitrogen of average grain weight increased with mean temperature during the critical period at a rate of 3.2 ± 0.26%°C-1 (Figure 5C). The response to nitrogen of both grain number and average grain weight correlated slightly better with temperature-to-daylength ratio (Figures 5E, F) than with mean temperature during the critical period (Figures 5B, C).
Yield ranged from 1.1 to 5.0 t ha-1 (Figure 1). Yield response to nitrogen varied from -11 to 133%, with a flat frequency distribution and two apparent peaks: 44% of crops ranged from -4 to 10%, and 32% of crops from 53 to 83% (Figure 1). Biomass varied 5.4-fold, harvest index 1.7-fold, grain number 7.8-fold, and grain weight 1.9-fold (Supplementary Figure 2). Grain protein concentration varied from 7.3 to 17.7% and nitrogen uptake at maturity from 34 to 278 kg ha-1 (Supplementary Figure 2). Averaged across cultivars, time from sowing to anthesis spanned from 194 d at Viola to 215 d at Great Bend. Averaged across sites, time from sowing to anthesis spanned from 198 d for Everest to 210 for LCS Chrome (Supplementary Table 1). The critical period varied from 35 to 61 d, with an average mean temperature from 10.8 to 16.2°C (Figure 1). In contrast to the environments for spring wheat in Australia where temperature and daylength were decoupled (Figure 3B), a tight correlation between temperature and daylength in the environments for winter wheat in Kansas (Supplementary Figure 3) precludes the assessment of temperature and daylength effect; thus, the analysis in the next section only considers temperature.
Initial NO3-N in soil (0 to 0.6 m) varied 6-fold, from more than 120 kg N ha-1 in Hutchinson and Great Bend to less than 20 kg N ha-1 at Ashland Bottoms and Viola (Figure 6A).
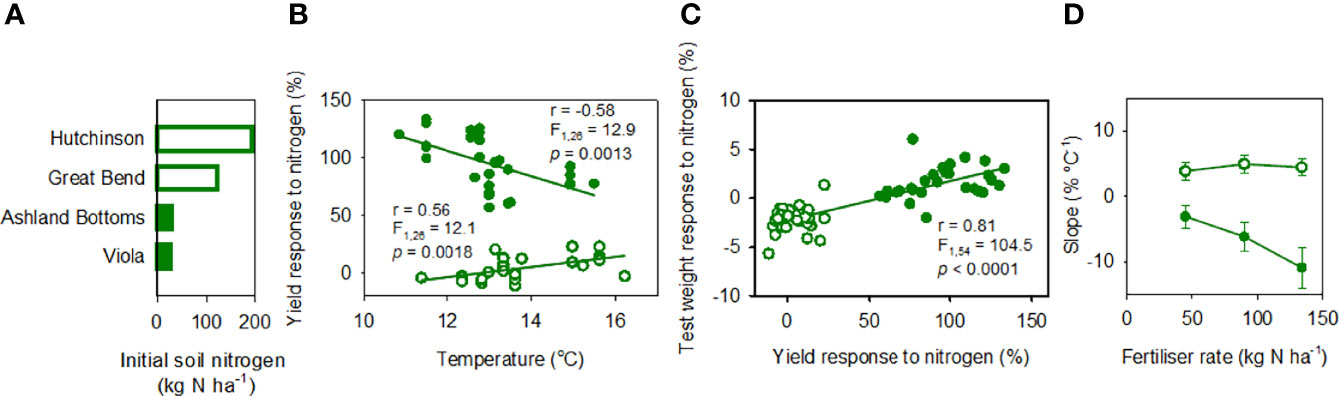
Figure 6 (A) Initial NO3-N in soil (0 to 0.6 m) in four locations in Kansas. (B) Yield response to nitrogen fertilisation as a function of mean temperature in the critical period. (C) Association between the response to nitrogen fertiliser of test weight and yield. In (B, C): response to nitrogen is: 100 · (XN-X0)/X0 where X is the trait (yield, test weight), subscript N indicates fertilised (134 kg N ha-1), and subscript 0 indicates unfertilised control; lines are least squares regressions. (D) Slope ± s.e. of the lest squares regression between yield response to nitrogen fertiliser and temperature in the critical period for crops fertilised with 45, 90 or 134 kg N ha-1. In (A–D), open symbols indicate high (> 120 kg N ha-1) and closed symbols low initial nitrogen (< 20 kg N ha-1).
With low initial soil nitrogen, yield response to nitrogen fertiliser (134 kg N ha-1) was positive and large, from 57 to 133%, and declined with increasing mean temperature in the critical period at -11.0 ± 3.07%°C-1 (Figure 6B closed symbols). The slope of the least square regression between yield response to nitrogen fertiliser and temperature in the critical period varied with fertiliser rate (Table 1); it declined from -11.0%°C-1 with 134 kg N ha-1, to -6.2%°C-1 with 90 kg N ha-1 and to -3.1%°C-1 with 45 kg N ha-1 (Figure 6D).
With high initial soil nitrogen, yield response to nitrogen fertiliser (134 kg N ha-1) was smaller, from -11 to 23%, increased with increasing mean temperature in the critical period at 4.4 ± 1.27%°C-1, and shifted from negative to positive at 12.9 ± 5.4°C (Figure 6B open symbols). The slope of the least squares regression between yield response to nitrogen and temperature did not vary with nitrogen fertiliser rate (Figure 6D; Table 1). The positive association between yield response to nitrogen fertiliser and temperature in the critical period was partially associated with agronomic, soil, and weather conditions in the two sites originating the response, Hutchinson and Great Bend. In comparison to the late-sown crop at Great Bend, the timely-sown crop at Hutchinson (Supplementary Table 1) had cooler conditions during the critical period (12.9 ± 0.06°C), higher biomass (13.8 ± 0.2 t ha-1), and negligible response of biomass (1.1 ± 1.2%) and grain yield (-3.8 ± 0.6%) to nitrogen fertilisation. The high soil nitrate-nitrogen content at sowing (193 kg N ha-1, Figure 7A) and negative yield response to nitrogen suggests this crop was at the far end of the nitrogen response curve where added nitrogen reduces wheat yield (Borghi, 1999). The late-sown crop in Great Bend (Supplementary Table 1) had a warmer critical period (14.5 ± 0.2°C), smaller crop biomass (8.4 ± 0.1 t ha-1), 11.3 ± 1.2% biomass increase, and 12.5 ± 1.2% yield increase in response nitrogen fertilisation compared to unfertilised controls. With 124 kg N ha-1 at sowing, this crop was likely in a central region of the nitrogen response curve where increase in grain yield associated with increase in biomass (Borghi, 1999).
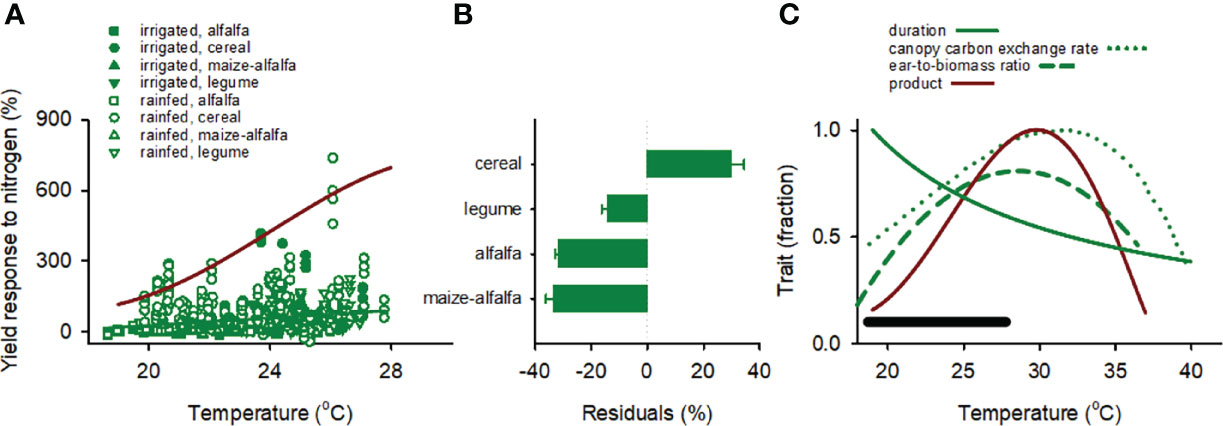
Figure 7 (A) Yield response to nitrogen as a function of mean temperature in the critical period for irrigated and rainfed maize grown after alfalfa, cereal, maize-alfalfa, and legume in the US. Response to nitrogen is: 100 · (YN-Y0)/Y0 where Y is yield, and subscripts indicate fertilised (N) and unfertilised control (0). The green line is the least squares regression fitted to the data. The red line is the product of three traits: duration of the critical period, canopy carbon exchange rate and ear-to-biomass ratio from (C), scaled to the actual maximum. (B) Average residuals of the regression between yield response to nitrogen and temperature for maize grown after alfalfa, cereal, maize-alfalfa, and legume. Error bars are one standard error. (C) Duration of the critical period, canopy carbon exchange rate, ear-to-biomass ratio and the product of the three traits as a function of mean temperature. The black segment is the range of temperature in our data set. Duration of the critical period is from our data set. The functions for canopy carbon exchange rate and ear-to-biomass ratio are from Kim et al. (2007) at CO2 concentration = 370 mmol mol-1.
For the data pooled across soil nitrogen, the response of yield to nitrogen fertiliser correlated more strongly with the response of grain number (r = 0.91, F1,54 = 290.9) than with the response of grain weight (r = 0.69, F1,54 = 48.6) (Supplementary Figure 4). Response of grain number to nitrogen averaged 17% with high soil nitrogen and 125% for low nitrogen (F1,54 = 154.5, p < 0.0001). Response of grain weight to nitrogen averaged -11% with high soil nitrogen and 0.2% for low nitrogen (F1,54 = 48.3, p < 0.0001). The correlation between response of yield and response of test weight to nitrogen fertiliser captured these responses of grain weight: data clustered for locations with low initial soil nitrogen, where test weight responded positively to fertiliser, and locations with low initial nitrogen where test weight mostly reduced in response to fertiliser (Figure 6C).
Grain yield ranged from 0.9 to 18.8 t ha-1 (Figure 1). Across sources of variation, average yield was 11.8 ± 0.17 t ha-1 under irrigation and 10.2 ± 0.13 t ha-1 for rainfed crops (p < 0.0001). Yield response to nitrogen varied from -64 to 736%, with an L-shaped frequency distribution featuring 84% of crops between -24 and 56% (Figure 1). Inset in Figure 1 illustrates the increase in yield from just below 1 t ha-1 in the unfertilised control to 8.1 t ha-1 for crops with 280 kg N ha-1 under rainfed conditions in extremely unfertile sandy soils (86% sand, 3% clay) with 1.25% soil organic matter, and rye as previous crop (Torino et al., 2014). The duration of the critical period varied from 24 to 43 d, and mean temperature during critical period from 18.7 to 27.8°C (Figure 1).
Yield response to nitrogen increased with mean temperature in the critical period at 7.9 ± 1.15%°C-1 for the pooled data (r = 0.22, F1,935 = 47.1, p < 0.0001), with a larger response in rainfed (10.1 ± 1.46%°C-1, r = 0.26, F1,643 = 47.1, p < 0.0001) than irrigated crops (4.6 ± 2.23%°C-1, r = 0.12, F1,291 = 4.2, p = 0.04) (Figure 7A, Table 1). Analysis of residuals of the regression for the pooled data showed larger yield response to nitrogen after cereal compared with crop sequences including legumes (F3,932 = 58.4, p < 0.0001) and no interaction between previous crop and water regime (p = 0.73) (Figure 7B).
The green curves in Figure 7C are the reaction norms of three traits in response to temperature: duration of critical period, canopy carbon exchange rate, and ear-to-biomass ratio; the product of the three traits returns a function that integrates developmental, assimilation, and partitioning responses to temperature (red curve in Figure 7C), and bounds the actual yield response to nitrogen (red curve in Figure 7A).
Yield ranged from 2.7 to 16. 4 t ha-1 (Figure 1). Yield response to nitrogen varied from -32 to 289%, with 83% of crops between 16 and 48% (Figure 1). Yield response to nitrogen was inversely correlated with inorganic soil nitrogen at sowing, which varied from 20 to 354 kg N ha-1, and increased non-linearly with fertiliser rate (Supplementary Figure 5). The duration of the critical period ranged from 24 to 43 d, and mean temperature in the critical period from 19.0 to 30.6°C (Figure 1).
Yield response to nitrogen was highly scattered and weakly, non-linearly associated with mean temperature in the critical period (r = 0.13, F2, 817 = 7.14, p = 0.008; Figure 8A). A quadratic model returned a peak yield response to nitrogen at 23.2°C, with a flat response for temperature below this threshold (slope ~ 0) and a declining yield response to nitrogen with increasing temperature at -4.1%°C-1 for temperature above the threshold (Table 1). The 3-trait curve resulting from the product of duration of critical period, canopy carbon exchange rate and ear-to-biomass ratio (Figure 7C) bounded the actual yield response to nitrogen as a function of temperature (Figure 8A), and the gap between the boundary and actual data was proportional to the amount of inorganic nitrogen in the soil at sowing (r = 0.27, p < 0.0001) and declined with fertiliser rate (r = 0.20, p < 0.0001) (Figures 8B, C). Figure 8D shows the 3-trait curve bounds the pooled data for Argentina and US.
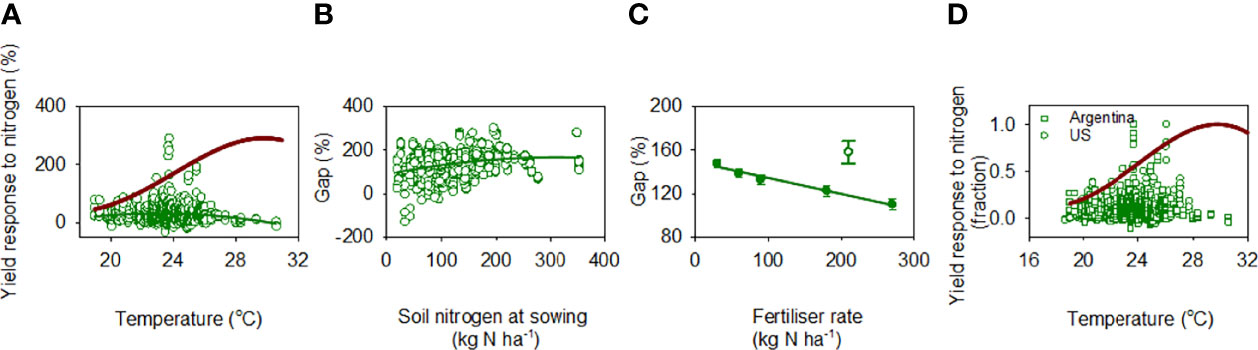
Figure 8 (A) Yield response to nitrogen as a function of mean air temperature in the critical period for rainfed maize in Argentina. Response to nitrogen is: 100 · (YN-Y0)/Y0 where Y is yield, and subscripts indicate fertilised (N) and unfertilised control (0). The green line is a quadratic model fitted to the data. The red line is the 3-trait boundary defined as a function of duration of the critical period, canopy carbon exchange rate and ear-to-biomass ratio (Figure 7C), scaled to the actual maximum. (B) Gap between boundary and actual yield response to nitrogen as a function of soil nitrogen at sowing. (C) Average (± s.e.) gap between boundary and actual yield response to nitrogen as a function of fertiliser rate. The open symbol is a small sample of crops with 210 kg N ha-1, which was not included in the regression. (D) Actual yield response to nitrogen as a function of temperature in the critical period for 1756 crops in Argentina and US against the 3-trait boundary curve.
We frame our discussion on three levels – the crop at the centre of this study (level n), the agronomic context (n+1), and the physiology of the temperature-driven developmental modulation of yield response to nitrogen (n -1) (Passioura, 1979).
In the winter-rainfall environments of Australia, uncertain rainfall and therefore uncertain wheat yield make nitrogen fertilisation a risky investment (Monjardino et al., 2013; Monjardino et al., 2015; Sadras et al., 2016; Meier et al., 2021). Nitrogen mining associated with chronic under-fertilisation has removed between one-fifth and one-quarter of the original soil nitrogen in Australian farmlands (Angus and Grace, 2017). To deal with the recalcitrant problem of matching nitrogen to uncertain seasonal conditions, nitrogen could be managed strategically, for example building soil nitrogen banks, and tactically (Basso et al., 2011; Meier et al., 2021). Tactically, rainfall forecasts have been advanced to guide nitrogen fertilisation with mixed results (Anwar et al., 2008; Moeller et al., 2008; Asseng et al., 2012). Fertiliser recommendations based on measured soil nitrogen have been advanced, but farmer adoption remains low (Peoples et al., 2017). Schut and Giller (2020) have reviewed fertiliser recommendations against errors associated with soil sampling and chemical analysis procedures within and between laboratories. Crop nitrogen status informs fertilisation decisions in Western Australia (Neuhaus and Sadras, 2018). Measurement of crop water status to guide nitrogen application, on its own or associated with measurement of nitrogen status, is incipient (Pancorbo et al., 2021; Cossani and Sadras, 2022).
In Kansas and most of the U.S. central Great Plains, nitrogen is the most limiting nutrient to wheat yield (Raun et al., 1999) and average nitrogen rates in commercial wheat fields are ~2.5-fold those in Australia (Jaenisch et al., 2021; Lawes et al., 2021). Historically, nitrogen fertiliser rate has been determined with a simple framework of expected yield and average grain nitrogen content, i.e., 33 kg N t-1 (Westermann, 1987), crediting NO3-N in the topsoil at sowing (Halvorson et al., 1987; Raun et al., 1999) and organic matter mineralisation (Leikam et al., 2003). High variation in soil NO3-N in space and time (Zhang et al., 1998), which is a crucial determinant of wheat response to nitrogen, constrains this approach. In common to Australia, uncertain environmental conditions compromise the estimation of target yield (Raun et al., 2017). Thus, efforts have shifted to vegetation indices, fertilised strips, and remote sensing for nitrogen management (Solie et al., 2003; Franzen et al., 2016). These methods overlook seasonal conditions (but see Dhillon et al., 2020), and do not consider the interactions between nitrogen and other nutrients (Duncan et al., 2018; Lollato et al., 2019a). Timing of winter wheat fertilisation depends on crop purpose and rotation. Nitrogen may be applied pre-season in widespread dual-purpose wheat crops where both forage and grain are economic (True et al., 2001). For grain-only crops, autumn fertilisation is inefficient (Lollato et al., 2019b). Wheat grown after fallow is usually timely sown and uses nitrogen more efficiently when the application is split between autumn and spring (Mahler et al., 1994; Thomason et al., 2002). Wheat grown after a summer crop is usually sown late, high temperature during the critical period reduces yield potential, and full fertilisation in spring may be more efficient (Lollato et al., 2021).
In the US, rates of nitrogen fertiliser in maize since 1965 have exceeded nutrient removal, but that excess has declined in recent years (Grassini et al., 2015). The steady improvement in yield per unit nitrogen fertiliser since the late 1970s coincides with a decline in the apparent surplus of nitrogen fertiliser (difference between nitrogen input in fertiliser and nitrogen removed with grain), which has narrowed from an average 50-70 kg N ha-1 in 1976-1985 to 10-20 kg N ha-1 in 2001-2010 (Grassini et al., 2015). Regional estimates indicate a slightly positive nitrogen balance in current systems (Fixen et al., 2015; Cassman and Dobermann, 2022) but the risk of excess reactive nitrogen remains a concern (Ciampitti and Lemaire, 2022). Historically, fertiliser recommendations for maize in North America followed a simplified nitrogen balance for a target yield that more recently shifted to an economic optimum nitrogen rate estimated from empirical relations between grain yield and fertiliser rate, and variable rate fertilisation based on vegetation indices (Lory and Scharf, 2003; Kyveryga et al., 2007; Kitchen et al., 2010). These methods do not consider the interaction of nitrogen with water and other nutrients (Ciampitti and Vyn, 2014) and the uncertainty on maize nitrogen needs has not been solved (Raun et al., 2019; Correndo et al., 2021b; Correndo et al., 2021c).
In Argentina, fertiliser use over the last 20 years has increased but remains low-to-medium for world standards (Norton et al., 2015; García and González Sanjuan, 2016). Under fertilisation of grain crops is apparent in soil mining at an estimated rate of 15 to 45 kg N ha-1 yr-1, and higher rates of fertilisation are critical to improving grain yield and the efficiency in the use of water and radiation (Caviglia et al., 2019; Correndo et al., 2021a). Most nitrogen recommendations are based on empirical functions relating grain yield and soil nitrogen (frequently NO3-N in the top 0.6 m) plus nitrogen fertiliser, which provides a critical nitrogen above which the probability of response to fertiliser is low (Pagani et al., 2008; Díaz Valdez et al., 2020; Correndo et al., 2021a). Late-sown maize has spread over the last decade (Otegui et al., 2021b) but fertilisation practices tailored to this system are lagging (Díaz Valdez et al., 2020).
This brief account of nitrogen management in the targeted cropping systems highlights common themes, including the uncertainty in yield where crops rely on seasonal rainfall, spatial and temporal variation in soil nitrogen, interactions with environmental and management factors, and the scarcity of theoretical frameworks to deal with interactions. Theory has been developed to account for the interaction between water and nitrogen and between nutrients (Kho, 2000; Cossani and Sadras, 2018; Kunrath et al., 2018; Kunrath et al., 2020). Theory is lagging for the interaction between nitrogen and temperature, hence the focus of this paper.
Crops accommodate environmental variation mostly through grain number, and grain number is established in a species-specific critical window (Darwin, 1859; Sadras, 2021). The duration of the critical period, together with the growth rate and partition to reproduction, collectively drive grain number and most of the variation in yield (Fischer, 1984; Andrade et al., 2005; Otegui et al., 2021a; Slafer et al., 2021). The relationship between grain number and photothermal quotient, defined as the ratio between crop intercepted radiation and mean air temperature in the critical period, highlights the widespread effect of elevated temperature shortening the critical period and reducing grain number in wheat, maize and other annuals (Fischer, 1985; Islam and Morison, 1992; Magrin et al., 1993; Cantagallo et al., 1997; Didonet et al., 2002; Poggio et al., 2005; Francia et al., 2011; Faraji, 2014). Experimental manipulation of day length to extend/shorten the critical period often increases/reduces grain number (González et al., 2003; Kantolic and Slafer, 2007; Nico et al., 2016). Depending on the setting, other traits may have a dominant influence. For example, growth rate in the critical period was the main driver of grain number and yield of maize in the experiments by Andrade et al. (2002) and of wheat in the experiments by Sadras et al. (2012). Importantly, all three traits – duration of critical period, growth rate and partitioning – vary non-linearly with temperature (Figures 4B, C, 7C).
Yield response to nitrogen was idiosyncratic (Figure 1). Thus, despite the large ranges of yield and yield response to nitrogen associated with agronomically meaningful sources of variation, our results cannot be generalised to “South Australian wheat” or “US maize”; caution is needed. Yield reductions in response to nitrogen fertiliser were identified in all four data sets from -11% for maize in the US to -69% for spring wheat in Australia (Figure 1). For wheat in Australia, the frequency distribution of yield response to nitrogen was fairly symmetrical, with a close-to-zero average. The average yield response to nitrogen for the other three crops varied from 29 to 53%, with long tails in the frequency distribution for maize in both the US and Argentina.
For both spring wheat in South Australia and winter wheat in Kansas under low soil nitrogen, yield response to nitrogen correlated negatively with temperature in the critical period. For wheat grown in a range of temperature from 11 to 29°C, development was more responsive to temperature than carbon assimilation, and carbon assimilation per unit developmental time declined with increasing temperature (Lohraseb et al., 2017). Wheat harvest index declined with increasing temperature from ~10 to 14°C (Batts et al., 1997). Hence, for the range of temperature in our wheat data sets, the reduction in yield response to nitrogen with increasing temperature associated with a shorter critical period, and possibly with a lower rate of assimilation per unit developmental time, and reduced allocation to reproduction.
For winter-wheat in the US, the correlation between yield response to nitrogen fertiliser and temperature shifted from negative to positive depending on initial soil nitrogen (Figures 6B, D). Under low initial soil nitrogen, the response was in the direction of our primary expectation: higher temperature that shortens the critical period reduces yield response to nitrogen. Under high initial soil nitrogen, lower temperature in the critical period favours higher grain number and potentially compromises grain fill, as supported by the cluster of negative response to nitrogen fertiliser of test weight (Figure 6B). Three factors compound this effect: high nitrogen favours early growth with the potential to deplete stored soil water during critical states (van Herwaarden et al., 1998), high temperature during grain fill prevalent in these environments (Tack et al., 2015; Lollato et al., 2017; Bergkamp et al., 2018; Lollato et al., 2020; Couëdel et al., 2021), and the lower amount of reserve carbohydrates associated with high nitrogen (Hoogmoed and Sadras, 2016).
Our analysis indicates that long days can further constrain yield response to nitrogen; direct test of this proposition is needed in factorial experiments combining nitrogen supply and daylength. The relation between yield, yield response to nitrogen and daylength is biologically interesting and agronomically important. In a biological context of plants forecasting environmental conditions (Aphalo and Sadras, 2021), long days signal the end of the season for wheat, which adaptively accelerates development (Ghiglione et al., 2008). Of interest, soybean accelerates reproductive development in response to short days signalling the end of the season (Nico et al., 2016). Higher grain number in wheat with long days and higher pod number in soybean with short days are developmental responses that precede and interact with resource availability (González et al., 2005; Ghiglione et al., 2008; Nico et al., 2016). Agronomically, the developmental effect of daylength on grain set is an overlooked aspect of research on the interaction between genotype and sowing date. In contrast to the historical use of spring wheat in Australia, experiments are exploring the suitability of winter wheat to expand the sowing window in large farms. Winter wheat in Australia has characteristically low harvest index (Porker et al., 2020) that might be partially associated with developmental effects of day length irrespective of resource availability.
For maize in the US and Argentina, the relation between yield response to nitrogen and mean temperature in the critical period was weak. Agronomic and environmental factors including water regime, previous crop and soil nitrogen at sowing overrode the effects of temperature. Consistent with this finding, Correndo et al. (2021b) report a large influence of previous crop on the yield of unfertilised maize yield with a ranking alfalfa > annual legumes > cereals, and negative associations of yield with both spring rainfall and the number days with maximum temperature above 30°C during August-September for both rainfed and irrigated crops.
The large data sets contributed to both the scatter of maize yield response to nitrogen and the low p of the statistical models (Figures 7A, 8A). The positive association between yield response to nitrogen and temperature for maize in the US contrasted with both expectation and observations in wheat. This may relate to the thermal responses of rate of crop growth in the critical period and allocation to reproduction (Otegui et al., 2021a). We tested this proposition using reaction norms relating duration of critical period, canopy carbon exchange rate, and ear-to-shoot ratio with temperature (Figure 7C). For the range of temperature in the US data set, from 18.6 to 27.8°C, we estimate the duration of the critical period was shortened from 1.0 to 0.56 of the maximum, canopy carbon exchange rate increased from 0.47 to 0.95 of maximum, and ear-to-shoot biomass increased from 0.24 to 0.81 of maximum (Figure 7C). Thus, the combined increase in carbon exchange rate and allocation to ear cancelled the effect of shortened critical period, collectively returning a weak positive association between yield response to nitrogen and temperature in the critical period. The product of the three traits returns a trait that integrates development, carbon assimilation, and reproductive allocation central to yield; it peaked at ~ 30°C (red curve in Figure 7C) and bounded the measured yield response to nitrogen as a function of temperature for maize in the US and Argentina individually, and for the pooled data (Figure 8D).
The slope of the regression between yield response to nitrogen and mean temperature in the critical period for maize in the US was twice as large in rainfed than in irrigated crops (Table 1). The interaction between water and nitrogen has been approached from the perspectives of co-limitation (Cossani and Sadras, 2018) and with allometric relations that link capture and efficiency in the use of water and nitrogen (Kunrath et al., 2018; 2020). Kunrath et al. (2018) highlighted a two-fold effect of drought on crop growth: a direct effect whereby crop growth is reduced proportionally to the reduction in transpiration, and an indirect effect mediated by a drought-induced crop nitrogen deficit, quantified as the nitrogen nutrition index. Under drought, sorghum maintained the nitrogen nutrition index and transpiration efficiency (biomass per unit of transpiration) whereas both nitrogen nutrition index and transpiration efficiency declined in drought-stressed maize in comparison to well-watered crops (Kunrath et al., 2020). Our finding of a larger yield response to nitrogen per °C in rainfed crops is thus consistent with a large drought-induced nitrogen deficit in maize. Further, the response of yield to the interaction between water and nitrogen varies with maize hybrid (Ao et al., 2020). Factorial experiments combining hybrids, nitrogen, water, and temperature and reliable quantification of crop nitrogen and water status are needed to further elucidate these higher-order interactions in maize.
The curve relating yield response to nitrogen and mean temperature in the critical period for maize in Argentina was flat for temperature below ~23°C and had a negative slope for higher temperature (Table 1). The reduction in yield response to nitrogen with increasing temperature is consistent with sowing time experiments in Paraná, Argentina (Caviglia et al., 2014), with factorial experiments combining temperature and nitrogen supply (Ordóñez et al., 2015), and with the predictions of the 3-trait curve (Figure 7C). In Paraná, December-sown maize had higher nitrogen nutrition index and lower response to fertiliser (200 kg N ha-1 vs. unfertilised control) than September-sown crops. In addition to the higher amount of available nitrogen at sowing, our analysis suggests that the temperature-driven shortening of the critical period may have contributed to this response. Ordóñez et al. (2015) grew maize under two temperature regimes (unheated control and elevated temperature with closed field chambers) and 2-3 nitrogen rates (unfertilised control, and fertilised with 100 or 200 kg N ha-1); they found temperature-by-nitrogen interaction in three out of four experiments where the reduction in yield with elevated temperature was larger in fertilised crops. Their heated treatments, which reached maximum temperature from mid-30°C to mid-40°C, were in the predicted phase of negative correlation between yield response to nitrogen and temperature (Figure 7C). Qualitatively, the 3-trait curve based on temperature effects on development, carbon assimilation and allocation bounds the actual data. However, there are quantitative mismatchs in two important aspects that warrant further investigation. First, the boundary curve predicts an inflection at ~30°C whereas the data returned an inflection at ~23°C. Second, the boundary predicts a positive phase in the response, whereas the data showed a flat response (i.e., slope ~ 0) below the inflection point in Argentina (Table 1). The positive phase was apparent for maize in the US (Table 1).
Interactions between factors underly the complexity of natural and agricultural systems, and high-order interactions are elusive. Data-driven approaches are favoured to understand interactions, but lagging theory constrains our ability to understand and manipulate the phenotype (Nurse, 2021; Sadras, 2021). Ghiglione et al. (2008) illustrate the insights of hypothesis-driven research, and Lohraseb et al. (2017) and Kim et al. (2007) highlight the importance of reaction norms that link phenotype and environment; these relations are critical to modelling. Owing to the non-linearity of yield response to nitrogen and to the non-linearity of biological processes in response to temperature, the outcome of the interaction between temperature and nitrogen is bound to be range-dependent. We show that “high” nitrogen may be positive, neutral or negative for yield under “high” temperature, depending on the segment of the response curve captured experimentally. We advance a conceptual framework to link the response of grain yield to nitrogen and temperature-driven developmental processes in cereals. The framework is particularly useful where data do not match predictions (Kinraide and Denison, 2003; Porter, 2020); departure from the expected negative correlation between yield response to nitrogen and temperature-driven shortening of the critical period highlighted the dominant role of other physiological processes (assimilation, partitioning) or agronomic factors (water supply, previous crop).
The original contributions presented in the study are included in the article/Supplementary Material. Further inquiries can be directed to the corresponding author.
VS: developed the concept, analysed data, and wrote paper with input from all authors; NG, RL: US wheat data, analysis, and interpretation; AC and IC: US maize data, analysis, and interpretation; CMC: Australia wheat data, analysis, and interpretation; JF and OC: Argentina maize data, analysis, and interpretation. All authors contributed to the article and approved the submitted version.
We thank GRDC-SARDI bilateral for funding (project DAS00166), the Kansas Corn Commission, Kansas State University, the Minnesota Agricultural Fertilizer Research and Education Council, the Minnesota Corn Research and Promotion Council, and the USDA National Institute of Food and Agriculture, and Minnesota Agricultural Experiment Station project MIN-13-097 (Accession No. 218377) for financial support. Contribution no. 22-304-J from the Kansas Agricultural Experiment Station. Furthermore, we thank the Ministerio de Ciencia, Tecnologia e Innovacion (PICT 2018-3584, PICT-2020- SERIEA-01122) and Universidad Nacional de Entre Ríos (PID-UNER 2227) for funding, and Bayer Crop Science, Market Development for the funding of data acquisition.
JF is employed by Bayer Crop Science.
The remaining authors declare that the research was conducted in the absence of any commercial or financial relationships that could be construed as a potential conflict of interest.
All claims expressed in this article are solely those of the authors and do not necessarily represent those of their affiliated organizations, or those of the publisher, the editors and the reviewers. Any product that may be evaluated in this article, or claim that may be made by its manufacturer, is not guaranteed or endorsed by the publisher.
We thank the people and organisations that supported this study. For wheat in Australia: GRDC-SARDI bilateral for funding; Hart Field Site and the Faulkner family for farm facilities; NWilhelm, ZH Chow, J Fernández-López, T Lenz, A O’dea, G Sepúlveda, B Sleep and H Tura for field work; LongReach Plant Breeders and Australian Grain Technologies for seed. For wheat in the US: visiting scholars for data collection and processing, the Kansas Wheat Commission, the Kansas Agricultural Experiment Station, and the Kansas Cooperative Extension Service. For maize in the US: visiting scholars and interns for field work, and Corteva Agriscience, the Kansas Corn Commission, Kansas State University, the Minnesota Agricultural Fertilizer Research and Education Council, the Minnesota Corn Research and Promotion Council, and the USDA National Institute of Food and Agriculture, Minnesota Agricultural Experiment Station for financial support. We thank the Kansas Agricultural Experiment Station for their contributions. For maize in Argentina: the Ministerio de Ciencia, Tecnologia e Innovacion and Universidad Nacional de Entre Ríos for funding, and Bayer Crop Science, Market Development for field work and funding. OPC is a member of CONICET, the National Research Council of Argentina.
The Supplementary Material for this article can be found online at: https://www.frontiersin.org/articles/10.3389/fagro.2022.903340/full#supplementary-material
Andrade F. H., Echarte L., Rizzalli R., Della Maggiora A., Casanovas M. (2002). Kernel Number Prediction in Maize Under Nitrogen or Water Stress. Crop Sci. 42 (4), 1173–1179. doi: 10.2135/cropsci2002.1173
Andrade F. H., Sadras V. O., Vega C. R. C., Echarte L. (2005). Physiological Determinants of Crop Growth and Yield in Maize, Sunflower and Soybean: Their Application to Crop Management, Modelling and Breeding. J. Crop Improvement 14, 51–101. doi: 10.1300/J411v14n01_05
Angus J. F., Grace P. R. (2017). Nitrogen Balance in Australia and Nitrogen Use Efficiency on Australian Farms. Soil Res. 55 (5-6), 435–450. doi: 10.1071/sr16325
Anwar M. R., Rodriguez D., Liu D. L., Power S., O’Leary G. J. (2008). Quality and Potential Utility of ENSO-Based Forecasts of Spring Rainfall and Wheat Yield in South-Eastern Australia. Aust. J. Agric. Res. 59 (2), 112–126. doi: 10.1071/AR07061
Ao S., Russelle M. P., Varga T., Feyereisen G. W., Coulter J. A. (2020). Drought Tolerance in Maize Is Influenced by Timing of Drought Stress Initiation. Crop Sci. 60 (3), 1591–1606. doi: 10.1002/csc2.20108
Aphalo P. J., Sadras V. O. (2021). Explaining Pre-Emptive Acclimation by Linking Information to Plant Phenotype. J. Exp. Bot. doi: 10.1093/jxb/erab537
Asseng S., McIntosh P. C., Wang G., Khimashia N. (2012). Optimal N Fertiliser Management Based on a Seasonal Forecast. Eur. J. Agron. 38, 66–73. doi: 10.1016/j.eja.2011.12.005
Basso B., Ritchie J. T., Cammarano D., Sartori L. (2011). A Strategic and Tactical Management Approach to Select Optimal N Fertilizer Rates for Wheat in a Spatially Variable Field. Eur. J. Agron. 35 (4), 215–222. doi: 10.1016/j.eja.2011.06.004
Batts G. R., Morison J. I. L., Ellis R. H., Hadley P., Wheeler T. R. (1997). Effects of CO2 and Temperature on Growth and Yield of Crops of Winter Wheat Over Four Seasons. Eur. J. Agron. 7 (1-3), 43–52. doi: 10.1016/s1161-0301(97)00022-1
Bergkamp B., Impa S. M., Asebedo A. R., Fritz A. K., Jagadish S. V. K. (2018). Prominent Winter Wheat Varieties Response to Post-Flowering Heat Stress Under Controlled Chambers and Field Based Heat Tents. Field Crops Res. 222, 143–152. doi: 10.1016/j.fcr.2018.03.009
Borghi B. (1999). “Nitrogen as Determinant of Wheat Growth and Yield,” in Wheat Ecology and Physiology of Yield Determination. Eds. Satorre E. H., Slafer G. A. (Binghamton, NY: Food Products Press), 67–84.
Cantagallo J. E., Chimenti C. A., Hall A. J. (1997). Number of Seeds Per Unit Area in Sunflower Correlates Well With a Photothermal Quotient. Crop Sci. 37, 1780–1786. doi: 10.2135/cropsci1997.0011183X003700060020x
Cassman K. G., Dobermann A. (2022). Nitrogen and the Future of Agriculture: 20 Years on. Ambio 51 (1), 17–24. doi: 10.1007/s13280-021-01526-w
Caviglia O. P., Melchiori R. J. M., Sadras V. O. (2014). Nitrogen Utilization Efficiency in Maize as Affected by Hybrid and N Rate in Late-Sown Crops. Field Crops Res. 168, 27–37. doi: 10.1016/j.fcr.2014.08.005
Caviglia O. P., Rizzalli R. H., Monzon J. P., García F. O., Melchiori R. J. M., Martinez J. J., et al. (2019). Improving Resource Productivity at a Crop Sequence Level. Field Crops Res. 235, 129–141. doi: 10.1016/j.fcr.2019.02.011
Ciampitti I. A., Lemaire G. (2022). From Use Efficiency to Effective Use of Nitrogen: A Dilemma for Maize Breeding Improvement. Sci. Total Environ. 826, 154125. doi: 10.1016/j.scitotenv.2022.154125
Ciampitti I. A., Vyn T. J. (2014). Understanding Global and Historical Nutrient Use Efficiencies for Closing Maize Yield Gaps. Agron. J. 106 (6), AGJ2AGRONJ140025. doi: 10.2134/agronj14.0025
Correndo A. A., Gutiérrez-Boem F. H., García F. O., Alvarez C., Álvarez C., Angeli A., et al. (2021a). Attainable Yield and Soil Texture as Drivers of Maize Response to Nitrogen: A Synthesis Analysis for Argentina. Field Crops Res. 273, 108299. doi: 10.1016/j.fcr.2021.108299
Correndo A. A., Rotundo J. L., Tremblay N., Archontoulis S., Coulter J. A., Ruiz-Diaz D., et al. (2021b). Assessing the Uncertainty of Maize Yield Without Nitrogen Fertilization. Field Crops Res. 260, 107985. doi: 10.1016/j.fcr.2020.107985
Correndo A. A., Tremblay N., Coulter J. A., Ruiz-Diaz D., Franzen D., Nafziger E., et al. (2021c). Unraveling Uncertainty Drivers of the Maize Yield Response to Nitrogen: A Bayesian and Machine Learning Approach. Agric. For. Meteorol. 311, 108668. doi: 10.1016/j.agrformet.2021.108668
Cossani C. M., Sadras V. O. (2018). Water-Nitrogen Co-Limitation in Grain Crops. Adv. Agron. 150, 231–274. doi: 10.1016/bs.agron.2018.02.004
Cossani C. M., Sadras V. O. (2021). Nitrogen and Water Supply Modulate the Effect of Elevated Temperature on Wheat Yield. Eur. J. Agron. 124, 126227. doi: 10.1016/j.eja.2020.126227
Cossani C. M., Sadras V. O. (2022). Carbon Isotope Composition for Agronomic Diagnostic: Predicting Yield and Yield Response to Nitrogen in Wheat. Field Crops Res. 279, 108451. doi: 10.1016/j.fcr.2022.108451
Couëdel A., Edreira J. I. R., Pisa Lollato R., Archontoulis S., Sadras V., Grassini P. (2021). Assessing Environment Types for Maize, Soybean, and Wheat in the United States as Determined by Spatio-Temporal Variation in Drought and Heat Stress. Agric. For. Meteorol. 307, 108513. doi: 10.1016/j.agrformet.2021.108513
Darwin C. (1859). On the Origin of Species by Means of Natural Selection or the Preservation of Favoured Races in the Struggle for Life (London: Murray).
Dhillon J. S., Figueiredo B. M., Eickhoff E. M., Raun W. R. (2020). Applied Use of Growing Degree Days to Refine Optimum Times for Nitrogen Stress Sensing in Winter Wheat. Agron. J. 112 (1), 537–549. doi: 10.1002/agj2.20007
Díaz Valdez S. T., García F. O., Caviglia O. P. (2020). Calibración De Umbrales Críticos De Nitrógeno Disponible En El Suelo Para Maíz Tardío En Entre Ríos. Ciencia del Suelo 38, 106–120.
Didonet A. D., Rodrigues O., Mario J. L., Ide F. (2002). Effect of Solar Radiation and Temperature on Grain Number Definition in Maize. Pesquisa Agropecuaria Bras. 37 (7), 933–938. doi: 10.1590/s0100-204x2002000700006
Duncan E. G., O’Sullivan C. A., Roper M. M., Biggs J. S., Peoples M. B. (2018). Influence of Co-Application of Nitrogen With Phosphorus, Potassium and Sulphur on the Apparent Efficiency of Nitrogen Fertiliser Use, Grain Yield and Protein Content of Wheat: Review. Field Crops Res. 226, 56–65. doi: 10.1016/j.fcr.2018.07.010
Faraji A. (2014). Seed Number in Canola (Brassica Napus L.): Effects of Dry Matter, Crop Growth Rate, Temperature, and Photothermal Quotient Around Flowering. Int. Res. J. Appl. Basic Sci. 8, 2168–2175.
Fischer R. A. (1984). “Growth and Yield of Wheat,” in Potential Productivity of Field Crops Under Different Environments. Eds. Smith W. H., Bante S. J. (Los Baños, Philippines: International Rice Research Institute).
Fischer R. A. (1985). Number of Kernels in Wheat Crops and the Influence of Solar Radiation and Temperature. J. Agric. Sci. 105 (2), 447–461. doi: 10.1017/s0021859600056495
Fixen P., Brentrup F., Bruulsema T., Garcia F., Norton R., Zingore S. (2015). “Nutrient/fertilizer Use Efficiency: Measurement, Current Situation and Trends,” in Managing Water and Fertilizer for Sustainable Agricultural Intensification (Paris, France: I. IFA, IPNI, IPI), 1–30.
Francia E., Tondelli A., Rizza F., Badeck F. W., Li Destri Nicosia O., Akar T., et al. (2011). Determinants of Barley Grain Yield in a Wide Range of Mediterranean Environments. Field Crops Res. 120 (1), 169–178. doi: 10.1016/j.fcr.2010.09.010
Franzen D., Kitchen N., Holland K., Schepers J., Raun W. (2016). Algorithms for In-Season Nutrient Management in Cereals. Agron. J. 108 (5), 1775–1781. doi: 10.2134/agronj2016.01.0041
García F. O., González Sanjuan M. F. (2016). “Consumo De Fertilizantes En El Mundo Y En La Argentina,” in Sustentabilidad De Los Agrosistemas Y Uso De Fertilizantes. Ed. Lavado R. S. (Buenos Aires, Argentina: Orientación Grafica Editora-AACS-Fertilizar AC), 61–84.
Ghiglione H. O., Gonzalez F. G., Serrago R., Maldonado S. B., Chilcott C., Curá J. A., et al. (2008). Autophagy Regulated by Day Length Determines the Number of Fertile Florets in Wheat. Plant J. 55 (6), 1010–1024. doi: 10.1111/j.1365-313x.2008.03570.x
Giordano N., Lollato R. (2021). Do Different Wheat Varieties Respond Differently to Nitrogen Rates in Terms of Grain Yield and Grain Protein Concentration in Rates in Terms of Grain Yield and Grain Protein Concentration in Kansas? Kansas Agric. Experiment Station Res. Rep. 7, Article 8.
González F. G., Slafer G. A., Miralles D. J. (2003). Grain and Floret Number in Response to Photoperiod During Stem Elongation in Fully and Slightly Vernalized Wheats. Field Crops Res. 81, 17–27. doi: 10.1016/S0378-4290(02)00195-8
González F. G., Slafer G. A., Miralles D. J. (2005). Floret Development and Survival in Wheat Plants Exposed to Contrasting Photoperiod and Radiation Environments During Stem Elongation. Funct. Plant Biol. 32 (3), 189–197. doi: 10.1071/fp04104
Grassini P., Specht J. E., Tollenaar M., Ciampitti I. A., Cassman K. G. (2015). “High-Yield Mazie-Soybean Cropping Systems in the US Corn Belt,” in Crop Physiology: Applications for Genetic Improvement and Agronomy. Eds. Sadras V. O., Calderini D. F. (San Diego: Academic Press), 17–41.
Halvorson A. D., Alley M. M., Murphy L. S. (1987). “Nutrient Requirements and Fertilizer Use,” in Wheat and Wheat Improvement. 2nd Ed. Agron. Mongr. 13. Ed. Heyne E. G. (Madison, WI: ASA, CSSA, and SSSA), 345–383.
Hoogmoed M., Sadras V. O. (2016). The Importance of Water-Soluble Carbohydrates in the Theoretical Framework for Nitrogen Dilution in Shoot Biomass of Wheat. Field Crops Res. 193, 196–200. doi: 10.1016/j.fcr.2016.04.009
Hunt J. R., Lilley J. M., Trevaskis B., Flohr B. M., Peake A., Fletcher A., et al. (2019). Early Sowing Systems can Boost Australian Wheat Yields Despite Recent Climate Change. Nat. Climate Change 9 (3), 244–24+. doi: 10.1038/s41558-019-0417-9
Islam M. S., Morison J. I. L. (1992). Influence of Solar Radiation and Temperature on Irrigated Rice Grain Yield in Bangladesh. Field Crops Res. 30 (1–2), 13–28. doi: 10.1016/0378-4290(92)90053-C
Jaenisch B. R., Lollato R. P. (2019). Wheat Grain Yield and Protein Response to Nitrogen and Sulfur Rates. Kansas Agric. Experiment Station Res. Rep. 5 (4), 5. doi: 10.4148/2378-5977.7757
Jaenisch B. R., Munaro L. B., Bastos L. M., Moraes M., Lin X., Lollato R. P. (2021). On-Farm Data-Rich Analysis Explains Yield and Quantifies Yield Gaps of Winter Wheat in the U.S. Central Great Plains. Field Crops Res. 272, 108287. doi: 10.1016/j.fcr.2021.108287
Jobbágy E. G., Sala O. E. (2014). The Imprint of Crop Choice on Global Nutrient Needs. Environ. Res. Lett. 9 (8), 84014. doi: 10.1088/1748-9326/9/8/084014
Kantolic A. G., Slafer G. A. (2007). Development and Seed Number in Indeterminate Soybean as Affected by Timing and Duration of Exposure to Long Photoperiods After Flowering. Ann. Bot. 99 (5), 925–933. doi: 10.1093/aob/mcm033
Kho R. M. (2000). On Crop Production and the Balance of Available Resources. Agriculture Ecosyst. Environ. 80 (1-2), 71–85. doi: 10.1016/S0167-8809(00)00135-3
Kimball B. A., Morris C. F., Pinter P. J., Wall G. W., Hunsaker D. J., Adamsen F. J., et al. (2001). Elevated CO2, Drought and Soil Nitrogen Effects on Wheat Grain Quality. N. Phytol. 150 (2), 295–303. doi: 10.1046/j.1469-8137.2001.00107.x
Kim S.-H., Gitz D. C., Sicher R. C., Baker J. T., Timlin D. J., Reddy V. R. (2007). Temperature Dependence of Growth, Development, and Photosynthesis in Maize Under Elevated CO2. Environ. Exp. Bot. 61 (3), 224–236. doi: 10.1016/j.envexpbot.2007.06.005
Kinraide T. B., Denison R. F. (2003). Strong Inference: The Way of Science. Am. Biol. Teacher 65 (6), 419–424. doi: 10.1662/0002-7685(2003)065[0419:Sitwos]2.0.Co;2
Kitchen N. R., Sudduth K. A., Drummond S. T., Scharf P. C., Palm H. L., Roberts D. F., et al. (2010). Ground-Based Canopy Reflectance Sensing for Variable-Rate Nitrogen Corn Fertilization. Agron. J. 102 (1), 71–84. doi: 10.2134/agronj2009.0114
Kunrath T. R., Lemaire G., Sadras V. O., Gastal F. (2018). Water Use Efficiency in Perennial Forage Species: Interactions Between Nitrogen Nutrition and Water Deficit. Field Crops Res. 222, 1–11. doi: 10.1016/j.fcr.2018.02.031
Kunrath T. R., Lemaire G., Teixeira E., Brown H. E., Ciampitti I. A., Sadras V. O. (2020). Allometric Relationships Between Nitrogen Uptake and Transpiration to Untangle Interactions Between Nitrogen Supply and Drought in Maize and Sorghum. Eur. J. Agron. 120, 126145. doi: 10.1016/j.eja.2020.126145
Kyveryga P. M., Blackmer A. M., Morris T. F. (2007). Disaggregating Model Bias and Variability When Calculating Economic Optimum Rates of Nitrogen Fertilization for Corn. Agron. J. 99 (4), 1048–1056. doi: 10.2134/agronj2006.0339
Lake L., Chauhan Y. S., Ojeda J. J., Cossani C. M., Thomas D., Hayman P. T., et al. (2021). Modelling Phenology to Probe for Trade-Offs Between Frost and Heat Risk in Lentil and Faba Bean. Eur. J. Agron. 122, 126154. doi: 10.1016/j.eja.2020.126154
Lawes R., Chen C., Whish J., Meier E., Ouzman J., Gobbett D., et al. (2021). Applying More Nitrogen Is Not Always Sufficient to Address Dryland Wheat Yield Gaps in Australia. Field Crops Res. 262, 108033. doi: 10.1016/j.fcr.2020.108033
Leikam D. F., Lamond R. E., Mengel D. B. (2003). Oil Test Interpretations and Fertilizer Recommendations (Manhattan, Kansas, US: Kansas St. Univ. Agric. Exp. Stat. Coop. Ext. Serv. MF-2586).
Lohraseb I., Collins N. C., Parent B. (2017). Diverging Temperature Responses of CO2 Assimilation and Plant Development Explain the Overall Effect of Temperature on Biomass Accumulation in Wheat Leaves and Grains. AoB Plants. 9 doi: 10.1093/aobpla/plw092
Lollato R. P., Bavia G. P., Perin V., Knapp M., Santos E. A., Patrignani A., et al. (2020). Climate-Risk Assessment for Winter Wheat Using Long-Term Weather Data. Agron. J. 112 (3), 2132–2151. doi: 10.1002/agj2.20168
Lollato R. P., Edwards J. T., Ochsner T. E. (2017). Meteorological Limits to Winter Wheat Productivity in the U.S. Southern Great Plains. Field Crops Res. 203, 212–226. doi: 10.1016/j.fcr.2016.12.014
Lollato R. P., Figueiredo B. M., Dhillon J. S., Arnall D. B., Raun W. R. (2019a). Wheat Grain Yield and Grain-Nitrogen Relationships as Affected by N, P, and K Fertilization: A Synthesis of Long-Term Experiments. Field Crops Res. 236, 42–57. doi: 10.1016/j.fcr.2019.03.005
Lollato R. P., Jaenisch B. R., Silva S. R. (2021). Genotype-Specific Nitrogen Uptake Dynamics and Fertilizer Management Explain Contrasting Wheat Protein Concentration. Crop Sci. 61 (3), 2048–2066. doi: 10.1002/csc2.20442
Lollato R. P., Ruiz Diaz D. A., Dewolf E., Knapp M., Peterson D. E., Fritz A. K. (2019b). Agronomic Practices for Reducing Wheat Yield Gaps: A Quantitative Appraisal of Progressive Producers. Crop Sci. 59 (1), 333–350. doi: 10.2135/cropsci2018.04.0249
Lory J. A., Scharf P. C. (2003). Yield Goal Versus Delta Yield for Predicting Fertilizer Nitrogen Need in Corn. Agron. J. 95 (4), 994–999. doi: 10.2134/agronj2003.9940
Magrin G. O., Hall A. J., Baldy C., Grondona M. O. (1993). Spatial and Interannual Variations in the Photothermal Quotient: Implications for the Potential Kernel Number of Wheat Crops in Argentina. Agric. For. Meteorol. 67, 29–41. doi: 10.1016/0168-1923(93)90048-M
Mahler R. L., Koehler F. E., Lutcher L. K. (1994). Nitrogen Source, Timing of Application, and Placement: Effects on Winter Wheat Production. Agron. J. 86 (4), 637–642. doi: 10.2134/agronj1994.00021962008600040010x
Meier E. A., Hunt J. R., Hochman Z. (2021). Evaluation of Nitrogen Bank, a Soil Nitrogen Management Strategy for Sustainably Closing Wheat Yield Gaps. Field Crops Res. 261, 108017. doi: 10.1016/j.fcr.2020.108017
Miglietta F., Giuntoli A., Bindi M. (1996). The Effect of Free Air Carbon Dioxide Enrichment (FACE) and Soil Nitrogen Availability on the Photosynthetic Capacity of Wheat. Photosynthesis Res. 47 (3), 281–290. doi: 10.1007/bf02184288
Moeller C., Smith I., Asseng S., Ludwig F., Telcik N. (2008). The Potential Value of Seasonal Forecasts of Rainfall Categories–Case Studies From the Wheatbelt in Western Australia’s Mediterranean Region. Agric. For. Meteorology 148 (4), 606–618. doi: 10.1016/j.agrformet.2007.11.004
Monjardino M., McBeath T. M., Brennan L., Llewellyn R. S. (2013). Are Farmers in Low-Rainfall Cropping Regions Under-Fertilising With Nitrogen? A Risk Analysis. Agric. Syst. 116), 37–51. doi: 10.1016/j.agsy.2012.12.007
Monjardino M., McBeath T., Ouzman J., Llewellyn R., Jones B. (2015). Farmer Risk-Aversion Limits Closure of Yield and Profit Gaps: A Study of Nitrogen Management in the Southern Australian Wheatbelt. Agric. Syst. 137 (0), 108–118. doi: 10.1016/j.agsy.2015.04.006
Neuhaus A., Sadras V. O. (2018). Relationship Between Rainfall-Adjusted Nitrogen Nutrition Index and Yield of Wheat in Western Australia. J. Plant Nutr. 41, 2637–2643. doi: 10.1080/01904167.2018.1527934
Nico M., Mantese A. I., Miralles D. J., Kantolic A. G. (2016). Soybean Fruit Development and Set at the Node Level Under Combined Photoperiod and Radiation Conditions. J. Exp. Bot. 67 (1), 365–377. doi: 10.1093/jxb/erv475
Norton R., Davidson E., Roberts T. L. (2015). Nitrogen Use Efficiency and Nutrient Performance Indicators. GPNM Task Team Report and Recommendations. Technical Paper 01/2015. GPNM (Washington, DC, USA: Global Partnership on Nutrient Management).
Nurse P. (2021). Biology Must Generate Ideas as Well as Data. Nature 597 (7876), 305–305. doi: 10.1038/d41586-021-02480-z
Ordóñez R. A., Savin R., Cossani C. M., Slafer G. A. (2015). Yield Response to Heat Stress as Affected by Nitrogen Availability in Maize. Field Crops Res. 183, 184–203. doi: 10.1016/j.fcr.2015.07.010
Otegui M. E., Cirilo A. G., Uhart S. A., Andrade F. H. (2021a). “Maize,” in Crop Physiology: Case Studies in Major Crops. Eds. Sadras V. O., Calderini D. F. (San Diego, US: Academic Press).
Otegui M. E., Riglos M., Mercau J. L. (2021b). Genetically Modified Maize Hybrids and Delayed Sowing Reduced Drought Effects Across a Rainfall Gradient in Temperate Argentina. J. Exp. Bot. 72 (14), 5180–5188. doi: 10.1093/jxb/erab139
Pagani A., Echeverria H., Sainz Rozas H. R., Barbieri P. (2008). Economic Optimal Nitrogen Rate for Corn Under No-Tillage in Southeast Buenos Aires Province. Ciencia del Suelo 26, 183–193.
Pancorbo J. L., Camino C., Alonso-Ayuso M., Raya-Sereno M. D., Gonzalez-Fernandez I., Gabriel J. L., et al. (2021). Simultaneous Assessment of Nitrogen and Water Status in Winter Wheat Using Hyperspectral and Thermal Sensors. Eur. J. Agron. 127, 126287. doi: 10.1016/j.eja.2021.126287
Patrignani A., Knapp M., Redmond C., Santos E. (2020). Technical Overview of the Kansas Mesonet. J. Atmospheric Oceanic Technol. 37, 2167–2183. doi: 10.1175/JTECH-D-19-0214.1
Peoples M. B., Swan A. D., Goward L., Kirkegaard J. A., Hunt J. R., Li G. D., et al. (2017). Soil Mineral Nitrogen Benefits Derived From Legumes and Comparisons of the Apparent Recovery of Legume or Fertiliser Nitrogen by Wheat. Soil Res. 55 (6), 600. doi: 10.1071/sr16330
Poggio S. L., Satorre E. H., Dethiou S., Gonzalo G. M. (2005). Pod and Seed Numbers as a Function of Photothermal Quotient During the Seed Set Period of Field Pea (Pisum Sativum) Crops. Eur. J. Agron. 22 (1), 55–69. doi: 10.1016/j.eja.2003.12.003
Porker K., Straight M., Hunt J. R. (2020). Evaluation of G × E × M Interactions to Increase Harvest Index and Yield of Early Sown Wheat. Front. Plant Sci. 11. doi: 10.3389/fpls.2020.00994
Porter J. R. (2020). Agronomy: The Science of Food Production. Front. Agron. 2. doi: 10.3389/fagro.2020.614861
Rattalino Edreira J. I., Budakli Carpici E., Sammarro D., Otegui M. E. (2011). Heat Stress Effects Around Flowering on Kernel Set of Temperate and Tropical Maize Hybrids. Field Crops Res. 123 (2), 62–73. doi: 10.1016/j.fcr.2011.04.015
Raun W. R., Dhillon J., Aula L., Eickhoff E., Weymeyer G., Figueirdeo B., et al. (2019). Unpredictable Nature of Environment on Nitrogen Supply and Demand. Agron. J. 111 (6), 2786–2791. doi: 10.2134/agronj2019.04.0291
Raun W., Figueiredo B., Dhillon J., Fornah A., Bushong J., Zhang H., et al. (2017). Can Yield Goals Be Predicted? Agron. J. 109 (5), 2389–2395. doi: 10.2134/agronj2017.05.0279
Raun W. R., Johnson G. V., Westerman R. L., Hattey J. A. (1999). “Wheat Production in the Great Plains of North America,” in Wheat: Ecology and Physiology of Yield Determination. Eds. Satorre E. H., Slafer G. A. (Binghamton, NY: Food Products Press), 263–275.
ReTAA (2021). Relevamiento De Tecnologia Agricola Aplicada. Informe Mensual No 51. (Buenos Aires, Argentina: Bolsa de Cereales de Buenos Aires).
Ritchie S. W., Hanway J. J., Benson G. O. (1986). How a Corn Plant Develops Special Report Vol. 48 (Iowa, US: Iowa State University of Science and Technology), 21.
Sadras V. O. (2021). Evolutionary and Ecological Perspectives on the Wheat Phenotype. Proc. R. Soc. B: Biol. Sci. 288 (1958), 20211259. doi: 10.1098/rspb.2021.1259
Sadras V. O., Calderini D. F., Connor D. J. (2009). “Sustainable Agriculture and Crop Physiology,” in Crop Physiology: Applications for Genetic Improvement and Agronomy. Eds. Sadras V. O., Calderini D. F. (San Diego: Academic Press), 1–20.
Sadras V. O., Dreccer M. F. (2015). Adaptation of Wheat, Barley, Canola, Field Pea and Chickpea to the Thermal Environments of Australia. Crop Pasture Sci. 66 (11), 1137–1150. doi: 10.1071/CP15129
Sadras V. O., Hayman P. T., Rodriguez D., Monjardino M., Bielich M., Unkovich M., et al. (2016). Interactions Between Water and Nitrogen in Australian Cropping Systems: Physiological, Agronomic, Economic, Breeding and Modelling Perspectives. Crop Pasture Sci. 67, 1019–1053. doi: 10.1071/CP16027
Sadras V. O., Lawson C., Hooper P., McDonald G. K. (2012). Contribution of Summer Rainfall and Nitrogen to the Yield and Water Use Efficiency of Wheat in Mediterranean-Type Environments of South Australia. Eur. J. Agron. 36, 41–54. doi: 10.1016/j.eja.2011.09.001
Sadras V. O., Richards R. A. (2014). Improvement of Crop Yield in Dry Environments: Benchmarks, Levels of Organisation and the Role of Nitrogen. J. Exp. Bot. 65 (8), 1981–1995. doi: 10.1093/jxb/eru061
Schut A. G. T., Giller K. E. (2020). Soil-Based, Field-Specific Fertilizer Recommendations Are a Pipe-Dream. Geoderma 380, 114680. doi: 10.1016/j.geoderma.2020.114680
Slafer G. A., Savin R. (2018). Can N Management Affect the Magnitude of Yield Loss Due to Heat Waves in Wheat and Maize? Curr. Opin. Plant Biol. 45, 276–283. doi: 10.1016/j.pbi.2018.07.009
Slafer G. A., Savin R., Pinochet D., Calderini D. (2021). “Wheat,” in Crop Physiology: Case Histories for Major Crops. Eds. Sadras V. O., Calderini D. F. (San Diego, US: Academic Press), 99–163.
Solie J. B., Stone M. L., Raun W. R., Johnson G. V., Freeman K., Mullen R., et al. (2003). “Real-Time Sensing and N Fertilization With a Field Scale Greenseeker™ Applicator,” in Proceedings of the 6th International Conference on Precision Agriculture and Other Precision Resources Management, 14-17 July 2002: American Society of Agronomy), 1546–1556.
Sparks A. (2018). Nasapower: A NASA POWER Global Meteorology, Surface Solar Energy and Climatology Data Client for R. J. Open Source Softw. 3(30) 1035. doi: 10.21105/joss.01035
Stephenson A. G. (1981). Flower and Fruit Abortion: Proximate Causes and Ultimate Functions. Annu. Rev. Ecol. System. 12, 253–279. doi: 10.1146/annurev.es.12.110181.001345
Tack J., Barkley A., Nalley L. L. (2015). Effect of Warming Temperatures on US Wheat Yields. Proc. Natl. Acad. Sci. 112 (22), 6931–6936. doi: 10.1073/pnas.1415181112
Thomason W. E., Raun W. R., Johnson G. V., Freeman K. W., Wynn K. J., Mullen R. W. (2002). Production System Techniques to Increase Nitrogen Use Efficiency in Winter Wheat*. J. Plant Nutr. 25 (10), 2261–2283. doi: 10.1081/pln-120014074
Thornton P. E., Thornton M., Mayer B., Wei Y., Devarakonda R., Vose R., et al. (2019). Daymet: Daily Surface Weather Data on a 1-Km Grid for North America, Version3 (Oak Ridge, Tennessee, USA: ORNL DAAC). Available at: https://daymet.ornl.gov.
Torino M. S., Ortiz B. V., Fulton J. P., Balkcom K. S., Wood C. W. (2014). Evaluation of Vegetation Indices for Early Assessment of Corn Status and Yield Potential in the Southeastern United States. Agron. J. 106 (4), 1389–1401. doi: 10.2134/agronj13.0578
True R. R., Epplin F. M., Krenzer W. G., Horn G. W. (2001). A Survey of Wheat Production and Wheat Forage Use Practices in Oklahoma. B-815 (Okla. Coop. Ext. Serv., Stillwater, OK: Oklahoma Agricultural Experiment Station).
van Herwaarden A. F., Farquhar G. D., Angus J. F., Richards R. A., Howe G. N. (1998). ‘Haying-Off’, the Negative Grain Yield Response of Dryland Wheat to Nitrogen Fertiliser I. Biomass, Grain Yield, and Water Use. Aust. J. Agric. Res. 49 (7), 1067–1082. doi: 10.1071/A97039
Westermann R. L. (1987). “Soil Reaction-Acidity, Alkalinity, and Salinity,” in Wheat and Wheat Improvement. 2nd Ed. Agron. Mongr. 13. Ed. Heyne E. G. (Madison, WI: ASA, CSSA, and SSSA), 340–344.
Woltereck R. (1909). Weitere Experimentelle Vntersuchungen Iiber Artverandenmg, Spcziell Fiber Das Wesen Quantitativer Artunterschiede Bei Daphniden. Verhandlungen der Deutschen Zoologischen Gesellschaft 19, 110–172.
Zadoks J. C., Chang T. T., Konzak C. F. (1974). A Decimal Code for the Growth Stages of Cereals. Weed Res. 14, 415–421. doi: 10.1111/j.1365-3180.1974.tb01084.x
Zhang H., Johnson G., Krenzer G., Gribble R. (1998). Soil Testing for an Economically and Environmentally Sound Wheat Production. Commun. Soil Sci. Plant Anal. 29 (11-14), 1707–1717. doi: 10.1080/00103629809370061
Zhang W., Zheng C., Song Z., Deng A., He Z. (2015). “Farming Systems in China: Innovations for Sustainable Crop Production,” in Crop Physiology: Applications for Genetic Improvement and Agronomy, 2nd ed. Eds. Sadras V. O., Calderini D. F. (San Diego: Academic Press), 43–64.
Keywords: allocation, daylength, development, critical period, fertiliser, growth rate, reaction norm, stress
Citation: Sadras VO, Giordano N, Correndo A, Cossani CM, Ferreyra JM, Caviglia OP, Coulter JA, Ciampitti IA and Lollato RP (2022) Temperature-Driven Developmental Modulation of Yield Response to Nitrogen in Wheat and Maize. Front. Agron. 4:903340. doi: 10.3389/fagro.2022.903340
Received: 24 March 2022; Accepted: 13 May 2022;
Published: 27 June 2022.
Edited by:
Pratap Bhattacharyya, ICAR-NRRI, IndiaCopyright © 2022 Sadras, Giordano, Correndo, Cossani, Ferreyra, Caviglia, Coulter, Ciampitti and Lollato. This is an open-access article distributed under the terms of the Creative Commons Attribution License (CC BY). The use, distribution or reproduction in other forums is permitted, provided the original author(s) and the copyright owner(s) are credited and that the original publication in this journal is cited, in accordance with accepted academic practice. No use, distribution or reproduction is permitted which does not comply with these terms.
*Correspondence: Victor O. Sadras, dmljdG9yLnNhZHJhc0BzYS5nb3YuYXU=
Disclaimer: All claims expressed in this article are solely those of the authors and do not necessarily represent those of their affiliated organizations, or those of the publisher, the editors and the reviewers. Any product that may be evaluated in this article or claim that may be made by its manufacturer is not guaranteed or endorsed by the publisher.
Research integrity at Frontiers
Learn more about the work of our research integrity team to safeguard the quality of each article we publish.