 Angamuthu Manikandan
 Desouza Blaise
 Sudarshan Dutta
 T. Satyanarayana3
- 1Department of Crop Production, ICAR-Central Institute for Cotton Research, Nagpur, India
- 2Department of Soil Science, Mohammed VI Polytechnic University, Ben Guerir, Morocco
- 3K+S, Dubai, United Arab Emirates
Low cotton productivity in the rainfed cotton grown in central India is attributed to abiotic (water and nutrients) and biotic (insect pests and diseases) stress. Nutrient stress can be overcome by providing nutrients in right amounts and at the right time when the plant needs the most. Field studies in cereal crops have demonstrated fertilizer recommendations by using the Nutrient Expert® (NE) decision support system to improve crop yields. However, such information in the case of the commercial crop, cotton, is scarce. Therefore, on-farm trials were conducted in three districts of Maharashtra, India during 2018–2020 with the hypothesis that the NE-based fertilizer recommendation would lead to higher cotton productivity and savings in fertilizer. Averaged over two seasons and locations, lint yield was significantly greater in the NE based than the recommended dose of fertilizer (RDF), soil test crop response (STCR), and farmers' practice (FP). Internal utilization efficiency (IE) did not differ among treatments for N (4.8 to 5.9 kg lint kg−1 nutrient uptake) and K (6.7 to 7.2 kg lint kg−1 nutrient uptake). With regard to the fertilizer P applied, the FP treatment had the least IE (17.0 kg lint kg−1 nutrient uptake) and was significantly lower than the other treatments. Partial nutrient balance (PNB) did not vary among treatments for applied fertilizer N. The FP treatment had PNB < 1 in case of fertilizer P and ~20 in the case of fertilizer K. This indicates farmers applied excess of P fertilizers. On the other hand, farmers in the region applied very small amount of K. Although the NE treatment had the highest cost of cultivation, net returns were the greatest followed by the STCR and RDF treatments. Our studies demonstrate that the NE-based fertilizer recommendation is not only productive, but also profitable.
Introduction
Cotton (Gossypium spp.) is the major fiber crop of the semi-arid tropics of central India. The crop is cultivated on more than 7 million hectares that is predominantly rain dependent (Blaise et al., 2014). However, severe biotic and abiotic stresses were attributed to the low lint yields in this part of world. To overcome the insect pest problems, high yielding transgenic Bt cotton hybrids with yield potential ranging from 1,000 to 1,500 kg lint ha−1 were released. But, the region has an average lint yield of 495 kg ha−1. Soil infertility, apart from water, is a major limiting factor affecting cotton crop growth and yield. To provide adequate nutrition, economic optimum doses of nitrogen (N), phosphorus (P), and potassium (K) were worked out on research stations and recommended to the cotton producers (Kairon and Venugopalan, 1999). Balanced fertilizer application was emphasized to improve crop productivity and minimize negative nutrient balance (Blaise, 2006). The concept of the 4R Nutrient Stewardship (right source, right amount, right time, and right method) became an integral part of the best nutrient management practices (IPNI, 2012). Split application balanced fertilizer application along with integrated nutrient management strategies improved cotton productivity (Blaise et al., 2016; Reddy et al., 2016). The recommended dose of fertilizer (RDF) strategy was developed based on the nutrient response of crops to fertilizer nutrients on research station experiments. Presently, in India, these recommendations are provided as an advisory to farmers. It is a useful approach and the only available agronomic guideline for a large number of smallholder farmers of India. However, this approach does not have the capacity to cater the need for farmers at individual and farm levels. Thus, advanced nutrient management tools to provide field-and farmer-specific nutrient management protocols were being developed. Due to yield stagnation, farmers began to apply 1.5 times or more of nitrogenous and phosphate fertilizers than the RDF with an intention that higher application of nutrients would get translated into higher yield levels (Blaise et al., 2016). But, this did not happen, as evident from the stagnating cotton productivity of ca. 500 kg lint ha−1. Furthermore, fertilizers contributed to 10% increase in the cost of cultivation mainly due to increased fertilizer costs (~233%) and declining factor productivity (Reddy et al., 2018). The concept of soil test crop response (STCR) was promoted in field crops because RDF did not consider the soil nutrient supply. The STCR was conceptualized by Ramamoorthy and Narasimham (1967) based on the targeted crop yield and soil nutrient supply. This was experimented upon at various locations in the country. The fertilizer rates calculated by using the STCR equations were greater than the RDF. This was probably because the STCR equations did not consider plant aspects such as the nutrient requirement and the yield potential of the crop cultivar/hybrid. To offset the problem of an imbalance in nutrient application, researchers successfully used the concept of 4R Nutrient Stewardship (Dutta et al., 2020). The site-specific nutrient management (SSNM) based on the Quantitative Evaluation of the Fertility of Tropical Soils (QUEFTS) model was proposed. It was found to be effective in improving yield of cereal crops (Witt et al., 1999; Pampolino et al., 2012; Chuan et al., 2013; Xu et al., 2013). However, large-scale implementation of SSNM strategy on field of farmers is still not achieved because extension functionaries and producers perceive SSNM as a complex approach (Pampolino et al., 2012). The International Plant Nutrition Institute (IPNI) developed the Nutrient Expert® (NE), an interactive computer-based decision support tool, to provide fertilizer recommendations (Pampolino et al., 2012) based on the guidelines of SSNM. The location-specific fertilizer recommendations done by the NE do not require a lot of data as many decision support tools, which could overwhelm the user (Pampolino et al., 2012). For instance, the SSNM needs data from nutrient omission plots; but, in the case of the NE, parameters can be estimated by using proxy information. The software was developed for cereal crops in collaboration with the National Agricultural Research and Extension System of India and International Organizations such as the International Maize and Wheat Improvement Centre (CIMMYT). The software-based fertilizer prescriptions lead to improvements in the overall farmer profitability and minimized environmental hazards (Sapkota et al., 2014). The NE was validated on fields of farmers and was reported to improve yields of rice (Oryza sativa L), wheat (Triticum aestivum L.), maize (Zea mays L.), (Dutta et al., 2020), soybean (Glycine max Merril.), and other field crops (Satyanarayana et al., 2013).
Presently, no information is available whether the NE-based fertilizer schedule can be applied to rainfed cotton. Moreover, limited research has been published on the nutrient use efficiency (NUE) of cotton and available studies are more skewed toward N (Bronson, 2008; Rochester, 2011). To develop better nutrient management strategies for cotton, it is essential to have a better understanding of the NUE. Dobermann (2007) provided details of several expressions to quantify the NUE. For estimating the use efficiency such as the agronomic efficiency and recovery efficiency of nutrients, the establishment of control plots is needed. This study was conducted on fields of farmers, wherein nutrient omission plots were not established. Thus, in this study, we report on the partial factor productivity (PFP), internal utilization efficiency (IE), and partial nutrient balance (PNB). We conducted this study with the hypothesis that the NE-based fertilizer recommendation would lead to higher cotton productivity and savings in fertilizer may lead to reduction in production cost.
On-farm trials were conducted with the following objectives: (i) to study the effect of the NE-based fertilizer recommendation vis-à-vis the existing blanket fertilizer recommendation and the prevalent farmers' practice (FP) on the productivity and total nutrient uptake at harvest; (ii) to determine the effects of nutrient management on the partial factor productivity, internal utilization efficiency, and partial nutrient balance of N, P, K; and (iii) to determine the economics.
Materials and Methods
Study Site
This study was conducted on fields of farmers in Amravati, Wardha, and Nagpur districts of Maharashtra, India (Figure 1) during 2018–2020. The region represents the rainfed cotton production system of central India having a similar soil type. The region has hot and dry summer season and humid moist rainy season during the months of June–July to September. The rainfall received during the 2018–2019 and 2019–2020 is provided in Supplementary Figure 1. Total rainfall in 2018 was less than the normal, while rainfall amounts received in 2019 were greater than the normal rainfall at all the locations.
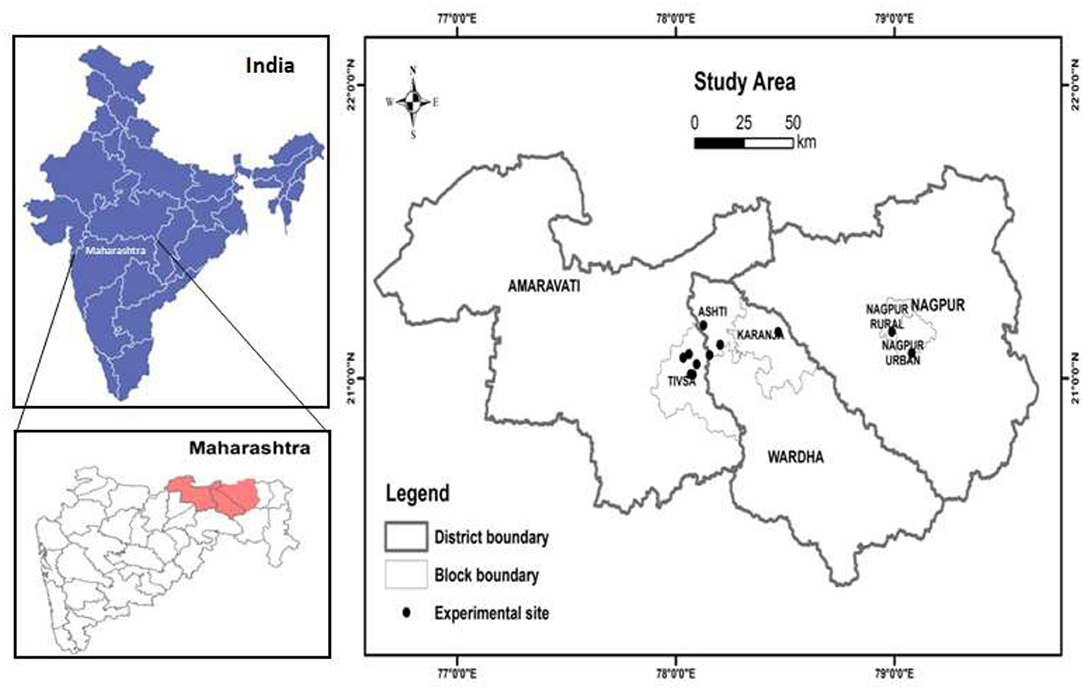
Figure 1. Location map of the study area.
Initial georeferenced soil samples were collected before the start of the experiments to determine the soil fertility status. Based on the soil analysis, the soils on the farmer fields varied in texture. Soils were moderately alkaline in reaction (pH 7.5 to 8.2), non-saline (0.22 to 0.4 dS m−1), and having low organic C (4.0 to 4.9 g kg−1). Available N, 0.5 M Olsen extractable P, and 1 N ammonium acetate exchangeable K varied from 125 to 250, 8 to 16, and 750 to 920 kg ha−1, respectively, indicating low, medium, and high availability status (Prasad, 1996). The mean values, averaged over locations, of the various soil chemical properties are provided in Table 1.
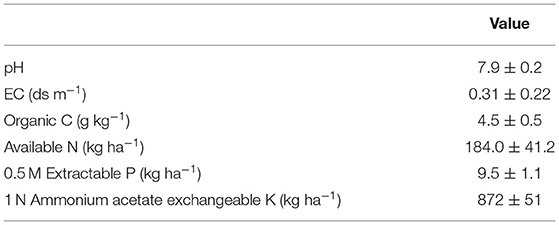
Table 1. Soil physicochemical properties (averaged across locations).
Treatments
Four treatments were evaluated on the fields of farmers, namely, the FP-, RDF-, STCR-, and NE-based fertilizer schedule. Each treatment plot was ~1,000 m2. The FP treatment was the practice prevalent in the region. It varied from location to location depending on resource availability, knowledge, and information (Supplementary Table 1). The RDF treatment based on the response studies comprised application of 90 kg N, 19 kg P, and 37 kg K ha−1. The entire P and K was applied at the time of sowing, while N was applied in three split doses, half at the time of sowing and the remaining in two equal splits coinciding with the square (45–50 days after sowing) and boll formation stages (75–90 days after sowing) of cotton. Fertilizer doses in the STCR treatment (Supplementary Table 2) was based on the soil test values to obtain the targeted yield of 1,000 kg lint ha−1. In the NE treatment, fertilizer amounts were calculated by using the NE software with a yield target of 1,100 kg lint ha−1. The details of the algorithm and scientific principles of the NE are explained by Pampolino et al. (2012). The NE-based fertilizer doses varied for each location and are mentioned in Supplementary Table 2. In the NE treatment, N was applied in four split doses, half at 10–15 days after emergence, and the rest in three equal split doses at the pin-head square formation, flowering, and peak boll formation stages.
Growth, Lint Yield, and Fiber Quality
Plant Morphological Attributes
Five plants were tagged in each treatment plot to record the observations. Plant height was recorded from the cotyledonary node (zero node) to the plant terminal. At boll formation, number of monopodia and sympodia was recorded. In the second year of this study, leaf area index (LAI) was determined at the boll formation stage when the growth was at its maximum. At the same time, Soil and Plant Analysis Development (SPAD) chlorophyll meter readings were also recorded. Boll number and the average boll weight were also recorded at the time of harvest.
Lint Yield and Fiber Quality
The seed cotton was handpicked, three times during November, December, and January from each treatment plot separately. The seed cotton from the three picks was pooled to obtain the total seed cotton harvested. A portion of the seed cotton sample was ginned to separate the lint from the cotton seed. Lint yield was obtained by multiplying the ginning percentage with the seed cotton yield. The fiber samples were analyzed by using High Volume Instrument at the Ginning Training Center, Nagpur to determine the fiber length, strength, micronaire, and uniformity.
Nutrient Uptake
Five plants were carefully uprooted at harvest from each treatment plot at every location and plant dry matter was estimated following oven drying at 65°C. These oven-dried samples collected at harvest were powdered by using a Wiley mill and then analyzed for N, P, and K following standard procedures (Prasad, 1996). Nutrient uptake was determined by multiplying the nutrient content with the plant biomass.
Nutrient Use Efficiency
Several terms of expressions are available for measuring the NUE. However, we restrict to some expressions that could be estimated based on the available data. The PFP, a simple production efficiency expression (Eq. 1), is expressed as lint yield per unit of nutrient applied (Prasad and Shivay, 2016).
Internal utilization efficiency is defined as the yield in relation to total nutrient uptake (Eq. 2). It varies with genotype, environment, and management (Rochester, 2011). PNB is the simplest form of nutrient recovery efficiency. It is a ratio of the crop uptake to amount of nutrient applied and was calculated by using Eq. 3.
Estimation of Fertilizer Costs and Income From Crop Yield
All the agronomic practices were common, except for the fertilizer application. The prevailing market prices of the inputs were taken into account to calculate the cultivation costs. The price at which the seed cotton was sold in the market yard was used to calculate the returns. We used investment on fertilizers to make treatment pair comparisons of the added costs, added returns, and the incremental benefit-to-cost (BC) ratio (Gomez and Gomez, 1984).
Statistical Analyses
Data were statistically analyzed by using the ANOVA technique. Pooled analysis of the data pooled over years and locations were done by using the computer based statistical software package MSTAT-C (Model No. 15) developed by the Crop and Soil Sciences Department of Michigan State University. Mean values were separated by using least significant difference at 5% probability (Gomez and Gomez, 1984).
Results
Plant Growth, Lint Yield, and Fiber Quality
Plant height was not affected by the nutrient management practices in 2018–2019. However, in 2019–2020, the STCR treatments had significantly taller plants than the FP, RDF, and NE treatments at 135, 150, and 180 days after sowing (Supplementary Table 3). The NE treatment had significantly taller plants than the RDF and was similar to those of the FP treatment. The STCR treatment had the highest LAI and was significantly greater than the FP and RDF treatments. The STCR and NE treatments did not differ. The NE treatment had LAI equivalent to the FP and RDF treatments (Table 2). The maximum number of bolls m−2 was recorded in the NE treatment and was significantly greater than the other treatments in 2018–2019. In the year 2019–2020, the NE and STCR treatments had more bolls, but did not differ with the RDF. The boll numbers were the least in the FP treatment and similar to the RDF treatment. The individual boll weight did not differ among the treatments in both the years of the study (Table 2).
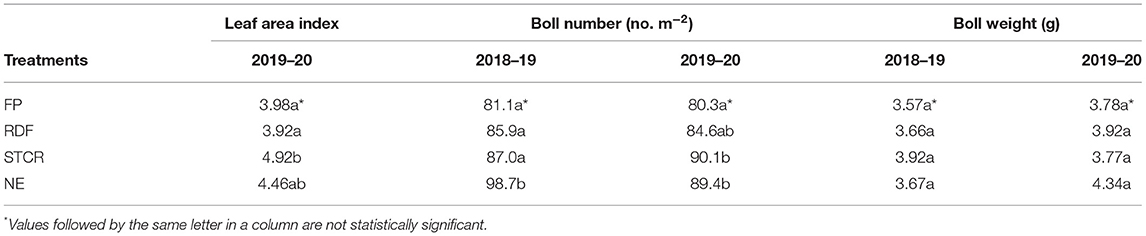
Table 2. Effect of nutrient management practices on leaf area index (LAI), boll number, and boll weight.
Among the treatments, in both the years, the NE treatment had the highest lint yield. In 2018–2019, the NE treatment had significantly greater lint yield followed by the STCR and RDF treatment. Lint yield was least in the FP treatment. In 2019–2020, the differences between the NE and STCR treatments were not significant. Lint yield data for the two seasons pooled over years and locations showed highly significant differences among treatments and locations. Summary of the ANOVA is provided in Supplementary Table 4. Averaged over the years, lint yield was the greatest in the NE treatment (1,014 kg ha−1) and was significantly greater than the rest of the treatments (Figure 2). The trend followed was NE > STCR = RDF > FP. Lint yield varied across locations and the location effects were highly significant. Average lint yield of the 10 locations is presented in Supplementary Table 5. The interaction of the treatment × years was not significant.
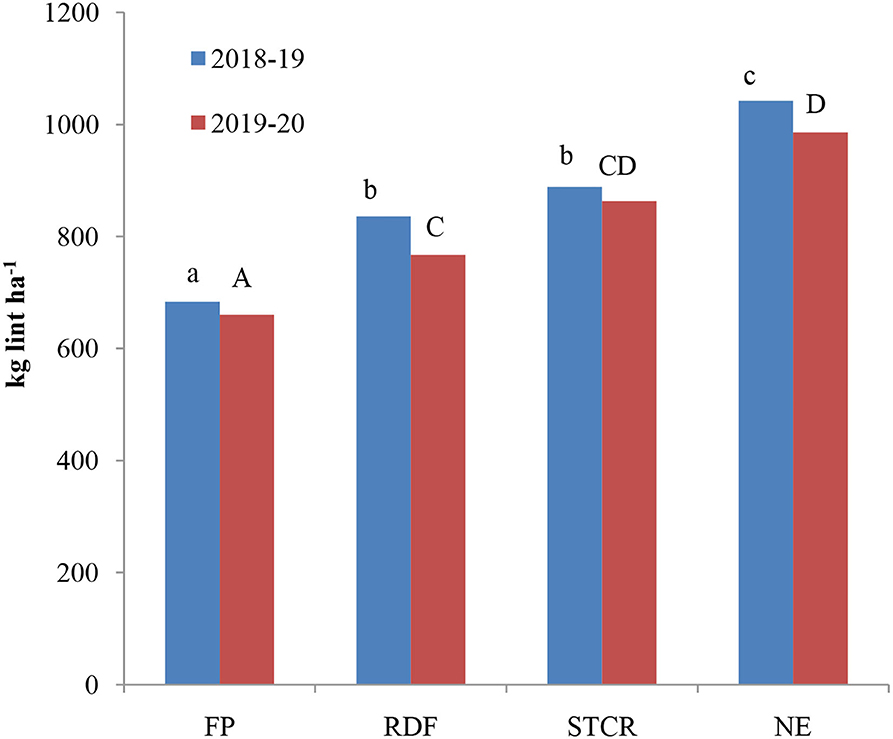
Figure 2. Lint yield (kg ha−1) as affected by nutrient management practices over years averaged across locations (columns with similar letter are not statistically significant; small case letters for 2018–2019 and capital letters for 2019–2020).
Fiber quality parameters (fiber length, strength, micronaire, and uniformity) estimated at the end of the season showed no significant differences among treatments (Supplementary Table 6). However, mean fiber length and strength values were lower during the year 2019–2020 as compared to the year 2018–2019. Nevertheless, these values were within acceptable limits. Similarly, micronaire that determines the fiber fineness was also within the acceptable limits.
Nutrient Uptake
Averaged over years, nutrient uptake was 155, 40, and 116 kg ha−1 of N, P, and K, respectively (Figure 3). Nutrient uptake of N, P, and K was the highest in the NE treatment, while the least crop removal of nutrients was observed in the FP treatment. With regard to N, the NE treatment (171.2 kg ha−1) had significantly greater N uptake than the FP (141.0 kg ha−1) and RDF treatments (148.4 kg ha−1), but did not differ with the STCR. Differences in N uptake between the FP, RDF, and STCR did not differ significantly. Phosphorus uptake did not differ among the treatments and ranged from 34 to 45 kg ha−1. On the other hand, treatment differences were significant for K uptake. The FP treatment had the least K uptake (99.8 kg ha−1) and did not differ with the RDF treatment (110.9 kg ha−1), but was significantly lesser than the NE and STCR treatments (122.7 to 132.1 kg ha−1).
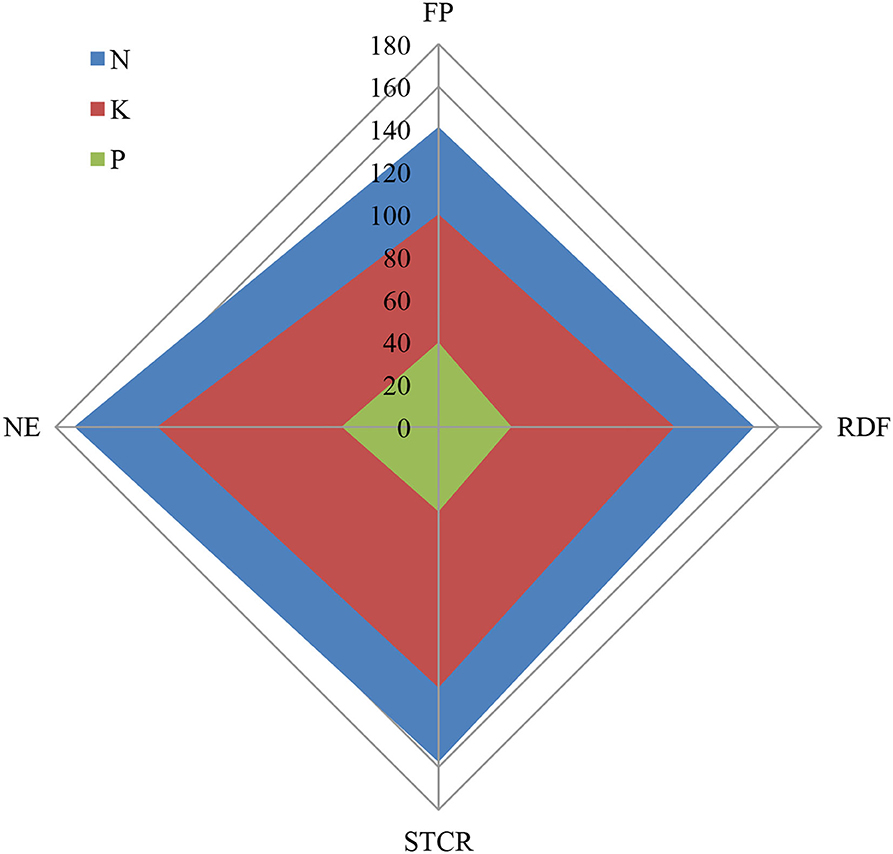
Figure 3. Total nutrient uptake (kg ha−1), at harvest, as affected by the nutrient management practices averaged over years and across locations.
Nutrient Use Efficiency of Applied N, P, and K
The partial factor productivity of the applied fertilizer N, P, and K varied significantly among treatments (Table 3). The PFP of applied fertilizer N was the least in the STCR and did not differ with the FP and NE treatments. The treatments had significantly lower PFP than the RDF treatment. With regard to the PFP of fertilizer P, values were the highest in the RDF treatment, while the STCR and NE treatments had near similar values. However, the differences were not significant. The FP treatment had significantly the least values of the PFP of applied fertilizer P and was nearly 4-fold less than the RDF treatment. With regard to the PFP of the applied fertilizer K, the greatest value was observed in the FP and was significantly greater than the RDF, STCR, and NE treatments.
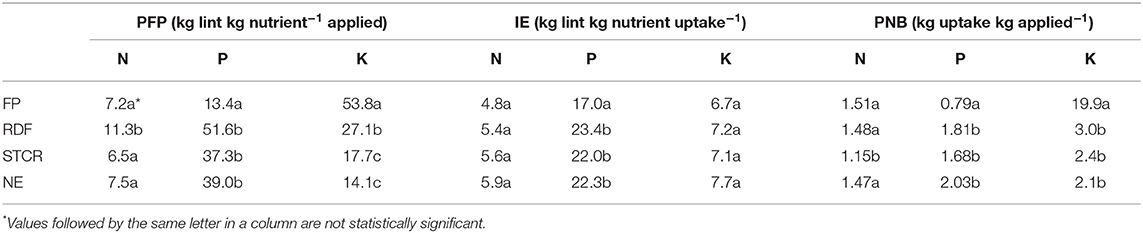
Table 3. Mean partial factor productivity, internal efficiency, and partial nutrient balance as affected by the nutrient management practices.
The IEN values for the treatments did not differ among the treatments (Table 3). The values were within a narrow range with the least value in the FP treatment. The trend for IEP was the reverse to that observed for IEN. The greatest values were observed in the case of the RDF closely followed by the NE and STCR treatments, whereas the FP treatment had the least values. The IEK values were within a narrow range of 6.7 to 7.7 kg lint kg−1 K taken up by the plant and did not differ among the treatments.
Partial Nutrient Balance
Data on PNB, a ratio of the nutrient removed to the nutrient applied, are presented in Table 3. Values of PNB for fertilizer N were greater than unity. Among the treatments, the STCR treatment had significantly lower values than the FP, RDF and NE treatments. The PNB for P was <1 in the case of the FP treatment and was significantly different from the rest of the treatments that had values >1. In the case of PNB for fertilizer K, values were ~20 in the FP treatment and ranged between 2 and 3 for the RDF, STCR, and NE treatments.
Economics
Averaged over years and locations, cultivation costs were the greatest in the NE treatment (Table 4) followed by the STCR, RDF, and FP treatments. However, the investment on fertilizer was the least in the RDF treatment (Figure 4) and the differences were significant. The income due to the sale of the seed cotton followed the trend similar to the cost of cultivation (Table 4). Benefit-to-cost ratio was the greatest with the RDF and STCR treatments and was the least in the NE treatment.
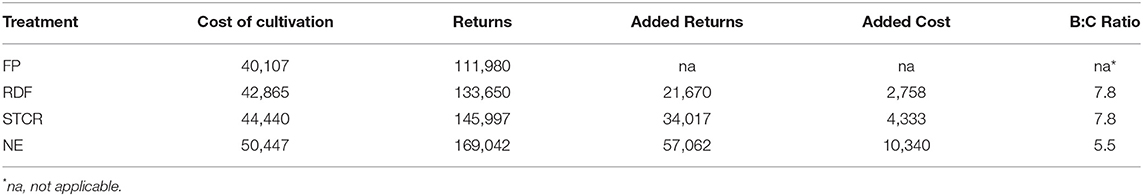
Table 4. Effect of nutrient management practices on cultivation costs (Rs. ha−1), returns (Rs. ha−1), the added costs, and added returns (Rs. ha−1) over the FP treatment and the Benefit:Cost (BC) ratio.
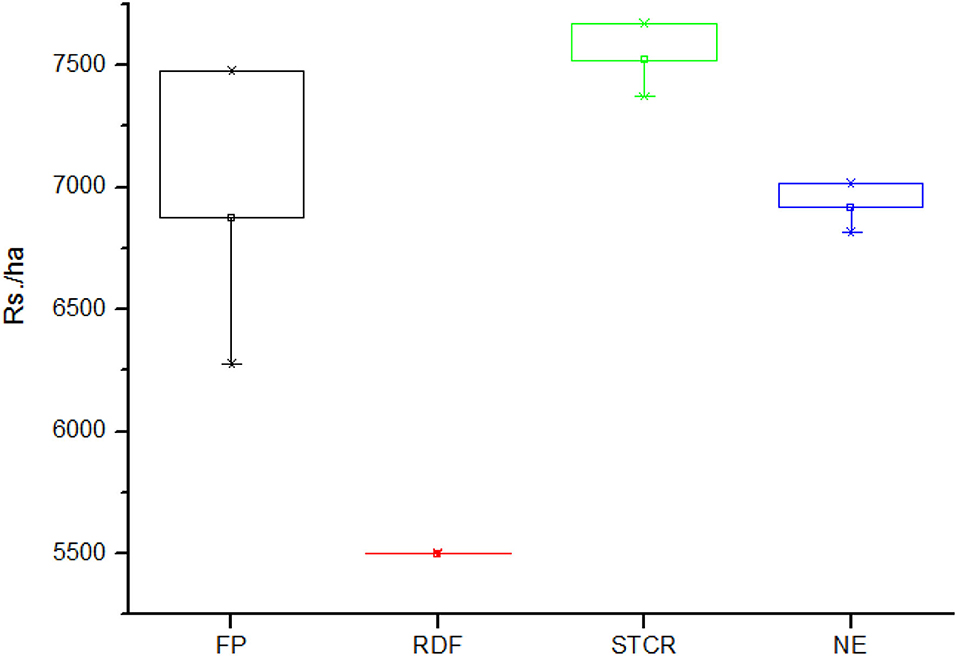
Figure 4. Investment cost on fertilizers for the different nutrient management practices.
Discussion
Rainfed cotton growing regions are primarily constrained by adequate soil moisture supply. Poor soil fertility conditions (low organic C and available N) are further aggravated due to lack of water, since soil nutrient supply and transport get affected. Globally, fertilizer management strategies evolved over time to improve the use efficiency and reduce fertilizer costs. Benefits of the precision nutrient management techniques such as the NE were demonstrated on field crops mainly cereals such as rice and wheat (Sapkota et al., 2021). For the first time, the NE-based fertilizer schedule was evaluated under rainfed conditions for cotton. The superiority of the NE in terms of high lint yields (Figure 1) over the prevalent FP and the present blanket fertilizer recommendation for a region are in agreement with the results of researchers demonstrating the benefits of the NE in other field crops (Satyanarayana et al., 2013; Dutta et al., 2020; Sapkota et al., 2021). Lint yield is primarily determined by the number of bolls per unit area, boll retention, and the lint per boll (Kilby et al., 2013). The NE treatments had greater lint yield because of the greater number of bolls per unit area. In addition, an adequate nutrient supply in the NE and STCR treatment plots led to greater LAI and also the plants had higher chlorophyll content (SPAD reading > 40) as compared to the RDF and FP treatments. Consequently, the NE and STCR treatments probably had better photosynthate availability leading to better boll retention. In addition, the NE treatment had application of N fertilizer in four split doses as compared to three in the case of the STCR and the RDF and two in the FP treatments. Split application, especially of fertilizer N, has been reported to improve efficiency and productivity (Prasad and Shivay, 2016). In the year 2019–2020, better rainfall distribution during the cropping period contributed to vigorous vegetative growth. Due to lack of soil moisture stress, nutrient supply to the crop was possibly not a constraining factor. However, excessive vegetative growth may have affected the light penetration into the canopy. Further, heavy rainfall caused waterlogging in 2019–2020. Cotton is known to not perform well under excessive soil moisture conditions (Zhang et al., 2021), a possible reason for lower yield in 2019–2020 than in 2018–2019.
Although the fertilizer rates were calculated to achieve yield potential of 1,100–1,200 kg lint ha−1, this yield level was not achieved, except at two locations (Supplementary Table 5). This could be due to a combination of various factors: (i) nutrient loss after application and/or (ii) non-availability of the nutrient due to soil moisture stress following the fertilizer application. Furthermore, we assume the application of the split doses was probably done when the plant already had sufficient quantity of the nutrient. Another probable reason could be the differences in the production practices followed by the farmers within the location. In order to achieve the targeted yield, it is possible that further modification in the NE-based fertilizer schedule may be needed. The Bt transgenic hybrids grown at wider row spacing may be leading to a loss in the radiation.
Since fertilizer is a costly input, especially for the resource poor marginal farmers, its efficient utilization is of utmost importance. The fertilizer applied should be efficiently taken up by the crop and utilized into the end product. Therefore, nutrient uptake was determined at harvest to get an estimate of the quantum of nutrients getting exported from the field apart from gaining an understanding on the IE. Expectedly, nutrient uptake values were the greatest in the NE treatment because the NE treatment had higher biomass and significantly greater productivity. But despite being the most productive treatment, N uptake was less than those reported for the cotton grown on Vertisols in Australia (Rochester, 2011). This was probably because productivity was more than 2-fold greater than what was reported by us in this study. A closer look at the IEN, the values reported by Rochester (2011) was as high as 10.1 kg lint kg−1 N uptake. Such high IEN values (9.7 to 12.2 kg lint kg−1 N uptake) were reported for the irrigated Upland cotton in China (Zhang et al., 2008) and Texas, USA (Bronson, 2008). Our values of IEN were close to those of the cotton grown in northern Syria (Janat, 2008). But, they obtained yield levels of 1,800 kg lint ha−1 with N uptake of 300 kg ha−1.
Inefficiency in the conversion of the nutrients taken up by the cotton crop into the harvestable bolls was the main reason for the low values of IEN, IEP, and IEK in the FP treatment. The IEP was the least in the FP treatment that had application rates more than 2.5-fold greater than the economic optimum recommended in the RDF. Farmers in the region seldom applied potash fertilizers with application rates as low as 5 kg K ha−1. It is a common belief that the high soil exchangeable K status would sustain the cotton crop growth (Blaise, 2006). Therefore, the K uptake was less in the FP treatments, while the K application rates in the STCR and NE treatments were 2-fold that of the RDF resulting in greater K uptake. As yield levels increase, it is expected that the IE of applied nutrients is greater. This suggests that there is a wide scope of further improving the use efficiency of the fertilizer nutrients by modifying the nutrient management strategy.
The PNB of N, P, and K > 1 indicates that the additions were not proportionate with the uptake, except for the FP treatment in the case of applied fertilizer P. Presently, the farmers apply greater amount of P mainly through diammonium phosphate fertilizer that is readily available on the market. Farmers opt for this fertilizer source because it also meets the crop N requirement. High application rates of the DAP fertilizer have resulted in excess P application and is evident from the PNB values <1 (nutrient input exceeds removal), (Zingore et al., 2007). Such excess P application rates can lead to eutrophication of water bodies (Carpenter, 2005). The 6.6-to 10-fold greater values of PNB for K in the FP treatment compared to the other treatments reflect that the present farmers practice is leading to mining of the soil K reserves. Thus, the practice may not be sustainable in the long run for two main reasons: (i) excess P application may lead to reduced availability of zinc since P is antagonistic to zinc, necessitating zinc application and (ii) mining of K may adversely affect the soil K reserves and fertility.
On the fields of farmers, we could not establish the nutrient omission plots that are established in the research stations. This restricted us to calculate the PFP, IE, and PNB, while the agronomic and recovery efficiencies could not be determined. The indicators calculated (PFP and PNB) do not consider inherent soil nutrient supplies. Therefore, a limitation of this study is that the efficiency parameters estimated may not be reflective of the real efficiency of fertilizer-derived nutrients. However, considering the farm scale, our data does provide an indication of the nutrient utilization in the real-world situations. Furthermore, the PNB does indicate that the potassium application may negatively impact the soil health.
Though the NE treatments had the highest productivity, nutrient use efficiency decreased (Table 3) as compared to the RDF treatment. It is true that the NUE decreases with an increase in the rate of fertilizer application. Further, an excess application of nutrients, especially N, can be detrimental to the environment (Khan et al., 2017). However, we took into account a holistic view by measuring other indicators (internal efficiency and soil nutrient mining) presented in Table 3. The indicators IE and PNB highlight that the NE-based recommendations significantly increased the IE and reduced the PNB. A possible long-term benefit could be in terms of reduced soil mining of nutrients.
Based on the results of the 2-year on-farm trials, the NE and STCR treatments could be implemented in the rainfed cotton-based systems of central and south India. The flip side is an increase in the cost due to fertilizer and labor for harvesting. Since the NE differs mainly due to the fertilizer K inputs, it would also mean greater imports of K fertilizer. Therefore, further studies on ways of utilizing the K-rich stalks are needed to reduce the subsidy and import bill on fertilizers. Given the low level of yields, low added cost due to NPK fertilizer over the existing farmers practice and the high benefit-to-cost ratio, the NE-based fertilizer management warrants further scientific investigation and policy consideration.
Conclusion
On-farm trials were conducted at 10 locations on fields of farmers in Maharashtra, India to validate the NE-based fertilizer schedule for rainfed cotton. Our on-farm results indicate that the NE-based fertilizer schedule is a promising tool to improve lint yield, fertilizer use efficiency, and profitability. Further studies are needed to refine the fertilizer schedule in order to achieve the yield potential and get a better understanding of the interaction with other management practices.
Data Availability Statement
The original contributions presented in the study are included in the article/Supplementary Material, further inquiries can be directed to the corresponding author.
Author Contributions
AM, SD, TS, and DB conceptualized the work. AM conducted the study, collected data, performed the soil, and plant analysis. DB planned the experiment and wrote the first draft. BB performed the analysis of the data and wrote the first draft. SD and TS did the review, provided the NE software, and inputs during the study. SD and TS contributed to the editing of the manuscript. All the authors contributed and approved the submission of the manuscript.
Funding
This was a collaborative project (OXX04396) between the Indian Council of Agricultural Research (ICAR)-Central Institute for Cotton Research (CICR) and the IPNI India office. The IPNI India Office, New Delhi, provided funds for the study in 2018–2019.
Conflict of Interest
The authors declare that the research was conducted in the absence of any commercial or financial relationships that could be construed as a potential conflict of interest.
Publisher's Note
All claims expressed in this article are solely those of the authors and do not necessarily represent those of their affiliated organizations, or those of the publisher, the editors and the reviewers. Any product that may be evaluated in this article, or claim that may be made by its manufacturer, is not guaranteed or endorsed by the publisher.
Acknowledgments
We are grateful to Dr. V. N. Waghmare, Former Director, ICAR-CICR for providing the necessary facilities for the conduct of this study and Dr. Y. G. Prasad, Director, ICAR-CICR for the institutional support. We also acknowledge the help and support received from Mr. R. M. Ramteke and C. S. Mundafale, Technical Assistant, for collecting the data from the fields of farmers. The NE software was provided by the IPNI for this study.
Supplementary Material
The Supplementary Material for this article can be found online at: https://www.frontiersin.org/articles/10.3389/fagro.2021.777300/full#supplementary-material
References
Blaise, D. (2006). “Balanced fertilization for high yield and quality cotton,” in Proceedings of the International Symposium on Balanced fertilization for Sustaining Crop Productivity' (Ludhiana: PAU), 254–275.
Blaise, D., Venugopalan, M. V., and Raju, A. R. (2014). Introduction of Bt cotton hybrids in India: did it change the agronomy? Indian J. Agron. 59,1–20.
Blaise, D., Bonde, A. N., Reddy, D. D., Patil, V. D., Dhawan, A. S., Aladakatti, Y. R., et al. (2016). Nutrient management options for rainfed cotton grown on Vertisols. Indian J. Fertilisers 12, 46–52.
Bronson, K. (2008). Nitrogen use efficiency of cotton varies with irrigation system. Better Crops Plant Food 92, 20–22.
Carpenter, S. R. (2005). Eutrophication of aquatic ecosystems: bistability and soil phosphorus. PNAS 102, 10002–10005. doi: 10.1073/pnas.0503959102
Chuan, L. M., He, P., Jin, J. Y., Li, S. T., Grant, C. A., Xu, X. P., et al. (2013). Estimating nutrient uptake requirements for wheat in China. Field Crops Res. 146, 96–104. doi: 10.1016/j.fcr.2013.02.015
Dobermann, A. (2007). “Nutrient use efficiency–measurement and management,” in Proceedings of the IFA International Workshop on Fertilizer Best Management Practices (Brussels), 1–28.
Dutta, S., Chakraborty, S., Goswami, R., Banerjee, H., Majumdar, K., Li, B., et al. (2020). Maize yield in smallholder agriculture system—an approach integrating socio-economic and crop management factors. PLoS ONE 15:e0229100. doi: 10.1371/journal.pone.0229100
Gomez, K. A., and Gomez, A. A. (1984). Statistical Procedures for Agricultural Research. Hoboken, NJ: Wiley.
IPNI (2012). A Nutrient Use Information System (NuGIS) for the U.S. Norcross, GA: International Plant Nutrition Institute. Available online at: http://nugis.ipni.net
Janat, M. (2008). Response of cotton to irrigation methods and nitrogen fertilization: yield components, water-use efficiency, nitrogen uptake, and recovery. Commun. Soil Sci. Plant Anal. 39, 2282–2302. doi: 10.1080/00103620802292293
Kairon, M. S., and Venugopalan, M. V. (1999). Nutrient management research in cotton-achievements under all india coordinated cotton improvement project. Fertilizer News 44, 137–144.
Khan, A., Tan, D. K. Y., Afridi, M. Z., Luo, H., Tung, S. A., Ajab, M., et al. (2017). Nitrogen fertility and abiotic stresses management in cotton crop: a review. Environ. Sci. Pollut. Res. 24, 14551–14566. doi: 10.1007/s11356-017-8920-x
Kilby, C. R., Tan, D. K. Y., and Duggan, B. L. (2013). Yield components of high-yielding Australian cotton cultivars. Cotton Res. J. 5, 117–130.
Pampolino, M., Witt, C., Pasuquin, J. M., Johnston, A., and Fisher, M. J. (2012). Development approach and evaluation of the Nutrient Expert software for nutrient management in cereal crops. Comput. Electron. Agric. 88, 103–110. doi: 10.1016/j.compag.2012.07.007
Prasad, R., and Shivay, Y. S. (2016). Deep placement and foliar fertilization of nitrogen for increased use efficiency–An overview. Indian J. Agron. 61, 420–424.
Ramamoorthy, B., and Narasimham, R. L. (1967). Fertilizer prescription for specific yield target of Sonora-64. Indian Farm. 1, 43–45.
Reddy, A. R., Blaise, D., and Narala, A. (2018). Cost escalation in cotton cultivation: an analysis. Econ. Affairs 63, 833–838. doi: 10.30954/0424-2513.4.2018.6
Reddy, D. D., Blaise, D., Kumrawat, B., and Singh, A. K. (2016). Evaluation of integrated nutrient management interventions for cotton (Gossypium hirsutum) on a Vertisol in Central India. Commun. Soil Sci. Plant Anal. 48, 4469–4475. doi: 10.1080/00103624.2017.1282508
Rochester, I. J. (2011). Assessing internal crop nitrogen use efficiency in high-yielding irrigated cotton. Nutr. Cycling. Agroecosyst. 90, 147–156. doi: 10.1007/s10705-010-9418-9
Sapkota, T. B., Jat, M. L., Rana, D. S., Khatri-Chhetri, A., Jat, H. S., Bijarniya, D., et al. (2021). Crop nutrient management using Nutrient Expert improves yield, increases farmers' income and reduces greenhouse gas emissions. Sci. Rep. 11:1564. doi: 10.1038/s41598-020-79883-x
Sapkota, T. B., Majumdar, K., Jat, M. L., Kumar, A., Bishnoi, D. K., MacDonald, A. J., et al. (2014). Precision nutrient management in conservation agriculture based wheat production of Northwest India: profitability, nutrient use efficiency and environmental footprint. Field Crops Res. 155, 233–244. doi: 10.1016/j.fcr.2013.09.001
Satyanarayana, T., Majumdar, K., Pampolino, M., Johnston, A. M., Jat, M. L., Kuchamur, P., et al. (2013). Nutrient Expert TM: a tool to optimize nutrient use and improve productivity of maize. Better Crops South Asia 97, 21-24.
Witt, C., Dobermann, A., Abdulrachman, S., Gines, H. C., Wang, G. H., Nagarajan, R., et al. (1999). Internal nutrient efficiencies of irrigated lowland rice in tropical and sub-tropical Asia. Field Crops Res. 63, 113–138. doi: 10.1016/S0378-4290(99)00031-3
Xu, X., He, P., Pampolino, M. F., Chuan, L., Johnston, A. M., Qiu, S., et al. (2013). Nutrient requirements for maize in China based on QUEFTS analysis. Field Crops Res. 150, 115–125. doi: 10.1016/j.fcr.2013.06.006
Zhang, Y., Hu, W., Gao, Y., Yao, Y., Tang, M., and Hu, G. (2008). Fertilising irrigated cotton for high yield and high nitrogen use efficiency. Better Crops Plant Food 92, 6–7.
Zhang, Y., Liu, G., Dong, H., and Li, C. (2021). Waterlogging stress in cotton: damage, adaptability, alleviation strategies and mechanisms. Crop J. 9, 257–270. doi: 10.1016/j.cj.2020.08.005
Keywords: fertilizer use efficiency, Gossypium hirsutum, nitrogen, semi-arid tropics, soil test crop response, urea, Vertisols
Citation: Manikandan A, Blaise D, Dutta S, Satyanarayana T and Bussa B (2021) Nutrient Expert for High Yield and Use Efficiency in Rainfed Bt Cotton Hybrids. Front. Agron. 3:777300. doi: 10.3389/fagro.2021.777300
Received: 15 September 2021; Accepted: 18 October 2021;
Published: 17 November 2021.
Edited by:
Daniel Kean Yuen Tan, The University of Sydney, AustraliaCopyright © 2021 Manikandan, Blaise, Dutta, Satyanarayana and Bussa. This is an open-access article distributed under the terms of the Creative Commons Attribution License (CC BY). The use, distribution or reproduction in other forums is permitted, provided the original author(s) and the copyright owner(s) are credited and that the original publication in this journal is cited, in accordance with accepted academic practice. No use, distribution or reproduction is permitted which does not comply with these terms.
*Correspondence: Desouza Blaise, YmxhaXNlXzEyM0ByZWRpZmZtYWlsLmNvbQ==