 Mandela M. Jacques
 Silvio J. Gumiere
 Jacques Gallichand
 Paul Celicourt
 Thiago Gumiere
95% of researchers rate our articles as excellent or good
Learn more about the work of our research integrity team to safeguard the quality of each article we publish.
Find out more
ORIGINAL RESEARCH article
Front. Agron. , 12 November 2020
Sec. Plant-Soil Interactions
Volume 2 - 2020 | https://doi.org/10.3389/fagro.2020.590312
This article is part of the Research Topic Global Food and Nutrition Security under Changing Climates View all 7 articles
Potato is one of the most important legumes and constitutes a dominant portion of the global diet. Its physiological activities as well as the quantity and quality of its tubers are influenced by water stress. Herein, we evaluate the effect of several irrigation regimes on the recovery time of potato physiological activities and yield. The treatments were composed of −40 (dry) and −60 kPa (very dry) of soil matric potential (SMP) across three stress periods of 1 (1D), 3 (3D), and 7 (7D) days. A control treatment was included that considered −20 kPa of SMP during the experiment. The results showed a complete recovery of potato plants treated by applying a SMP of −40 kPa during 1 day when compared with the plant control. Although a decrease in physiological activities was observed, the potato plant was shown to consume 10% less water in this scenario. Other treatments showed yield losses, especially the treatments under 7 days, in which plants did not fully recover. Based on the results of yield loss and water stress, a water deficit index (WDI) model was proposed. WDI values >0.78 produced significant yield losses compared to the control. Therefore, the response time is a valuable measure for future research on the impacts of water stress on plants. Also, WDI is a promising index that can assist in forecasting the impact of water stress on the level of potato productivity.
Potato is grown worldwide for its tubers and is a staple food in the global diet (Aliche et al., 2020). Its production is of particular economic importance, with potato ranked fourth globally in food crops behind maize, wheat and rice (Djebli et al., 2020). In the last decades, global production increased at a much higher rate with regard to other staple crops (Kreuze et al., 2020). In Canada, a 23% increase in potato production was observed from 2008 to 2018 (FAO, 2018). The province of Quebec is ranked fifth among the provinces of Canada in regard to production, with 12% of the total potato production for 2019 (Statistics Canada, 2019). Although the rainfall regime in Quebec is sufficient to meet the evapotranspiration needs of most crops, large volumes of water are withdrawn to maintain high yield levels. For instance, in 2012, more than 19.4 million cubic meters of water were used for irrigation in Quebec (Statistics Canada, 2012). It has been reported that rainfed potato crop management may shift to irrigation, a necessary condition to reach a yield above the potential in the Quebec region (Parent and Anctil, 2012). In addition, climate changes may increase the use of irrigation to avoid periods of drought due to irregularity and poor distribution of precipitation (Afzaal et al., 2020). Thus, irrigation practices will inevitably be more common, which subsequently increase the pressure on local water resources since only 10% can be reused (Shaffer and Runkle, 2007). Consequently, strategies to increase the sustainability of water supply and use can contribute to improving productivity and meeting the nutritional needs of the population (Birch et al., 2012).
Supplying the right amount of water to a plant in the right spot at the right time (i.e., precision irrigation) is a common approach for efficient water use (Sadler et al., 2005). Monitoring the soil water content at various depths using telemetric systems for a precise and real-time forecast of plant water requirements is a commonly used method (Pulido-Calvo et al., 2007; De Lara et al., 2018). These techniques take advantage of the spatial characteristics of soil moisture and environmental conditions to provide planning tools. However, the physiological characteristics, such as plant resilience to water stress and stress history, are rarely taken into account. This implies that the plant's ability to extract water from the soil, which depends on its physiological activity and the time spent under a certain stress level (Chaves et al., 2002; Sarker et al., 2019), is not considered. These important factors are also not incorporated in existing drought factor index (DFI; Oukarroum et al., 2007) and crop water deficit index (CWSI; Idso et al., 1981; Bijanzadeh et al., 2019). Thus, there is a need for a new water stress index that integrates the characteristics of the stress, i.e., its timing, severity and duration, with the potential to predict yields.
The potato crop, because of its shallow root system, is sensitive to drought (Joshi et al., 2016; Zarzyńska et al., 2017; Dahal et al., 2019). Its root system has a lower efficiency compared to other crops and a low capacity to extract water and mineral salts from the soil (Steyn et al., 1998; Dechassa et al., 2003). The impact of drought on potato physiological activity and tuber yield is a function of the physiological stage of the plant and the severity and duration of the stress (Schafleitner, 2009; Rudack et al., 2017). The plant's stress history may further exacerbate its sensitivity to drought and it may require time to recover to full functioning capacity (Galle et al., 2010). Thus, techniques that provide timely and adequate water supply are of prime importance to potato production (Iwama, 2008; Joshi et al., 2016).
To limit the impact of water stress, the potato develops a rapid closure of its stomata to reduce water losses, and the more severe the stress is, the slower is the recovery of the crop transpiration capacity (Liu et al., 2006; Rudack et al., 2017; Boguszewska-Mańkowska et al., 2018). This phenomenon is rapid and induced by the abscisic acid (ABA) root-to-shoot signal (Jia and Zhang, 2008). When the stress becomes more severe, non-stomatal factors become predominant. Thus, a detailed knowledge of the physiological response of potato based on analysis of its photosynthetic activity is likely to increase its efficiency of water use. We hypothesized that the stress severity level controls the physiological response of the potato crop and influences its tuber yield. This study aims to (a) investigate the temporal response of potato physiological activity as a function of water stress levels and duration, and (b) develop a new water deficit index (WDI) to predict yield as a function of the severity, duration and timing of the stress applied. The analysis also focused on yield to justify the practical aspect of the work in connection with the problems of increasing population and water use.
Over the 2019 winter and summer seasons, we carried out two potato crop production experiments at the Université Laval's high-performance greenhouse complex in Quebec, Canada. The plants were grown in a sandy substrate (87.2% sand, 9.3% silt, and 3.5% clay) extracted from the fields of one of our partner producers (Lac Saint-Jean, QC, Canada) in cylindrical pots of 45 cm in diameter and 37 cm in height. This height was sufficient to allow an adequate development of the roots since the root system of potato is mainly concentrated in the first 30 cm of soil (Lahlou and Ledent, 2005; Zarzyńska et al., 2017).
We used the Goldrush potato variety, the most widely cultivated in Quebec (Agriculture and Agri-Food Canada, 2019), to conduct the experiments. This variety is characterized by a light brown scale-like peel, a white flesh, and an elongated oval shape. The seeds supplied by our partner producers were stored at a temperature of 3–4°C and a humidity rate of 80–95% to maintain their germinating power (Peivastegan et al., 2019). They were buried at a depth of ~7 cm in the pots. Following soil nutrient analysis using the Mehlich III method, soil N, P, K, and Mg requirements were 150, 150, 80, and 20 kg/ha, respectively. Using compound fertilizer 13-13-13-3Mg (13 kg N, 13 kg of P, 13 kg of K—3 kg of Mg for a bag of 100 kg), 18.4 g of fertilizer per tray of 0.16 m2 of the surface was sufficient for the seedling to cover the nutrient deficiency of the soil in relation to the potato requirements. When discarded, 1.47 g of nitrate of ammonium is brought to complete the nitrogen demand of the plant and compensate for the unstable effect of this element.
We designed a completely random factorial experiment with four replicates to allow a good analysis of the data with no residual variability, as reported by Dagnelie (2000). The experimental treatments consisted of the application of irrigation water, and the threshold and application of the water regime were used to differentiate the treatments (discussed in the next section). We ran the experiments by applying seven irrigation regimes (one control + six treatments) with four replicates each, for a total of 28 experimental units or cylindrical pots.
For each seasonal experiment, we applied two stress episodes at two critical stages of the potato production (Seyni et al., 2002; Benam and Hassanpanah, 2007; Schafleitner et al., 2007). We inflicted the first stress episode in the period from the tuber formation to the start of flowering (i.e., 35–40 days after emergence) and the second one later in the season during the tuber swelling (65–70 days after emergence). Apart from these stress periods, the plants were adequately supplied with water controlled by soil matric potential (SMP) sensors installed in the pots, thus keeping the plants at optimal conditions. We applied three irrigation thresholds or treatments to study the process of water uptake by roots and simultaneously follow the evolution of the physiological characteristics of the plant. The optimal threshold that consisted of constantly maintaining the plants under a SMP between −5 and −20 kilopascals (kPa) was considered the optimal range for growing potato (control) according to previous greenhouse experiments, and a dry (−40 kPa) and a very dry (−60 kPa) threshold were also studied.
The dry and very dry treatments represent three variants (1, 3, and 7 days) that indicate the number of days of water stress inflicted on the plant. Hereinafter, these variants are labeled “dry-1D” and “very-dry-1D” for the 1-day duration, “dry-3D” and “very-dry-3D” for the 3-days duration, and “dry-7D” and “very-dry-7D” for the 7-days duration and constitute the six treatments previously mentioned. After reaching the duration, the soil is restored to the optimal SMP.
We measured environmental, physiological, and hydrodynamic parameters, specially at times of water stress, to assess the impact of such stress on the plant. Environmental parameters, such as air temperature and humidity, wind speed, and solar radiation were measured to maintain favorable conditions to potato (Solanum tuberosum, L.) production. The measured hydrodynamic variable is soil matric potential and is used to trigger and stop irrigation according to the imposed stress level and duration.
Because the plant is considered as an open system, the flow of water that enters through its roots and the ease of its leaves to allow water vapor to flow to the atmosphere are intimately linked and depend on the degree of opening of the stomata. The opening of the stomata is controlled by the photosynthetic apparatus to regulate the entry of CO2 into the plant depending on the physiological state of the plant and the availability of nutrients and light energy. Reductions in water flow and transpiration usually show problems with the photosynthetic system. The fluorescence of chlorophyll “a” is the preferred way of dissipating light energy stored in plant chloroplasts when photosynthesis slows down. So, the intensity of this fluorescence and the quantum yield of photosystem II (maximum fluorescence/variable fluorescence) are two parameters that provide information on the functioning of the photosynthetic apparatus. Thus, the physiological parameters include stomatal conductance, sap flow, quantum yield and chlorophyll fluorescence.
We provide details each of these variables below. In addition, we incorporate them in Figure 1 that also summarizes the methodology presented herein.
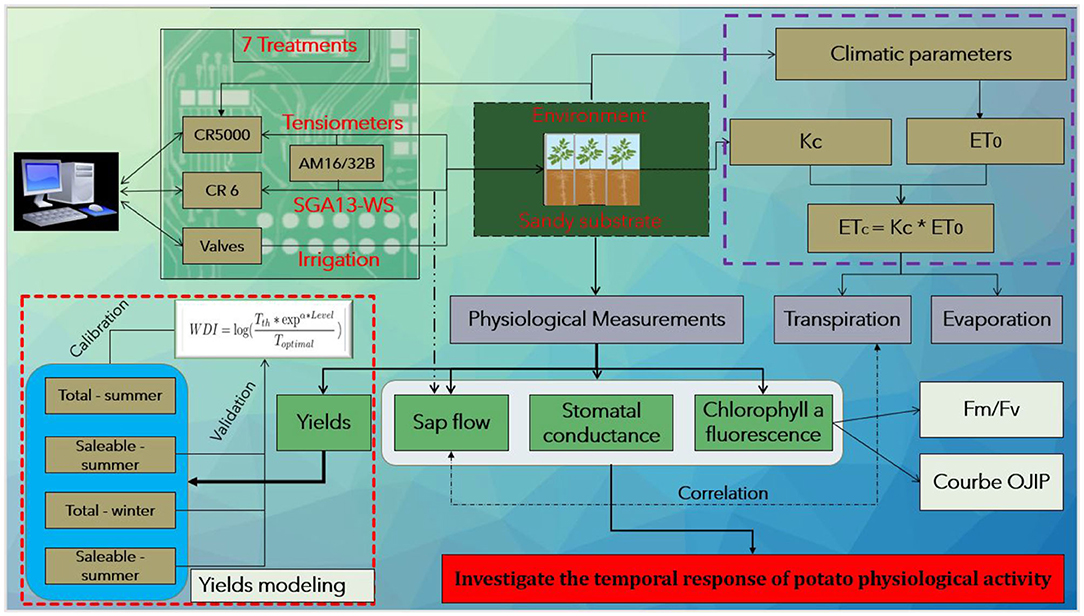
Figure 1. Summary of the methodology applied in the paper.
To maintain the SMP of each experimental unit within the necessary limits, we built an L-shaped pressure sensor using a 26PC Series pressure sensor (Honeywell, IN, USA) filled with water as well as a drip irrigation system. We installed three of these sensors at 10, 20, and 30 cm from the bottom of the pot at one of the 4 replicates, while the other replicates were equipped with only two sensors installed at 12 and 24 cm. The average value of SMP recorded by the top two tensiometers (10 and 20 cm) and the bottom one (30 cm) were used to, respectively, trigger irrigation by taking into account the number of days that the plant must remain under stress and stop the irrigation when SMP reached a value of −5 kPa for 10 min. This is a sufficient delay to eliminate the effects of the measurement oscillation. Irrigation treatments were applied during night times when the root uptake was almost zero to maintain a SMP within the predefined margins for each treatment.
Environmental parameters were measured with a complete weather station (pyranometer, temperature, humidity, energy quantum, etc.) in the greenhouse to compute, for example, crop evapotranspiration (ETc) (see Supplementary Material for details) which has been used to validate the plant physiological measurements (e.g., sap flow; Zhang et al., 2014). ETc was also used to normalize sap flow and stomatal conductance measurements. The wind speed was regulated and recorded by the greenhouse environmental management system.
We manually measured stomatal conductance on the same leaf during the entire production cycle as proposed by Rothwell et al. (2015). We performed the measurement for all experimental units on the third leaf from the top of the plant stem starting at 11:00 a.m. through 1:00 p.m. using an AP4 porometer. This method provides a measurement to evaluate the time it takes for a leaf to release enough water vapor to bring the humidity of the instrument's air chamber to a fixed value according to cropping objectives and conditions (AP4 Porometer User manual, Version 3.1, Oct. 2014). Then, the time obtained is compared to that obtained by a calibration plate with a known resistance for estimating the stomatal resistance or conductance. Our calibration error was in agreement with the calibration error of the instrument and did not exceed 5% before each use.
We used the Handy PEA fluorimeter to measure chlorophyll fluorescence emission. We retained the technique of chlorophyll fluorescence kinetic analysis which is a tool that aids in characterizing photosynthetic systems using the chlorophyll “a” fluorescence emitted by photosynthetic organisms. This technique has the advantage of being rapid and non-invasive (Kalaji et al., 2011; Keutgen et al., 2020) and is often used to monitor the photosynthetic activity of plants subjected to stress conditions (Baker, 2008; Mehta et al., 2010; Kalaji et al., 2014; Keutgen et al., 2020). The same leaves used to measure the stomatal conductance were subjected to a dark condition for at least 30 min, and we adopted a light intensity of 3,000 μmol·m−2s−1 according to the Handy PEA fluorimeter utilization protocol.
We selected two fundamental aspects of the chlorophyll “a” fluorescence to evaluate the physiological activity of the potato: (a) the transient analysis of the plant fluorescence (OJIP curve) and (b) the maximum quantum yield of the primary photochemistry.
The transient analysis of the plant fluorescence (OJIP curve), also called “fast fluorescence rise OJIP,” is a curve that follows the evolution of fluorescence expressed in arbitrary units (a.u), on a logarithmic time scale, from a minimum value (FO, at 50 μs, O) to a maximum value (FM, P) via separate intermediate stages FJ (at 2 ms, J) and FI (30 ms, I) (Strasserf et al., 1995; Strasser et al., 2010). This curve, especially its segment (I-P), is a characteristic of the plant photosynthesis operating state and varies considerably depending on the stresses to which the plant has subjected (Oukarroum et al., 2009; Adamski et al., 2011).
The quantum yield is derived from measurements of rate of photosynthesis (energy per time unit) and light intensity (Emerson, 1958). It mainly allows for the quantification of the maximum photochemical efficiency (electron/photon absorbed) of photosystem II (PSII). This is calculated as the ratio of Fv/FM where Fv is the difference between the minimum and maximum value of plant fluorescence (FM−F0).
To measure sap flow, we installed eight SGA13-WS sensors (Dynamax, Inc., Houston, TX, USA) according to the indications provided by the manufacturer (Dynamax Inc, 2007) and the recommendations of Vermeulen et al. (2007). Due to this limited number of sensors, we selected only a pair of replicates from the control, dry-1D, dry-7D, and very-dry-7D treatments and equipped each one with a sensor. We considered these treatments to obtain a maximum amount of information and a certain representativeness of the results. A CR6 datalogger from Campbell Scientific, Inc. (Logan, UT, USA) controlled these sensors and was programmed to save voltage differences every 2 min. We used an AM16/32 relay multiplexer and an adjustable voltage regulator (AVRD; Dynamax, Inc., Houston, USA) to wire the eight sensors measuring the sap flow rate to the datalogger.
For each experimental unit (pot) harvested, the total yield was calculated in g/pot using a balance. Then, in a tuber-washing-and-sorting phase, we separated the saleable tubers from the diseased, deformed and low-grade ones (size < 42 g). Hence, we selected total yield and saleable tuber yield as the two yield components for this work. We compared yields obtained for each treatment using the least significant difference test (LSD test, p = 0.05) and modeled them according to the water deficit index (WDI) proposed in this study.
A WDI was developed based on a logarithmic and exponential function as introduced by Strauss et al. (2006) and Oukarroum et al. (2007). The WDI developed in this paper represents a reduction in the degree of comfort of the plant due to water stress. It incorporates a set of three important aspects of plant water stress: timing, severity and duration. Our index (WDI) is defined according to the principle that the index must be ~0 for the controls and increase with the increase in the Tth−d parameter pair of the different treatments.
It is given by the following equation:
The parameter α[d−1] is a fitted parameter related to the time at which the stress affects yield. In addition, the SMP threshold (Tth in kPa) and d, respectively, represent the severity and duration in days of the stress. Toptimal represents the SMP threshold deemed optimal for the potato (−20 kPa according to previous greenhouse experiments).
For stomatal conductance and the maximum quantum yield of the primary photochemistry of the plants, we express the results for each treatment as a fraction of the value measured for the control on the same day. This strategy allowed us to better track the evolution of the plant physiological activity recovery with respect to the control and also eliminate the effect of climatic factors that could introduce bias in the results. However, for sap flow, we performed a double normalization using the potential evapotranspiration and the maximum value obtained during the growing season. This strategy facilitates inter-treatment and inter-replicate comparison taking into account changes over time, i.e., before and after irrigation. This was necessary as highlighted above. This 2-fold normalization technique has been used in numerous studies (Whitley et al., 2008; Clausnitzer et al., 2011; Dang et al., 2019).
We conducted the analyses with the R programming language (R Development Core Team, 2018) using the tidyverse (Wickham, 2017) and agricolae (De Mendiburu, 2019) packages for data preprocessing (removal of outliers, data normalization) and statistical analysis of the physiological data. To evaluate the difference between the treatments and the controls, we first use the “anova” function of the base “stats” package of R to perform a one-way ANOVA analysis of variances. Then, we use the “LSD.test” function of agricolae which evaluates the Least Significant Difference between the different experimental units according to a fixed threshold of significance p (p < 0.05).
Due to this large range in measured values, we present instead relative values of stomatal conductance (replicate/control) for the different irrigation treatments over the period from the day before and up to 4 days after irrigation treatments application for the summer 2019 experiment in Figure 2. The results show that the conductance essentially varies between 80 and 1,000 mmol·m−2·s−1; These values are consistent with those obtained in other experiments on potato (Liu et al., 2006; Ahmadi et al., 2010).
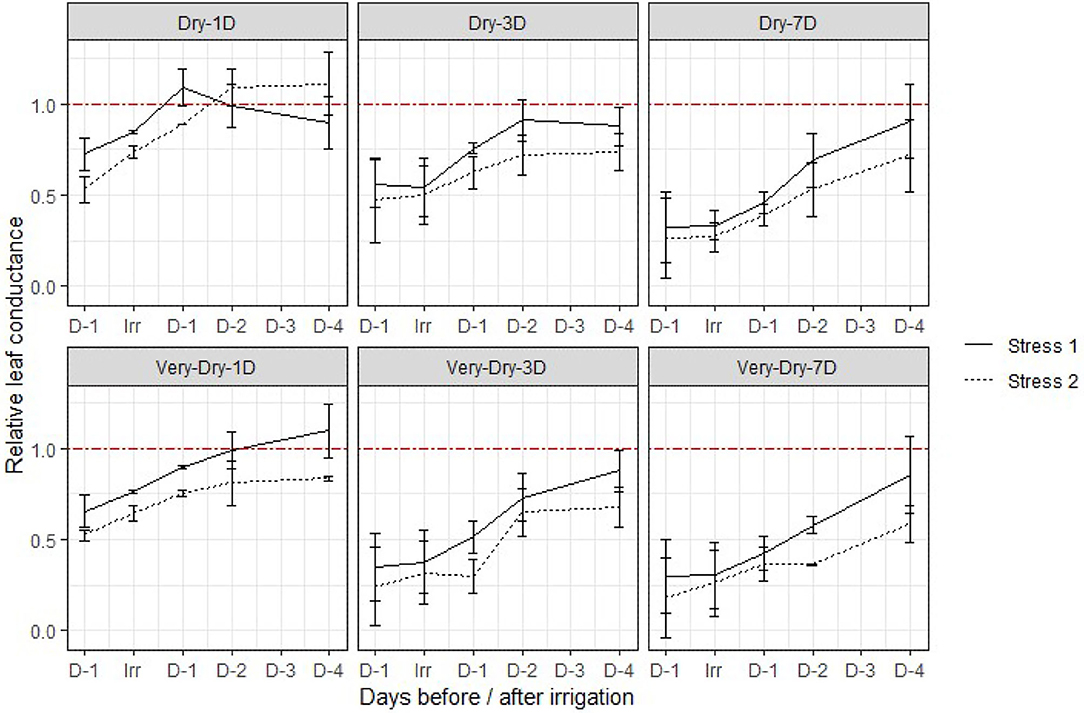
Figure 2. Evolution of relative stomatal conductance (replicate/control) for the different irrigation treatments over the period from the day before and up to 4 days after irrigation treatments application for the summer 2019 experiment. The error bars represent the standard deviation around the mean for the four replicates of a same treatment. The red dashed line (—-) represents the threshold from which the recovery of the treatments is complete compared to the control measured at the same time. The values above the red dashed line represent an increase in stomatal conductance of treatments compared to the control and those below a deficiency. D−1, D+1, D+2, D+3, D+4 on the X axis represent the number of days before (−) and after (+) application of irrigation. Irr is the day that irrigation is applied.
The results demonstrate that the plants recover on average <60% of their maximum stomatal conductance capacity after the second stress, while they recover over 85% on average after the first stress. They further indicate that the relative stomatal conductance, not only decreases with stress history, but also with its severity and duration. For instance, the relative stomatal conductance varies in average from a range between 50% to roughly 75% for the dry-1D treatment to around 25% for the very-dry-7D. We observed a slower temporal increase (slope steepness) in stomatal conductance after the application of irrigation treatments during the second stress, thus a faster flattening of the curve.
We measured sap flow values ranging from 0 to 40 g·h−1. In Figure 3, we present, for the summer 2019 experiment, a comparison of sap flow normalized according to the double normalization strategy mentioned above for the four pairs of replicates we monitored. For all the treatments administered, the results generally show a gradual decrease in sap flow with stress severity. In addition, for the same duration before and after irrigation, the flow differences persist. Furthermore, the differences in sap flow between the control and the most stressed replicates (dry-7D and very dry-7D) remain considerable even after irrigation. This effect is particularly observed during the second application of water stress. Indeed, we observed a difference of more than 35% for the most stressed treatment compared to the control regardless of the time.
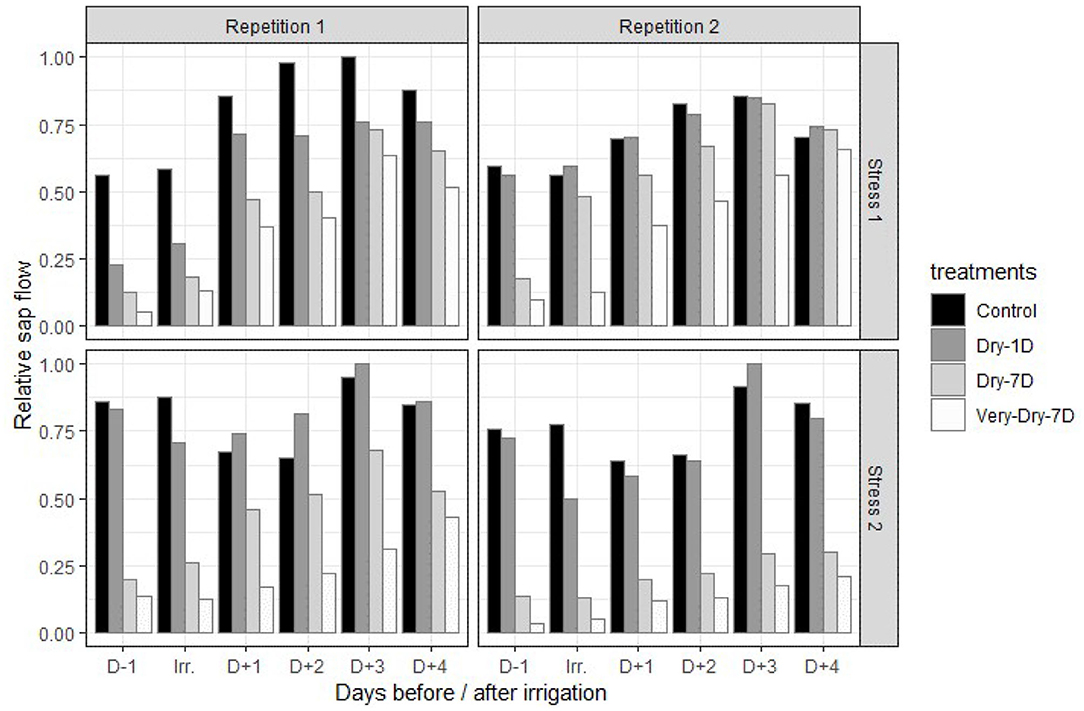
Figure 3. Evolution of relative sap flow for the control, dry-1D, dry-7D, and very-dry-7D irrigation treatments over a period from the day before and up to 4 days after irrigation treatments application (summer 2019 experiment).
The results also show that, for both stress episodes, the mildest stressed (dry-1D) replicates react quickly to the restoration of irrigation conditions and display a general increase in sap flow after application of irrigation treatment. This trend is also noticed for the most stressed replicates (dry-7D and very dry-7D). However, the differences remain considerable compared to the control and appears to be influenced by stress history (see first row and second row in Figure 3).
We measured absolute quantum yield values ranging from 0.74 to 0.86. We present the results in Figure 4 and they represent relative values from treatments with respect to the control. A general result is that there is an increase in the quantum yield after application of irrigation for all plants and those under the dry-1D and very-dry-1D treatments are the least affected. In addition, they were able to even recover to an photochemical efficiency level beyond that of the control starting the 2 days after application of treatments. The results also indicate that the most stressed plants (dry-7D and very-dry-7D) were not able to fully recover their photochemical efficiency from the effects of the imposed stress levels. They show the lowest quantum yield values and the he red line in the figure represents a recovery ratio with respect to the control.
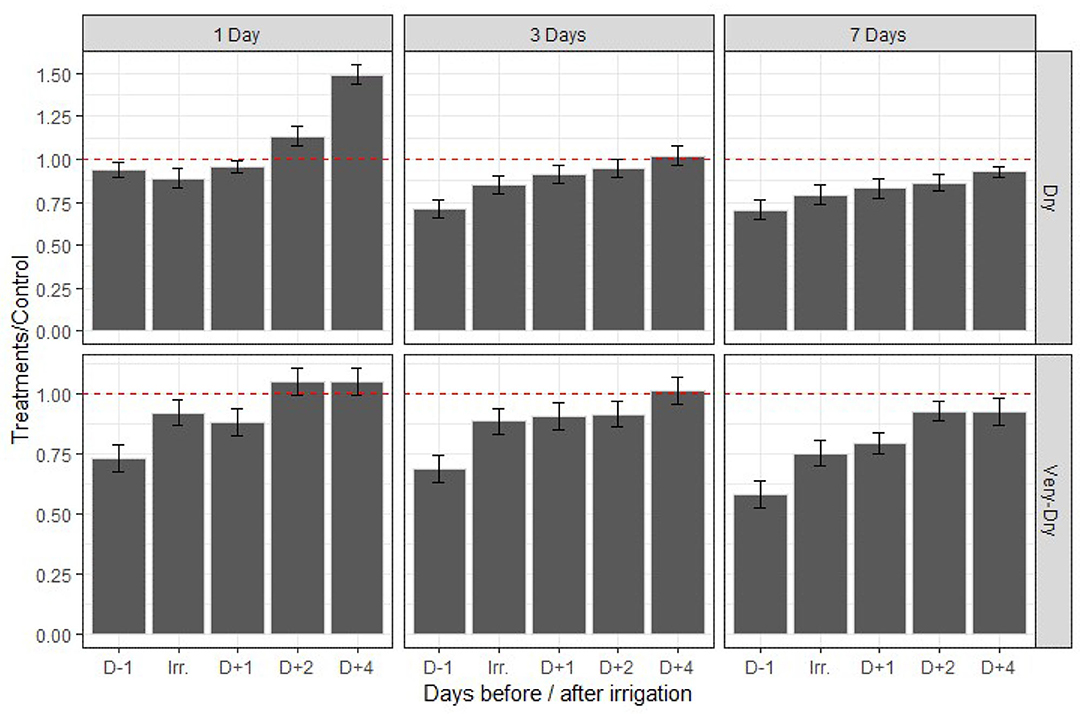
Figure 4. Variation of relative quantum yield as a function of time and stress treatments for the summer 2019 experiment. The error bars represent the standard deviation around the mean for the four replicates of a same treatment. The red dashed line (—-) represents the threshold from which the recovery of the treatments is complete compared to the control measured at the same time. The values above the red dashed line represent an increase in quantum yield of treatments compared to the control and those below a deficiency. D−1, D+1, D+2, D+3, D+4 on the X axis represent the number of days before (−) and after (+) application of irrigation. Irr is the day that irrigation is applied.
We present the intensity of the chlorophyll “a” fluorescence in Figure 5 (first stress of the winter 2019 experiment) and Figure 6 (the second stress of the summer 2019 experiment) according to a logarithmic time scale varying from 10 μs to 1 s. To limit the length of the paper, here we present only results pertaining to four treatments (dry-1D, very-dry-1D, dry-7D, and very-dry-7D). Also, we do not present the dry-3D and very-dry-3D treatments for the same reason; nevertheless, we observed a similarity of these curves with those obtained for the very-dry-1D and dry-7D treatments, respectively. However, the results presented herein are representative for all of the experiments since we noticed very few variations in the plant fluorescence evolution during each experiment.
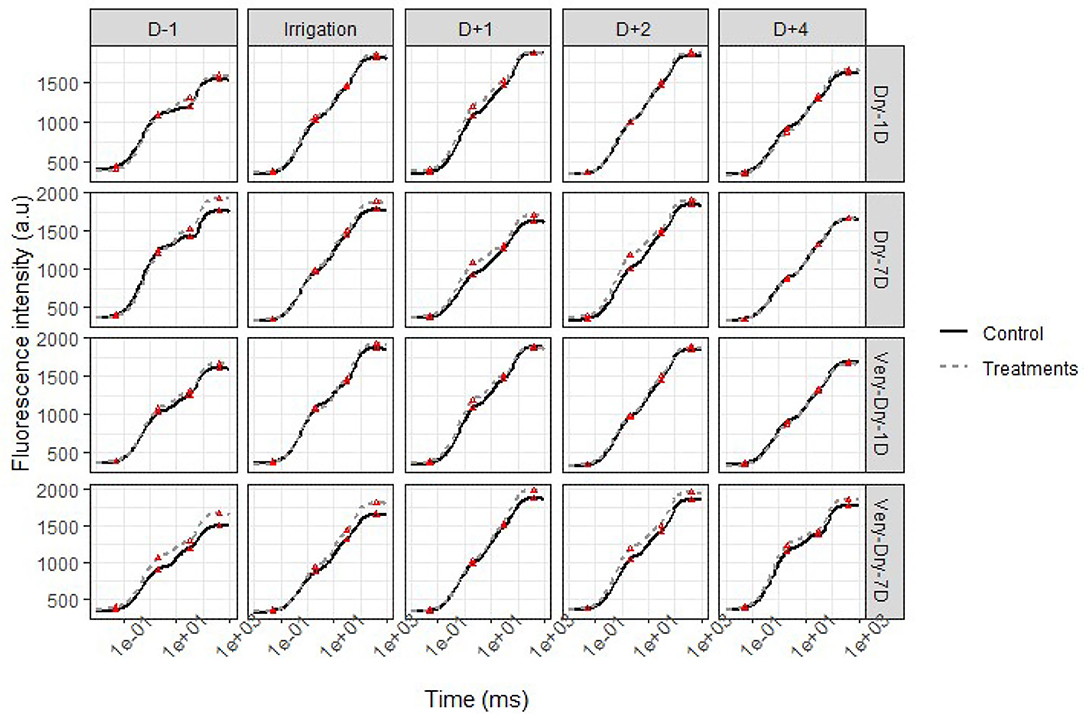
Figure 5. OJIP transient curves of chlorophyll a fluorescence for potato under stress (solid lines) and optimal water supply (dashed lines) conditions—second stress in the winter 2019 experiment. Each point represents the mean of four independent measurements. The red triangles (Δ) denote the position of the OJIP points on the curves.
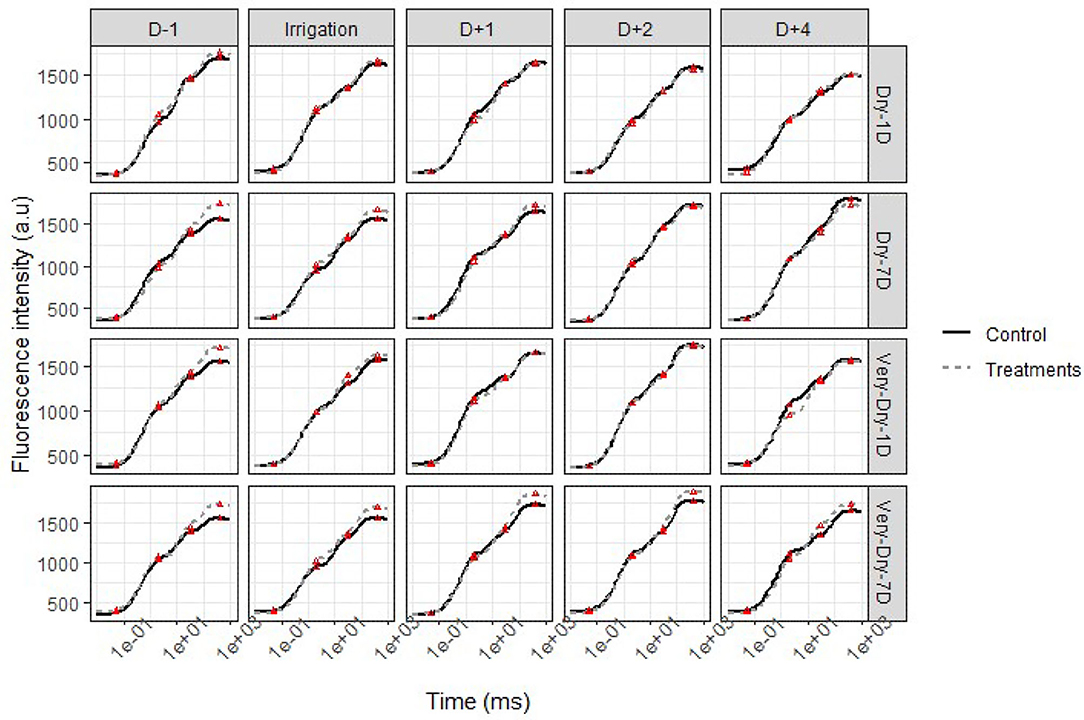
Figure 6. OJIP transient curves of chlorophyll a fluorescence for potato under stress (solid lines) and optimal water supply (dashed lines) conditions–second stress in the summer 2019 experiment. Each point represents the mean of four independent measurements. The red triangles (Δ) denote the position of the OJIP points on the curves.
As for other physiological parameters discussed above, each figure comprises the variation in the transient of fluorescence “a” from the last day of stress until the fourth day after treatment. We observed that, regardless of the stress state of the plant, the minimum fluorescence emitted (FO) remains relatively stable for all experimental units.
The general shape of the curve, more specifically the difference between the maximum fluorescence (FM), highlights the influence of stress on physiological activity. Unlike FO, this last characteristic point (P) of the curve indicates the highest fluorescence resulting from the maximum reduction of and the closure of the reaction centers (RCs) (Goltsev et al., 2016; Keutgen et al., 2020). Thus, we notice a difference in the I-P segment of the curve, and the greater the difference is, the greater is the impact of stress on the plant. This portion of the transient curve OJIP corresponds to the reduction in the transport of electron acceptors in and around the PSI (Schansker et al., 2005).
We also noticed that for the day before treatment application (D−1 in Figure 5), FM is greater for all stressed treatments compared to the controls. During all periods of stress, the difference between the curves at point P is very small for dry-1D and they merge a few hours after irrigation. Overall, this difference represents a maximum increase of 2.5% compared to the control.
The results indicate that a few hours were sufficient for dry-1D to fully recover while the very-dry-7D could no longer return to its starting potential. In addition, the plants subjected to the very-dry-1D treatment required more than 24 h to completely recover. However, those subjected to the dry-3D, dry-7D, and very-dry-3D treatments returned to their functioning potential after an average lag time of 2 days.
We identified common scab and rhizoctonia as pathologies, and their impact on saleable yield varies with the level of stress inflicted. This represents ~10.2% of the total yield in winter and 8.5% in summer for the control and dry-1D treatments. Nevertheless, the ratio of tubers showing symptoms of disease increases for the other more stressed treatments and is >20%. We did not consider deformed and greenish tubers (~12%) in the calculation of saleable yield. We present the results of our yield analysis in Figure 7.
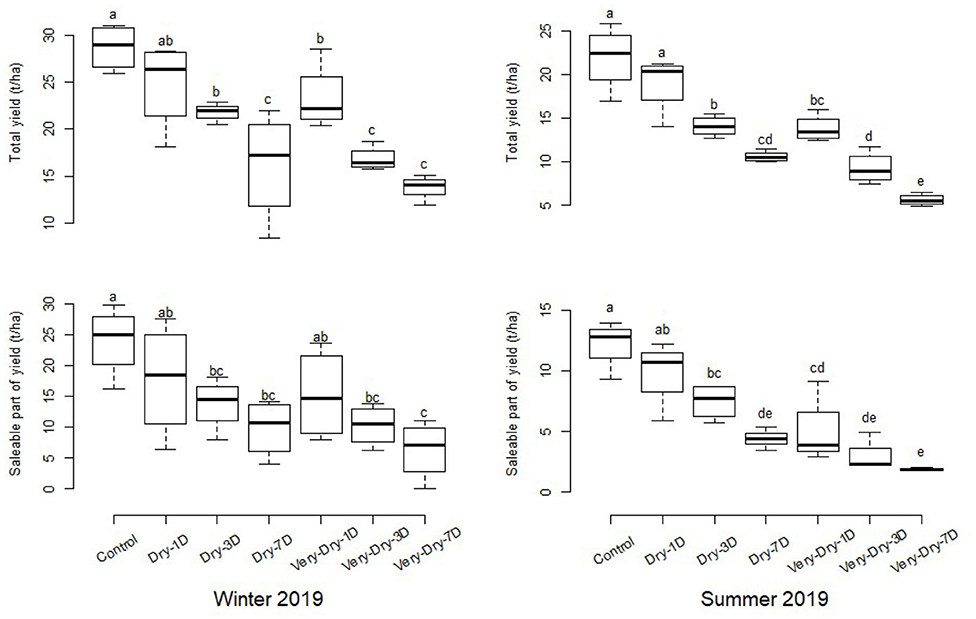
Figure 7. Total yield and fraction of saleable yield for the two experiments in winter and summer of 2019. The error bars represent the standard deviation around the mean for the four replicates of a same treatment. The letters on the boxplots corresponding to each treatment represent the different classes according to their difference. These classes are obtained from the LSD test and allow to assess the level of significance between treatments and controls at a threshold p < 0.05.
Table 1 shows, for the different treatments, yield losses compared to the control. Although the average loss ratio varied between 13 and 26%, no significant difference was observed between the control and the dry-1D treatment. However, the dry-1D consumes 10% less water. Yield losses observed are much greater in the summer season with the exception of the dry-1D and dry-3D treatments, for which losses of saleable yield are less in the winter season.
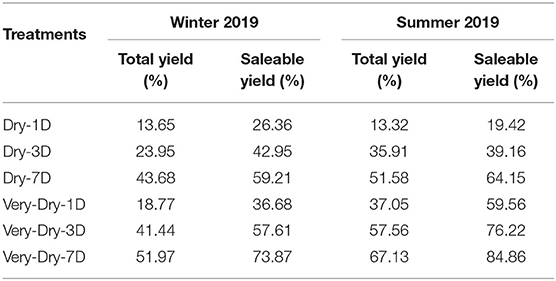
Table 1. Average reduction in the two yield components of stressed plants compared to control plants.
We also observed the often observed linearity between stress and performance for each irrigation threshold. Indeed, this linearity did not hold when transitioning from dry-7D to very-dry-1D and shows that the effect is more important for the first than the second. Furthermore, we observed that the persistence of stress conditions has a greater effect on potato yields than on the irrigation threshold. This effect has already been discussed and demonstrated by Evers et al. (2010). Similar to Ramírez et al. (2016), our results show a good relationship between the recovery of photosynthetic functions and the reduction of potato yield.
Similar to the crop water stress index (CWSI) that is strongly correlated with stomatal conductance (Rinza et al., 2019; Cucho-Padin et al., 2020), the WDI shows a good correlation with yield. We determined the parameter α = 0.09 by reverse modeling with the total yield data for summer 2019 (R2 = 0.8, p = 1.1*10−10). Then, we validated the parameter with saleable yields from the summer () and winter (R2 = 0.5, p = 2.96*10−5) experiments, and total yield of the winter experiment (R2 = 0.6, p = 4.6*10−7). This index presents values varying from 0 to 1.73, depending on the stress applied.
According to the values obtained for the WDI, the effect of the applied stresses follows the following order: control (0, no stress) < dry-1D (0.78) < dry-3D (0.96) < very-dry-1D (1.19) < dry-7D (1.32) < very-dry-3D (1.37) < very-dry-7D (1.73). As with all physiological parameters, the WDI shows that dry-7D is more affected by stress than very-dry-1D.
The WDI index was used to model the two yield components for the two experiments, as presented in Figure 8. We observed a linear and negative relationship between the proposed WDI and yield. We obtained a higher rate of decrease in yield in the summer of 2019. This is consistent with the slower recovery of photosynthetic activities in the summer, the growing season characterized by higher evaporative demand. Regardless of the season, yield losses modeled according to the WDI show a greater gradient for saleable yield than for total yield. With a yield reduction rate of −16.6 t/ha in the summer of 2019, the effect of stress is detrimental to the quality of the tubers. We also noticed that each unit of WDI results in a 42% reduction in saleable yield compared to the control.
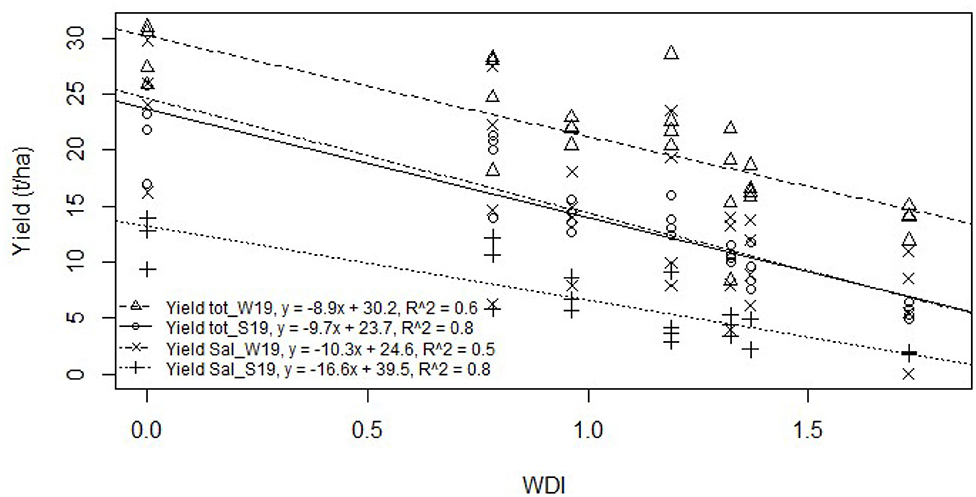
Figure 8. Relation between the two yield components and the water deficit index (WDI) for potato.
In this study, we measured and analyzed environmental, physiological and hydrodynamic parameters to assess the impact of such stress on the plant. Similar to Farquhar and Sharkey (1982), we found that as stress increases, the correlation between stomatal conductance and photosynthetic performance decreases. An accumulation of ABA in the xylem of the plant (Liu et al., 2005; Oukarroum et al., 2009) or damages to the thylakoid membrane that restrict the photophosphorylation and carboxylation process (Kaiser, 1987; Gimenez et al., 1992; Martin and Ruiz-Torres, 1992) may explain the variations in correlation. Thus, excessive exposure to water stress may cause considerable and irreversible damage to the biochemical and physiological metabolisms of the plant (Xu et al., 2010).
The results show a general increase in stomatal conductance after the application of irrigation treatments for both stress episodes. However, they suggest that the plants generally exhibit a lower ability to respond physiologically during the second stress (dotted line in general under solid line), an indication that stress history influences the plant's ability to extract water from the soil (Chaves et al., 2002; Sarker et al., 2019). These results could be explained by the natural effect of leaves aging (Vos and Oyarzún, 1987; Ahmadi et al., 2010) and the effect of previous stresses lead to possible modifications in the functioning of the plant (Bruce et al., 2007). The closure of stomata by potatoes at relatively low soil moisture deficits (Sadras and Milroy, 1996)) and the tendency for a decrease in stomatal conductance to occur at a very early stage of soil drying (Jefferies and MacKerron, 1989; Liu et al., 2005) may also explain these results.
The sap flow response results are consistent with those measured for potato by Kjelgaard et al. (1997). For three greenhouse-grown potato cultivars, Gordon et al. (1997) measured maximum flow rates of up to about 60 g·h−1. These higher values may be explained by differences in plant sizes, soil water and evaporative demand and days of sampling rather than any potential difference in water use (Gordon et al., 1997).
For C3 plant species under optimal production conditions, the photochemical parameter (quantum yield) is close to 0.83 (Björkman and Demmig, 1987) and generally varies proportionally with the plant photosynthesis rate (Kalaji et al., 2011). These results could be explained in the light of the work of Tourneux et al. (2003) who assume that the variations in quantum yield caused by mild to moderate stress are only linked to the closure of the stomata. This temporary and reversible closure of the stomata would lead to an increase in the plant's diffusive resistance to CO2 (Vos and Oyarzún, 1987). However, the effects caused by severe stress are not linked to stomatal regulation (Tourneux et al., 2003).
Similar to Adamski et al. (2011) in their examination of the excess of Fe on potato, we obtained values of minimum fluorescence emitted (FO) with low variance and close to 500 a.u for all treatments including the control treatment. The observed variations and the persistence of the effects could be due to structural damage to the photosynthetic apparatus; the extent of the damage varies with stress levels. These dysfunctions lead to a decrease in excitation energy transfer from the RCs and a decrease in photochemistry (Kalaji et al., 2011).
For the physiological measurements except yields, all treatments showed a significant difference compared to the control (threshold p = 0.05) on the last day of stress and remains as such for the most stressed treatments. This is reflected by a low treatment/control ratio for leaf conductance and quantum yield of photosystem II and a considerable difference between the values for sap flow. However, as the recovery process continues, mildly stressed plants show photosynthetic activities beyond the control. If we take the Dry-1D treatment as an example, it displays a treatment/control ratio >1.0 the day after irrigation for stomatal conductance. This means that the application of irrigation when soil water tension is between −5 and −10 kPa could allow the mildest stressed plant to temporarily present a higher stomatal conductance with respect to the control maintained at an optimal feeding condition, ventilation and management (−20 kPa).
We observed a higher yield loss in the summer season compared to the winter. A lower evaporative demand during the winter season could explain the reduced impact of water deficits on potato (Cabello et al., 2012). From 3 days of stress onward, the effects of stress were significant compared to the control, with losses of more than 43%. In fact, the most significant percentages of saleable yield losses were obtained for the treatments dry-7D and very-dry-7D, the percentages of which exceed 50 and 70%, respectively. In general, losses are greater for the saleable component of the yield than for the total yield. This implies that water stress decreases both the quantity and the quality of the tubers (Deblonde and Ledent, 2001; Cabello et al., 2013; Stark et al., 2013; Rykaczewska, 2017).
Despite the great variability that characterizes physiological data, our methodology made it possible to observe a general tendency according to which the control and treatment values tend to approximate until the 4th day after irrigation. Beyond 4 days, the analysis of variance on sap flow data measured continuously from flowering to senescence shows that the variability between the data could no longer be explained by the treatments applied. This was remarked during the first experiment. We used such a remark during the second experiment for better management of measurement time and a large number of days between two stress application sessions. This last aspect was to allow sufficient time to the plant to reduce the effect of the previous stress.
For all the studied physiological characteristics, the response of plants emerges as strongly correlated with the severity of stress (Kumar et al., 2007; Anithakumari et al., 2012). The least stressed treatment loses between 25 and 35% of its functioning capacity but responds fairly quickly after irrigation (6–24 h). Treatments with moderate stress (dry-3D and very-dry-1 D) have a longer recovery time (2–3 days). Unlike the most stressed plants, they manage to fully recover. With the exception of the dry-1D treatment, there was a systematic decrease in the response of stressed plants during the second stress application. This property has been studied for the expression of potato genes and a “memory” effect has been identified for stressed plants (Monneveux et al., 2013). While this memory capacity confers a level of resistance to the plant by the recombination of genes (Mane et al., 2008), a share of carbon is established that promotes its functioning, although its performance becomes limited (Aliche et al., 2020).
A significant outcome of this study is the development of a water deficit index developed with the objective of providing a tool to help manage irrigation in the field. By considering the timing of application, the severity and duration of water stress, it can predict the impact of water stress on physiological recovery and the extent of yield losses. One practical use of this tool is optimal irrigation planning to minimize yield loss. The variability in the distribution of rainfall due to climate change and the time associated with the displacement of irrigation structures are two factors that influence the results of potato crops. For example, a center pivot irrigation system requires time to complete the turn and change position, WDI provides information on the preferred watering schedules to maximize yield. Thus, a portion of land subject to an irrigation deficit of −45 kPa for 1 day (dry-1D) and having a WDI close to zero (0.78) must be preferred over very-dry-1D (1.19) since the variation yield would be significant when the plant changed from dry-1D to dry-3D (0.96). However, the effect would not be significant between very-dry-1D and very-dry-3D (1.37). In addition, our index indicates that beyond 3 days, the less severe irrigation threshold (dry) has a lower yield loss growth rate than very-dry-1D. Thus, a farmer who prioritizes maintaining very dry soil for a day or less will have higher profits than one who avoids the dry-3D to dry-7D.
Overall, when using irrigation structures that cannot cover the entire field at the same time (e.g., center pivot and lateral-move systems), IDW allows for better irrigation planning and sets priorities based on estimated or acceptable yield losses. When irrigation is by drip or sprinkler and covers the entire area, IDW can be used to maintain deficit irrigation to increase water use efficiency. Under conditions of limited water access and sustainable agriculture, irrigation management can be based on values of WDI in the vicinity of 0.78 which provides yield levels similar to optimal water supply conditions while using 10% less water. For different water stress thresholds applied, we observed a differential variation of the WDI and the reactivation of physiological activities after irrigation. Thus, WDI would provide a numerical value that incorporates several factors that condition the plant's ability to adapt to stress. Therefore, WDI could be used as the physiological factor needed to account for plants' ability to meet the evaporative demand in root harvesting models. Instead of calculating the needs over a period, we could then increase the irrigation frequencies and optimize the irrigation dose to minimize losses during the recovery of physiological activities.
Globally, drought represents a limiting factor for potato production and has potential consequences on food security worldwide. This work consists of investigating the impact of water deficit intensity and duration on the physiological activity of potato plants at two specific development stages. Accordingly, we inflicted water stress treatments consisting of the application of −40 (dry) and −60 kPa (very dry) of soil matric potential across three stress periods of 1 (1D), 3 (3D), and 7 (7D) days. We also included a control or reference treatment consisting of −20 kPa of soil matric potential during the whole experimental period. We measured the impacts of water stress with a variety of sensors, including a pyranometer and a custom-made potentiometer, in addition to temperature and relative humidity, energy quantum, stomatal conductance, and sap flow sensors. Our results indicate that when subjected to water stress of moderate to high severity, the potato requires a response time to recover some or all of its physiological functioning capacity, and the effect on its tuber yield is considerable. Under the most stressed treatments, the plants were unable to fully recover after 7 days of stress. We have observed that an increase in recovery occurs within days of rewatering, but in most cases, the plants did not reach full potential. In terms of yield, no significant difference was obtained between water stress treatment with a 1-day duration and the control. With 10% less irrigation water, greater efficiency of use was obtained for that stress treatment than for the control. For the other treatments, major yield losses were obtained.
Furthermore, we proposed a new water deficit index (WDI) that enables the modeling of yields as a function of the applied stress. The WDI shows potential for predicting yields of potato crops by integrating the most important factors that affect the plant, i.e., the severity, duration and timing of application of stress. It allows studying the influence of each treatment on the yield and targeting a range of 0–0.78 for which the effects are not significant. Thus, with knowledge of the cultivation conditions, the WDI permits making predictions on the impact of water stress on the yield level that would be possible to obtain. Therefore, the consideration of response time in future research on water stress impacts on plants should allow for better estimation of root harvest, increased water productivity and reduced water loss.
The datasets generated for this study are available on request to the corresponding author.
MJ, JG, and SG were responsible for the planning and design of the research work. MJ carried out the experiments and data analysis. MJ and PC participated in the drafting and translation of the manuscript. TG proposed methods of data analysis and participated in the overall structuring of the research. JG and TG reviewed and proofread the paper. All authors contributed to the article and approved the submitted version.
This research was supported by a grant (CRDPJ 514551-17—Irrigation de précision et gestion intégrée de l'eau en production de pomme de terre) from the Natural Sciences and Engineering Research Council (NSERC) of Canada.
The authors declare that the research was conducted in the absence of any commercial or financial relationships that could be construed as a potential conflict of interest.
The authors acknowledge the support of all Lac Saint-Jean (QC, Canada) potato growers who participated in the project funding and provided the soil samples used to conduct the experiments. We want to acknowledge Dr. Guillaume Letourneau who contributed to setting up and programming the instrumentation system.
The Supplementary Material for this article can be found online at: https://www.frontiersin.org/articles/10.3389/fagro.2020.590312/full#supplementary-material
Adamski, J. M., Peters, J. A., Danieloski, R., and Bacarin, M. A. (2011). Excess iron-induced changes in the photosynthetic characteristics of sweet potato. J. Plant Physiol. 168, 2056–2062. doi: 10.1016/j.jplph.2011.06.003
Afzaal, H., Farooque, A. A., Abbas, F., Acharya, B., and Esau, T. (2020). Precision irrigation strategies for sustainable water budgeting of potato crop in prince Edward Island. Sustainability 12:2419. doi: 10.3390/su12062419
Agriculture Agri-Food Canada (2019). Potato Market Information Review, 2018-2019 (AAFC No. 13006E). Crops and Horticulture Division, Agriculture and Agri-Food Canada. Available online at: https://www.agr.gc.ca/resources/prod/doc/pdf/potato_market_review_revue_marche_pomme_terre_2018-eng.pdf
Ahmadi, S. H., Andersen, M. N., Plauborg, F., Poulsen, R. T., Jensen, C. R., Sepaskhah, A. R., et al. (2010). Effects of irrigation strategies and soils on field-grown potatoes: gas exchange and xylem [ABA]. Agric. Water Manage. 97, 1486–1494. doi: 10.1016/j.agwat.2010.05.002
Aliche, E. B., Theeuwen, T. P. J. M., Oortwijn, M., Visser, R. G. F., and van der Linden, C. G. (2020). Carbon partitioning mechanisms in potato under drought stress. Plant Physiol. Biochem. 146, 211–219. doi: 10.1016/j.plaphy.2019.11.019
Anithakumari, A. M., Nataraja, K. N., Visser, R. G. F., and van der Linden, C. G. (2012). Genetic dissection of drought tolerance and recovery potential by quantitative trait locus mapping of a diploid potato population. Mol. Breed. 30, 1413–1429. doi: 10.1007/s11032-012-9728-5
Baker, N. R. (2008). Chlorophyll fluorescence: a probe of photosynthesis in vivo. Annu. Rev. Plant Biol. 59, 89–113. doi: 10.1146/annurev.arplant.59.032607.092759
Benam, M. B. K., and Hassanpanah, D. (2007). Evaluation of different potato cultivars at different irrigation periods and different drought stages. Acta Horticult. 729, 183–188. doi: 10.17660/actahortic.2007.729.28
Bijanzadeh, E., Barati, V., Emam, Y., and Pessarakli, M. (2019). Assessment of the crop water stress index and color quality of bur clover (Medicago polymorpha L.) under different irrigation regimes. Commun. Soil Sci. Plant Anal. 50, 2825–2835. doi: 10.1080/00103624.2019.1679166
Birch, P. R. J., Bryan, G., Fenton, B., Gilroy, E. M., Hein, I., Jones, J. T., et al. (2012). Crops that feed the world 8: potato: are the trends of increased global production sustainable? Food Sec. 4, 477–508. doi: 10.1007/s12571-012-0220-1
Björkman, O., and Demmig, B. (1987). Photon yield of O2 evolution and chlorophyll fluorescence characteristics at 77 K among vascular plants of diverse origins. Planta, 170, 489–504. doi: 10.1007/BF00402983
Boguszewska-Mańkowska, D., Pieczyński, M., Wyrzykowska, A., Kalaji, H. M., Sieczko, L., Szweykowska-Kulińska, Z., et al. (2018). Divergent strategies displayed by potato (Solanum tuberosum L.) cultivars to cope with soil drought. J. Agron. Crop Sci. 204, 13–30. doi: 10.1111/jac.12245
Bruce, T. J. A., Matthes, M. C., Napier, J. A., and Pickett, J. A. (2007). Stressful “memories” of plants: evidence and possible mechanisms. Plant Sci. 173, 603–608. doi: 10.1016/j.plantsci.2007.09.002
Cabello, R., de Mendiburu, F., Bonierbale, M., Monneveux, P., Roca, W., and Chujoy, E. (2012). Large-scale evaluation of potato improved varieties, genetic stocks and landraces for drought tolerance. Am. J. Potato Res. 89, 400–410. doi: 10.1007/s12230-012-9260-5
Cabello, R., Monneveux, P., De Mendiburu, F., and Bonierbale, M. (2013). Comparison of yield based drought tolerance indices in improved varieties, genetic stocks and landraces of potato (Solanum tuberosum L.). Euphytica 193, 147–156. doi: 10.1007/s10681-013-0887-1
Chaves, M. M., Pereira, J. S., Maroco, J., Rodrigues, M. L., Ricardo, C. P. P., Osório, M. L., et al. (2002). How plants cope with water stress in the field. Photosynthesis and growth. Ann. Bot. 89, 907–916. doi: 10.1093/aob/mcf105
Clausnitzer, F., Köstner, B., Schwärzel, K., and Bernhofer, C. (2011). Relationships between canopy transpiration, atmospheric conditions and soil water availability–analyses of long-term sap-flow measurements in an old Norway spruce forest at the Ore Mountains/Germany. Agric. For. Meteorol. 151, 1023–1034. doi: 10.1016/j.agrformet.2011.04.007
Cucho-Padin, G., Rinza, J., Ninanya, J., Loayza, H., Quiroz, R., and Ramirez, D. A. (2020). Development of an open-source thermal image processing software for improving irrigation management in potato crops (Solanum tuberosum L.). Sensors 20:472. doi: 10.3390/s20020472
Dagnelie, P. (2000). La planification des expériences: choix des traitements et dispositif expérimental. J. Soc. Stat. 141, 1–20.
Dahal, K., Li, X. Q., Tai, H., Creelman, A., and Bizimungu, B. (2019). Improving potato stress tolerance and tuber yield under a climate change scenario–a current overview. Front. Plant Sci. 10:563. doi: 10.3389/fpls.2019.00563
Dang, H., Zhang, L., Yang, W., Feng, J., Han, H., and Chen, Y. (2019). Severe drought strongly reduces water use and its recovery ability of mature Mongolian Scots pine (Pinus sylvestris var. mongolica Litv.) in a semi-arid sandy environment of northern China. J. Arid Land 11, 880–891. doi: 10.1007/s40333-019-0029-2
De Lara, A., Khosla, R., and Longchamps, L. (2018). Characterizing spatial variability in soil water content for precision irrigation management. Agronomy 8, 1–8. doi: 10.3390/agronomy8050059
De Mendiburu, F. (2019). agricolae: Statistical Procedures for Agricultural Research. R package version 1.3-1. Available online at: https://cran.r-project.org/package=agricolae
Deblonde, P. M. K., and Ledent, J. F. (2001). Effects of moderate drought conditions on green leaf number, stem height, leaf length and tuber yield of potato cultivars. Eur. J. Agron. 14, 31–41. doi: 10.1016/S1161-0301(00)00081-2
Dechassa, N., Schenk, M. K., Claassen, N., and Steingrobe, B. (2003). Phosphorous efficiency of cabbage, carrot and potato. Plant Soil 250, 215–224. doi: 10.1023/A:1022804112388
Djebli, A., Hanini, S., Badaoui, O., Haddad, B., and Benhamou, A. (2020). Modeling and comparative analysis of solar drying behavior of potatoes. Renew. Energy 145, 1494–1506. doi: 10.1016/j.renene.2019.07.083
Evers, D., Lefevre, I., Legay, S., Lamoureux, D., Hausman, J. F., Rosales, R. O. G., et al. (2010). Identification of drought-responsive compounds in potato through a combined transcriptomic and targeted metabolite approach. J. Exp. Botany 61, 2327–2343. doi: 10.1093/jxb/erq060
FAO (2018). FAOSTAT. Food and Agriculture Organization of the United Nations, Statistics Division. Available online at: http://www.fao.org/faostat/en/#data/QC (accessed May 4, 2020).
Farquhar, G. D., and Sharkey, T. D. (1982). Stomatal conductance and photosynthesis. Annu. Rev. Plant Physiol. 33, 317–345. doi: 10.1146/annurev.pp.33.060182.001533
Galle, A., Florez-Sarasa, I., Thameur, A., De Paepe, R., Flexas, J., and Ribas-Carbo, M. (2010). Effects of drought stress and subsequent rewatering on photosynthetic and respiratory pathways in Nicotiana sylvestris wild type and the mitochondrial complex I-deficient CMSII mutant. J. Exp. Bot. 61, 765–775. doi: 10.1093/jxb/erp344
Gimenez, C., Mitchell, V. J., and Lawlor, D. W. (1992). Regulation of photosynthetic rate of two sunflower hybrids under water stress. Plant Physiol. 98, 516–524. doi: 10.1104/pp.98.2.516
Goltsev, V. N., Kalaji, H. M., Paunov, M., Baba, W., Horaczek, T., and Mojski, J. (2016). Variable chlorophyll fluorescence and its use for assessing physiological condition of plant photosynthetic apparatus. Russ. J. Plant Physiol. 63, 869–893. doi: 10.1134/S1021443716050058
Gordon, R., Dixon, M. A., and Brown, D. M. (1997). Verification of sap flow by heat balance method on three potato cultivars. Potato Res. 40, 267–276.
Idso, S. B., Jackson, R. D., Pinter, P. J. Jr., Reginato, R. J., and Hatfield, J. L. (1981). Normalizing the stress-degree-day parameter for environmental variability. Agric. Meteorol. 24, 45–55.
Iwama, K. (2008). Physiology of the potato: new insights into root system and repercussions for crop management. Potato Res. 51, 333–353. doi: 10.1007/s11540-008-9120-3
Jefferies, R. A., and MacKerron, D. K. L. (1989). Radiation interception and growth of irrigated and droughted potato (Solanum tuberosum). Field Crops Res. 22, 101–112.
Jia, W., and Zhang, J. (2008). Stomatal movements and long-distance signaling in plants. Plant Signal. Behav. 3, 772–777. doi: 10.4161/psb.3.10.6294
Joshi, M., Fogelman, E., Belausov, E., and Ginzberg, I. (2016). Potato root system development and factors that determine its architecture. J. Plant Physiol. 205, 113–123. doi: 10.1016/j.jplph.2016.08.014
Kaiser, W. M. (1987). Effects of water deficit on photosynthetic capacity. Physiol. Plant. 71, 142–149. doi: 10.1111/j.1399-3054.1987.tb04631.x
Kalaji, H. M., Bosa, K., Ko, J., and Zuk-gołaszewska, K. (2011). Effects of salt stress on photosystem II efficiency and CO2 assimilation of two Syrian barley landraces. Environ. Exp. Bot. 73, 64–72. doi: 10.1016/j.envexpbot.2010.10.009
Kalaji, H. M., Schansker, G., Ladle, R. J., Goltsev, V., Bosa, K., Allakhverdiev, S. I., et al. (2014). Frequently asked questions about in vivo chlorophyll fluorescence: practical issues. Photosynth. Res. 122, 121–158. doi: 10.1007/s11120-014-0024-6
Keutgen, A. J., Keutgen, N., Wszelaczyńska, E., Pobereżny, J., Milczarek, D., Tatarowska, B., et al. (2020). Evaluation of photosynthetic and yield traits in ten potato clones and cultivars under farming conditions in Poland. Potato Res. 63, 75–95. doi: 10.1007/s11540-019-09429-w
Kjelgaard, J. F., Stockle, C. O., Black, R. A., and Campbell, G. S. (1997). Measuring sap flow with the heat balance approach using constant and variable heat inputs. Agric. For. Meteorol. 85, 239–250.
Kreuze, J. F., Souza-Dias, J. A. C., Jeevalatha, A., Figueira, A. R., Valkonen, J. P. T., and Jones, R. A. C. (2020). “Viral diseases in potato,” in The Potato Crop, eds H. Campos and O. Ortiz (Cham: Springer), 389–430.
Kumar, S., Asrey, R. A. M., and Mandal, G. (2007). Effect of differential irrigation regimes on potato (Solanum tuberosum) yield and post-harvest attributes. Indian J. Agric. Sci. 77, 366–368.
Lahlou, O., and Ledent, J. F. (2005). Root mass and depth, stolons and roots formed on stolons in four cultivars of potato under water stress. Eur. J. Agron. 22, 159–173. doi: 10.1016/j.eja.2004.02.004
Liu, F., Jensen, C. R., Shahanzari, A., Andersen, M. N., and Jacobsen, S. E. (2005). ABA regulated stomatal control and photosynthetic water use efficiency of potato (Solanum tuberosum L.) during progressive soil drying. Plant Sci. 168, 831–836. doi: 10.1016/j.plantsci.2004.10.016
Liu, F., Shahnazari, A., Andersen, M. N., Jacobsen, S. E., and Jensen, C. R. (2006). Physiological responses of potato (Solanum tuberosum L.) to partial root-zone drying: ABA signalling, leaf gas exchange, and water use efficiency. J. Exp. Bot. 57, 3727–3735. doi: 10.1093/jxb/erl131
Mane, S. P., Robinet, C. V., Ulanov, A., Schafleitner, R., Tincopa, L., Gaudin, A., et al. (2008). Molecular and physiological adaptation to prolonged drought stress in the leaves of two Andean potato genotypes. Funct. Plant Biol. 35, 669–688. doi: 10.1071/FP07293
Martin, B., and Ruiz-Torres, N. A. (1992). Effects of water-deficit stress on photosynthesis, its components and component limitations, and on water use efficiency in wheat (Triticum aestivum L.). Plant Physiol. 100, 733–739. doi: 10.1104/pp.100.2.733
Mehta, P., Jajoo, A., Mathur, S., and Bharti, S. (2010). Chlorophyll a fluorescence study revealing effects of high salt stress on photosystem II in wheat leaves. Plant Physiol. Biochem. 48, 16–20. doi: 10.1016/j.plaphy.2009.10.006
Monneveux, P., Ramírez, D. A., and Pino, M. T. (2013). Drought tolerance in potato (S. tuberosum L.). Can we learn from drought tolerance research in cereals? Plant Sci. 205–206, 76–86. doi: 10.1016/j.plantsci.2013.01.011
Oukarroum, A., Madidi, S. El., Schansker, G., and Strasser, R. J. (2007). Probing the responses of barley cultivars (Hordeum vulgare L.) by chlorophyll a fluorescence OLKJIP under drought stress and re-watering. Environ. Exp. Bot. 60, 438–446. doi: 10.1016/j.envexpbot.2007.01.002
Oukarroum, A., Schansker, G., and Strasser, R. J. (2009). Drought stress effects on photosystem i content and photosystem II thermotolerance analyzed using Chl a fluorescence kinetics in barley varieties differing in their drought tolerance. Physiol. Plant. 137, 188–189. doi: 10.1111/j.1399-3054.2009.01273.x
Parent, A. C., and Anctil, F. (2012). Quantifying evapotranspiration of a rainfed potato crop in South-eastern Canada using eddy covariance techniques. Agric. Water Manage. 113, 45–56. doi: 10.1016/j.agwat.2012.06.014
Peivastegan, B., Hadizadeh, I., Nykyri, J., Nielsen, K. L., Somervuo, P., Sipari, N., and Pirhonen, M. (2019). Effect of wet storage conditions on potato tuber transcriptome, phytohormones and growth. BMC Plant Biol. 19, 1–18. doi: 10.1186/s12870-019-1875-y
Pulido-Calvo, I., Montesinos, P., Roldán, J., and Ruiz-Navarro, F. (2007). Linear regressions and neural approaches to water demand forecasting in irrigation districts with telemetry systems. Biosyst. Eng. 97, 283–293. doi: 10.1016/j.biosystemseng.2007.03.003
R Development Core Team (2018). R: A Language and Environment for Statistical Computing. Vienna: R Foundation for Statistical Computing. Available online at: https://www.r-project.org
Ramírez, D. A., Yactayo, W., Rens, L. R., Rolando, J. L., Palacios, S., De Mendiburu, F., et al. (2016). Defining biological thresholds associated to plant water status for monitoring water restriction effects: Stomatal conductance and photosynthesis recovery as key indicators in potato. Agric. Water Manage. 177, 369–378. doi: 10.1016/j.agwat.2016.08.028
Rinza, J., Ramirez, D. A., Garcia, J., de Mendiburu, F., Yactayo, W., Barreda, C., et al. (2019). Infrared radiometry as a tool for early water deficit detection: insights into its use for establishing irrigation calendars for potatoes under humid conditions. Potato Res. 62, 109–122. doi: 10.1007/s11540-018-9400-5
Rothwell, S. A., Elphinstone, E. D., and Dodd, I. C. (2015). Liming can decrease legume crop yield and leaf gas exchange by enhancing root to shoot ABA signalling. J. Exp. Bot. 66, 2335–2345. doi: 10.1093/jxb/erv042
Rudack, K., Seddig, S., Sprenger, H., Köhl, K., Uptmoor, R., and Ordon, F. (2017). Drought stress-induced changes in starch yield and physiological traits in potato. J. Agron. Crop Sci. 203, 494–505. doi: 10.1111/jac.12224
Rykaczewska, K. (2017). Impact of heat and drought stresses on size and quality of the potato yield. Plant Soil Environ. 63, 40–46. doi: 10.17221/691/2016-PSE
Sadler, E. J., Evans, R. G., Stone, K. C., and Camp, C. R. (2005). Opportunities for conservation with precision irrigation. J. Soil Water Conserv. 60, 371–379. doi: 10.1063/1.1764094
Sadras, V. O., and Milroy, S. P. (1996). Soil-water thresholds for the responses of leaf expansion and gas exchange: a review. Field Crops Res. 47, 253–266.
Sarker, K. K., Hossain, A., Timsina, J., Biswas, S. K., Kundu, B. C., Barman, A., et al. (2019). Yield and quality of potato tuber and its water productivity are influenced by alternate furrow irrigation in a raised bed system. Agric. Water Manage. 224:105750. doi: 10.1016/j.agwat.2019.105750
Schafleitner, R. (2009). Growing more potatoes with less water. Trop. Plant Biol. 2, 111–121. doi: 10.1007/s12042-009-9033-6
Schafleitner, R., Gutierrez Rosales, R. O., Gaudin, A., Alvarado Aliaga, C. A., Martinez, G. N., Tincopa Marca, L. R., et al. (2007). Capturing candidate drought tolerance traits in two native Andean potato clones by transcription profiling of field grown plants under water stress. Plant Physiol. Biochem. 45, 673–690. doi: 10.1016/j.plaphy.2007.06.003
Schansker, G., Tóth, S. Z., and Strasser, R. J. (2005). Methylviologen and dibromothymoquinone treatments of pea leaves reveal the role of photosystem I in the Chl a fluorescence rise OJIP. Biochim. Biophys. Acta Bioenerget. 1706, 250–261. doi: 10.1016/j.bbabio.2004.11.006
Seyni, R. S. D., Ellisseche, D., Sihachakr, D., Jouan, B., and Ducreux, G. (2002). Conséquences du stress hydrique chez huit cultivars de Pomme de terre (Solanum tuberosum L.). Acta Bot. Gall. 149, 139–148. doi: 10.1080/12538078.2002.10515949
Shaffer, K. H., and Runkle, D. L. (2007). Consumptive Water-Use Coefficients for the Great Lakes Basin and Climatically Similar Areas. U.S. Geological Survey Scientific Investigation Report 2007-5197. Reston, VA: US Geological Survey.
Stark, J. C., Love, S. L., King, B. A., Marshall, J. M., Bohl, W. H., and Salaiz, T. (2013). Potato cultivar response to seasonal drought patterns. Am. J. Potato Res. 90, 207–216. doi: 10.1007/s12230-012-9285-9
Statistics Canada (2012). Tableau 1-1. Volume d'irrigation selon le mois, 2012—Province ou région. Ottawa, ON: Government of Canada.
Statistics Canada (2019). Table 32-10-0358-01: Area, Production and Farm Value of Potatoes. Available online at: https://www150-statcan-gc-ca.acces.bibl.ulaval.ca/t1/tbl1/en/tv.action?pid=3210035801 (accessed May 4, 2020).
Steyn, J. M., Du Plessis, H. F., Fourie, P., and Hammes, P. S. (1998). Yield response of potato genotypes to different soil water regimes in contrasting seasons of a subtropical climate. Potato Res. 41, 239–254. doi: 10.1007/BF02358194
Strasser, R. J., Tsimilli-michael, M., Qiang, S., and Goltsev, V. (2010). Simultaneous in vivo recording of prompt and delayed fluorescence and 820-nm reflection changes during drying and after rehydration of the resurrection plant Haberlea rhodopensis. Biochim. Biophys. Acta 1797, 1313–1326. doi: 10.1016/j.bbabio.2010.03.008
Strasserf, R. J., Srivastava, A., and Govindjee. (1995). Polyphasic chlorophyll a fluorescence transient in plants and cyanobacteria. Photochem. Photobiol. 61, 32–42.
Strauss, A. J., Krüger, G. H. J., Strasser, R. J., and Heerden, P. D. R. V. (2006). Ranking of dark chilling tolerance in soybean genotypes probed by the chlorophyll a fluorescence transient OJIP. Environ. Exp. Bot. 56, 147–157. doi: 10.1016/j.envexpbot.2005.01.011
Tourneux, C., Devaux, A., Camacho, M. R., Mamani, P., and Ledent, J.-F. (2003). Effect of water shortage on six potato genotypes in the highlands of Bolivia (II): water relations, physiological parameters. Agronomie 23, 181–190. doi: 10.1051/agro
Vermeulen, K., Steppe, K., Janssen, K., Bleyaert, P., Dekock, J., Aerts, J., et al. (2007). Solutions to overcome pitfalls of two automated systems for direct measurement of greenhouse tomato water uptake. HortTechnology 17, 220–226. doi: 10.21273/HORTTECH.17.2.2
Vos, J., and Oyarzún, P. J. (1987). Photosynthesis and stomatal conductance of potato leaves-effects of leaf age, irradiance, and leaf water potential. Photosynth. Res. 11, 253–264. doi: 10.1007/BF00055065
Whitley, R., Zeppel, M., Armstrong, N., Macinnis-Ng, C., Yunusa, I., and Eamus, D. (2008). A modified Jarvis-Stewart model for predicting stand-scale transpiration of an Australian native forest. Plant Soil 305, 35–47. doi: 10.1007/s11104-007-9399-x
Wickham, H. (2017). tidyverse: Easily Install and Load the “Tidyverse”. R package version 1.2.1. Available online at: https://cran.r-project.org/package=tidyverse
Xu, Z., Zhou, G., and Shimizu, H. (2010). Plant responses to drought and rewatering. Plant Signal. Behav. 5, 649–654. doi: 10.4161/psb.5.6.11398
Zarzyńska, K., Boguszewska-Mańkowska, D., and Nosalewicz, A. (2017). Differences in size and architecture of the potato cultivars root system and their tolerance to drought stress. Plant Soil Environ. 63, 159–164. doi: 10.17221/4/2017-PSE
Keywords: soil matric potential, sap flow, fluorescence, irrigation, plant recovery, physiological activity, stomatal conductance, water deficit index
Citation: Jacques MM, Gumiere SJ, Gallichand J, Celicourt P and Gumiere T (2020) Impacts of Water Stress Severity and Duration on Potato Photosynthetic Activity and Yields. Front. Agron. 2:590312. doi: 10.3389/fagro.2020.590312
Received: 01 August 2020; Accepted: 13 October 2020;
Published: 12 November 2020.
Edited by:
Ayman E. L. Sabagh, Siirt University, TurkeyReviewed by:
Rosalind Jane Dodd, Lincoln University, New ZealandCopyright © 2020 Jacques, Gumiere, Gallichand, Celicourt and Gumiere. This is an open-access article distributed under the terms of the Creative Commons Attribution License (CC BY). The use, distribution or reproduction in other forums is permitted, provided the original author(s) and the copyright owner(s) are credited and that the original publication in this journal is cited, in accordance with accepted academic practice. No use, distribution or reproduction is permitted which does not comply with these terms.
*Correspondence: Silvio J. Gumiere, c2lsdmlvLWpvc2UuZ3VtaWVyZUBmc2FhLnVsYXZhbC5jYQ==
Disclaimer: All claims expressed in this article are solely those of the authors and do not necessarily represent those of their affiliated organizations, or those of the publisher, the editors and the reviewers. Any product that may be evaluated in this article or claim that may be made by its manufacturer is not guaranteed or endorsed by the publisher.
Research integrity at Frontiers
Learn more about the work of our research integrity team to safeguard the quality of each article we publish.