- Kyoto University, Kyoto, Japan
The femtosecond laser direct writing technique can allow spatially selective crystallization with suppression of thermal conduction effects. In the case of Al2O3-R2O3 (R = Y, Dy) glass, the polarization-dependent periodic nanostructure with crystallization is self-assembled, however, the formation mechanism of self-assembled nanocrystals in glass remains to be clarified. We focused on Al2O3-Lu2O3 glass prepared by a containerless laser melting method and demonstrated the formation of a nanograting with crystallization by femtosecond laser irradiation. Polarized luminescence measurements of the crystallized region by the pulse bursts with a controllable number of pulses reveal that luminescence anisotropy increased at more than 50 pulses in a burst, suggesting the formation of the nanograting. We have also followed the time variation of birefringence by polarized light imaging to evaluate the time scale for the formation of nanogratings with crystallization.
1 Introduction
The femtosecond laser direct writing technique is a powerful tool for precise material processing due to the limited effect of thermal conduction. Therefore, various studies for space-selective modification in glass have been performed over the past few decades (Davis et al., 1996; Glezer et al., 1996). Especially 3D patterning of nonlinear optical crystals inside glass by femtosecond laser irradiation is an epoch-making discovery (Miura et al., 2000). Crystallization induced by using the focal spot of the laser beam with longer pulse width as a point heat source leads to the crystal axis orientation depending on the laser scanning direction (Ogawa et al., 2013). The crystallization also takes place due to the heat accumulation induced by a femtosecond laser beam with a high pulse repetition rate (He et al., 2014; Stone et al., 2015). The electron excitation is initiated by the multiphoton process (Lancry et al., 2011) and then the electron-phonon coupling leads to a temperature increase. According to the relation between thermal diffusion coefficient and interpulse time, the pulse energy is deposited repeatedly at the focal point resulting in heat accumulation (Shimizu et al., 2010). When the focus moves inside a glass sample slowly enough, the local crystallization in the surrounding region of the focus occurs by cooling (Stone et al., 2018). In any case, since the crystallization is driven by a temperature gradient due to the point heat source, isotropic crystal growth occurs. Recently the periodic pattern of crystallization in 3D along the scanning direction due to the 3D interference phenomenon between the focused ultrafast laser and scattered spherical wave based on the light-matter interaction in the glass was reported (Zhang et al., 2021). The orientation of the crystalized region only changes with the scanning direction and is independent of the laser polarization. In contrast, polarization-sensitive light-matter interactions are observed in SiO2 and GeO2 glass (Shimotsuma et al., 2003; Asai et al., 2015). The nanograting composed of oxygen defects and nanovoids exhibits optical anisotropy of form-birefringence (Bricchi et al., 2004; Shimotsuma et al., 2010). We have also reported that nanograting of glass-crystal phase transition in Al2O3-R2O3 glass (R: rare earth element) (Mori et al., 2016; Shimotsuma et al., 2020). Subsequently, self-organized periodic crystallization in multicomponent La2O3–Ta2O5–Nb2O5 glass has been also observed (Zhang et al., 2019). Since the crystallization of glass is typically triggered by a thermal gradient, the crystal growth is isotropic for a point heat source. On the other hand, the periodic array of amorphous and crystallized regions in nanoscale is oriented in response to the laser polarization direction. Although similar structural modification with a strained structure has been also observed in the case of indirect bandgap semiconductor crystals such as Si (Mori et al., 2015) and GaP (Shimotsuma et al., 2016), the mechanism is still under debate. Here we focused on Al2O3-Lu2O3 glasses, which have a narrower vitrification range and crystallize more easily than other rare-earth-containing binary glasses (Watanabe et al., 2012). The lutetium aluminum garnet (Lu3Al5O12) crystal expected to precipitate is promising a host for scintillation materials due to its high density (6.73 g⋅cm−3), high effective atomic number (Zeff = 60), and high physical and chemical durability. To suppress heat accumulation and efficiently form the glass-crystal nanograting structure, a burst pulse was employed. The burst pulse of the femtosecond laser is well known as an efficient ablation technique without thermal damage (Kerse et al., 2016). We have also observed the time variation of birefringence during laser irradiation.
2 Experimental
Because the glass with the composition of 70Al2O3-30Lu2O3 or 70Al2O3-28.3Lu2O3-1.7CeO2 (mol%) does not contain common network forming oxides, we prepared the glass sample by the containerless laser melting method. Here, Ce3+ shows luminescence due to the 4f-5d transition. The 4f orbital is hardly affected by the crystal field, whereas the 5d orbital is strongly affected by the crystal field, resulting in crystal field splitting. Furthermore, since the crystal field in a glass without long-range order is inhomogeneous, the luminescence intensity of Ce3+ is increased with increasing the enhancement of symmetry due to crystallization. Therefore, the change in the luminescence intensity of Ce3+ can be used as an index for crystallization. Al2O3, Lu2O3, and CeO2 were used as starting materials. The homogeneously mixed powders in alumina mortar were pressed into pellets. The calcination was performed at 1,100°C for 12 h. The sintered pellets were crushed and subjected to the containerless melting method. A piece of about 10 mg were levitated with dry air gas (N2: 79% O2: 21%) and melted by focusing of 100 W CO2 laser beam via a ZnSe lens (f = 254 mm) for several tens of seconds. The molten sample was quenched by turning the laser off, and a transparent spherical sample with a diameter of about 2 mm was obtained. X-ray diffraction measurements (XRD) (Rigaku, Japan; SmartLab) were performed to confirm the vitrification of as-prepared samples. Glass transition temperature (Tg) and crystallization temperature (Tx) were determined by differential scanning calorimetry (DSC) (Rigaku, Japan; Thermo plus EVO2 DSC8271) at a temperature increase rate of 10°C⋅min−1. Excitation and emission spectra of 70Al2O3-28.3Lu2O3-1.7CeO2 glass samples before and after crystallization by heat treatment at 1,000 °C for 2 h were measured by UV-Vis spectrophotometer (Horiba-JobinYvon, Japan; FluoroMax). The top and bottom surfaces of the spherical glass sample were polished and flattened for laser irradiation. Laser experiments were performed using a mode-locked Ti:sapphire laser (Coherent, United States; RegA 9,000). The center wavelength and the pulse width are 800 nm and 60 fs, respectively. Laser pulses were focused at 50 μm below the sample surface through an objective lens (×50, NA = 0.80) (Nikon, Japan; CFI TU Plan Fluor EPI 50×). The pulse energy and the pulse repetition rate were tuned from 0.8 to 2.4 μJ and from 10 to 250 kHz, respectively. The laser writing was performed by the sample moving in the direction perpendicular to the laser propagation direction by an XYZ stage with a speed from 5 to 250 μm⋅s−1. To analyzed the local structural change in glass, a confocal Raman spectroscopy (Tokyo Instruments, Japan; Nano Finder30) excited by 532 nm DPSS laser was performed. After the laser irradiation, the glass samples were physically polished with a diamond lapping sheet (grain size: 1 μm) to the depth of the laser writing region and observed by field emission scanning electron microscopy (SEM) (JEOL, Japan; JSM-6705F). The polishing depth was confirmed by a micrometer. Although a slight polishing trace was confirmed in SEM observation, no apparent damaged morphology of the nanograting structure was observed. In order to analyze the detailed structural changes, the laser writing region was investigated by a high-resolution transmission electron microscope (HR-TEM) (JEOL, Japan; JEM-2200FS). We have also inspected the birefringence during laser irradiation by using a polarization high-speed camera (Photron, Japan; CRYSTA PI-1P) with an acquisition rate of 525,000 fps (Figure 1). When the pulse repetition rate was set to be 250 kHz, this flame rate means that one pulse is injected approximately once every two frames. In this observation, to remove the internal stress of the as-prepared glass sample, annealing at 800°C for 30 min was performed prior to the inspection. The laser pulses were focused by using a ×20 objective lens (NA = 0.45) (Nikon, Japan; CFI LU Plan Fluor EPI 20×).

FIGURE 1. Schematic diagram of the polarization imaging system. LED with a wavelength of 520 nm was used as a light source. CP, SA, OL, DM, and BF denote circular polarizer, sample, objective lens, dichroic mirror, and bandpass filter with 520 ± 30 nm, respectively.
We have also performed the burst pulse experiments (Figure 2). The burst pulse irradiation is achieved by using a delay generator (Stanford Research Systems, United States; DG645) to thin out the original laser pulse train. The pulse repetition rate of the original pulse train was set to 250 kHz, corresponding to the pulse interval of 4 μs. In the experiments, the total number of pulses was fixed to 8,000 pulses. The number of pulses in a burst (Nburst) and the burst repetition rates (Rburst) were tuned from 10 to 200 pulses, and from 0.1 to 20 kHz, respectively. For example, in the case of the burst train with the Nburst of 100 pulses and the Rburst of 10 kHz, the interval between the burst pulse trains and the numbers of the burst pulse train correspond to 100 μs and 80, respectively. After laser irradiation, polarized luminescence spectra of Ce3+ were measured with a confocal microscope. Then, the sample was polished to the depth of the laser irradiated area, and the laser irradiated area was observed by SEM.
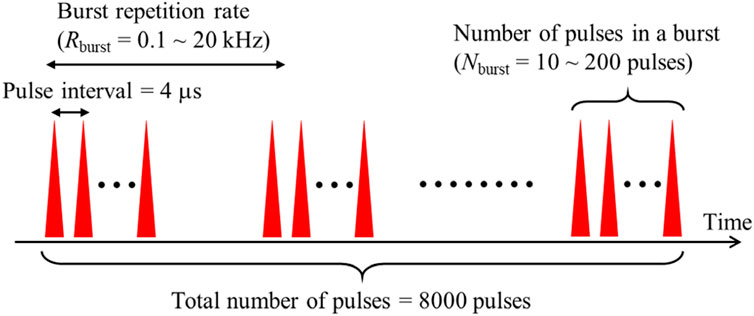
FIGURE 2. Schematic pulse sequence of the burst pulse experiments. The pulse interval and the total number of pulses were fixed to 4 μs and 8,000 pulses, respectively. The burst repetition rate (Rburst) and the number of pulses in a burst (Nburst) were tuned.
3 Results and discussion
Figure 3 show the XRD pattern and DSC curve of the as-prepared 70Al2O3-30Lu2O3 glass sample. The XRD pattern (Figure 3A) shows broad humps and a sharp peak at around 35°, suggesting that some crystals may be precipitated. The diffraction pattern of Lu3Al5O12 crystal is shown in the bottom row. Compared with this diffraction pattern, the peak around 35° may be attributed to the slight precipitation of Lu3Al5O12 crystals. From the DSC curve (Figure 3B), Tg and Tx of the glass were 890 °C and 935 °C respectively. To assess the influence of precipitation of Lu3Al5O12 nanocrystals in the as-prepared glass, the transmission spectra of the as-prepared Al2O3-Lu2O3 and Al2O3-Lu2O3-CeO2 glasses were observed (Supplementary Figure S1). While the decrease in transmission at about 400 nm or less is due to the band gap of the glasses or the absorption of Ce3+, no apparent decrease in transmission due to Rayleigh scattering was observed. Furthermore, no apparent scattering was also observed during the laser experiments. Therefore, we have concluded that the influence of the slight precipitation of Lu3Al5O12 nanocrystals in the as-prepared glass is restrictive.
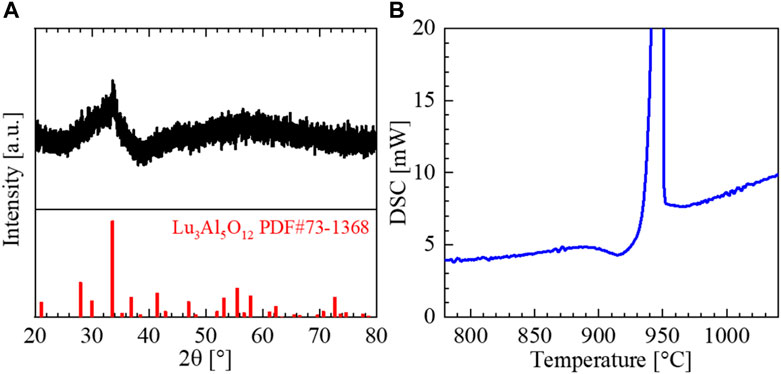
FIGURE 3. (A) XRD pattern and (B) DSC curve of the as-prepared 70Al2O3-30Lu2O3 glass sample. In the XRD pattern, the reference pattern of Lu3Al5O12 crystal is also plotted.
Figures 4A,B show the excitation-emission patterns of 70Al2O3-28.3Lu2O3-1.7CeO2 glass before and after crystallization. The excitation at λem = 550 nm and the emission at λex = 400 nm are also shown in Figure 4C. The excitation spectra between glass and crystallized samples were different. A peak at 380 nm for glass sample, while a weak peak at 350 nm and a strong peak at 450 nm for the crystallized sample were observed. These two excitation peaks for the crystallized sample are due to the absorption of 4f → 5d2 and 4f → 5d1 of Ce3+ ions, respectively (Blazek et al., 2004). For crystals, the 5d orbitals are strongly affected by the crystal field, and the 5d states split into 2T2g and 2E.g., states based on ligand field theory. On the other hand, the single peak at 380 nm for glass implies due to a weaker ligand field than that for the crystal. In terms of the emission spectrum, a broad spectrum peaking at 500 nm for the glass sample was redshifted to 550 nm after crystallization. This emission spectrum is attributed to the transition of electrons in the 5d1 excited state to the 2F5/2 and 2F7/2 ground states (Blazek et al., 2004). The difference in emission spectrum before and after crystallization in Figure 4C indicates that a large tetragonal distortion occurs at the CeO8 sites in the crystal compared to glass. Indeed, it has also been reported that the redshift of fluorescence occurs when the crystal field splitting increases due to the degree of CeO8 tetragonal distortion in the garnet structure (Lin et al., 2019).
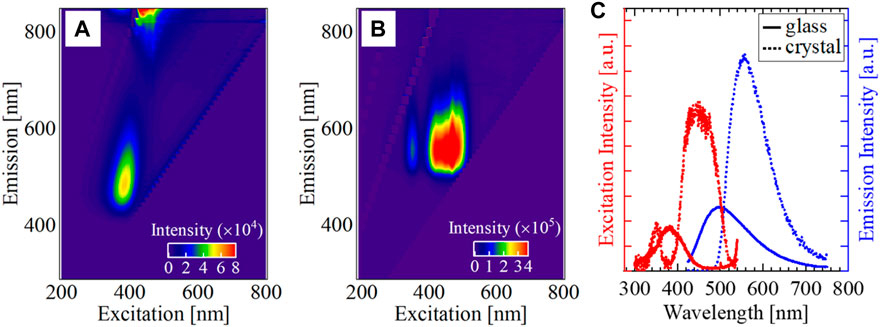
FIGURE 4. The excitation emission contour maps (A) before and (B) after crystallization of 70Al2O3-28.3Lu2O3-1.7CeO2 glass by annealing at 1,000°C for 2 h. (C) The excitation and emission spectra of the as-prepared glass and the crystallized glass (λem = 550 nm, λex = 400 nm).
Raman spectra before and after the laser irradiation are shown in Figure 5. The Raman spectral changes as a function of the pulse repetition rate are shown in Figure 5A. The pulse energy was 1.0 μJ. The irradiated number of pulses was set the same as to be 500,000. In the experiments, the 70Al2O3-30Lu2O3 glass samples were used to remove the influence of luminescence. Although no apparent Raman peaks were observed in the as-prepared glass sample, some characteristic sharp peaks were observed after laser irradiation (Figure 5A). The appearance of the Raman peak assigned to Lu3Al5O12 crystal was more remarkable for the higher pulse repetition rate more than 50 kHz. Figure 5B shows the Raman spectra of the laser-writing traces with various scanning speeds. The pulse energy and the repetition rate were 1.0 μJ and 250 kHz, respectively. From this figure, the crystal-derived peaks are clearly seen at slower scan speeds, and at 250 μm⋅s−1, the Raman spectra are almost identical to those of glass. This suggests that at slower scan speeds, crystal growth is enhanced by thermal accumulation and the crystallinity is increased. In the case of high scan speed, it is considered that sufficient heat accumulation for crystallization did not occur and the laser-irradiated area remained in the glassy state. From the backscattering electron observation, no apparent elemental distribution was observed after the laser irradiation. Furthermore, Raman spectra for the writing speed of 25 μm⋅s−1, i.e. 10,000 pulses⋅s−1 or less in Figure 5B clearly indicate the crystal precipitation. On the other hand, the crystallization was not observed at repetition rates below 50 kHz (Figure 5A), even though the pulse number of 500,000, is much larger than that for Figure 5B. These results suggest that both enough heat input and enough heat accumulation are required for crystallization. Of course, the possibility of annihilation of crystal nuclei is not zero.
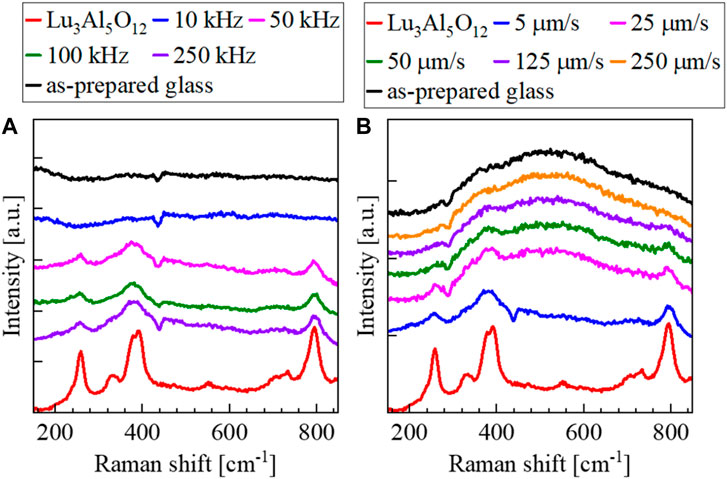
FIGURE 5. Raman spectra of the 70Al2O3-30Lu2O3 glass before and after the femtosecond laser irradiation at (A) various repetition rates and (B) various writing speeds. The reference Raman spectrum of Lu3Al5O12 crystal is also shown. In all experiments, the pulse energy was fixed to 1.0 μJ. For the experiments of tuning the repetition rates, the number of pulses was fixed, while for the experiments of tuning the writing speed, the repetition rate was fixed.
In order to reveal the contribution of heat accumulation, we have roughly simulated an evolution of temperature rise at the focus induced by irradiation of 50 successive laser pulses with various pulse repetition rates based on the thermal diffusion equation (Shimizu et al., 2010). Since the glass composition was close to that of Lu3Al5O12 crystal, the physical properties of the thermal diffusivity: 0.030 cm2 ⋅s−2, the specific heat: 0.419 J⋅g−1 ⋅K−1, and the density: 6.71 g⋅cm−3 of this crystal were used. Assuming the size of the focus is approximately 1 μm, the temperature at the focus just after laser irradiation is calculated to be 1.6 × 10⁵ K. More precise calculations based on such as a two-temperature model should be required. From the simulation (Figure 6), in the case of the repetition rate of 20 kHz or over, the temperature does not enough drop during the arrival of the next pulse, leading to heat accumulation. On the other hand, in the case of the repetition rate of 10 kHz, a spectacular rise in temperature is not observed. Therefore, there is a boundary between a heat accumulation regime and a free-of-heat accumulation regime at a pulse repetition rate of approximately 20 kHz.
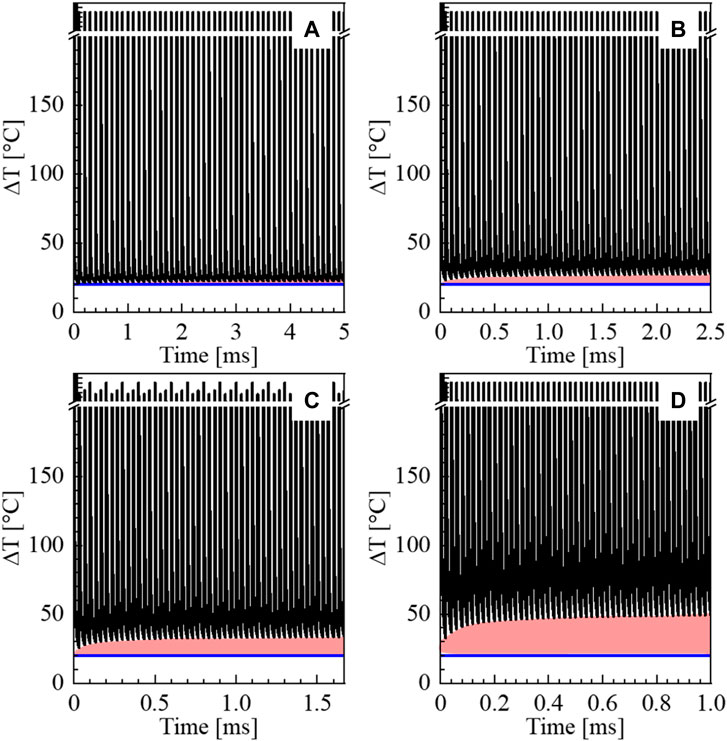
FIGURE 6. Evolution of the temperature rise evolution of temperature rise at the focus induced by irradiation of 50 successive laser pulses with the pulse repetition rate of (A) 10 kHz, (B) 20 kHz, (C) 30 kHz, and (D) 50 kHz. The blue reference line shows the initial temperature of 20 °C. Red areas are eye guides for heat accumulation.
SEM observation of the laser-writing traces clearly indicates that nanograting structures in the direction perpendicular to the laser polarization direction were formed (Figure 7). Such nanograting structure in the backscattered electron image suggests that the composition or the density constituting the observation surface was periodically modulated. Comparing the structural changes induced by the different pulse repetition rates, the nanograting structure was partially observed for a higher pulse repetition rate (Figures 7B,C). Furthermore, no apparent nanograting was observed for 2.4 μJ and 250 kHz (Figure 7C). We have concluded that although the nanograting is formed temporarily but destroyed by the higher intense laser pulse with a higher pulse repetition rate. Therefore, the optimum laser conditions for nanograting should be determined (Figure 7D). The femtosecond laser with lower pulse energy and lower pulse repetition rate enables the formation of nanogratings in the whole laser-writing trace.
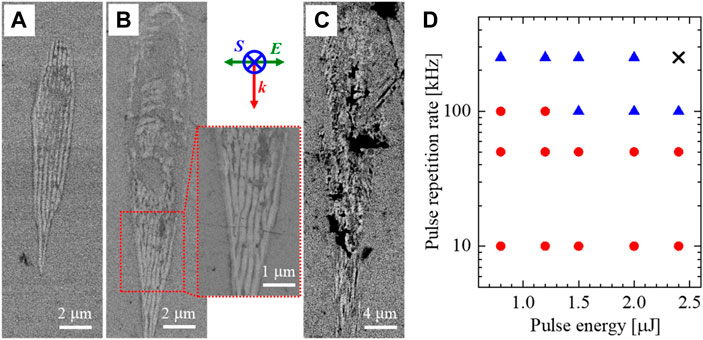
FIGURE 7. Backscattering electron images on the sample surface polished perpendicular to the laser-writing traces. The laser parameters are (A) 0.8 μJ, 50 kHz, (B) 0.8 μJ, 250 kHz, and (C) 2.4 μJ, 250kHz, respectively. A high-magnification image at the dotted area in (B) was also shown. Symbols of S, E, and k indicate the laser writing direction, the laser polarization direction, and the laser propagation direction, respectively. (D) Plots of the laser irradiation conditions for nanograting structure formation in the laser-writing tracks. Symbols of red circles and blue triangles show the laser conditions to form whole or partially nanograting structures, respectively. No apparent nanograting was observed in the laser conditions at the symbol of X.
The inspection of the laser-writing region by HR-TEM is shown in Figures 8A,B. Similar to the backscattering images in Figures 7A,B, the stripe-like dark and bright contrast regions were also observed in HR-TEM images. Fourier-transform images of the dark and bright areas in Figure 8C show a pattern due to crystal existing in the dark area. The irregular pattern for the dark area suggests that polycrystals are deposited in these areas. We have also observed the electron diffraction in the dark area indicating precipitation of Lu3Al5O12 crystal (Figure 8D). These results show that polycrystals of Lu3Al5O12 were periodically precipitated in the stripe-like dark areas. Furthermore, the width of the stripe-like crystallized area increased with an increase in the pulse repetition rate (Table 1). Interestingly, the fraction of crystallized area also increased, suggesting that enlargement of the crystallite size or the acceleration of crystallization occurs due to the heat accumulation caused by a higher pulse repetition rate.
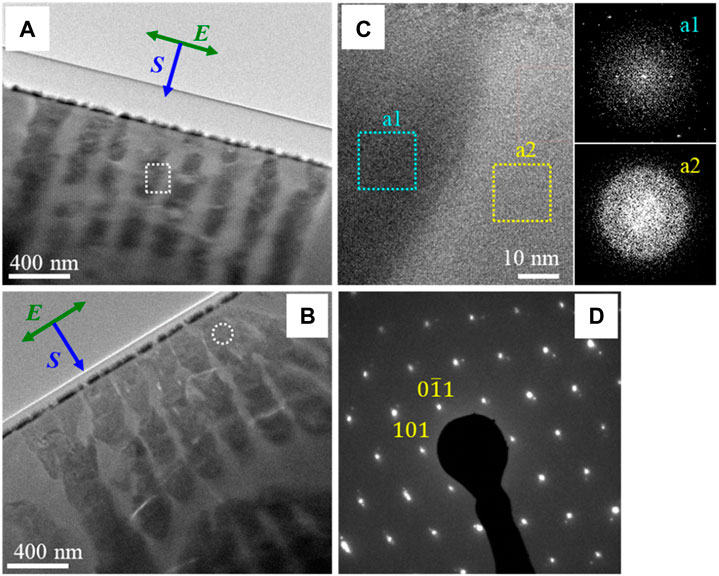
FIGURE 8. HR-TEM images at the nanograting area. The laser parameters are (A) 0.8 μJ, 50 kHz and (B) 0.8 μJ, 250 kHz, respectively. (C) A high-magnification image at the dotted area in (A). FFT images of two different areas, corresponding to dotted squares of a1 and a2 in (C), are also shown. (D) Electron diffraction pattern of dotted circle area in (B).

TABLE 1. Width of the crystalline and amorphous regions, period of nanograting, and the fraction of crystalline area.
Regarding the mechanism of the periodic arrangement of polycrystalline regions, it is possible that periodic changes in nucleation rate occur in the laser-irradiated region during the nucleation, resulting in a periodic arrangement of nucleation regions, or that after nucleation occurs entirely in the laser-irradiated region, the crystal nuclei move so that the polycrystalline regions and glass regions are arranged periodically. In Al2O3-Y2O3 glass (Shimotsuma et al., 2020), it has been speculated that periodic modulation of the electron plasma density causes pressure differences that lead to preferential crystallization in high plasma density regions. Furthermore, in lithium niobium silicate glass, the nanostructure formation is explained as self-assembling, with a driving force for formation prior to phase separation (Cao et al., 2017). By HR-TEM observation, no nanocrystals were observed in the glass regions, suggesting that periodic modulation of the nucleation rate leads to a periodic arrangement of the nucleation regions. This suggests that the nucleation regions are periodically aligned due to periodic changes in the nucleation rate. Not only the glass composition is the almost same as the Lu3Al5O12 crystal, but also no apparent elemental distribution was observed after the laser irradiation. We have previously reported that periodic changes in pressure due to the sparsity of the plasma may contribute to changes in the nucleation rate (Shimotsuma et al., 2020). The higher the pressure, the smaller the energy barrier and the higher the nucleation rate. Therefore, the electron plasma generated by laser irradiation periodically forms sparse and dense regions, and the pressure caused by the electron plasma density modulates the nucleation rate. Although the temperature is also one of the important parameters for nucleation and crystallization, it is hard to imagine the periodic temperature modulation in a nanoscale.
Figure 9 shows the snapshots of polarization phase difference during femtosecond laser irradiation with pulse energies of 1.0, 1.5, or 2.0 μJ at 250 kHz. After the laser irradiation, an increase in phase retardation in the surrounding of the focus was observed for every pulse energy. The expansion rate increased with increasing the pulse energy. These images suggest that the birefringence as the stress propagates from the focus due to structural change. A region of smaller phase retardation around the focus corresponds to the molten region (Shimizu et al., 2010). To evaluate the polarization phase difference at the focus, the time variation of phase retardation at the center of the focus was plotted (Figure 10). In these graphs, the phase retardation is plotted every approximately 1.9 μs and t = 0 means the start of laser irradiation. During the initial 1 ms, the phase retardation increased. There were no big differences in their increasing trend between the different pulse energy. However, the time variation of phase retardation was apparently different after 1.5 ms. The phase retardation remained almost constant or slightly increased in the case of 1.0 μJ, while the value increased with irregular increases and decreases for 1.5 μJ and 2.0 μJ. Such irregular increases and decreases in phase retardation are attributed to the formation and destruction of the periodic crystallized regions. Indeed, these results are consistent with Figure 7. The increase of phase retardation for 1.5 μJ and 2.0 μJ was seemingly caused by the large structural change along with the laser propagation direction.
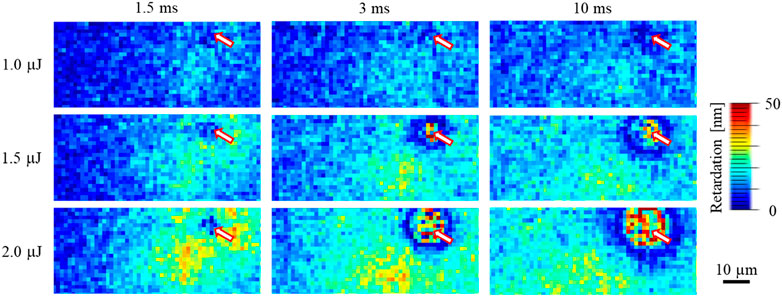
FIGURE 9. Snapshots of the phase retardation map at 1.5, 3, and 10 ms after the femtosecond laser irradiation with different pulse energies of 1.0, 1.5, and 2.0 μJ, respectively. Red arrows filled in white indicate the laser focal spot position.
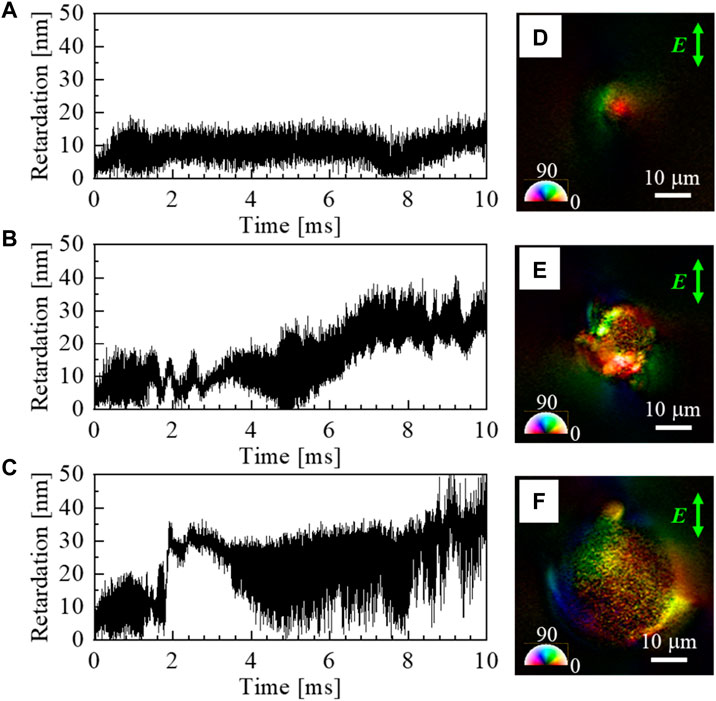
FIGURE 10. Time variation of phase retardation at the focus spot of the femtosecond laser pulse with the pulse energy of (A) 1.0 μJ, (B) 1.5 μJ, and (C) 2.0 μJ, respectively (D–F) Polarization microscope images in the vicinity of the laser focus after the 750,000 pulses irradiation for each pulse energy are also shown.
To suppress heat accumulation, the pulse bursts with various numbers of pulses in a burst (Nburst) and burst repetition rates (Rburst) were irradiated. Figure 11 plots the luminescence intensity in the laser-irradiated regions after irradiation of the various burst pulse trains. The irregular behavior for Nburst = 200 pulses at the Rburst of 0.1 kHz is probably due to experimental error. The luminescence intensity increased with increasing the Nburst and the Rburst. Assuming that the increase in luminescence intensity is proportional to the crystallinity of the laser-irradiated region, the increase in the Nburst and the Rburst imply enhanced crystallinity. Despite the irradiated total number of pulses being the same as 8,000 for each pulse burst, the difference in crystallinity was generated. The possible reason for this phenomenon is interpreted as follows. When the Nburst is small, the time for the temperature range in which crystal growth is dominant is short, whereby the progress in crystallization is slow. In contrast, when the Nburst is large, the time that the crystal can grow becomes longer. Therefore, even though the total number of pulses is the same, crystallization is promoted when the number of pulses in a burst is larger.
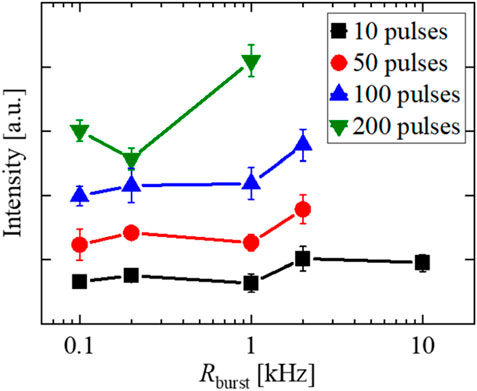
FIGURE 11. Plots of fluorescence intensity for the laser-irradiated region after irradiation of burst trains of various Nburst as a function of the Rburst.
The polarized fluorescence measurements have been also performed (Figure 12). In these measurements, the polarization direction for the excitation and detection is defined as H for perpendicular and V for parallel to the slow axis orientation of nanograting. Similar to Figure 10, the luminescence intensity increased with increasing the Nburst and asymptotically approached that without burst pulses. Interestingly, these results indicate that the luminescence intensity did not depend on the polarization of the excitation light, but the intensity of V-polarized detection light was stronger than that of H (IHH ≃ IVH < IVV ≃ IHV), confirming the anisotropy of the detection light.
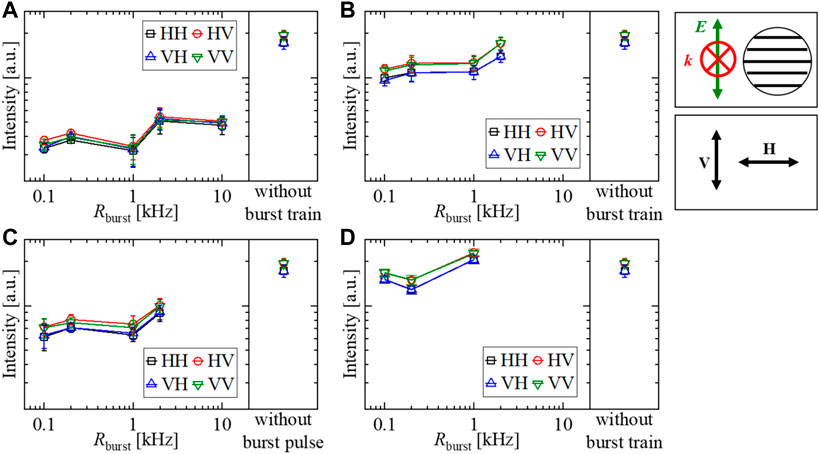
FIGURE 12. Plots of polarization luminescence intensities as a function of the Rburst observed by confocal fluorescence microscope. The Nburst values are (A) 10, (B) 50, (C) 100, and (D) 200 pulses, respectively. The experimental results without a burst pulse train are also shown. A schematic of the nanograting structure is shown. Symbols of E and k indicate the femtosecond laser polarization and the laser propagation direction, respectively. Each polarization direction of the excitation light and the detection light was set to be horizontal (H) or vertical (V) with respect to the nanograting structure orientation.
To remove the effect of the polarization dependence originating from the apparatus, the luminescence intensities were normalized by the luminescence intensity for HH (Figures 13A–D). The intensity ratio is larger than 1.0 corresponding to larger anisotropy of the detection light. In the case of the V-polarized detection light, the luminescence intensity ratios for both VV and HV polarization were distributed from 1.05 to 1.1 in the case of the Nburst of 10, while those were distributed from 1.1 to 1.2 for more than Nburst of 50. This anisotropy was also observed in the experiments without burst pulse trains. On the other hand, no apparent differences were observed in the annealed samples with random crystallization. This increase in the luminescence intensity ratio and the significant difference from that for the heat-treated crystal can be attributed to the formation of nanograting. Indeed, the formation of nanograting was observed in the case of the Nburst of 50 and 200 (Figures 13E,F). As mentioned before, both a decrease in transmittance due to Rayleigh scattering and a characteristic absorption due to Mie scattering has not been observed in the as-prepared glass samples. In addition, we have also compared the polarized Raman spectra of the crystallized region (Supplementary Figure S2). Similar Raman scattering intensities for each condition with the cross-Nicol (HV, VH) or parallel-Nicol (HH, VV) configuration. Therefore, we concluded that the contribution of anisotropic scattering from the crystallized region is negligible. The possible origin of the anisotropy of luminescence could be caused by the residual stress at the interface between glass-crystal phase separation in the nanograting structure. Another possibility is the polarization dependence in the fluorescence process after the nonradiative transition to the defect level formed in the band gap due to the dipole moment created by the defects. It is known that the existence of LuAl antisite defects (Nikl et al., 2005) and oxygen defects (Laguta et al., 2018) in Lu3Al5O12 garnet crystal affects the luminescence properties, but further investigation is needed.
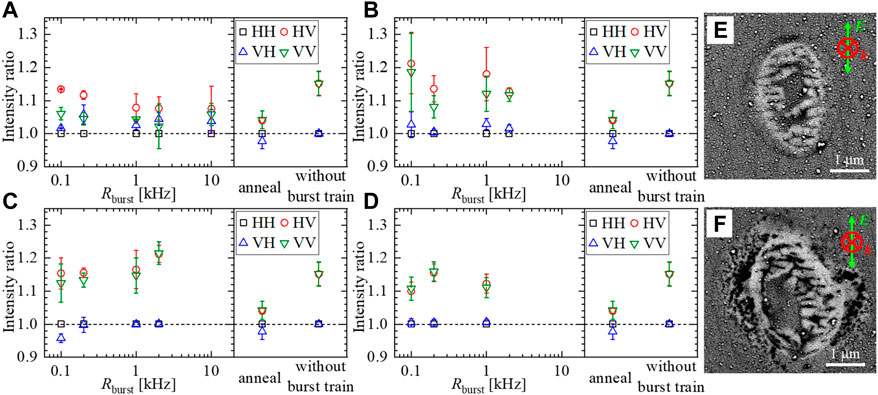
FIGURE 13. Plots of polarization luminescence intensity ratios normalized by the luminescence intensity of HH as a function of the Rburst. The Nburst values are (A) 10, (B) 50, (C) 100, and (D) 200 pulses, respectively. Backscattered electron images of the nanograting induced by the burst pulse train with Nburst of (E) 50 and (F) 200 pulses also shown.
4 Conclusion
In conclusion, polarization-dependent nanograting consisting of the glass-crystal phase separation can successfully self-organized in Al2O3-Lu2O3 glass. The Lu3Al5O12 polycrystals were periodically precipitated in the focus region and the periodicity can be tuned by the pulse repetition rate. The anisotropy in luminescence originated from the formation of nanograting is also observed. Considering the contribution of the surface plasmon resonance to the LIPPS formation (Huang et al., 2022), large-area processing by wire-by-wire writing could also possibly apply to the present study. The comparison between the results from pulse burst experiments and the thermal annealing clearly indicates that such anisotropy is caused by polarization-dependent structural modification. Such optical anisotropy will open the door for novel optical devices.
Data availability statement
The original contributions presented in the study are included in the article/Supplementary Material, further inquiries can be directed to the corresponding author.
Author contributions
All authors listed have made a substantial, direct, and intellectual contribution to the work and approved it for publication.
Funding
This work was partially supported by JSPS KAKENHI Grant No. 20H02656.
Conflict of interest
The authors declare that the research was conducted in the absence of any commercial or financial relationships that could be construed as a potential conflict of interest.
Publisher’s note
All claims expressed in this article are solely those of the authors and do not necessarily represent those of their affiliated organizations, or those of the publisher, the editors and the reviewers. Any product that may be evaluated in this article, or claim that may be made by its manufacturer, is not guaranteed or endorsed by the publisher.
This manuscript was transferred from Walter De Gruyter GmbH to Frontiers Media SA. The peer review for this paper was conducted in full by Walter De Gruyter GmbH. In accordance with their peer review, editor names and reviewer names have not been published. For any queries regarding the peer review of this manuscript, please contact YWR2YW5jZWRvcHRpY3MuZWRpdG9yaWFsLm9mZmljZUBmcm9udGllcnNpbi5vcmc=.
Supplementary material
The Supplementary Material for this article can be found online at: https://www.frontiersin.org/articles/10.3389/aot.2023.1237663/full#supplementary-material
References
Asai, T., Shimotsuma, Y., Kurita, T., Murata, A., Kubota, S., Sakakura, M., et al. (2015). Systematic control of structural changes in GeO2 glass induced by femtosecond laser direct writing. J. Am. Ceram. Soc. 98, 1471–1477. doi:10.1111/jace.13482
Blazek, K., Krasnikov, A., Nejezchleb, K., Nikl, M., Savikhina, T., and Zazubovich, S. (2004). Luminescence and defects creation in Ce3+-doped Lu3Al5O12 crystals. Phys. status solidi (b) 241, 1134–1140. doi:10.1002/pssb.200301986
Bricchi, E., Klappauf, B. G., and Kazansky, P. G. (2004). Form birefringence and negative index change created by femtosecond direct writing in transparent materials. Opt. Lett. 29, 119–121. doi:10.1364/ol.29.000119
Cao, J., Poumellec, B., Mazerolles, L., Brisset, F., Helbert, A.-L., Surble, S., et al. (2017). Nanoscale phase separation in lithium niobium silicate glass by femtosecond laser irradiation. J. Am. Ceram. Soc. 100, 115–124. doi:10.1111/jace.14570
Davis, K. M., Miura, K., Sugimoto, N., and Hirao, K. (1996). Writing waveguides in glass with a femtosecond laser. Opt. Lett. 21, 1729–1731. doi:10.1364/ol.21.001729
Glezer, E. N., Milosavljevic, M., Huang, L., Finlay, R. J., Her, T.-H., Callan, J. P., et al. (1996). Three-dimensional optical storage inside transparent materials. Opt. Lett. 21, 2023–2025. doi:10.1364/ol.21.002023
He, X., Fan, C., Poumellec, B., Liu, Q., Zeng, H., Brisset, F., et al. (2014). Size-controlled oriented crystallization in SiO_2-based glasses by femtosecond laser irradiation. J. Opt. Soc. Am. B 31, 376–381. doi:10.1364/josab.31.000376
Huang, J., Xu, K., Xu, S., Li, X., and Wei, Q. (2022). Self-aligned laser-induced periodic surface structures for large-area controllable nanopatterning. Laser and Photonics Rev. 16, 2200093. doi:10.1002/lpor.202200093
Kerse, C., Kalaycıoğlu, H., Elahi, P., Çetin, B., Kesim, D. K., Akçaalan, Ö., et al. (2016). Ablation-cooled material removal with ultrafast bursts of pulses. Nature 537, 84–88. doi:10.1038/nature18619
Laguta, V., Buryi, M., Pejchal, J., Babin, V., and Nikl, M. (2018). Hole self-trapping in Y3Al5O12 and Lu3Al5O12 garnet crystals. Phys. Rev. Appl. 10, 034058. doi:10.1103/PhysRevApplied.10.034058
Lancry, M., Groothoff, N., Poumellec, B., Guizard, S., Fedorov, N., and Canning, J. (2011). Time-resolved plasma measurements in Ge-doped silica exposed to infrared femtosecond laser. Phys. Rev. B 84, 245103. doi:10.1103/physrevb.84.245103
Lin, Y. C., Erhart, P., and Karlsson, M. (2019). Vibrationally induced color shift tuning of photoluminescence in Ce3+-doped garnet phosphors. J. Mater. Chem. C 7, 12926–12934. doi:10.1039/c9tc01244c
Miura, K., Qiu, J., Mitsuyu, T., and Hirao, K. (2000). Space-selective growth of frequency-conversion crystals in glasses with ultrashort infrared laser pulses. Opt. Lett. 25, 408–410. doi:10.1364/ol.25.000408
Mori, M., Shimotsuma, Y., Sei, T., Sakakura, M., Miura, K., and Udono, H. (2015). Tailoring thermoelectric properties of nanostructured crystal silicon fabricated by infrared femtosecond laser direct writing: Tailoring thermoelectric properties of nanostructured crystal silicon. Phys. Status Solidi A 212, 715–721. doi:10.1002/pssa.201431777
Mori, S., Kurita, T., Shimotsuma, Y., Sakakura, M., and Miura, K. (2016). Resilience in the studies of biodiversity-ecosystem functioning. Trends Ecol. Evol. 31, 87–89. doi:10.1016/j.tree.2015.12.010
Nikl, M., Mihokova, E., Pejchal, J., Vedda, A., Zorenko, Yu., and Nejezchleb, K. (2005). The antisite LuAl defect-related trap in Lu3Al5O12:Ce single crystal. Phys. status solidi (b) 242, R119–R121. doi:10.1002/pssb.200541225
Ogawa, K., Honma, T., and Komatsu, T. (2013). Birefringence imaging and orientation of laser patterned β-BaB2O4 crystals with bending and curved shapes in glass. J. Solid State Chem. 207, 6–12. doi:10.1016/j.jssc.2013.08.021
Shimizu, M., Sakakura, M., Ohnishi, M., Shimotsuma, Y., Nakaya, T., Miura, K., et al. (2010). Mechanism of heat-modification inside a glass after irradiation with high-repetition rate femtosecond laser pulses. J. Appl. Phys. 108, 073533. doi:10.1063/1.3483238
Shimotsuma, Y., Kazansky, P. G., Qiu, J., and Hirao, K. (2003). Self-organized nanogratings in glass irradiated by ultrashort light pulses. Phys. Rev. Lett. 91, 247405. doi:10.1103/physrevlett.91.247405
Shimotsuma, Y., Sakakura, M., Kazansky, P. G., Beresna, M., Qiu, J., Miura, K., et al. (2010). Ultrafast manipulation of self-assembled form birefringence in glass. Adv. Mater. 22, 4039–4043. doi:10.1002/adma.201000921
Shimotsuma, Y., Sei, T., Mori, M., Sakakura, M., and Miura, K. (2016). Self-organization of polarization-dependent periodic nanostructures embedded in III–V semiconductor materials. Appl. Phys. A 122, 159. doi:10.1007/s00339-016-9686-6
Shimotsuma, Y., Tomura, K., Okuno, T., Shimizu, M., and Miura, K. (2020). Femtosecond laser-induced self-assembly of Ce3+-doped YAG nanocrystals. Crystals 10, 1142. doi:10.3390/cryst10121142
Stone, A., Jain, H., Dierolf, V., Sakakura, M., Shimotsuma, Y., Miura, K., et al. (2015). Direct laser-writing of ferroelectric single-crystal waveguide architectures in glass for 3D integrated optics. Sci. Rep. 5, 10391. doi:10.1038/srep10391
Stone, A., Sakakura, M., Shimotsuma, Y., Miura, K., Hirao, K., Dierolf, V., et al. (2018). Femtosecond laser-writing of 3D crystal architecture in glass: Growth dynamics and morphological control. Mater. Des. 146, 228–238. doi:10.1016/j.matdes.2018.03.016
Watanabe, Y., Masuno, A., and Inoue, H. (2012). Glass formation of rare Earth aluminates by containerless processing. J. Non-Crystalline Solids 358, 3563–3566. doi:10.1016/j.jnoncrysol.2012.02.001
Zhang, B., Tan, D., Liu, X., Tong, L., Kazansky, P. G., and Qiu, J. (2019). Self-organized periodic crystallization in unconventional glass created by an ultrafast laser for optical attenuation in the broadband near-infrared region. Adv. Opt. Mater. 7, 1900593. doi:10.1002/adom.201900593
Keywords: Al2O3-Lu2O3 glass, nanograting, femtosecond laser, crystallization, Lu3Al5O12
Citation: Okuno T, Shimotsuma Y, Shimizu M and Miura K (2023) Photoinduced self-assembly of nanocrystals inside Al2O3-Lu2O3 glass. Adv. Opt. Technol. 12:1237663. doi: 10.3389/aot.2023.1237663
Received: 09 June 2023; Accepted: 13 June 2023;
Published: 25 July 2023.
Copyright © 2023 Okuno, Shimotsuma, Shimizu and Miura. This is an open-access article distributed under the terms of the Creative Commons Attribution License (CC BY). The use, distribution or reproduction in other forums is permitted, provided the original author(s) and the copyright owner(s) are credited and that the original publication in this journal is cited, in accordance with accepted academic practice. No use, distribution or reproduction is permitted which does not comply with these terms.
*Correspondence: Yasuhiko Shimotsuma, c2hpbW90c3VtYS55YXN1aGlrb0BnbWFpbC5jb20=
 Tatsuya Okuno
 Yasuhiko Shimotsuma