 Jennifer Repac
 Leilani X. Alvarez
 Ken Lamb
 Robert L. Gillette
- 1The Animal Medical Center, Integrative and Rehabilitative Medicine Department, New York, NY, United States
- 2Lamb Statistical Consulting and Scientific Writing LLC, West Saint Paul, MN, United States
- 3Sportsvet Veterinary Consulting Services, Lancaster, SC, United States
Objective: To evaluate changes in superficial temperature of hindlimb muscles before and after a 6-min walk in healthy dogs.
Methods: Two infrared thermographic images were captured of the proximal and distal hindlimbs of 11 healthy dogs before and after a 6-min walk. Orthopedic exam and objective gait analysis confirmed the healthy status of study subjects. Superficial temperatures of the gastrocnemius, biceps femoris, and gracilis were assessed. Analysis of images was performed using 2 different methods of region of interest (ROI) selection. ROI were selected first using one point (single pixel) in the muscle and then separately by selecting a line (LN) corresponding to many points of each muscle belly from which an average was taken. P < 0.05 was considered significant.
Results: There was no significant change in temperature using point ROI before and after 6 min of walking of the gastrocnemius, gracilis, and biceps femoris muscles (p = 0.273, p = 0.349, p = 0.351, respectively). Using linear ROI, both biceps femoris and gracilis muscles exhibited significant increases in temperature (p < 0.0001, p = 0.032, respectively). There was no significant increase in temperature of gastrocnemius muscle for both point and linear ROI selection (p = 0.273, p = 0.448, respectively). The right biceps femoris temperatures were higher compared to left biceps femoris using the linear ROI before and after walks (p < 0.0001). The overall (left and right limbs pooled) standard deviation of point selected values were greater than LN selected values of the biceps femoris (1.35 and 1.11) and gastrocnemius (1.51 and 1.23). In contrast, standard deviation for the gracilis measurements were decreased using point selection vs. LN selection (1.09 and 1.3).
Conclusions: The biceps femoris and gracilis muscles demonstrated significant increases in surface temperature after 6 min of walking using the linear method of ROI. Measurement of numerous points along the entire length of the biceps femoris and gastrocnemius muscles may provide a more accurate assessment of the increased vascularity within the tissues resulting from work compared to single point selection.
Clinical Significance: Prior activity and ROI selection method should be considered when interpreting thermography results.
Introduction
Thermography is a non-invasive tool that can be used to screen for early stages of disease, support physical exam findings, or monitor response to therapy by measuring radiant heat emitted from the skin's surface (1). Thermographic imaging has been utilized in human and equine medicine since the 1960s (2). Current applications in human medicine include breast cancer screening, assessment of osteoarthritis (3, 4), monitoring of healing after burns (5), and muscle injury (6, 7). In equine patients, thermography has been used in early detection of laminitis, tendon and ligament injuries, and thoracolumbar pain (8). In cats, thermography has been used in detection of pain (9), aortic thromboembolism (10), and hyperthyroidism (11).
There are several studies on the use of thermal imaging in canines. The ability to obtain consistent thermographic images in healthy dogs has been demonstrated (12, 13). Thermal imaging has been shown to be useful in detection of several pathological conditions in dogs including osteosarcoma (14), elbow dysplasia (15), cranial cruciate ligament rupture (16, 17), and intervertebral disc disease (18). Thermography has also been shown to have applications for canine gait analysis (19, 20).
There have been several previous studies investigating the effect of exercise on thermal images in dogs (21–23). One study, in post-racing Greyhounds, showed that the gastrocnemius muscle had a statistically significant increase in superficial temperature compared to baseline (23). Another study in military dogs trotting and running for 12 min, resulted in an increase in temperature of the biceps femoris muscle (21).
Previous studies have shown that the muscles of the hindlimb contribute to the propulsive forces during all gaits (24). One study suggested that relative dominance of the gastrocnemius muscle may play a role in cranial cruciate ligament disease and that monitoring of the gastrocnemius could play a role in injury prevention and rehabilitation (25).
It has previously been shown that the 6-min walk test [6MWT; (26)] can effectively differentiate healthy dogs from dogs with congestive heart failure (27), pulmonary disease (28), and neuromuscular disease (29, 30). The 6MWT has also been utilized as a tool for monitoring changes in cardiopulmonary function over time (31, 32). The ability of the 6MWT to differentiate individuals with mild cardiopulmonary disease suggests an increase in oxygen demand and work from the muscles required for locomotion. However, the thermographic effects of the 6MWT on hindlimb musculature have not been evaluated.
Despite the growing number of studies in thermography, there are no thermographic studies to date that evaluate the effect of walking on temperature of muscles in dogs. This may have more clinical applications for companion animals compared to previous thermographic studies that focused on sporting and working dogs.
We propose to use thermography to measure changes in temperature of canine hindlimb muscles (gastrocnemius, gracilis, and biceps femoris muscles) after 6 min of leash walking. To the author's knowledge, the effects of walking on the temperature of canine hindlimb musculature have not been previously reported. A pilot study documenting changes in superficial muscle temperatures after light exercise could lead to further studies detecting early signs of muscle strain in dogs as demonstrated in human athletes (7).
The objective of the current study was to evaluate changes in temperature of hindlimb muscles before and after 6 min of leash walking in healthy dogs. Our hypothesis was that 6 min of walking will result in significant increases in temperature of hindlimb muscles during walking compared to baseline.
Materials and Methods
The Animals
This study was approved by the institutional animal care and use committee (IACUC) of the Animal Medical Center (AMC) of New York and the IACUC of the Animal Care and Control (ACC) of New York. Thirteen healthy Staffordshire terrier mixed breed dogs were prospectively evaluated for enrollment in this study. The study population included (10 dogs) recruited from the ACC and (1 dog) from owned pets at AMC. The owners of the dogs or the shelter coordinator (in the case of ACC dogs) were asked for consent prior to enrolment. All dogs underwent a physical exam and orthopedic exam (LXA, JR) and found to be clinically normal and had no history of orthopedic disease. Dogs with skin disease, shaving, or medium to long haired coats were excluded. Dogs with body condition scores <5 or >6 on a 9 point scale were also excluded (33). Dogs with any physical exam abnormalities (including any heart murmurs or arrhythmias) were excluded. Dogs were confined to a temperature-controlled environment (20°C) throughout the study. All physical exams were performed at least 30 min prior to thermal image capture to minimize the effect of handling on thermal patterns.
Thermographic Imaging
All thermographic images were taken with a thermal camera with the resolution of 640X5121. Two thermographic images were obtained 24 inches from the caudal aspect of hindlimbs of each patient (one proximal and one distal) at ~90° using a tablet-based infrared sensing camera as described in a previous study [(23); Figures 1–3]. Dogs were then walked for 6 min on a pressure sensing walkway at a comfortable walking speed (0.9–2.1 m/s) as previously described (27, 28). At each end of the pressure sensing walkway, the dogs were turned such that the number of left and right turns were equal in each dog. Less than 1 minute after completing the 6MWT, the same 2 hindlimb thermal images were repeated for each subject as described above. There was no handling of the regions of interest within 30 min of image capture.
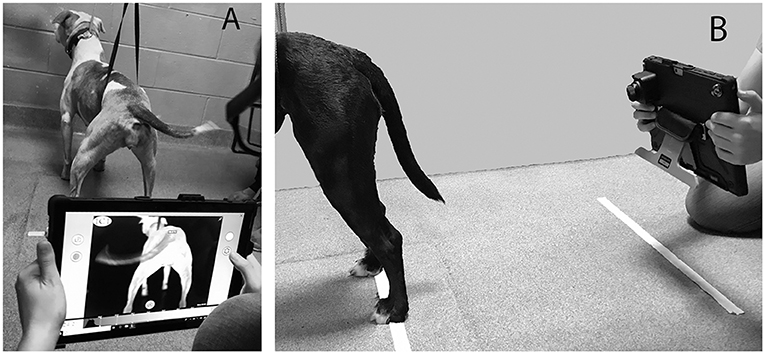
Figure 1. Demonstration of thermographic image capture method from caudal view (A) and lateral view (B).
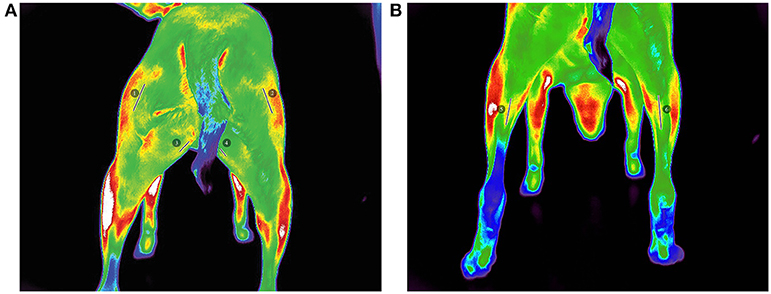
Figure 2. Pre-walk thermographic images demonstrating linear ROI selection of (A) (1) left biceps femoris, (2) right biceps femoris, (3) left gracilis, (4) right gracilis, (B) (5) left gastrocnemius, and (6) right gastrocnemius.
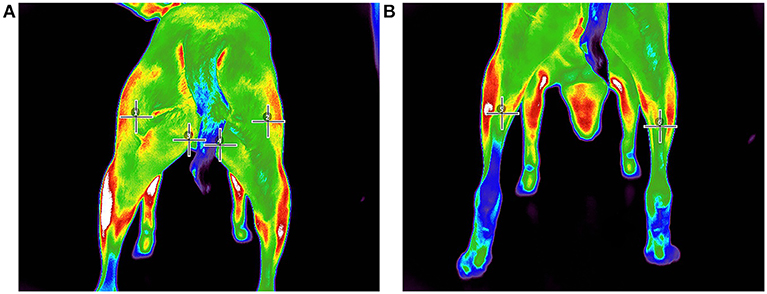
Figure 3. Pre-walk thermographic image demonstrating point ROI selection of (A) (1) left biceps femoris, (2) right biceps femoris, (3) left gracilis, (4) right gracilis, (B) (5) left gastrocnemius, and (6) right gastrocnemius.
Data Analysis
All images were analyzed with a thermal imaging software program2 using the medical color palette for viewing and analysis. All analyses were performed by the same investigator (JR). From the images, 3 superficial temperature points (PT) were selected: gastrocnemius, gracilis, and biceps femoris muscles as described in previous studies (21, 23). In an effort to reduce variability of region of interest (ROI) selection, a linear (LN) ROI on midline of the length of each muscle belly was selected for the gastrocnemius, gracilis, and biceps femoris muscles from which a mean temperature was calculated. The thermal differences were then extracted from the thermographic images by calculating the temperature of the hindlimb muscles before and after exercise.
Objective gait analysis was used to confirm a sound gait in the patient population. Objective gait analysis was collected in a quiet, temperature-controlled room using a temporospatial pressure sensing walkway3. The walkway system was equipped with a portable mat (4.3 × 2 m) containing 16,128 encapsulated sensors. The mat was calibrated by the manufacturer and raw data was captured by a computer equipped with software designed to analyze quadruped gait. Each dog was walked across the length of the gait analysis for the entire 6MWT duration. Walks were only included for data analysis if gait cycle velocities varied <10% and patient head carriage was forward facing. The first 3 successful walks per subject were pooled into analyzed data as performed in a previous study (34).
Statistical Analysis
Baseline descriptive statistics are presented as mean and standard deviation for normally distributed variables whereas non-normally distributed variables are presented as median and range. Between groups, analyses of baseline variables were performed using analysis of variance (ANOVA) or the Wilcoxon test as appropriate for the data distribution within patient variation was determined by a dependent repeated measures ANOVA. The normality of the error residuals was analyzed by Kolmogorov-Smirnoff analysis and deemed normal. Analysis for proportions of categorical variables was performed using Chi-Square analysis or Fisher's exact test where appropriate. All analyses were considered significant if p < 0.05 and were carried out using a commercially available statistical software (SAS 9.4, SAS Institute Inc., Cary, North Carolina 2019).
Results
Dogs Included
Eleven healthy Staffordshire terrier mixed breed dogs met inclusion criteria and were enrolled. There were 3 neutered males, 2 intact females, 5 spayed females, and 1 intact male with weights and ages ranging from 17.5 to 37.3 kg (mean 23.3 ± 5.6 kg) and 2 to 7 years (mean 4 ±1.9 years), respectively.
Objective Gait Analysis
Data obtained through pressure sensing walkway demonstrated an average forelimb total pressure index (TPI) of 29.1 ± 3.2 and hindlimbs TPI of 20.9 ± 3.2. TPI symmetry ratios (left hind:right hind) ranged from 0.87 to 1.13.
Thermography
Changes After Exercise
There were no significant differences in superficial temperatures of the gastrocnemius, gracilis muscles, and biceps femoris after 6MWT compared to baseline using the point selection method for ROI (Table 1). The linear (LN) ROI selection of the biceps femoris demonstrated significantly increased temperature exercise for both the left and the right sides (p = 0.003 and p < 0.0001, respectively). There was also a significant increase in temperature of the LN gracilis muscle when left and right sides were averaged together (p = 0.032). While mean LN gracilis temperatures were both increased when left and right sides were evaluated independently, this difference was not significant (p = 0.083, p = 0.174, respectively).
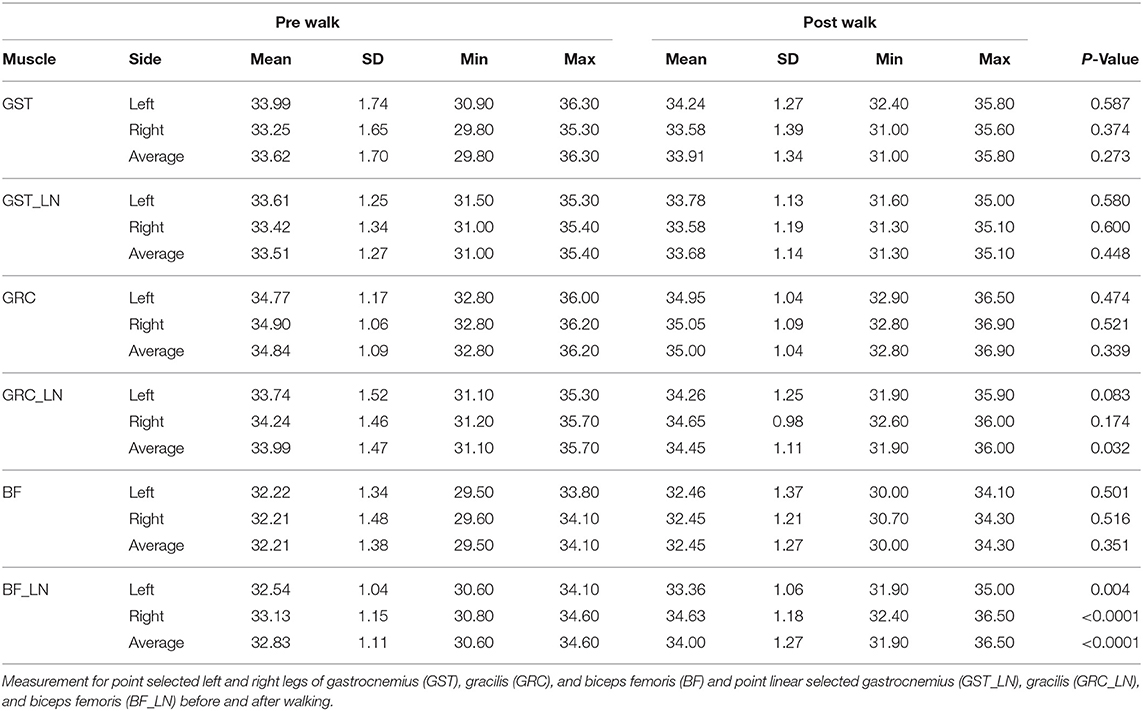
Table 1. Overall ± SD as well as minimum (min) and maximum (max) superficial temperatures obtained from thermographic images.
Effect of Region of Interest on Standard Deviation
The overall (left and right limbs pooled) standard deviation of point selected values were greater than LN selected values of the biceps femoris (1.35 and 1.11) and gastrocnemius (1.51 and 1.23). In contrast, standard deviation for the gracilis measurements were decreased using point selection vs. LN selection (1.09 and 1.3).
Differences Between Sides
The difference between left and right LN biceps femoris was statistically significant pre-exercise (32.5 and 33.1°C, respectively, p = 0.03) and post exercise (33.4 and 34.6°C, respectively, p < 0.0001). There was no significant difference between sides for both gracilis and gastrocnemius muscles using either ROI method, at any point in time.
Discussion
Thermography
After a 6MWT, there was no significant difference between mean pre and post superficial temperatures of biceps femoris, gastrocnemius, and gracilis when using the point ROI method employed by previous studies (21, 23). However, when the linear ROI method was used, there was a statistically significant temperature increase in biceps femoris and gracilis muscles post exercise. Thus, we accepted our hypothesis that the temperature increase was significant in the biceps femoris and gracilis muscles pre and post 6MWT, but was rejected for the gastrocnemius muscle. This temperature increase could correspond to the increased work during walking exerted by the biceps femoris and gracilis muscles.
The accuracy of visual selection of muscles based on thermal imaging has not been assessed. ROI interest selection has been variable among thermography studies in canines. Visual point-based selection as used previously in evaluation of hindlimb musculature (21, 23) is subjective when muscle groups have not been clearly demarcated. In an effort to reduce variability in point selection, we employed a linear method of ROI selection as described in a previous study on humans with knee osteoarthritis (35). The overall decreased variability and significant increase in temperatures using this LN method may reflect that this is a more reliable form of ROI selection. In a previous study comparing dogs with normal and dysplastic elbows by McGowan et al. (15) pattern analysis classified abnormal joints 100% of the time whereas the temperature differences in the ROI were small. This suggests pattern analysis rather than regional temperature differences may produce more consistent results. Further study on ROI selection and pattern analysis is necessary to determine which screening method yields the most accurate results.
An alternative method of isolating a ROI would be through selection of a muscle group using a free hand manual outlining of the muscle belly or placement of visual markers on patients based on anatomical landmarks. Even with such methods, however, muscle isolation is not 100% reliable due to summation effect with the overlying tensor fascia latae and potential increase in surface temperatures. Therefore, such methods may be unreliable and impractical in a clinical setting.
A previous study demonstrated increases in temperature of the biceps femoris only in military working dogs <7 months old exercised on a treadmill for 12 min (21). In another study (23), the gastrocnemius muscle temperature was most elevated in greyhounds after intense racing activity. In both studies, the animals were preconditioned and undergoing regular training. The subjects used in the current study were kenneled with scheduled twice daily leashed walks and otherwise not part of any athletic training program. It is unknown how these conditioning differences would affect the results of this study; however, a study in humans comparing temperatures in trained vs. untrained exercising humans demonstrated greater temperature increases in trained individuals after exercise (36). In contrast, in this study there was a decrease in the maximum values of the gastrocnemius after exercise (with exception of the right side with point selection). This may reflect a temporary post exercise decrease in surface temperature as described in humans (37). However, a component of that temperature decrease may be due to evaporative cooling that is not present in dogs.
Interestingly, previous studies with conditioned dogs (21, 23) did not report significant change in temperature of the gracilis muscles after exercise as found in the current study using the linear ROI selection method. This difference could demonstrate increased sensitivity of using a linear ROI for assessment of the gracilis muscle. This has clinically relevant applications in both sporting and working dogs. Greyhounds are reported to be susceptible to gracilis muscle tears and German shepherds are commonly afflicted with gracilis fibrotic myopathy (38). Perhaps this method of ROI selection could be used for early detection of pathology and subsequent injury prevention.
Clinically, it is useful to establish expected changes in hindlimb temperature occurring after various levels of activity. Six minutes of walking is considered relatively light aerobic exercise and may reasonably occur prior to examination in a clinic or as part of a warm up in competition. This data represents expected temperature variation that could occur under those circumstances. A human study (39) reported light aerobic exercise leads to decreases in temperature whereas intense anaerobic exercise increases temperature until failure in the biceps brachii. There were several dogs in the present study with decreased muscle temperatures post walk and this perhaps may be a reflection of this phenomenon. Further study focused on exercise transitions from aerobic to anaerobic exercise is needed to determine if these temperature changes exist in dogs.
The increased temperature observed in the biceps femoris compared to other hindlimb musculature in the present study may be explained by its unique function during the gait cycle. The biceps femoris is composed of cranial and caudal parts that are both responsible for protraction of the hindlimb and flexion of the stifle, respectively. A previous study observed biceps femoris muscle activity using electromyography (EMG) in both swing and stance phase in dogs trotted on a treadmill (40). In another study, EMG in dogs showed muscular activity in the biceps femoris that was consistent with elastic storage of kinetic energy end of swing phase and recovery during propulsive stroke in the tibial portion of active muscle (41). Activity of the gastrocnemius muscle during stretch and shortening was only observed at faster trotting speeds and a gallop. This may explain the lack of temperature changes observed in gastrocnemius in the current study and supports the results from a previous study that showed increased temperatures in the gastrocnemius in post-racing greyhounds (23).
One of the challenges of utilizing thermography in practice is determining the clinical significance of results. Thermography studies in humans have established elevations in temperatures of muscles caused by local inflammation and vasodilation. Increases in temperature have correlated with increases in muscle volume of the biceps femoris in one study (37). Other studies have indicated a correlation of surface temperature with delayed onset of muscle soreness (7). Previous reports in horses and humans have determined that asymmetry of >1°C is indicative of underlying pathology (42). A more recent study in humans (43), found variations of 0.5 ± 0.3°C in healthy subjects. However, these studies used data from broader, box-shaped ROIs. In a previous study (23), racing greyhounds had differences between right and left limbs ranging from 0 to 4°C that were not clinically nor statistically significant. The present study showed statistically significant temperature asymmetries up to 3°C in the same muscle groups on opposite sides in healthy subjects. This is in contrast to the study by Loughin and Marino (12) that found no significant difference between sides in dogs. However, the Loughin study used a broader method (box-shaped) for ROI selection and thus cannot be directly compared. It is also important to note the sensitivity of the infrared camera used in this study is higher compared to previous studies (0.02°C compared to 0.05°C) which would be expected to decrease variability. These differences may represent normal variation in dogs or potentially secondary to cooling of superficial skin temperatures on the dependent side on which the animal was laying prior to image capture.
Objective Gait Analysis
The results of objective gait analysis showed hindlimb TPI symmetry ratios (left hind:right hind) ranging from 0.87 to 1.13. This was consistent with the results of previous studies in a population of normal dogs (34) which reported hindlimb symmetry ratio of 1 ± 0.12.
Limitations
Limitations of this study include the small sample size and homogenous population of dogs. Selection of dogs with different coat lengths and body structure may have yielded different results. However, this Staffordshire terrier mixes were chosen in this study for the short coat characteristic of the breed thereby decreasing temperature variance noted in previous studies secondary to coat length (13, 44). In addition, coat color was not consistent; however, this has not shown to affect thermal images (45).
Selection of ROI requires manual demarcation which is likely subject to individual variation. While every attempt was made to standardize the acquisition of thermography images, the analysis may have limited accuracy from changes in posture, camera angle, intra-observer variability, and inter-observer variability. Indeed, it is possible that our findings were not due to increases in temperature, but rather these aforementioned methodologic issues. Future studies assessing the accuracy and precision of thermography are required to validate our findings. ROI in this study were selected by a single observer and therefore intraobserver and interobserver variation were not assessed. Box region of interest (ROI) selection as used in other studies is less practical in the context of this study due to the natural shape of hindlimb musculature in the images captured. A line ROI selection method was chosen in this study as it more closely follows the shape of the studied hindlimb musculature. Additionally, the observer in this study was not blinded to the status of the animal in the image observed potentially leading to biased point selection. Further studies are required to evaluate the impact of interobserver variability.
While most dogs maintained a comfortable walking gait during the 6MWT, some of the dogs occasionally converted into a trot as a preferred gait. It is unknown how much this change in gait influenced the results obtained.
This study evaluated post exercise temperatures at a single time point (<1 min after 6MWT) and it is possible that this initial increase in temperature may be subsequently followed by a peak in temperature as in human studies (37). The focus of this study was to evaluate muscle temperatures immediately post light aerobic exercise as compared to increases after high intensity exercise in other studies (21, 23) and additional studies are required to determine when peak temperatures occur.
Conclusion
The biceps femoris and gracilis muscles showed statistically significant increases in superficial temperatures after 6 min of walking when using linear region of interest selection method. There were no significant changes in temperature of gastrocnemius muscles using both linear and point ROI methods. Differences in right and left muscle temperatures may be found in healthy individuals. Measurement of numerous points along the entire length of the biceps femoris and gastrocnemius muscles may provide a more accurate assessment of the increased vascularity within the tissues resulting from work compared to single point selection. Region of interest selection method should be considered when interpreting thermography results.
Data Availability Statement
All datasets generated for this study are included in the article/supplementary material.
Ethics Statement
The animal study was reviewed and approved by Institutional animal care and use committee (IACUC) of the Animal Medical Center (AMC) of New York and the IACUC of the Animal Care and Control (ACC) of New York. Written informed consent was obtained from the owners for the participation of their animals in this study.
Author Contributions
LA and JR developed conception of the study and study protocols and participated in data collection. JR was responsible for analysis of the data. The manuscript was written by JR and LA and was reviewed and edited by all authors. Statistical analysis was performed by KL. RG provided expert advice in data interpretation and analysis.
Conflict of Interest
KL was employed by Lamb Statistical Consulting and Scientific Writing LLC. RG was employed by Sportsvet Veterinary Consulting Services.
The remaining authors declare that the research was conducted in the absence of any commercial or financial relationships that could be construed as a potential conflict of interest.
Acknowledgments
The authors would like to thank all of the participating dogs and staff at the Animal Care Centers of New York City and the Animal Medical Center. Special thanks to Natalie Zatz for her assistance in data collection and data entry.
Abbreviations
BF, Biceps femoris muscle; GRC, Gracilis muscle; GST, Gastrocnemius muscle; LN, Measurements using linear region of interest selection method; PT, Measurements using point region of interest selection method; ROI, Region of interest; 6MWT, 6 min walk test; TPI, Total pressure index.
Footnotes
1. ^Digitherm IR Tablet 640 Thermal Imaging DTI System 640X512 Sensor: 327,680 (pixels) points of temperature measurement, ±1°C Accuracy, <0.02°C Sensitivity Calibration, Ocala, FL.
2. ^IR Flash Pro.
3. ^Gait4Dog Walkway, Sparta, NJ.
References
1. Turner TA, Waldsmith J, Marcella K, Henneman K, Purohit RC, Morino D. Veterinary Guidelines for Infrared Thermography. The American Academy of Thermology (2019).
3. Varju G, Pieper CF, Renner JB, Kraus VB. Assessment of hand osteoarthritis: correlation between thermographic and radiographic methods. Rheumatology. (2004) 43:915–9. doi: 10.1093/rheumatology/keh204
4. Spalding SJ, Kwoh CK, Boudreau R, Enama J, Lunich J, Huber D. Three-dimensional and thermal surface imaging produces reliable measures of joint shape and temperature: a potential tool for quantifying arthritis. Arthrit Res Therap. (2008) 10:R10. doi: 10.1186/ar2360
5. Liddington MI, Shakespeare PG. Timing of the thermographic assessment of burns. Burns. (1996) 22:26–8. doi: 10.1016/0305-4179(95)00076-3
6. Bandeira F, Moura MA, Souza MA, Nohama P, Neves EB. Can thermography aid in the diagnosis of muscle injuries in soccer athletes? Rev Brasil Med Do Esporte. (2012) 18:246–51. doi: 10.1590/S1517-86922012000400006
7. Al-Nakhli HH, Petrofsky JS, Laymon MS, Berk LS. The use of thermal infra-red imaging to detect delayed onset muscle soreness. J Vis Exp. (2012) 59:3551. doi: 10.3791/3551
8. Eddy AL, Van Hoogmoed LM, Snyder JR. The role of thermography in the management of equine lameness. Vet J. (2001) 162:172–81. doi: 10.1053/tvjl.2001.0618
9. Vainionpää MH, Raekallio MR, Junnila JJ, Hielm-Björkman AK, Snellman MP, Vainio OM. A comparison of thermographic imaging, physical examination and modified questionnaire as an instrument to assess painful conditions in cats. J Feline Med Surg. (2013) 15:124–31. doi: 10.1177/1098612X12463926
10. Pouzot-Nevoret C, Barthélemy A, Goy-Thollot I, Boselli E, Cambournac M, Guillaumin J. Infrared thermography: a rapid and accurate technique to detect feline aortic thromboembolism. J Feline Med Surg. (2018) 20:780–5. doi: 10.1177/1098612X17732485
11. Waddell RE, Marino DJ, Loughin CA, Tumulty JW, Dewey CW, Sackman J. Medical infrared thermal imaging of cats with hyperthyroidism. Am J Vet Res. (2015) 76:53–9. doi: 10.2460/ajvr.76.1.53
12. Loughin CA, Marino DJ. Evaluation of thermographic imaging of the limbs of healthy dogs. Am J Vet Res. (2007) 68:1064–9. doi: 10.2460/ajvr.68.10.1064
13. Vainionpää M, Raekallio M, Tuhkalainen E, Hänninen H, Alhopuro N, Savolainen M. Comparison of three thermal cameras with canine hip area thermographic images. J Vet Med Sci. (2012) 74:1539–44. doi: 10.1292/jvms.12-0180
14. Subedi S, Umbaugh SE, Fu J, Marino DJ, Loughin CA, Sackman J. Thermographic image analysis as a pre-screening tool for the detection of canine bone cancer. Appl Digit Image Process. (2014) 2014:9217. doi: 10.1117/12.2061233
15. McGowan L, Loughin CA, Marino DJ, Umbaugh SE, Liu P, Amini M. Medical infrared imaging of normal and dysplastic elbows in dogs. Vet Surg. (2015) 44:874–82. doi: 10.1111/vsu.12372
16. Infernuso T, Loughin CA, Marino DJ, Umbaugh SE, Solt PS. Thermal imaging of normal and cranial cruciate ligament-deficient stifles in dogs. Vet Surg. (2010) 39:410–7. doi: 10.1111/j.1532-950X.2010.00677.x
17. Lama N, Umbaugh SE, Mishra D, Dahal R, Marino DJ, Sackman J. Thermography based diagnosis of ruptured anterior cruciate ligament (ACL) in canines. Appl Digit Image Process. (2016) 2016:9971. doi: 10.1117/12.2237462
18. Grossbard BP, Loughin CA, Marino DJ, Marino LJ, Sackman J, Umbaugh SE. Medical infrared imaging (thermography) of type I thoracolumbar disk disease in chondrodystrophic dogs. Vet Surg/. (2014) 43:869–76. doi: 10.1111/j.1532-950X.2014.12239.x
19. Garcia EF, Loughin CA, Marino DJ, Sackman J, Umbaugh SE, Fu J. Medical infrared imaging and orthostatic analysis to determine lameness in the pelvic limbs of dogs. Open Vet J. (2017) 7:342–8. doi: 10.4314/ovj.v7i4.10
20. Igna C, Mavromatis S, Sicoe B, Schuszler L. Assessment of the thermal paw print symmetry of the hind legs in healthy dogs. In: Agriculture for Life, Life for Agriculture Conference Proceedings. 1 Sciendo (2018). doi: 10.2478/alife-2018-0068
21. Queiroz RW, Silva VL, Rocha DR, Costa DS, Turco SH, Silva MT. Changes in cardiovascular performance, biochemistry, gastric motility and muscle temperature induced by acute exercise on a treadmill in healthy military dogs. J Anim Physiol Anim Nutr. (2018) 102:122–30. doi: 10.1111/jpn.12667
22. Rizzo M, Arfuso F, Alberghina D, Giudice E, Gianesella M, Piccione G. Monitoring changes in body surface temperature associated with treadmill exercise in dogs by use of infrared methodology. J Thermal Biol. (2017) 69:64–8. doi: 10.1016/j.jtherbio.2017.06.007
23. Vainionpää M, Tienhaara EP, Raekallio M, Junnila J, Snellman M, Vainio O. Thermographic Imaging of the Superficial Temperature in Racing Greyhounds before and after the Race. Sci World J. (2012). doi: 10.1100/2012/182749
24. Deban SM, Schilling N, Carrier DR. Activity of extrinsic limb muscles in dogs at walk, trot and gallop. J Exp Biol. (2012) 215:287–300. doi: 10.1242/jeb.063230
25. Mostafa AA, Griffon DJ, Thomas MW, Constable PD. Morphometric characteristics of the pelvic limb musculature of Labrador Retrievers with and without cranial cruciate ligament deficiency. Vet Surg. (2010) 39:380–9. doi: 10.1111/j.1532-950X.2010.00657.x
26. Du Bois RM, Weycker D, Albera C, Bradford WZ, Costabel U, Kartashov A. Six-minute-walk test in idiopathic pulmonary fibrosis: test validation and minimal clinically important difference. (2011) 183:1231–7. doi: 10.1164/rccm.201007-1179OC
27. Swimmer RA, Rozanski EA. Evaluation of the 6-minute walk test in pet dogs. J Vet Int Med. (2011) 25:405–6. doi: 10.1111/j.1939-1676.2011.0689.x
28. Boddy KN, Roche BM, Schwartz DS, Nakayama T, Hamlin RL. Evaluation of the six-minute walk test in dogs. Am J Vet Res. (2004) 65:311–3. doi: 10.2460/ajvr.2004.65.311
29. Cerda-Gonzalez S, Talarico L, Todhunter R. Noninvasive assessment of neuromuscular disease in dogs: use of the 6-minute walk test to assess submaximal exercise tolerance in dogs with centronuclear myopathy. J Vet Int Med. (2016) 30:808–12. doi: 10.1111/jvim.13939
30. Acosta AR, Van Wie E, Stoughton WB, Bettis AK, Barnett HH, LaBrie NR. Use of the six-minute walk test to characterize golden retriever muscular dystrophy. Neuromuscular Disord. (2016) 26:865–72. doi: 10.1016/j.nmd.2016.09.024
31. Manens J, Ricci R, Damoiseaux C, Gault S, Contiero B, Diez M. Effect of body weight loss on cardiopulmonary function assessed by 6-minute walk test and arterial blood gas analysis in obese dogs. J Vet Int Med. (2014) 28:371–8. doi: 10.1111/jvim.12260
32. Lilja-Maula LI, Laurila HP, Syrjä P, Lappalainen AK, Krafft E, Clercx C. Long-term outcome and use of 6-minute walk test in West Highland White Terriers with idiopathic pulmonary fibrosis. J Vet Int Med. (2014) 28:379–85. doi: 10.1111/jvim.12281
33. Bjørnvad CR, Nielsen ME, Hansen SE, Nielsen DH. The effect of position on the precision of dual-energy X-ray absorptiometry and correlation with body condition score in dogs and cats. J Nutr Sci. (2017) 6:e20. doi: 10.1017/jns.2017.16
34. Light VA, Steiss JE, Montgomery RD, Rumph PF, Wright JC. Temporal-spatial gait analysis by use of a portable walkway system in healthy Labrador Retrievers at a walk. Am J Vet Res Act. (2010) 71:997–1002. doi: 10.2460/ajvr.71.9.997
35. Arfaoui A, Polidori G, Taiar R, Popa C. Infrared thermography in sports activity. In: Infrared Thermography. London, UK: IntechOpen. (2012). p. 141–68. doi: 10.5772/30268
36. Formenti D, Ludwig N, Gargano M, Gondola M, Dellerma N, Caumo A. Thermal imaging of exercise-associated skin temperature changes in trained and untrained female subjects. Ann Biomed Eng. (2013) 41:863–71. doi: 10.1007/s10439-012-0718-x
37. Neves EB, Vilaça-Alves J, Antunes N, Felisberto IM, Rosa C, Reis VM. Different responses of the skin temperature to physical exercise: systematic review. In: 2015 37th Annual International Conference of the IEEE Engineering in Medicine and Biology Society (EMBC). Milan: IEEE (2015). doi: 10.1109/EMBC.2015.7318608
38. Steiss JE. Muscle disorders and rehabilitation in canine athletes. Vet Clin. (2002) 32:267–85. doi: 10.1016/S0195-5616(03)00088-3
39. Neves EB, Vilaça-Alves J, Krueger E, Reis VM. Changes in skin temperature during muscular work: a pilot study. Pan Am J Med Thermol. (2014) 1:11–5. doi: 10.18073/2358-4696/pajmt.v1n1p11-15
40. Schilling N, Fischbein T, Yang EP, Carrier DR. Function of the extrinsic hindlimb muscles in trotting dogs. J Exp Biol. (2009) 212:1036–52. doi: 10.1242/jeb.020255
41. Goslow GE, Seeherman HJ, Taylor CR, McCutchin MN, Heglund NC. Electrical activity and relative length changes of dog limb muscles as a function of speed and gait. J Exp Biol. (1981) 94:15–42.
42. Turner TA. Diagnostic thermography. Vet Clin North Am. (2001) 17:95–114. doi: 10.1016/S0749-0739(17)30077-9
43. Vardasca R, Ring EF, Plassmann P, Jones CD. Thermal symmetry of the upper and lower extremities in healthy subjects. Thermol Int. (2012) 22:53–60.
44. Kwon CJ, Brundage CM. Quantifying body surface temperature differences in canine coat types using infrared thermography. J Thermal Biol. (2019) 82:18–22. doi: 10.1016/j.jtherbio.2019.03.004
Keywords: thermography, canine, infrared thermography, exercise, 6 min walk test, muscle
Citation: Repac J, Alvarez LX, Lamb K and Gillette RL (2020) Evaluation of Thermographic Imaging in Canine Hindlimb Muscles After 6 Min of Walking—A Pilot Study. Front. Vet. Sci. 7:224. doi: 10.3389/fvets.2020.00224
Received: 22 November 2019; Accepted: 02 April 2020;
Published: 30 April 2020.
Edited by:
Bruno Cozzi, University of Padova, ItalyReviewed by:
Zhi Zeng, Chongqing Normal University, ChinaStanley Kim, University of Florida, United States
Copyright © 2020 Repac, Alvarez, Lamb and Gillette. This is an open-access article distributed under the terms of the Creative Commons Attribution License (CC BY). The use, distribution or reproduction in other forums is permitted, provided the original author(s) and the copyright owner(s) are credited and that the original publication in this journal is cited, in accordance with accepted academic practice. No use, distribution or reproduction is permitted which does not comply with these terms.
*Correspondence: Leilani X. Alvarez, leilani.alvarez@amcny.org