 Matthew Springham
 Sean Williams
 Mark Waldron
 Darren Burgess6
- 1Faculty of Sport, Health and Applied Science, St Marys University, London, United Kingdom
- 2School of Medical and Health Sciences, Edith Cowan University, Joondalup, WA, Australia
- 3Department for Health, University of Bath, Bath, United Kingdom
- 4College of Engineering, Swansea University, Swansea, United Kingdom
- 5School of Science and Technology, University of New England, Armidale, NSW, Australia
- 6Sport Science Department, Melbourne Football Club, Melbourne, VIC, Australia
This investigation examined match play physical performance across a professional football season using a multicamera computerized tracking system. A linear mixed-effects model, controlling for situational and contextual variables, identified decreases in team average total distance (TD): season quarter 1 (Q1) (11,047 m) > season quarter 2 (Q2) (10,473 m) (P = 0.002; ES = Small), season quarter 3 (Q3) (10,449 m) (P < 0.001; ES = Moderate), and season quarter 4 (Q4) (10,385 m) (P < 0.001; ES = Moderate); work rate (WR): Q1 (115 m/min) > Q3 (108 m/min) (P < 0.001; ES = Moderate), Q4 (107 m/min) (P < 0.001; ES = Moderate); Q2 (109 m/min) > Q4 (107 m/min) (P = 0.003; ES = Small); high-speed running distance (HSR): Q1 (1,051 m) > Q2 (813 m) (P = 0.006; ES = Small); number of high-speed runs (NHSR): Q1 (87) > Q2 (65) (P < 0.001; ES = Small), Q3 (64) (P = 0.002; ES = Small); sprint distance (SD): Q1 (202 m) > Q4 (130 m) (P < 0.001; ES = Moderate), Q2 (179 m) > Q3 (165 m) (P = 0.035; ES = Small), Q4 (130 m) (P < 0.001; ES = Moderate) and number of sprints (NS): Q1 (20.4) > Q3 (10.2) (P < 0.001; ES = Moderate), Q4 (8.3) (P < 0.001; ES = Large); Q2 (14.9) > Q3 (10.2) (P < 0.001; ES = Moderate), Q4 (8.3) (P < 0.001; ES = Large). Within-position changes were observed for WR: Q1 (122 m/min) > Q4 (113 m/min) (P = 0.002; ES = Large) in central midfielders and for NS: Q1 > Q3 in wide defenders (21.7 vs. 10.8) (P = 0.044; ES = Large) and central midfielders (18.1 vs. 8.3) (P = 0.002; ES = Large); Q1 > Q4 in central defenders (13.1 vs. 5.3) (P = 0.014; ES = Large), wide defenders (21.6 vs. 7.1) (P < 0.001; ES = Very Large), central midfielders (18.1 vs. 8.5) (P = 0.005; ES = Large), and wide midfielders (20.8 vs. 12.2) (P = 0.012; ES = Large); Q2 > Q3 in central midfielders (16.9 vs. 8.3) (P = 0.002; ES = Large) and Q2 > Q4 in wide defenders (16.3 vs. 7.1) (P = 0.005; ES = Very Large), central midfielders (16.9 vs. 8.5) (P = 0.004; ES = Large), and wide midfielders (20.8 vs. 12.2) (P = 0.007; ES = Large). The match-play physical performance was reduced across the competitive season. The most notable reductions were observed in wide defenders, central midfielders, and wide midfielders in sprint performance indices.
Introduction
The English Football League Championship (EC) is the second tier of professional Football Association (football) in England and is characterized by substantial physical demands. For example, compared to the other major European Leagues (the English Premier League, Scottish Premiership, Scottish Championship, Spanish La Liga, German Bundesliga, Italian Serie-A, Dutch Eredivisie, and French Ligue 1) (UEFA, 2016), the EC teams play the most competitive games, number of two-game weeks, and have the greatest fixture density (Springham et al., 2019). Match load demands in the EC are also noteworthy. For example, match play total (TD), high-speed running (HSR), and sprinting (SD) distances are greater in the EC than in the English Premier League (EPL) (Bradley et al., 2013).
Scientific literature indicates that 24–96 h of recovery is necessary to reestablish baseline levels in markers of recovery post football match play (Ascensao et al., 2008; Ispirlidis et al., 2008; Nedelec et al., 2012; Thorpe and Sunderland, 2012; Russell et al., 2015, 2016; Thorpe et al., 2015). However, EC teams play an average of ~1.3 games per week across a ~40-week season, including ~16 two-game weeks, between which only ~72 h of recovery is available (Springham et al., 2019). Consequently, it is evident that regularly selected players in the EC might frequently be required to train and play in a fatigued state during periods of high fixture density (Meeusen et al., 2013; Schwellnus et al., 2016; Soligard et al., 2016).
Research to date indicates that periods of high game density (for example, playing > 1 game/week) (Gregson et al., 2010; Morgans et al., 2014b; Hattersley et al., 2018) and high acute workload (Owen et al., 2016; Rowell et al., 2018; Springham et al., 2020) can increase fatigue and compromise match play physical performance in football players. For example, Hattersley et al. (2018) reported a 22% reduction in match play HSR during the second half of the second game during two-game weeks. Moreover, Gregson et al. (2010) reported a greater variability in match play HSR distance during periods of increased game density, and more recently, Springham et al. (2020) reported that high acute (7-day average) HSR and high metabolic loads have moderate compromising effects on subsequent high-intensity match performance. However, there are only limited longitudinal analyses of cross-season match play physical performance in professional players.
Longitudinal data from the Italian Serie-A (Mohr et al., 2003; Rampinini et al., 2007) indicate increases in match play TD, HSR, and very high-intensity running distances at the end of the season, which were attributed to low end-of-season game densities. Conversely, recent data from the German Bundesliga indicate cross season reductions in TD but increases in HSR toward the end of the season (Chmura et al., 2019). However, the competitive demands (total number of games, game density, and number of two-game weeks) in the Italian Serie-A and German Bundesliga are very low relative to the EC (Springham et al., 2019), and thus, these findings might not be generalizable across leagues. Indeed, league-specific longitudinal match play physical performance data are warranted for the EC.
Only one study has investigated cross-season match play physical performance in an EC cohort (Morgans et al., 2014a). This investigation reported a peak in average TD halfway through the season, but no other longitudinal changes. However, this investigation used home fixture data only, which can exert a confounding effect on physical performance (Lago-Penas, 2012; Carling, 2013). To date, no longitudinal investigations have statistically controlled for situational or contextual variables (i.e., match location, match outcome, quality of opposition, fixture density, and match goal deficit) that can exert an effect on match play physical performance (Lago-Penas, 2012; Carling, 2013)—this, despite such recommendations in the scientific literature (Carling, 2013).
Training and match load are also known to vary between playing positions (Dellal et al., 2011; Bradley et al., 2013; Kelly et al., 2019). For example, wide defenders (WD), central midfielders (CM), and wide midfielders (WM) have substantially greater TD, HSR, and SD demands during EC match play than central defenders (CD) and forwards (F) (Bradley et al., 2013). Accordingly, since prior load is known to relate to match play physical performance in professional players (Springham et al., 2020), cross-season match play physical performance changes might also vary between positions. However, no empirical data are available to describe position-specific cross-season changes in match play physical performance. Accordingly, the aims of this investigation were to report team average and positional changes to match play physical performance across an EC season while statistically controlling for situational and contextual variables.
Materials and Methods
Study Design
Match play physical performance was recorded across a complete 51-game, 40-week competitive season in 18 senior professional male outfield players (age = 23.3 ± 7.4 years; height = 180.2 ± 6.0 cm, body mass = 73.3 ± 6.3 kg) from one EC team. Of these players, three were central defenders (CD), four were wide defenders (WD), four were central midfielders (CM), four were wide midfielders (WM), and three were forwards (F). The season was divided into equal (10-week) quarters (Q) to facilitate longitudinal analysis: Q1: games 1–13, Q2: games 14–27, Q3: games 28–39, and Q4: games 40–51.
All competitive home and away games were filmed by fixed high-resolution, wide-angled cameras (Panasonic HC-V 100, Osaka, Japan), and a semiautomated computerized tracking system (InStat Fitness System, Moscow, Russia) was used to measure match play physical performance indices. The reliability [coefficient of variation (%)] of this system for the measurement of distance and instantaneous speed during linear and multidirectional running activities across a range of running velocities at different pitch locations in stadia is <1% (Alexeev et al., 2014).
Only data from players who played whole games were included in the analysis. Consistent with previous research literature (Morgans et al., 2014a), team average performance was calculated as the mean performance of all outfield players, per game. Positional average performance was calculated as the mean performance of players, grouped by playing position, per game. Data were omitted from six games in which a player was sent off for the sample or opposing team, from three games owing to technical error, and from one game in which extra time was played. Therefore, in total, data from 41 competitive games: 37 league, 2 domestic cup, and 2 league play-off games, were included in the analysis, equating to 368 player-match observations. For context, Q1 included 10 league and 1 domestic cup games; Q2 included 11 league games; Q3 included 8 league and 1 domestic cup games, and Q4 included 8 league and 2 domestic league playoff games. The number of whole games played by the 18 outfield players across the sample period is presented in Table 1. An ethics declaration was approved for this investigation by the Edith Cowan University (AU), Office of Research and Innovation.
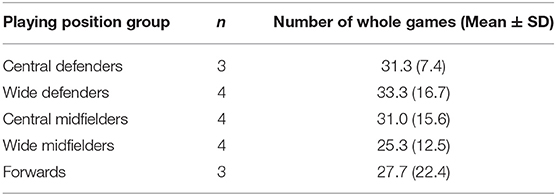
Table 1. Average number of whole games played by the 18 outfield players across the sample period, arranged by playing position group.
Physical Performance Indices
Match play TD, work rate (WR), HSR, number of high-speed runs (NHSR), SD, and number of sprints (NS) were calculated for all players following games. Definitions for these are provided in Table 2.
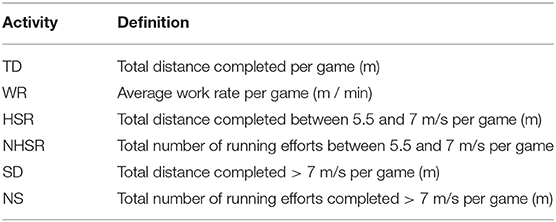
Table 2. Definitions of match play running activities.
Situational and Contextual Variables
Match location (home or away), match outcome (win, draw, or loss), fixture density (number of days between games), and match goal deficit (positive value for a win, negative value for a loss) were recorded for each game. Post-season, league teams were assigned to high (top third, 1–8), intermediate (middle third, 9–16), or low (bottom third, 17–24) groups based on league position to determine quality of opposition.
Statistical Analysis
All estimations were made using the lme4 package (Bates et al., 2018) with R (version 3.5.1, R Foundation for Statistical Computing, Vienna, Austria). A linear mixed-effects model was used to model the effect of season quarter, playing position, and their interactions, upon each of the physical performance indices while adjusting for situational and contextual variables as covariates (additional fixed effects). The random effects were player identity (differences between players' mean output), player identity × season quarter (variability in the effect of season quarter across players), and the residual. The alpha level was set at P < 0.05. Data are presented as means and 95% confidence intervals (CI), alongside Cohen's d effect sizes (Hopkins et al., 2009). Thresholds for ES were: < 0.2 = trivial; 0.2–< 0.6 = small; 0.6–< 1.2 = moderate; 1.2–< 2 = large; ≥2 = very large. The lmerTest package (Kuznetsova et al., 2018) was used to conduct Bonferroni-adjusted pairwise comparisons for the main effect of playing position and phase of season, and their interactions.
Results
Team Season Average Match Play Physical Performance
Descriptive statistics for team season average match play physical performance are presented in Table 3.
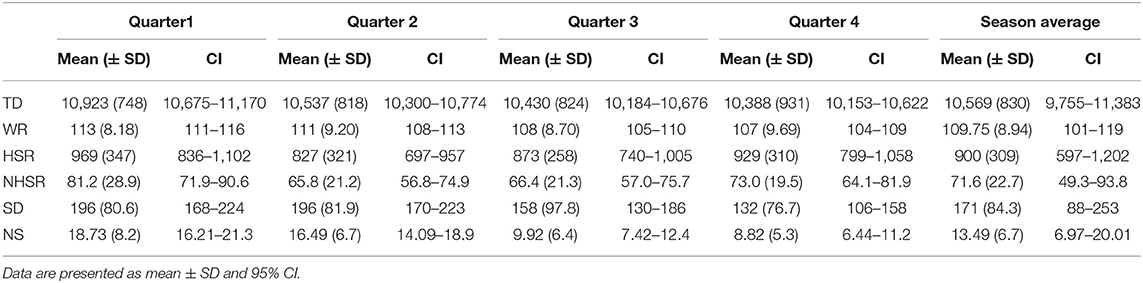
Table 3. Descriptive statistics for team average match play physical performance indices by season quarter: TD, total distance; WR, work rate; HSR, high speed running; NHSR, number of high-speed runs; SD, sprint distance; NS, number of sprints.
Positional Season Average Match Play Physical Performance
Descriptive statistics for season average match play physical performance by playing position are presented in Table 4.
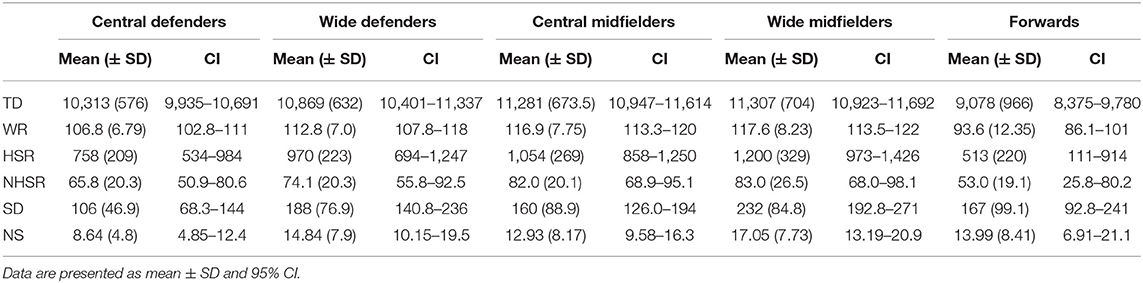
Table 4. Descriptive statistics for season average match play physical performance indices by playing position: TD, total distance; WR, work rate; HSR, high speed running; NHSR, number of high-speed runs; SD, sprint distance; NS, number of sprints.
Differences in season average match play physical performance measures between playing positions are presented in Figure 1. WD completed greater TD than CD (P = 0.028, ES = Moderate) and F (P = 0.004, ES = Very Large) (Figure 1A). CM completed greater TD than CD (P = 0.014, ES = Large) and F (P < 0.001, ES = Very Large) (Figure 1A). WM completed greater TD than CD (P = 0.018, ES = Very Large) and F (P < 0.001, ES = Very Large) (Figure 1A). CD completed greater TD than F (P = 0.035, ES = Large) (Figure 1A). WD completed greater WR than CD (P = 0.028, ES = Moderate) and F (P = 0.004, ES = Very Large) (Figure 1B). CM completed greater WR than CD (P = 0.017, ES = Large) and F (P < 0.001, ES = Very Large) (Figure 1B). WM completed greater WR than CD (P = 0.017, ES = Very Large) and F (P < 0.001, ES = Very Large) (Figure 1B). CD completed greater WR than F (P = 0.035, ES = Large) (Figure 1B). WM completed greater HSR than F (P = 0.048, ES = Large) (Figure 1C). WM completed greater SD than CD (P = 0.006, ES = Large) (Figure 1E). WM completed greater NS than CD (P = 0.043, ES = Large) (Figure 1F).
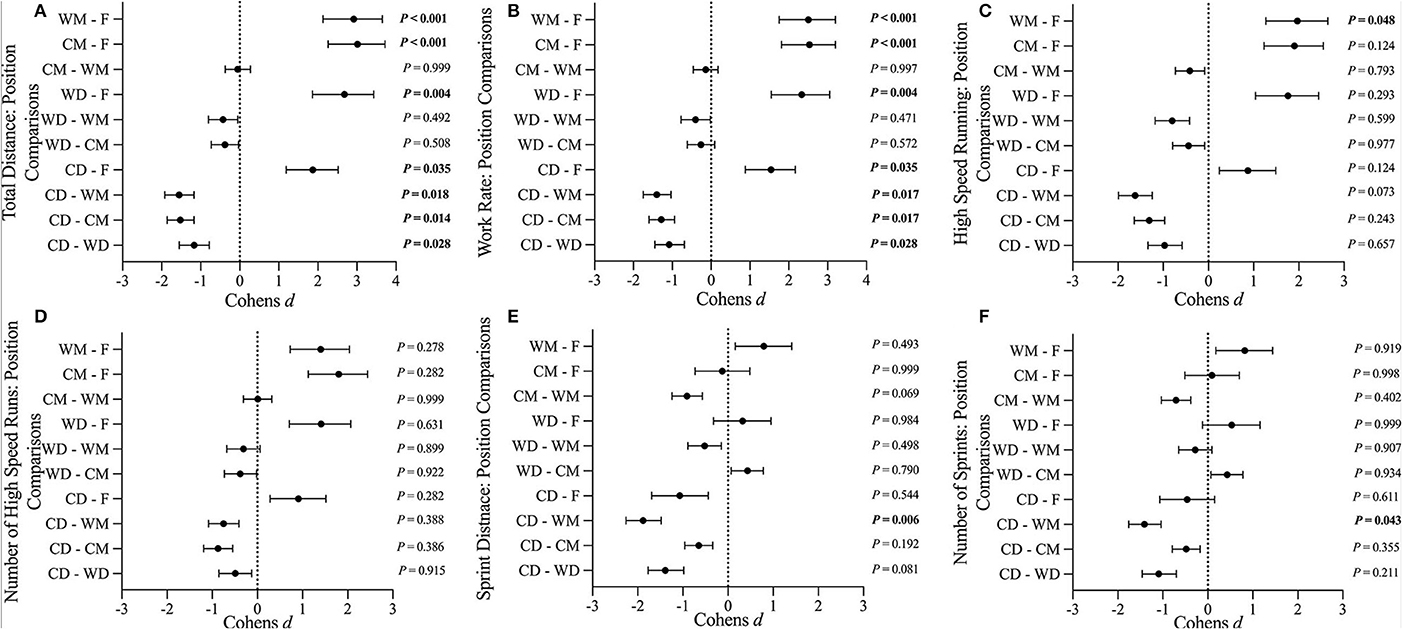
Figure 1. (A–F) Standardized differences in season average match play physical performance measures between playing positions: CD, central defenders; WD, wide defenders; CM, central midfielders; WM, wide midfielders; F, forwards. Data are presented as the standardized Cohens d effect size ± 95% CI.
Team Average Match Play Physical Performance by Season Quarter
Descriptive statistics for team average physical performance by season quarter are presented in Table 3. Differences in team average match play physical performance variables by season quarter are presented in Table 5.
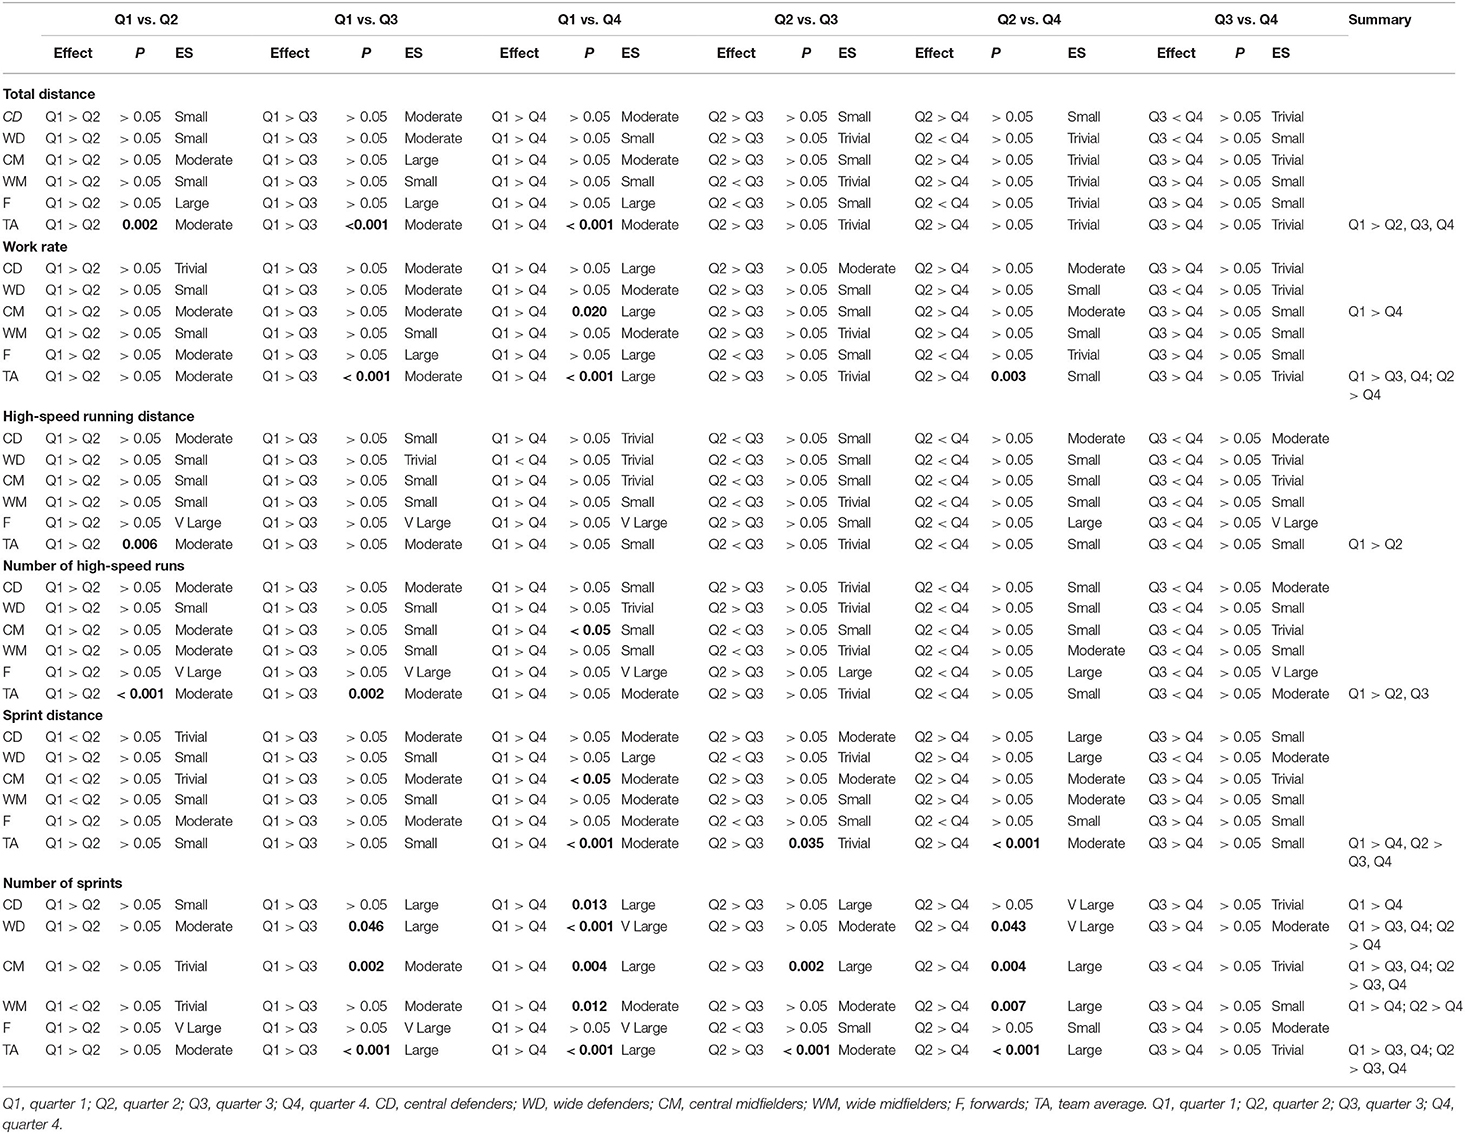
Table 5. Team average and positional match physical performance changes: season quarter comparisons.
Reductions in team average TD were observed between Q1 and Q2 (P = 0.002, ES = Moderate), Q1 and Q3 (P < 0.001, ES = Moderate), and Q1 and Q4 (P < 0.001, ES = Moderate) (Table 5). Reductions in team average WR were observed between Q1 and Q3 (P < 0.001, ES = Moderate), Q1 and Q4 (P < 0.001, ES = Large), and Q2 and Q4 (P = 0.003, ES = Small) (Table 5). Reductions in team average HSR were observed between Q1 and Q2 (P = 0.006, ES = Moderate) (Table 5). Team average NHSR were reduced between Q1 and Q2 (P < 0.001, ES Moderate) and Q1 and Q3 (P = 0.002, ES = Moderate) (Table 5). Reductions in team average SD were observed between Q1 and Q4 (P < 0.001, ES = Moderate), Q2 and Q3 (P < 0.035, ES = Small), and Q2 and Q4 (P < 0.001, ES = Moderate) (Table 5). Team average NS were reduced between Q1 and Q3 (P < 0.001, ES = Moderate), Q1 and Q4 (P < 0.001, ES = Large), Q2 and Q3 (P < 0.001, ES = Trivial), and Q2 and Q4 (P < 0.001, ES = Moderate) (Table 5).
Positional Match Play Physical Performance by Season Quarter
Match play physical performance data by playing position and season quarter are presented in Figure 2. Magnitudes of cross-season match play physical performance changes are presented in Table 5. WR was reduced in CM between Q1 and Q4 (P = 0.020, ES = Large) (Table 5). Reductions in NS were observed between Q1 and Q3 in WD (P = 0.046, ES = Large) and CM (P = 0.002, ES = Moderate) (Table 5). Reductions in NS between Q1 and Q4 were observed in CD (P = 0.013, ES = Large), WD (P < 0.001, ES = Very Large), CM (P = 0.004, ES = Large), and WM (P = 0.012, ES = Moderate) (Table 5). Reductions in NS were observed between Q2 and Q3 in CM (P = 0.002, ES = Large) and between Q2 and Q4 in WD (P = 0.043, ES = Very Large), CM (P = 0.004, ES =Large), and WM (P = 0.007, ES = Large) (Table 5).
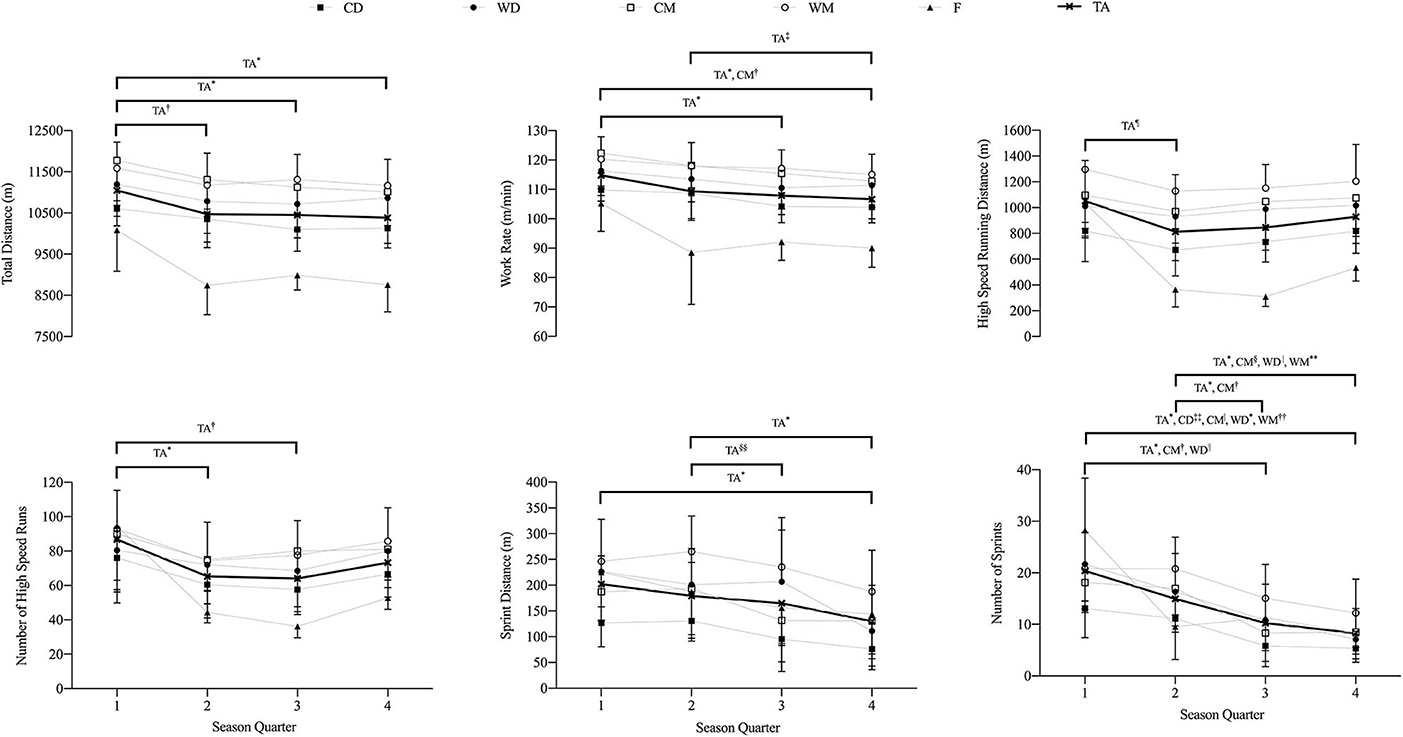
Figure 2. Team average and positional physical performance by season quarter: CD, central defenders; WD, wide defenders; CM, central midfielders; WM, wide midfielders; F, forwards; TA, team average. Data are presented as mean ± SD. Horizontal lines and symbols denote differences within groups: *P = 0.001; †P = 0.002; ‡P = 0.003; §P = 0.004; |P = 0.005; ¶P = 0.006; **P = 0.007; P = 0.012; ‡‡P = 0.014; §§P = 0.035; ||P = 0.044.
Discussion
The first aim of this investigation was to examine team average match play physical performance across an EC season. Our result is a decrease in all physical performance indices across the season. The second aim was to report positional changes in match play physical performance. We observed decreases in match play physical performance indices across the season in all positions. To our knowledge, this is the first investigation to report longitudinal decreases in match play physical performance across a professional football season at team average and positional levels while controlling for situational and contextual variables.
Importantly, the physical demands of match play herein are consistent with previously published data from the EC (Bradley et al., 2013; Di Salvo et al., 2013). For example, season team average TD, HSR, and SD herein were 10,569 ± 830 m, 900 ± 309 m, and 171 ± 84 m, respectively (Table 3), which are similar to the data reported by Bradley et al. (2013) (11,429 ± 816 m, 803 ± 227 m, and 308 ± 139 m) and Di Salvo et al. (2013) (11,102 ± 916 m, 750 ± 222 m, and 273 ± 125 m). Accordingly, match load demands in the current investigation are typical for the EC.
The major finding in this investigation is a cross-season decrease in team average match play physical performance, spanning all measures (Figure 2). This finding is contrary to existing data from the EC (Morgans et al., 2014a) and other European leagues (Mohr et al., 2003; Rampinini et al., 2007; Chmura et al., 2019). Of note, the team head coach, coaching staff, and sport science and medical staff remained constant across the sample period. Moreover, team tactics and the tactical and physical preparation methods employed by the team were constant across the sample period. In addition, our statistical analysis controlled for situational and contextual variables known to affect match play physical performance (Lago-Penas, 2012; Carling, 2013). As such, it is likely that the decreases in performance observed herein are explained by factors internal to the playing cohort.
Relative to the other major European football leagues, EC teams play the highest number of total games, have the greatest game density, and have the largest number of two-game weeks per season (Springham et al., 2019). Consequently, regularly selected EC players often have a limited recovery period between games (~72 h) and are likely to play a substantial number of games in an underrecovered state. This, in turn, might increase the risk of fatigue, maladaptive training, and non-functional overreaching (Meeusen et al., 2013; Schwellnus et al., 2016; Soligard et al., 2016). This cascade is known to cause changes to biological, neurochemical, and hormonal regulation mechanisms and compromises physical performance potential (Meeusen et al., 2013; Schwellnus et al., 2016; Soligard et al., 2016). Accordingly, the cross-season decreases in match play physical performance observed herein might be explained by longitudinal fatigue.
Only one other investigation has reported the seasonal kinetics of match play physical performance in the EC. Morgans et al. (2014a) recorded match play physical performance in home games across a single season and reported a peak in team TD halfway through the season, but no other longitudinal changes to physical performance indices. However, match location can exert a confounding effect on match play physical performance (Lago-Penas, 2012; Carling, 2013). Indeed, players are more likely to complete greater total match distance when playing at home compared to when playing away (Lago-Penas, 2012), owing to the combined effects of crowd, travel, familiarity, referee bias, territoriality, specific tactics, and psychological factors (Lago-Penas, 2012). Accordingly, the use of home game data alone might not be suitable for determining cross-season match-related fatigue. Indeed, this might explain the discrepancies between our findings and those reported previously (Morgans et al., 2014a).
As well as match location, our statistical analysis controlled for match outcome, goal deficit, quality of opposition, and fixture density, in line with previous recommendations (Carling, 2013). Match outcome and goal deficit can influence player and team match strategies (Lago and Martin, 2007; Taylor et al., 2008; Lago-Penas, 2012) whereby players are more likely to adopt defensive characteristics and complete less high-intensity activity when winning by larger margins as opposed to losing by smaller margins or when drawing (Lago and Martin, 2007; Taylor et al., 2008; Lago-Penas, 2012). Data also indicate that players complete greater HSR when playing against higher-quality opposition (Rampinini et al., 2007) and, conversely, lower TD when competing against lower-quality opposition (Lago-Penas, 2012). It is also proposed that players can self-regulate physical activity during congested periods to moderate fatigue (Rampinini et al., 2007; Castellano et al., 2011). Accordingly, the inclusion of these covariates into our statistical analysis might help further explain the discrepancies between our observations and those reported previously (Mohr et al., 2003; Rampinini et al., 2007; Morgans et al., 2014a) and support the notion of a cross-season fatiguing effect herein.
Team average data indicate moderate-to-large cross-season changes for sprint performance indices (SD and NS) (Table 5) and trivial-to-moderate changes for TD, HSR, and NHSR (Table 5). This suggests that players are able to maintain low- to high-speed performance (< 7 m/s) but less able to maintain sprinting performance (> 7 m/s) cross-season. These findings are consistent with other recent scientific research, reporting end-of-season reductions in match play sprint performance in elite-level professional football players (Chmura et al., 2019). Football match play and training are characterized by repetitive, high-intensity, moderate-to-high force stretch-shortening cycle activities, including acceleration, deceleration, change in direction, and sprinting (Akenhead et al., 2013). These are proposed to be the dominant causal activities of low-frequency or “neuromuscular” fatigue in athletes (Fowles, 2006), which reduces the rate of force development during maximal efforts and power output during sustained dynamic actions (Fowles, 2006). Therefore, it follows that neuromuscular fatigue might manifest as a reduction in match play sprinting activity in football. Cross-season decreases in neuromuscular performance have previously been observed during an Australian Rules Football (AFL) season (Cormack et al., 2008). Accordingly, neuromuscular fatigue is a viable explanatory candidate for the decreases observed in SD and NS herein. These findings are of practical importance to teams, owing to the decisive role that player sprint performance has during football match play (Bradley et al., 2009; Di Salvo et al., 2010) and in contributing to match outcome (Andrzejewski et al., 2018).
Previous scientific literature have proposed that players can utilize conscious or subconscious pacing strategies to maintain high-speed output across games by reducing concurrent low-speed output (Folgado et al., 2015; Jones et al., 2018). For example, a reduction in “low” -speed distance (< 4 m/s) but maintenance of “high” -speed distance (> 4 m/s) has been reported during isolated periods of high fixture density (Folgado et al., 2015). Recent longitudinal data indicate that players might also employ pacing strategies to manage cross-season match play physical performance. For example, data from the German Bundesliga indicate cross-season reductions in match play low-speed performance, but concurrent cross-season increases high-speed performance (Chmura et al., 2019). Interestingly, consistent with the current investigation, this study also reported substantial reductions in sprint performance at the end of the competitive season (Chmura et al., 2019). Collectively, findings from the current and previous (Chmura et al., 2019) investigations suggest that offsetting a longitudinal decline in sprinting activity (> 7 m/s) might not always be possible in the context of complete competitive seasons.
Our results indicate that “high-load” positions can experience greater cross-season decreases in match play physical performance than “low-load” positions. For example, consistent with previous literature (Bradley et al., 2013), we observed greater season average match loads in WD, CM, and WM than in CD and F (Table 4, Figure 1). Within positions, our results indicate greater cross-season reductions for WR and NS in “high-load” (WD, CM and WM) than “low-load” playing positions (CD and F) (Figure 2). This suggests a relationship between the rate of match load accumulation and the rate of cross-season deterioration in match play physical performance. Recent data indicate that very high absolute sprint workloads compromise match play sprint performance in elite-level professional football players, likely related to fatigue (Springham et al., 2020). Accordingly, that cross-season match play sprint performance deteriorated most in positions with the greatest sprint demands (Figure 1) is unsurprising. This finding highlights a particular vulnerability for cross-season match play sprint performance deterioration in high-load positions (WD, CM, and WM).
The authors acknowledge that the use of global, as opposed to individualized, running speed thresholds is a major limitation of this investigation. Other limitations include the absence of training load, fatigue, and fitness profiling data. The authors acknowledge that other players and teams might respond differently owing to interteam factors.
Practical Applications
We observed very large cross-season reductions in match play physical performance. Accordingly, physical periodization and squad rotation strategies should be considered to regulate workload, manage fatigue, and mitigate longitudinal risks to match play physical performance. This is particularly important during periods of high game density and two-game weeks, when less time is available for players to recover between games. The authors acknowledge that the capacity to rotate players might be limited by factors including the quality of opposition, player availability, player quality, and coaching philosophy.
We observed very large cross-season reductions in sprint performance indices (SD, NS). Since neuromuscular fatigue is a likely cause, we propose that practitioners should monitor and regulate high-speed and high-intensity workload (acceleration, deceleration, sprinting, and HSR activity) and regularly monitor neuromuscular fatigue status in professional players. This might facilitate improved player management decisions and mitigate the risk of longitudinal decreases in player sprint performance.
Finally, practitioners should develop repeated sprint capacity in players. This might mitigate cross-season reductions in match play sprint performance.
Conclusion
Team average match play physical performance decreased across an EC season. The most notable decreases in performance were observed in sprint performance indices (SD, NS) for which the greatest reductions were observed in WD, CM, and WM.
Data Availability Statement
The datasets presented in this article are not readily available because of ethical and privacy restraints relating to the sample team. Requests to access the datasets should be directed to Matthew Springham, bWF0dC5zcHJpbmdoYW1Ac3RtYXJ5cy5hYy51aw==.
Ethics Statement
The studies involving human participants were reviewed and approved by Edith Cowan University Office for Research and Innovation. The patients/participants provided their written informed consent to participate in this study.
Author Contributions
All authors contributed to the conception and design of the work. MS completed the acquisition, analysis, and interpretation of the data for the work. SW completed the analysis of the data. All authors drafted the work or revised it critically for important intellectual content, approved the final version of the manuscript, and agreed to be accountable for all aspects of the work ensuring accuracy and integrity.
Conflict of Interest
The authors declare that the research was conducted in the absence of any commercial or financial relationships that could be construed as a potential conflict of interest.
References
Akenhead, R., Hayes, P. R., Thompson, K. G., and French, D. (2013). Diminutions of acceleration and deceleration output during professional football match play. J. Sci. Med. Sport 16, 556–561. doi: 10.1016/j.jsams.2012.12.005
Alexeev, D., Nosov, M., Vaguine, I., Ryabchikov, I., Bobyrev, A., and Belov, M. (2014). Validation and precision analysis of InStat Fitness system. Moscow: Moscow State University; Faculty of Mechanics and Mathematics.
Andrzejewski, M., Chmura, P., Konefal, M., Kowalczuk, E., and Chmura, J. (2018). Match outcome and sprinting activities in match play by elite German soccer players. J. Sports Med. Phys. Fitness 58, 785–792. doi: 10.23736/S0022-4707.17.07352-2
Ascensao, A., Rebelo, A., Oliveira, E., Marques, F., Pereira, L., and Magalhaes, J. (2008). Biochemical impact of a soccer match - analysis of oxidative stress and muscle damage markers throughout recovery. Clin. Biochem. 41, 841–851. doi: 10.1016/j.clinbiochem.2008.04.008
Bates, D., Maechler, M., Bolker, B., Walker, S., Christensen, R. H. B., Singmann, H., et al. (2018). Linear Mixed-Effects Modesl Using ‘Eigen’ and S4. Available online at: https://cran.r-project.org/web/packages/lme4/lme4.pdf (accessed August 6, 2020).
Bradley, P. S., Carling, C., Gomez Diaz, A., Hood, P., Barnes, C., Ade, J., et al. (2013). Match performance and physical capacity of players in the top three competitive standards of English professional soccer. Hum. Mov. Sci. 32, 808–821. doi: 10.1016/j.humov.2013.06.002
Bradley, P. S., Sheldon, W., Wooster, B., Olsen, P., Boanas, P., and Krustrup, P. (2009). High-intensity running in English FA Premier League soccer matches. J. Sports Sci. 27, 159–168. doi: 10.1080/02640410802512775
Carling, C. (2013). Interpreting physical performance in professional soccer match-play: should we be more pragmatic in our approach? Sports Med. 43, 655–663. doi: 10.1007/s40279-013-0055-8
Castellano, J., Blanco-Villasenor, A., and Alvarez, D. (2011). Contextual variables and time-motion analysis in soccer. Int. J. Sports Med. 32, 415–421. doi: 10.1055/s-0031-1271771
Chmura, P., Konefal, M., Wong, D. P., Figueiredo, A. J., Kowalczuk, E., Rokita, A., et al. (2019). Players' physical performance decreased after two-thirds of the season: results of 3 consecutive seasons in the German First Bundesliga. Int. J. Environ. Res. Public Health 16:2044. doi: 10.3390/ijerph16112044
Cormack, S. J., Newton, R. U., McGuigan, M. R., and Cormie, P. (2008). Neuromuscular and endocrine responses of elite players during an Australian rules football season. Int. J. Sports Physiol. Perform. 3, 439–453. doi: 10.1123/ijspp.3.4.439
Dellal, A., Chamari, K., Wong del, P., Ahmaidi, S., Keller, D., Barros, R., et al. (2011). Comaprison of physical and technical performance in European soccer match-play: premier League and La Liga. Eur. J. Sport Sci. 11, 51–59. doi: 10.1080/17461391.2010.481334
Di Salvo, V., Baron, R., Gonzalez-Haro, C., Gormasz, C., Pigozzi, F., and Bachl, N. (2010). Sprinting analysis of elite soccer players during European Champions League and UEFA Cup matches. J. Sports Sci. 28, 1489–1494. doi: 10.1080/02640414.2010.521166
Di Salvo, V., Pigozzi, F., González-Haro, C., Laughlin, M. S., and De Witt, J. K. (2013). Match performance comparison in top English Soccer Leagues. Int. J. Sports Med. 34, 536–532. doi: 10.1055/s-0032-1327660
Folgado, H., Duarte, R., Marques, P., and Sampaio, J. (2015). The effects of congested fixtures period on tactical and physical performance in elite football. J. Sports Sci. 33, 1238–1247. doi: 10.1080/02640414.2015.1022576
Fowles, J. R. (2006). Technical issues in quantifying low-frequency fatigue in athletes. Int. J. Sports Physiol. Perform. 1, 169–171. doi: 10.1123/ijspp.1.2.169
Gregson, W., Drust, B., Atkinson, G., and Salvo, V. D. (2010). Match-to-match variability of high-speed activities in premier league soccer. Int. J. Sports Med. 31, 237–242. doi: 10.1055/s-0030-1247546
Hattersley, C., Wells, C., Blagrove, R., Trangmar, S., and Patterson, S. (2018). “Impact of Fixture Congestion on Idices of Performance and Recovery in Youth Soccer Players,” in Sports Performance and Science Reports. Available online at: https://sportperfsci.com/impact-of-fixture-congestion-on-indices-of-performance-recovery-in-youth-soccer-players/ (accessed August 6, 2020).
Hopkins, W. G., Marshall, S. W., Batterham, A. M., and Hanin, J. (2009). Progressive statistics for studies in sports medicine and exercise science. Med. Sci. Sports Exerc. 41, 3–13. doi: 10.1249/MSS.0b013e31818cb278
Ispirlidis, I., Fatouros, I. G., Jamurtas, A. Z., Nikolaidis, M. G., Michailidis, I., Douroudos, I., et al. (2008). Time-course of changes in inflammatory and performance responses following a soccer game. Clin. J. Sport Med. 18, 423–431. doi: 10.1097/JSM.0b013e3181818e0b
Jones, R. N., Greig, M., Mawene, Y., Barrow, J., and Page, R. M. (2018). The influence of short-term fixture congestion on position specific match running performance and external loading patterns in English professional soccer. J. Sports Sci. 37, 1338–1346. doi: 10.1080/02640414.2018.1558563
Kelly, D. M., Strudwick, A. J., Atkinson, G., Drust, B., and Gregson, W. (2019). Quantification of training and match-load distribution across a season in elite English Premier League soccer players. Sci. Med. Football 4, 1–9. doi: 10.1080/24733938.2019.1651934
Kuznetsova, A., Brockhoff, P. B., and Christensen, R. H. B. (2018). Tests in Linear Mixed Effects Models. Avilable online at: https://cran.r-project.org/web/packages/lmerTest/lmerTest.pdf (accessed August 6, 2020). doi: 10.18637/jss.v082.i13
Lago, C., and Martin, R. (2007). Determinants of possession of the ball in soccer. J. Sports Sci. 25, 969–974. doi: 10.1080/02640410600944626
Lago-Penas, C. (2012). The role of situational variables in analysing physical performance in soccer. J. Hum. Kinet. 35, 89–95. doi: 10.2478/v10078-012-0082-9
Meeusen, R., Duclos, M., Foster, C., Fry, A., Gleeson, M., Nieman, D., et al. (2013). Prevention, diagnosis, and treatment of the overtraining syndrome: joint consensus statement of the European College of Sport Science and the American College of Sports Medicine. Med. Sci. Sports Exerc. 45, 186–205. doi: 10.1249/MSS.0b013e318279a10a
Mohr, M., Krustrup, P., and Bangsbo, J. (2003). Match performance of high-standard soccer players with special reference to development of fatigue. J. Sports Sci. 21, 519–528. doi: 10.1080/0264041031000071182
Morgans, R., Adams, D., Mullen, R., McLellan, C., and Williams, M. D. (2014a). Technical and physical performance over and English Championship League Season. Int. J. Sport Sci. Coaching 9, 1033–1042. doi: 10.1260/1747-9541.9.5.1033
Morgans, R., Orme, P., Anderson, L., Drust, B., and Morton, J. P. (2014b). An intensive Winter fixture schedule induces a transient fall in salivary IgA in English premier league soccer players. Res. Sports Med. 22, 346–354. doi: 10.1080/15438627.2014.944641
Nedelec, M., McCall, A., Carling, C., Legall, F., Berthoin, S., and Dupont, G. (2012). Recovery in soccer: part I - post-match fatigue and time course of recovery. Sports Med. 42, 997–1015. doi: 10.1007/BF03262308
Owen, A. L., Wong del, P., Dunlop, G., Groussard, C., Kebsi, W., Dellal, A., et al. (2016). High-intensity training and salivary immunoglobulin A responses in professional top-level soccer players: effect of training intensity. J. Strength Cond. Res. 30, 2460–2469. doi: 10.1519/JSC.0000000000000380
Rampinini, E., Coutts, A. J., Castagna, C., Sassi, R., and Impellizzeri, F. M. (2007). Variation in top level soccer match performance. Int. J. Sports Med. 28, 1018–1024. doi: 10.1055/s-2007-965158
Rowell, A. E., Aughey, R. J., Hopkins, W. G., Esmaeili, A., Lazarus, B. H., and Cormack, S. J. (2018). Effects of training and competition load on neuromuscular recovery, testosterone, cortisol, and match performance during a season of professional football. Front. Physiol. 9:668. doi: 10.3389/fphys.2018.00668
Russell, M., Northeast, J., Atkinson, G., Shearer, D. A., Sparkes, W., Cook, C. J., et al. (2015). Between-Match variability of peak power output and creatine kinase responses to soccer match-play. J. Strength Cond. Res. 29, 2079–2085. doi: 10.1519/JSC.0000000000000852
Russell, M., Sparkes, W., Northeast, J., Cook, C. J., Bracken, R. M., and Kilduff, L. P. (2016). Relationships between match activities and peak power output and Creatine Kinase responses to professional reserve team soccer match-play. Hum. Mov. Sci. 45, 96–101. doi: 10.1016/j.humov.2015.11.011
Schwellnus, M., Soligard, T., Alonso, J. M., Bahr, R., Clarsen, B., Dijkstra, H. P., et al. (2016). How much is too much? (Part 2) International Olympic Committee consensus statement on load in sport and risk of illness. Br. J. Sports Med. 50, 1043–1052. doi: 10.1136/bjsports-2016-096572
Soligard, T., Schwellnus, M., Alonso, J. M., Bahr, R., Clarsen, B., Dijkstra, H. P., et al. (2016). How much is too much? (Part 1) International Olympic Committee consensus statement on load in sport and risk of injury. Br. J. Sports Med. 50, 1030–1041. doi: 10.1136/bjsports-2016-096581
Springham, M., Waldron, M., Burgess, D., and Newton, R. U. (2019). Game distrbution and density differ between the Major British and European Professional Football Leagues. J. Sports Sci. 37, 1–93. doi: 10.1080/02640414.2019.1671688
Springham, M., Williams, S., Waldron, M., Strudwick, A. J., McLellan, C., and Newton, R. U. (2020). Prior workload has moderate effects on high-intensity match performance in elite-level professional football players when controlling for situational and contextual variables. J. Sports Sci. doi: 10.1080/02640414.2020.1778355. [Epub ahead of print].
Taylor, J. B., Mellalieu, S. D., James, N., and Shearer, D. A. (2008). The influence of match location, quality of opposition, and match status on technical performance in professional association football. J. Sports Sci. 26, 885–895. doi: 10.1080/02640410701836887
Thorpe, R. T., Strudwick, A. J., Buchheit, M., Atkinson, G., Drust, B., and Gregson, W. (2015). Monitoring fatigue during the in-season competitive phase in elite soccer players. Int. J. Sports Physiol. Perform. 10, 958–964. doi: 10.1123/ijspp.2015-0004
Thorpe, R. T., and Sunderland, C. (2012). Muscle damage, endocrine, and immune marker response to a soccer match. J. Strength Cond. Res. 26, 2783–2790. doi: 10.1519/JSC.0b013e318241e174
UEFA (2016). “The European Club Footballing Landscape. Club Licensing Benchmarking Report. Financial Year 2016,” ed S. Perry (Union of European Football Associations). Available online at: https://www.uefa.com/MultimediaFiles/Download/OfficialDocument/uefaorg/
Clublicensing/02/53/00/22/2530022_DOWNLOAD.pdf (accessed August 6, 2020).
Keywords: football, performance, load, demands, fatigue, match play, monitoring
Citation: Springham M, Williams S, Waldron M, Burgess D and Newton RU (2020) Large Reductions in Match Play Physical Performance Variables Across a Professional Football Season With Control for Situational and Contextual Variables. Front. Sports Act. Living 2:570937. doi: 10.3389/fspor.2020.570937
Received: 09 June 2020; Accepted: 13 August 2020;
Published: 15 October 2020.
Edited by:
George P. Nassis, University of Southern Denmark, DenmarkReviewed by:
Mark Russell, Leeds Trinity University, United KingdomPaweł Piotr Chmura, University School of Physical Education in Wroclaw, Poland
Alexandre Dellal, Fifa Medical Center of Excellence, France
Copyright © 2020 Springham, Williams, Waldron, Burgess and Newton. This is an open-access article distributed under the terms of the Creative Commons Attribution License (CC BY). The use, distribution or reproduction in other forums is permitted, provided the original author(s) and the copyright owner(s) are credited and that the original publication in this journal is cited, in accordance with accepted academic practice. No use, distribution or reproduction is permitted which does not comply with these terms.
*Correspondence: Matthew Springham, bWF0dC5zcHJpbmdoYW1Ac3RtYXJ5cy5hYy51aw==