 M. H. Montgomery
 B. H. Dunlap
 P. B. Cho
 T. A. Gomez
- 1Department of Astronomy, University of Texas at Austin, Austin, TX, United States
- 2Sandia National Laboratories, Albuquerque, NM, United States
For isolated white dwarf (WD) stars, fits to their observed spectra provide the most precise estimates of their effective temperatures and surface gravities. Even so, recent studies have shown that systematic offsets exist between such spectroscopic parameter determinations and those based on broadband photometry. These large discrepancies (10% in Teff, 0.1 M⊙ in mass) provide scientific motivation for reconsidering the atomic physics employed in the model atmospheres of these stars. Recent simulation work of ours suggests that the most important remaining uncertainties in simulation-based calculations of line shapes are the treatment of 1) the electric field distribution and 2) the occupation probability (OP) prescription. We review the work that has been done in these areas and outline possible avenues for progress.
1 Introduction
In white dwarf (WD) astronomy, the stellar parameters Teff and log g are commonly derived from fits to normalized Balmer line profiles. First employed for a large sample of WDs by Bergeron et al. (1992), this “spectroscopic method” has been instrumental in some of the most important aspects of WD astronomy, such as the shape of the DA population mass distribution, the boundaries of the ZZ Ceti pulsational instability strip, characterizations of the luminosity function, and the evolution and formation rate of DA WDs (Bergeron et al., 1992; Liebert et al., 2005; Eisenstein et al., 2006; Gianninas et al., 2006; Kepler et al., 2007). The model atmospheres used for these determinations (Bergeron et al., 1992; Koester, 2010) incorporate theoretical models for the hydrogen line profiles (Lemke, 1997). While these profiles have received an important update (Tremblay and Bergeron, 2009), they are still largely based on the “unified theory” of line broadening developed by Vidal et al. (1973, hereafter VCS).
In spite of its many successes, there are signs of problems with the spectroscopic method. For instance, recent studies have shown that there is approximately a 10% offset in Teff and a 0.1 M⊙ offset in stellar mass when comparing spectroscopic values with those determined from broadband photometry and parallax (Bergeron et al., 2019; Genest-Beaulieu and Bergeron, 2019), with the spectroscopic values being higher in temperature and in mass1. Since broadband photometry is much less dependent on the details of the Balmer line shapes, the cause of this discrepancy could lie in the way the spectral lines are modeled. In addition, Fuchs (2017) showed that fits to individual Balmer lines in a WD spectrum yield Teff and log g values that significantly disagree with one another. Thus, the time is ripe for a re-examination of the physics that goes into these model atmospheres.
Recently, Cho (2021) and Cho et al. (2022) have calculated a grid of line profiles using an improved version of the Xenomorph code (Gomez, 2013; Gomez et al., 2016; Cho, 2021). While Xenomorph includes many physical and numerical improvements over previous line profile theories employed in astronomy, Cho et al. (2022) identified two physical effects which had the largest effect on the shapes of the calculated profiles: 1) the treatment of screening in the calculation of electric fields due to the plasma charges, and 2) the prescription used for the occupation probability (OP) of the atomic states. We discuss each of these in detail in the following sections.
2 Physical Background and Phenomenology
When an atom is placed in a dense plasma, the plasma particles will perturb the wavefunctions and shift the energy levels of that atom. In a white dwarf atmosphere, the dominant perturbations to atomic energy levels come from free electrons and protons. Each atom is perturbed differently by the surrounding charges, and the final spectrum we observe is the ensemble average of all perturbed atoms.
In high density plasmas, two things happen in the spectra: the lines broaden in a non-trivial way and the bound-free continuum gets pushed toward lower energies (see, e.g., Däppen et al., 1987; Seaton, 1990). In Figure 1, we see this phenomenon at work in the data of Wiese et al. (1972). At medium density, the line shapes have a clearly-defined width and exhibit the classical Lorentzian line shape. At high density, however, the line shapes begin to deviate from this Lorentzian shape, with Hγ becoming more triangular and Hβ (not shown) developing two peaks. Some lines become so broad that they overlap, as is the case for Hϵ and Hδ. The higher-n lines have disappeared entirely, showing a featureless continuum. In the medium density data of Wiese et al., the Hϵ and H8 lines are clear features, while at high density H8 is no longer visible and Hϵ is nearly gone. Inglis and Teller (1939) give an empirical formula that describes the last line that one can expect to distinctly observe in a plasma. The disappearance of lines into a continuum is often referred to as line merging or continuum lowering.
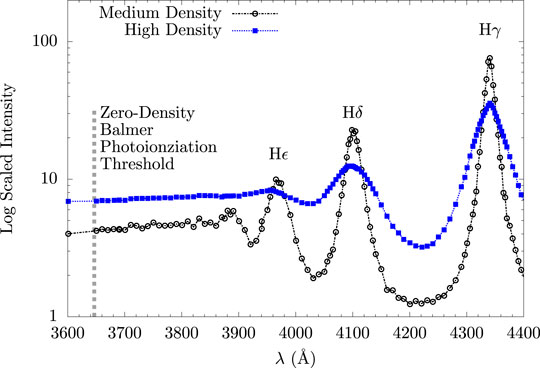
FIGURE 1. Balmer series emission data of Wiese et al. (1972), on an arbitrary relative scale. According to Wiese et al. (assuming full LTE), the high density case has ne ≈ 9, ×, 1016 cm−3, T ≈ 13, 000 K, while the medium density case has ne ≈ 2 × 1016 cm−3, T ≈ 10,000 K. In addition to having larger widths, the lines in the high density case are seen to decrease and merge into the continuum more rapidly than in the lower density case.
Because line broadening is the result of an ensemble average of all perturbations of the plasma particles (Gomez et al., 2018), we need to consider how the interactions modify the atomic structure as well as the fraction of atoms that experience a particular set of conditions. In hydrogen, the interaction between the atom and plasma can be well-approximated by the plasma electric field (Gomez et al., 2021). Given the difference in mass between ions and electrons, to a first approximation the electric field F due to the ions can be treated as a static field. Letting Jab(ω, F) be the electron broadening of the transition between states a and b in the presence of an electric field F, we can write the total broadening as an integral over the ion field:
where P(f) is the distribution function of ion electric fields (e.g., see Griem et al., 1959). Much study has been devoted towards modeling P(f), which represents the fraction of atoms that experience a given electric field strength. Correlations of the charged particles in the plasma can have a significant effect on the electric field distributions and thus the line shape. These plasma correlations are often treated as a screening effect, where the fields of particles far from the atom are shielded by the nearby particles. In Section 3, we show a case in which a choice different from the standard one for screening and correlation effects can better represent the electric fields of the electrons and protons, both separately and together.
The broadening of spectral lines where the atom is weakly perturbed by the plasma can be calculated using a perturbation-theory approach, using a linear-combination of wavefunctions to describe the perturbed wavefunction. However, at higher densities, a perturbation-theory approach with plasma electric fields is insufficient to accurately describe the plasmas. For example, the atomic structure of a hydrogen atom at high densities may more closely resemble an H2 or
An exact calculation of the atomic structure in the presence of many plasma particles does not exist. There are ad-hoc treatments, such as occupation probability (OP), that mock up the observational effect of line merging or continuum lowering. In these methods, the phenomenon is treated from a chemical and statistical mechanical point of view, which tries to estimate the probability of the existence of a state given the local electric field and/or the distribution of nearby charges. The “occupation probability” of a level n is denoted by wn, and wn is also the fraction of atoms in the plasma for which this state exists. For the fraction 1 − wn of atoms for which this state has been dissolved, OP provides a model with which the oscillator strength of transitions to and from these levels is spread into a “pseudo-continuum” which merges smoothly with the normal bound-free continuum. In the spectrum, this has the effect of extending continuum opacity to lower energies and so can modify the shape of the spectrum in the region where the lines are observed. Finally, since OP restricts the range of electric field strengths that the radiating atom experiences, the intrinsic shape of the lines is also affected.
3 Distribution of Electric Fields
In Xenomorph, the radiating/absorbing atom is treated quantum mechanically while the perturbing electric field of the plasma is treated classically. Thus, the surrounding plasma particles are considered to be classical particles, with the protons and electrons interacting through purely electrostatic forces. While various analytical approaches have been developed to approximate the distribution of electric fields (Hooper, 1966; Iglesias et al., 1983; Iglesias et al., 2000), simulation-based codes such as Xenomorph require an electric field time series so that the equations can be integrated in time. The computationally least expensive approach to this is a non-interacting N-particle simulation in which the plasma particles follow straight line trajectories and are re-injected when they leave the simulation domain. The neglected interactions between particles are then partially re-introduced using Debye-shielded potentials for the charged particles:
(see Eq. 3 for a definition of the Debye length, λD). Finally, in order to simulate an ensemble average over plasma configurations, a very large number of electric field time series is computed. Such an approach is computationally feasible for such non-interacting simulations and has been employed in many previous calculations (e.g., Stamm et al., 1984; Stamm and Smith, 1984; Gigosos and Cardeñoso, 1987; Stambulchik and Maron, 2006; Djurović et al., 2009; Rosato et al., 2020).
We note that there is not agreement in the community whether the Debye shielding in these calculations should include screening by both electrons and protons, or just electrons. A standard assumption is that protons are screened by both the electrons and protons, but that electrons are screened by electrons only (e.g., Stambulchik and Maron, 2006). This results in a different Debye length being used for the electron and proton contributions. In the WD field, the standard semi-analytical approaches of Vidal et al. (1973) and Tremblay and Bergeron (2009) assume that the screening of both the ions and electrons is by electrons only, and this is also assumed in the recent simulation-based calculations of Cho (2021) and Cho et al. (2022).
To investigate the validity of these assumptions, Stambulchik et al. (2007) used a fully interacting N-particle simulation (denoted by “FMD” = “full molecular dynamics”) to directly compute the electric field distribution of a Coulomb plasma with T = 1 eV and Ne = Nion = 1018 cm−3. They then used this electric field history in their simulation-based line profile code to compute the FWHM of the Hα line (n = 3 → 2). Next, they used an electric field history calculated using non-interacting plasma particles where the ions were screened by ions and electrons and the electrons were screened by electrons only. They found the FWHM was ∼
In a related study, Cho et al. (2022) used the code Xenomorph to look at the results of two non-interacting simulations in which two different prescriptions for the screening were used. In the first, the standard approach of screening by electrons only was used, so λD,i = λD,e, where
In the second case, the ions were screened by both ions and electrons, so
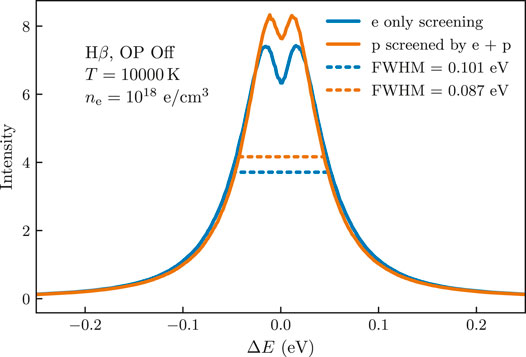
FIGURE 2. The effect of screening on line shape of Hβ. Increasing the amount of screening experienced by the plasma particles yields narrower lines. Doubly screening ions by both ions and electrons produces a narrower profile than singly screening both types of particles.
Of course, the physics of screening, or more precisely the distribution of electric fields in a plasma (and their variation with time) is in principle a solved problem. The physics is known (the 1/r2 Coulomb force between charged particles) and molecular dynamics simulations can be run until sufficient accuracy is achieved2. In reality, due to the large difference in mass between electrons and ions, such simulations are very expensive computationally (Gigosos et al., 2018), and only a small number of plasma conditions can be calculated in this way. In addition, simulation codes such as Xenomorph need thousands of such simulations for identical plasma conditions in order to approximate an ensemble average over the surrounding plasma, and this is usually prohibitively expensive.
It is for this reason that non-interacting N-particle simulations are employed. Ideally, we would like a procedure for “fixing up” the non-interacting simulations so that they best approximate the FMD results, both in terms of total electric field distribution and in terms of the individual distributions of the electrons and ions. We show such an attempt in Figure 3A. For the non-interacting simulation in Xenomorph we have used a modified screening length for both protons and electrons with
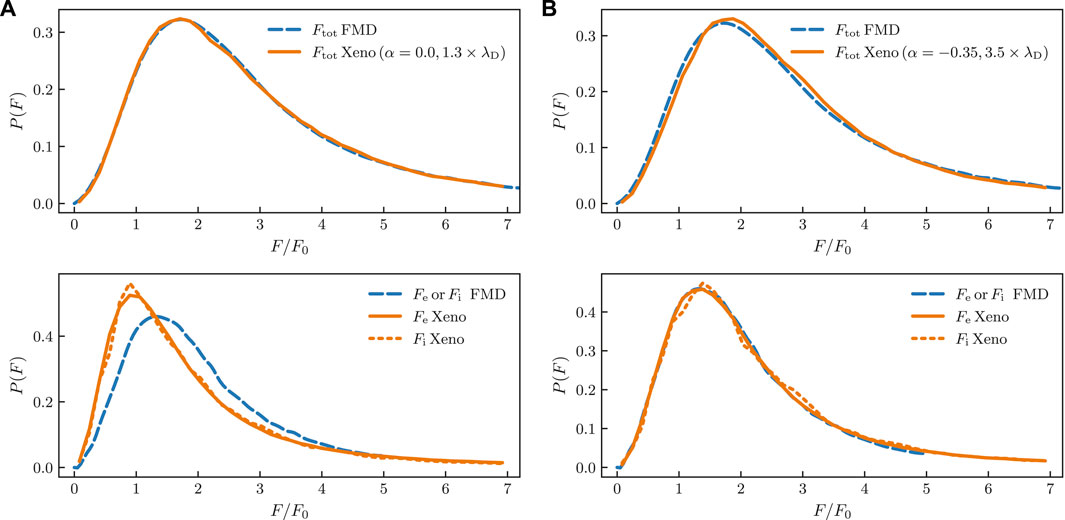
FIGURE 3. Comparison of electric field distributions of the non-interacting simulations of Xenomorph with those from the FMD simulations of Stambulchik et al. (2007). The top panel of (A) shows that the FMD distribution can be very well reproduced with
A hint to a possible improvement is given by Stambulchik et al. (2007). They examine the decay in time of correlations of the ion and electron total electric fields in an FMD simulation. They find that their results can be explained by a simple model in which the total electron field acquires a low-frequency component proportional to the total ion field, i.e.,
where
Using this information we make a second attempt to “fix up” the non-interacting calculations. We calculate the electric field of the electrons as in Eq. 4, with the result that the total field is given by
Interpreting
Stambulchik et al. (2007) note that |α| is expected to be of order Γ, where
For these plasma conditions (Ne = 1018 cm−3, T = 1 eV) we find Γ = 0.23. We note that our chosen value closely approximates α ≈ −1.5 Γ, which is equal to the expected first order fractional reduction in the average electric field due to Debye screening (see Eq. 4 of Stambulchik et al., 2007).
Fully-interacting simulations would need to be run to see whether α = −1.5 Γ is a valid parameterization over a range of temperatures and densities. In any case, this approach offers the promise that only one fully-interacting simulation needs to be run for a given set of plasma conditions and, from this, best-fit values of
4 Occupation Probability
In a dense plasma, the presence of nearby ions is believed to lead to a suppression of spectral features; the ions produce electric fields which perturb the emitting or absorbing atom and are thought to lead to the dissolution of bound states needed to produce individual spectral features. Early experiments by H. von Traubenberg and Gebauer (1929), von Traubenberg et al. (1930) showed how the spectral features in the Balmer series changed as a spatially constant electric field was increased (see Figure 4). Above a certain threshold (different for each line), the spectral features were seen to vanish.
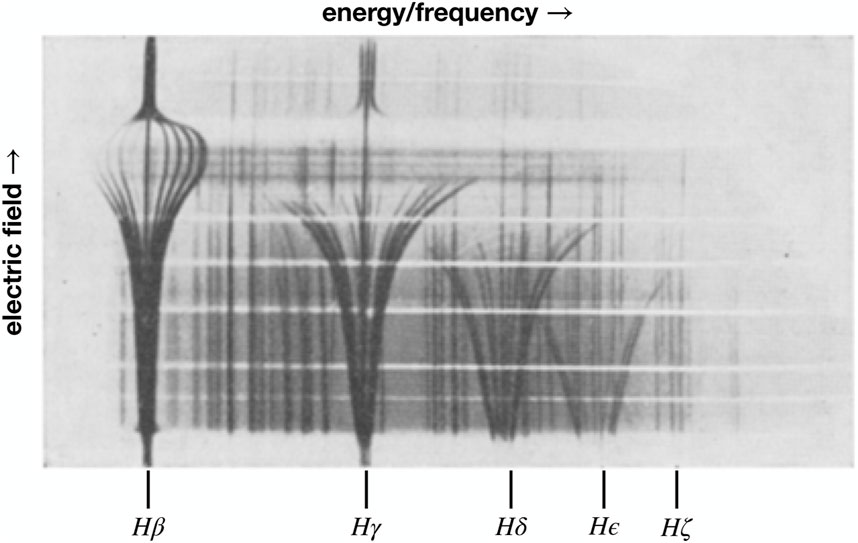
FIGURE 4. The Stark effect of an applied electric field on the splitting of hydrogen Balmer lines as measured by von Traubenberg and Gebauer (1929), Gebauer and von Traubenberg (1930) and von Traubenberg et al. (1930). Taken from von Traubenberg et al. (1930).
While this is a very important result, there are reasons that this might not apply to the plasmas we commonly observe. The most important of these is that in a normal laboratory or astrophysical plasma the electric microfields experienced by radiating or emitting atoms are due to nearby ions, and these fields will not be spatially uniform. In addition, not all atoms will experience the same electric field, so the resulting spectrum will be due to an ensemble average over a distribution of plasma states and electric microfield values. Finally, for an atom immersed in a spatially uniform electric field, when the electron tunnels away from the atom it escapes to infinity. In a real plasma, the fields strong enough to allow such movement are due to nearby ions, so when the electron leaves the atom (either by tunneling or classical “over the barrier” motion) it will not escape to infinity, but rather be bound to the nearest ion or shared among nearby ions (Fisher and Maron, 2002).
In response to this fundamentally difficult problem, Inglis and Teller (1939) suggested a simple criterion for the merging of spectral lines into the continuum, namely, that this should occur when the energies of neighboring levels (e.g., En and En+1) begin to overlap due to Stark splitting. Slightly later, Unsöld (1948) calculated the critical electric field above which a state should no longer exist. He did this for the case of a uniform electric field and for a field due to a nearby ion. Using the nearest-neighbor approximation for the distribution functions of both the electric field and inter-ionic distance, he computed the fraction of atoms in the plasma for which the level n exists. Nowadays, this quantity is referred to as the occupation probability of a level, denoted by wn.
4.1 The Hummer and Mihalas Treatment of Occupation Probability
The most commonly employed treatment in the astronomical community is based on the work of Hummer and Mihalas (Hummer and Mihalas, 1988, hereafter HM88). Using a chemical picture, they wished to calculate the equation of state of a non-ideal gas using the internal partition function of the gas. Since the energy levels scale like En ∝ 1/n2, these energies approach zero for large n and their respective Boltzmann factors approach one, leading to the formal divergence of the partition function. However, if one introduces a high-n cutoff (based on the Inglis-Teller criterion, for example), then the partition function remains finite and all thermodynamic quantities can be derived.
After evaluating many different effects and approaches, HM88 eventually settled on an expression for the critical field strength, Fcrit, that is the same as that used by Inglis and Teller (1939), i.e., the field strength required for levels n and n + 1 to cross due to Stark splitting. Their justification for this criterion depends on the waxing and waning of the electric microfield that allows particles to move from level n to n + 1, eventually leaving the atom. For F > Fcrit, the upper state in a given transition is assumed to be dissolved, so Jab(ω, F) = 0 for this case. Thus, the upper limit of the integral in Eq. 1 can be replaced with Fcrit, i.e.,
We note that we have reservations concerning the above picture since a plasma in equilibrium will have as many particles entering a state due to the inverse of this process as are leaving due to the process itself. Thus, such a process appears to have more to do with the lifetime of a given state than its dissolution.
Nayfonov et al. (1999) improved upon the Holtsmark microfield distribution used in HM88 by using fits to the microfield distribution based on the work of Hooper (1966, 1968). These updated occupation probability calculations are currently employed in many stellar atmosphere codes (e.g., Hubeny et al., 1994; Tremblay and Bergeron, 2009; Koester, 2010) which are the current state-of-the-art in the astronomical community.
4.2 Fits to Laboratory Data
The experiments of Wiese et al. (1972) in the early 1970s remain benchmark measurements of emission in a hydrogen plasma, covering electron densities of 1.5 × 1016 cm−3 to 1017 cm−3 and temperatures of 9,000–14,000 K. As a result, there have been several attempts at fitting these spectra employing different versions of OP.
Däppen et al. (1987) fit data from Wiese et al. (1972) (the curves in Figure 1) with both the HM88 formalism for OP as well as a prescription that assumed wn = 1 for all lines out to n = 30, and wn = 0 for n > 30. They found the best agreement with data for the wn = 1 prescription, i.e., no OP for n ≤ 30, except in the vicinity of the Balmer jump, which was not well modeled.
Stehle and Jacquemot (1993) also modeled the high density data of Wiese et al. (1972). Unlike Däppen et al. (1987), they also included the effects of OP on the line shapes as well as on the line strengths. While calculations with and without OP provided good fits to the data, the best agreement was found for the case where field ionization was neglected, i.e., wn = 1 for all levels.
Like Stehle and Jacquemot (1993), Tremblay and Bergeron (2009) included the effects of OP (using the HM88 prescription) on both the line shapes and strengths. They find that their fits to the low-density data of Wiese et al. (1972) are better than those using the VCS theory (which lacks OP), but the situation is less clear for the high-density data. They state that the data “…do not provide such a stringent constraint on the broadening theories because of the large range of acceptable plasma state parameters, and also because of potential departures from LTE.”
There are strong physical reasons for believing that OP or a prescription very much like it should be used to cause lines to merge into the continuum as the density is increased. Thus far, however, fits to laboratory data have failed to demonstrate this quantitatively.
4.3 Fits to White Dwarf Spectra
The atmospheres of WDs are home to many different physical processes that operate simultaneously. In addition, an emergent spectrum is an integral over layers of different temperatures and densities. As a result, a simple test isolating the effects of OP at a particular set of plasma conditions is not possible. Even so, we can test the ability of model atmospheres that incorporate the effects of OP to reproduce the observed spectra of WDs. In particular, we can test how well different physical assumptions allow us to obtain consistent values of log g and Teff when fitting different lines in a stellar spectrum.
The first systematic study of this was by Bergeron (1993), who applied the OP formalism of HM88 to modify the strengths of the hydrogen lines. As the line opacity is decreased with decreasing wn, the pseudo-continuum opacity is increased. Because this opacity extends to lower energies than the traditional bound-free continuum opacity, it modifies the shape of the spectrum in the region of the Balmer lines. Thus, even though Bergeron (1993) did not apply the OP formalism to modify the input line shapes, changes to the pseudo-continuum opacity can modify the spectrum in ways similar to changes in the line wings. OP would prescribe a decrease in line wing opacity since opacity farther in the wings arises from perturbations by stronger electric fields, which OP assumes to destroy the state. In the absence of suitable line shapes that include this effect, Bergeron (1993) chose to decrease the pseudo-continuum opacity as a stopgap to mimic this effect. Formally this was achieved by tuning the critical microfield cutoff to a value that minimized the discrepancy among parameters derived from fits to individual Balmer lines. As this was used as a proxy for modified line shapes, it was not taken to suggest anything fundamental about the critical microfield.
Next, Tremblay and Bergeron (2009) used the strict formalism of HM88 for OP to calculate line profiles and include them in model atmospheres. They found that this allowed them to obtain much more consistent inferred parameters for Teff and log g when fitting different sets of Balmer lines in an observed spectrum than when pure VCS profiles with no OP were used for the fits. This approach has become the standard in the field for obtaining stellar parameters from spectroscopic fits.
Finally, even when using the improved model atmospheres of Tremblay and Bergeron (2009), Fuchs (2017) and Tremblay et al. (2010) have found that, for cooler white dwarfs, highly discrepant values of Teff and log g are often derived when individually fitting different lines in the Balmer series in the same star. Whether this problem stems from the simplified treatment of convection in the model atmospheres or from inaccuracies in the line profiles is unclear. Thus, while it is not clear if an improved version of OP would resolve these problems, an incorrect treatment of OP could make such a resolution impossible.
4.4 An Alternate Version of Occupation Probability
While the approach to OP of HM88 is mainly based on the assumption of a uniform electric field, Fisher and Maron (2002, hereafter FM02) assume that the dominant contribution to the local field is due to the nearest neighbor (NN) ion. Since this field increases in the direction of the NN, a given state becomes unbound at a weaker field than in the HM88 formalism. Thus, for a given state n we expect the FM02 value of wn to be less (more dissolved) than that of HM88. A comparison of these two prescriptions is shown in Figure 5. For n ≤ 8, the FM02 wn is less than that of HM88. As an example, the arrows indicate electron densities at which the values of w5 and w6 of the two prescriptions are quite different.
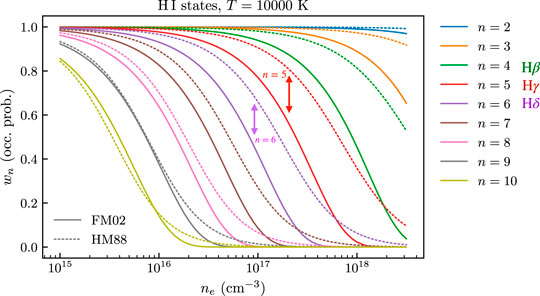
FIGURE 5. The occupation probability of given energy levels n as a function of the electron number density. The solid curves give the OP of the FM02 formalism while the dotted curves are those of the HM88 formalism. For n ≤ 8, the FM02 OP is less than that of HM88.
On the other hand, FM02 have a different interpretation of the meaning of OP than previous authors. While the OP is still the fraction of atoms with level n in which the optical electron is bound to a single nucleus, the atomic states that are eliminated are replaced by “collectivized” states in which the electron is shared among two or more nuclei; these states are still considered to be bound (i.e., negative energy) states. FM02 stress that when states first become “collectivized” that their energies and eigenfunctions (around a single nucleus) will be very similar to their values before collectivization, so these states will still produce spectral features similar to those of the formally bound states. It is only when the NN approaches more closely and the states become “more collectivized” that the spectral features will be significantly altered. Thus, taking the FM02 minimum distance for collectivization as the criterion for destruction of a single-nucleus bound state should lead to an overestimate of the dissolution of spectral features. As such, this value of OP represents a lower bound (i.e., greatest possible dissolution) of a spectral feature in the FM02 formalism. To our knowledge, the FM02 formalism has not been employed in any stellar model atmosphere codes.
4.5 Implementation in Xenomorph
Xenomorph is a simulation-based line profile code developed by T. Gomez (Gomez, 2013; Gomez et al., 2016), and which was recently updated by Cho (2021). While many simulation-based approaches have been made in the literature (e.g., Stamm et al., 1984; Stamm and Smith, 1984; Gigosos and Cardeñoso, 1987; Stambulchik and Maron, 2006; Djurović et al., 2009; Rosato et al., 2020; Tremblay et al., 2020), to our knowledge Xenomorph is the first such code to include a numerical implementation of OP.
For the HM88 formalism, the electric microfield experienced by the radiator needs to be held below the critical value for the given upper level n of the transition. We implement this as follows. When the local microfield first increases to the critical value, the nearest ion that is approaching is located and its radial velocity is reversed. Since it is now receding from the radiator, the magnitude of its contribution to the total field will decrease in subsequent time steps. If the electric field of the radiator continues to increase in the next time step, then the next-nearest ion that is approaching is found and its radial velocity reversed. This procedure is continued until the local microfield begins decreasing in subsequent time steps. As shown in Figure 6, this procedure leads to a sharp cutoff in the microfield distribution (red dashed curve) experienced by the radiating atom.
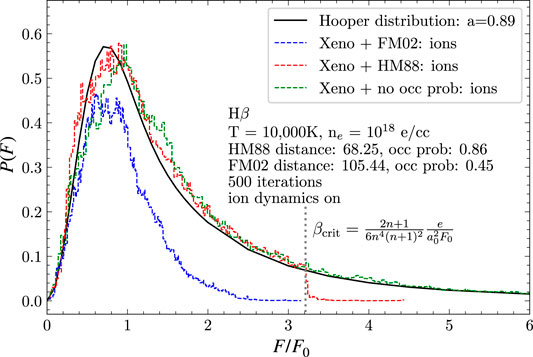
FIGURE 6. The microfield distribution produced by Xenomorph, for different OP prescriptions. For HM88, we see that our prescription for reversing the radial velocities of nearby approaching ions leads to a sharp cutoff at F/F0 ≈ 3.2. We note that the HM88 and FM02 distributions have been normalized to their OP values, 0.86 and 0.45, respectively. Taken from Cho et al. (2022).
For the FM02 formalism, rather than limiting the electric microfield, it is the distance to the nearest ion that needs to be limited. Thus, whenever an ion would take a time step that brings it too close to the radiator, its radial velocity is reversed so that it begins moving away. As mentioned in the previous section, this likely leads to an overestimate on the effect of OP on the spectrum. As such, the naive application of the FM02 formalism provides an upper bound on the importance of OP for these spectra.
In Figure 7 we show a comparison of different OP treatments for the Hβ line. Since the FM02 treatment (blue curve) excludes the largest electric fields, it results in the narrowest profile. Conversely, including all electric field values (“no occ prob”, purple curve) results in the broadest profile. The red “VCS” curve shows the calculations of Vidal et al. (1973) which do not include either ion dynamics or OP, which explains why it is narrower than the “no occ prob” curve, which does include ion dynamics.
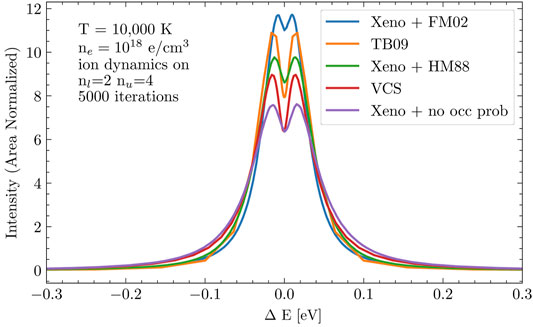
FIGURE 7. A comparison of different OP treatments for the Hβ line. Since the FM02 treatment (blue curve) excludes the largest electric fields, it results in the narrowest profile. Conversely, including all electric field values (“no occ prob”, purple curve) results in the broadest profile. The red “VCS” curve shows the calculations of Vidal et al. (1973) which do not include either ion dynamics or OP, which is why it is narrower than the “no occ prob” curve. Taken from Cho et al. (2022).
5 Future Improvements
In a real plasma, ions and electrons are free to make close approaches to radiating atoms. According to Fisher and Maron (2002), when the nearest ion reaches a critical distance for a given energy state, that state becomes “collectivized” and the electron is shared among two (or more) nuclei. Just like their single-nuclei counterparts, these collectivized states have definite energy, so in LTE their populations would be proportional to their Boltzmann factors. Their eigenfunctions are modified and may more closely resemble those of an
6 Conclusion
Recent studies of white dwarf stars show that systematic offsets exist between spectroscopic parameter determinations and those based on broadband photometry. These large discrepancies (10% in Teff, 0.1 M⊙ in mass) provide scientific motivation for reconsidering the atomic physics employed in the model atmospheres of these stars. As pointed out by Cho (2021) and Cho et al. (2022), two physical effects which have a large effect on the shapes of the calculated line profiles of hydrogen are 1) the distribution of electric fields experienced by the radiating atom, and 2) the prescription used for the occupation probability (OP) of the atomic states. In this article we have examined the assumptions and approaches used when incorporating these effects in line profile and WD atmosphere calculations. Improvements in both treatments offer the promise of a more self-consistent implementation of the physics and improved model atmospheres of WD stars.
Finally, for lines such as Lyα, and at higher densities in general, a quantum treatment of the plasma electrons becomes important. Recently, Gomez et al. (2020) and Gomez et al. (2021) have developed a new approach. While offering a solution to the under-prediction of widths of “isolated-lines” in Li-like ions (e.g., Griem et al., 1997), their approach could also offer key improvements useful in WD model atmospheres. Going forward, a synthesis of approaches may be required to represent the physics with the greatest fidelity, which in turn will allow us to extract the greatest scientific return from the WD stars.
Data Availability Statement
The raw data supporting the conclusion of this article will be made available by the authors, without undue reservation.
Author Contributions
All authors listed have made a substantial, direct, and intellectual contribution to the work and approved it for publication.
Funding
MM, PC, and BD acknowledge support from the Wootton Center for Astrophysical Plasma Properties under the United States Department of Energy cooperative agreement number DE-NA0003843, from the United States Department of Energy grant under DE-SC0010623, and from the National Science Foundation grant under AST 1707419. MM acknowledges support from the NASA ADAP program under grant 80NSSC20K0455. Sandia National Laboratories is a multimission laboratory managed and operated by National Technology and Engineering Solutions of Sandia, LLC., a wholly owned subsidiary of Honeywell International, Inc., for the U.S. Department of Energy’s National Nuclear Security Administration under contract DE-NA-00035 25. PC acknowledges DOE NNSA Laboratory Residency Graduate Fellowship program support, which is provided under cooperative agreement number DE-NA0003960. The work of TG was performed under a Laboratory Directed Research and Development program at Sandia National Laboratories.
Conflict of Interest
The authors declare that the research was conducted in the absence of any commercial or financial relationships that could be construed as a potential conflict of interest.
Publisher’s Note
All claims expressed in this article are solely those of the authors and do not necessarily represent those of their affiliated organizations, or those of the publisher, the editors and the reviewers. Any product that may be evaluated in this article, or claim that may be made by its manufacturer, is not guaranteed or endorsed by the publisher.
Acknowledgments
We thank Taisuke Nagayama and Stephanie Hansen for a critical reading of this manuscript. This paper describes objective technical results and analysis. Any subjective views or opinions that might be expressed in the paper do not necessarily represent the views of the U.S. Department of Energy or the United States Government.
Footnotes
1Using standard models for a 0.6 M⊙ DA WD at Teff = 10, 000 K (Tremblay et al., 2011) and assuming uncorrelated offsets in Teff and stellar mass, this translates into fractional age uncertainties of 24% and 28%, respectively.
2We note that the deBroglie wavelength of the electrons in this regime is much less than the average inter-particle distance, so effects related to electron degeneracy are negligible.
References
Allard, N. F., Kielkopf, J. F., and Loeillet, B. (2004). Temperature Dependence of the Lyman αline Wings in Cool Hydrogen-Rich white dwarf Atmospheres. Application to ZZ Ceti white dwarf Spectra. A&A 424, 347–354. doi:10.1051/0004-6361:20040427
Allard, N. F., Koester, D., Feautrier, N., and Spielfiedel, A. (1994). Free-free Quasi-Molecular Absorption and Satellites in Lyman-Alpha Due to Collisions with H and H+. A&AS 108, 417–431.
Bergeron, P., Dufour, P., Fontaine, G., Coutu, S., Blouin, S., Genest-Beaulieu, C., et al. (2019). On the Measurement of Fundamental Parameters of White Dwarfs in the Gaia Era. ApJ 876, 67. doi:10.3847/1538-4357/ab153a
Bergeron, P., Saffer, R. A., and Liebert, J. (1992). A Spectroscopic Determination of the Mass Distribution of DA white Dwarfs. ApJ 394, 228. doi:10.1086/171575
Bergeron, P. (1993). “Stark Broadening in white dwarf Atmospheres,” in White Dwarfs: Advances in Observation and Theory of NATO Advanced Study Institute (ASI) Series C. Editor M. A. Barstow (Dordrecht: Kluwer), 403, 267–271. doi:10.1007/978-94-011-2020-3_35
Cho, P. B., Gomez, T. A., Montgomery, M. H., Dunlap, B. H., Fitz Axen, M., Hobbs, B., et al. (2022). Simulation of Stark Broadened Hydrogen Balmer Line Shapes for DA White Dwarf Synthetic Spectra. ApJ, in press.
Cho, P. B. (2021). Simulation Stark Broadened Hydrogen Balmer Line Shapes for DA White Dwarf Synthetic Spectra. Master’s thesis. Austin, TX: The University of Texas at Austin.
Dappen, W., Anderson, L., and Mihalas, D. (1987). Statistical Mechanics of Partially Ionized Stellar Plasma - The Planck-Larkin Partition Function, Polarization Shifts, and Simulations of Optical Spectra. ApJ 319, 195. doi:10.1086/165446
Djurović, S., Ćirišan, M., Demura, A. V., Demchenko, G. V., Nikolić, D., Gigosos, M. A., et al. (2009). Measurements of Hβ Stark Central Asymmetry and its Analysis through Standard Theory and Computer Simulations. Phys. Rev. E 79, 046402. doi:10.1103/PhysRevE.79.046402
Eisenstein, D. J., Liebert, J., Harris, H. C., Kleinman, S. J., Nitta, A., Silvestri, N., et al. (2006). A Catalog of Spectroscopically Confirmed White Dwarfs from the Sloan Digital Sky Survey Data Release 4. ApJS 167, 40. doi:10.1086/507110
Fisher, D. V., and Maron, Y. (2002). Effective Statistical Weights of Bound States in Plasmas. Eur. Phys. J. D - At. Mol. Opt. Phys. 18, 93–111. doi:10.1140/e10053-002-0012-9
Fuchs, J. T. (2017). Fundamental Properties of White Dwarfs Alone and in Binaries. Ph.D. thesis. Chapel Hill, NC: The University of North Carolina at Chapel Hill.
Gebauer, R., and v. Traubenberg, H. R. (1930). Über den Starkeffekt dritter Ordnung bei den SerienlinienHβ undHγ des Wasserstoffs. Z. Physik 62, 289–299. doi:10.1007/BF01336693
Genest-Beaulieu, C., and Bergeron, P. (2019). A Photometric and Spectroscopic Investigation of the DB White Dwarf Population Using SDSS and Gaia Data. ApJ 882, 106. doi:10.3847/1538-4357/ab379e
Gianninas, A., Bergeron, P., and Fontaine, G. (2006). Mapping the ZZ Ceti Instability Strip: Discovery of Six New Pulsators. Astron. J. 132, 831–835. doi:10.1086/506516
Gigosos, M. A., and Cardenoso, V. (1987). Study of the Effects of Ion Dynamics on Stark Profiles of Balmer-α and -β Lines Using Simulation Techniques. J. Phys. B: Mol. Phys. 20, 6005–6019. doi:10.1088/0022-3700/20/22/013
Gigosos, M. A., González-Herrero, D., Lara, N., Florido, R., Calisti, A., Ferri, S., et al. (2018). Classical Molecular Dynamics Simulations of Hydrogen Plasmas and Development of an Analytical Statistical Model for Computational Validity Assessment. Phys. Rev. E 98, 033307. doi:10.1103/PhysRevE.98.033307
Gomez, T. A. (2013). Examining Line Broadening Approximations Using Xenomorph: A Simulation Line Broadening Program. Master’s thesis. Austin: The University of Texas at Austin.
Gomez, T. A., Nagayama, T., Cho, P. B., Zammit, M. C., Fontes, C. J., Kilcrease, D. P., et al. (2021). All-order Full-Coulomb Quantum Spectral Line-Shape Calculations. Phys. Rev. Lett. 127, 235001. doi:10.1103/PhysRevLett.127.235001
Gomez, T. A., Nagayama, T., Fontes, C. J., Kilcrease, D. P., Hansen, S. B., Zammit, M. C., et al. (2020). Effect of Electron Capture on Spectral Line Broadening in Hot Dense Plasmas. Phys. Rev. Lett. 124, 055003. doi:10.1103/PhysRevLett.124.055003
Gomez, T. A., Nagayama, T., Kilcrease, D. P., Montgomery, M. H., and Winget, D. E. (2018). Density-matrix Correlations in the Relaxation Theory of Electron Broadening. Phys. Rev. A. 98, 012505. doi:10.1103/PhysRevA.98.012505
Gomez, T. A., Nagayama, T., Kilcrease, D. P., Montgomery, M. H., and Winget, D. E. (2016). Effect of Higher-Order Multipole Moments on the Stark Line Shape. Phys. Rev. A. 94, 022501. doi:10.1103/PhysRevA.94.022501
Griem, H. R., Kolb, A. C., and Shen, K. Y. (1959). Stark Broadening of Hydrogen Lines in a Plasma. Phys. Rev. 116, 4–16. doi:10.1103/PhysRev.116.4
Griem, H. R., Ralchenko, Y. V., and Bray, I. (1997). Stark Broadening of the B III2s−2plines. Phys. Rev. E 56, 7186–7192. doi:10.1103/PhysRevE.56.7186
Hooper, C. F. (1966). Electric Microfield Distributions in Plasmas. Phys. Rev. 149, 77–91. doi:10.1103/PhysRev.149.77
Hooper, C. F. (1968). Low-Frequency Component Electric Microfield Distributions in Plasmas. Phys. Rev. 165, 215–222. doi:10.1103/PhysRev.165.215
Hubeny, I., Hummer, D. G., and Lanz, T. (1994). NLTE Model Stellar Atmospheres with Line Blanketing Near the Series Limits. A&A 282, 151.
Hummer, D. G., and Mihalas, D. (1988). The Equation of State for Stellar Envelopes. I - an Occupation Probability Formalism for the Truncation of Internal Partition Functions. ApJ 331, 794. doi:10.1086/166600
Iglesias, C. A., Lebowitz, J. L., and MacGowan, D. (1983). Electric Microfield Distributions in Strongly Coupled Plasmas. Phys. Rev. A. 28, 1667–1672. doi:10.1103/PhysRevA.28.1667
Iglesias, C. A., Rogers, F. J., Shepherd, R., Bar-Shalom, A., Murillo, M. S., Kilcrease, D. P., et al. (2000). Fast Electric Microfield Distribution Calculations in Extreme Matter Conditions. J. Quant. Spec. Radiat. Transf. 65, 303–315. doi:10.1016/S0022-4073(99)00076-X
Inglis, D. R., and Teller, E. (1939). Ionic Depression of Series Limits in Cne-Electron Spectra. ApJ 90, 439. doi:10.1086/144118
Kepler, S. O., Kleinman, S. J., Nitta, A., Koester, D., Castanheira, B. G., Giovannini, O., et al. (2007). White dwarf Mass Distribution in the SDSS. MNRAS 375, 1315. doi:10.1111/j.1365-2966.2006.11388.x
Lemke, M. (1997). Extended VCS Stark Broadening Tables for Hydrogen - Lyman to Brackett Series. Astron. Astrophys. Suppl. Ser. 122, 285–292. doi:10.1051/aas:1997134
Liebert, J., Bergeron, P., and Holberg, J. B. (2005). The Formation Rate and Mass and Luminosity Functions of DA White Dwarfs from the Palomar Green Survey. Astrophys J. Suppl. S 156, 47–68. doi:10.1086/425738
Nayfonov, A., Dappen, W., Hummer, D. G., and Mihalas, D. (1999). The MHD Equation of State with Post‐Holtsmark Microfield Distributions. ApJ 526, 451–464. doi:10.1086/307972
Rausch v. Traubenberg, H., Gebauer, R., and Lewin, G. (1930). Über die Existenzgrenzen von Anregungszuständen des Wasserstoffatoms in starken elektrischen Feldern. Naturwissenschaften 18, 417–418. doi:10.1007/BF01501125
Rosato, J., Marandet, Y., and Stamm, R. (2020). Quantifying the Statistical Noise in Computer Simulations of Stark Broadening. J. Quantitative Spectrosc. Radiative Transfer 249, 107002. doi:10.1016/j.jqsrt.2020.107002
Seaton, M. J. (1990). Atomic Data for Opacity Calculations. XIII. Line Profiles for Transitions in Hydrogenic Ions. J. Phys. B: Mol. Opt. Phys. 23, 3255–3296. doi:10.1088/0953-4075/23/19/012
Stambulchik, E., Fisher, D. V., Maron, Y., Griem, H. R., and Alexiou, S. (2007). Correlation Effects and Their Influence on Line Broadening in Plasmas: Application to Hα. High Energ. Density Phys. 3, 272–277. doi:10.1016/j.hedp.2007.02.021
Stambulchik, E., and Maron, Y. (2006). A Study of Ion-Dynamics and Correlation Effects for Spectral Line Broadening in Plasma: K-Shell Lines. J. Quantitative Spectrosc. Radiative Transfer 99, 730–749. doi:10.1016/j.jqsrt.2005.05.058
Stamm, R., and Smith, E. W. (1984). Computer Simulation Technique for Plasmas. Phys. Rev. A. 30, 450–453. doi:10.1103/physreva.30.450
Stamm, R., Smith, E. W., and Talin, B. (1984). Study of Hydrogen Stark Profiles by Means of Computer Simulation. Phys. Rev. A. 30, 2039–2046. doi:10.1103/PhysRevA.30.2039
Tremblay, P.-E., Bergeron, P., Kalirai, J. S., and Gianninas, A. (2010). New Insights into the Problem of the Surface Gravity Distribution of Cool DA White Dwarfs. ApJ 712, 1345–1358. doi:10.1088/0004-637X/712/2/1345
Tremblay, P.-E., and Bergeron, P. (2009). Spectroscopic Analysis of DA White Dwarfs: Stark Broadening of Hydrogen Lines Including Nonideal Effects. ApJ 696, 1755–1770. doi:10.1088/0004-637X/696/2/1755
Tremblay, P., Beauchamp, A., and Bergeron, P. (2020). New Calculations of Stark-Broadened Profiles for Neutral Helium Lines Using Computer Simulations. ApJ 901, 104. doi:10.3847/1538-4357/abb0e5
Unsöld, A. (1948). Zur Berechnung der Zustandsummen für Atome und Ionen in einem teilweise ionisierten Gas. Mit 2 Textabbildungen. ZAp 24, 355.
Vidal, C. R., Cooper, J., and Smith, E. W. (1973). Hydrogen Stark-Broadening Tables. ApJS 25, 37. doi:10.1086/190264
von Traubenberg, H. R., and Gebauer, R. (1929). Über den Starkeffekt II. Ordnung bei der Balmerserie des Wasserstoffs. Z. Physik 54, 307–320. doi:10.1007/BF01375454
Wiese, W. L., Kelleher, D. E., and Paquette, D. R. (1972). Detailed Study of the Stark Broadening of Balmer Lines in a High-Density Plasma. Phys. Rev. A. 6, 1132–1153. doi:10.1103/PhysRevA.6.1132
Keywords: white dwafts, collisional broadening, spectrosccopy, DA stars, stellar atmosphere models
Citation: Montgomery MH, Dunlap BH, Cho PB and Gomez TA (2022) Hydrogen Line Shape Uncertainties in White Dwarf Model Atmospheres. Front. Astron. Space Sci. 9:830163. doi: 10.3389/fspas.2022.830163
Received: 06 December 2021; Accepted: 11 January 2022;
Published: 17 February 2022.
Edited by:
Santiago Torres, Universitat Politecnica de Catalunya, SpainReviewed by:
Milan S. Dimitrijevic, Astronomical Observatory, SerbiaScilla Degl'Innocenti, University of Pisa, Italy
Copyright © 2022 Montgomery, Dunlap, Cho and Gomez. This is an open-access article distributed under the terms of the Creative Commons Attribution License (CC BY). The use, distribution or reproduction in other forums is permitted, provided the original author(s) and the copyright owner(s) are credited and that the original publication in this journal is cited, in accordance with accepted academic practice. No use, distribution or reproduction is permitted which does not comply with these terms.
*Correspondence: M. H. Montgomery, mikemon@astro.as.utexas.edu