 Sarbani Basu
 Saskia Hekker
94% of researchers rate our articles as excellent or good
Learn more about the work of our research integrity team to safeguard the quality of each article we publish.
Find out more
REVIEW article
Front. Astron. Space Sci. , 04 August 2020
Sec. Stellar and Solar Physics
Volume 7 - 2020 | https://doi.org/10.3389/fspas.2020.00044
This article is part of the Research Topic Asteroseismology in the Kepler Era View all 11 articles
The Kepler mission observed many thousands of red giants. The long time series, some as long as the mission itself, have allowed us to study red giants with unprecedented detail. Given that red giants are intrinsically luminous, and hence can be observed from very large distances, knowing the properties of red giants, in particular ages, is of immense value for studies of the formation and evolution of the Galaxy, an endeavor known as “Galactic archaeology.” In this article we review what we have learned about red giants using asteroseismic data. We start with the properties of the power spectrum and move on to internal structure and dynamics of these stars; we also touch upon unsolved issues in red-giant asteroseismology and the prospects of making further progress in understanding these stars.
Red-giant stars mark that stage of stellar evolution when a star has exhausted its central hydrogen, fusion occurs in a very thin shell around an inert helium core, and the envelope is cool enough that the convection zone encompasses most of the star making the stars almost fully convective (see, e.g., Salaris and Cassisi, 2005; Kippenhahn et al., 2012, etc.). Being almost fully convective, the stars are constrained to take an almost vertical path on the Hertzsprung-Russell (HR) diagram (see Figure 1). Along the red-giant branch (RGB) the stars exhibit a very narrow range of temperatures. The stars follow the vertical path, briefly disrupted by a short phase in which the star decreases its luminosity, i.e., the RGB bump, until the onset of helium fusion in the core. For stars with masses below about 2 M⊙ at the tip of the RGB the onset of helium fusion occurs in degenerate conditions. This is a fast process referred to as the helium-flash. For higher-mass stars, the onset of helium burning occurs in non-degenerate conditions. After the onset of helium burning in the core, the star reduces in luminosity and radius, and has a slightly higher temperature. High-metallicity low-mass stars in this stage settle into the red clump and higher-mass stars form the so-called secondary clump; low-metallicity stars form the horizontal branch. While these stars are fascinating on their own accord, their high luminosities make them visible from large distances, and thus useful tools in studying the Galaxy.
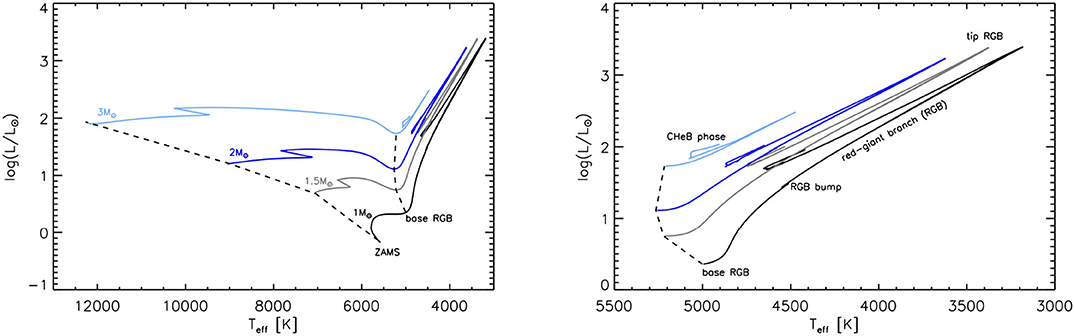
Figure 1. Left: HR Diagram with four evolutionary tracks of models of masses 1.0, 1.5, 2.0 and 3.0 M⊙ in black, gray, blue, and light blue, respectively. The tracks are shown from the zero age main sequence (ZAMS) through the red-giant branch (RGB) and the core helium burning (CHeB) phase until the helium core mass fraction drops below 10−3. Right: The same tracks as in the left panel now starting from the base of the red-giant branch. The models were computed using MESA (Paxton et al., 2019, and references therein) version r-10398 and solar metallicity. See Appendix A for the inlist of the MESA computations.
Stellar oscillation frequencies can be derived from radial velocity measurements, [e.g., from the Stellar Oscillation Network Group; Grundahl et al. (2007)], as well as photometry from space with missions like CoRot (Baglin et al., 2006) and Kepler (Borucki et al., 2010) The recent Kepler space mission provided long (~4 years) of near-uninterrupted high-precision high-cadence photometric timeseries data. These data are of unprecedented quality and frequency resolution, and are a treasure trove for red-giant asteroseismology. This has led to many ground-breaking results published over the last decade. These include the detection of g-mode period spacings (Beck et al., 2011), the discovery that g-mode spacings can be used to distinguish inert-helium core red giants from core helium burning giants (Bedding et al., 2011; Mosser et al., 2011), the unequivocal detection of core rotation (Beck et al., 2012b), that red giant cores might actually slow down rather than spin up as they contract (Mosser et al., 2012b; Gehan et al., 2018), that precise estimates of red-giant surface gravities can be derived from the contribution that granulation makes to the photometric time series (Kallinger et al., 2016), etc. These data have also resulted in catalogs of stellar properties (Pinsonneault et al., 2014, 2018; Yu et al., 2018, etc.) that are proving invaluable to the study of Galactic archaeology. Many such results are also highlighted in recent reviews by Hekker (2013), Mosser et al. (2016), and Hekker and Christensen-Dalsgaard (2017). In this review, we focus on the properties of the power spectra of red-giant stars and how they can be interpreted in terms of their structure and dynamics.
Red-giant stars are solar-like oscillators, i.e., their oscillations are stochastically excited and damped by near-surface turbulent convection (see e.g., Goldreich and Keeley, 1977a,b; Balmforth, 1992). Unlike classical pulsators, many oscillation modes are excited, however the amplitudes of the modes are small. The frequencies of the modes are determined by the internal structure of the star, which makes asteroseismic inferences on stellar structure possible. Spherical harmonics are used to describe the angular dependence of the modes, with the degree l being the number of nodal planes intersecting the surface, and the azimuthal order m the number of nodes along the equator. In the radial direction, the models are described by the radial order n, which is the number of nodes in the radial direction. Conventionally, acoustic modes are denoted by positive values of n and while gravity modes, i.e., modes with buoyancy as restoring force, are denoted by negative values of n. The azimuthal order comes into play only if rotation or magnetic fields (or both) break spherical symmetry. In the absence of these symmetry-breaking factors, there is a single mode with a given (l, n); rotation “splits” the modes into 2l + 1 components labeled by m. For stars other than the Sun only low-degree oscillations can be observed due to cancellation effects that are a result of observing stars as point sources. Typically one observes radial (l = 0), dipole (l = 1) and quadrupole (l = 2) modes, though sometimes octupole (l = 3) modes can be detected as well. More details about the characteristics of oscillation frequencies and how they are related to internal structure and dynamic are described in textbooks such as Unno et al. (1989) and Aerts et al. (2010). Whether, and how many, rotationally split modes are observed depends on the inclination angle of the star (Gizon and Solanki, 2003) assuming of course, that the frequency resolution is good enough. These rotationally split modes provide insight in the rotation rate from the size of the splitting and on the inclination angle from the relative amplitudes of the split components.
We show a power spectrum of a typical red giant in Figure 2. The power density spectrum of red-giant stars, as well as other solar-like oscillations such as low-mass main-sequence stars and subgiants, is dominated by granulation –the observable part of the near-surface turbulent convection– as a frequency-dependent signal and is commonly modeled as red noise. The power spectrum is modulated by a broad bell-shaped envelope whose maximum is at a frequency often called νmax, the frequency of maximum oscillation power. The value of νmax provides a direct rough indication of the size of the star, i.e., it takes longer for the waves to travel through a larger star and hence stars with larger radii have oscillations occurring at lower values of νmax. Brown et al. (1991) and Kjeldsen and Bedding (1995) argued that νmax∝νac, where νac is the acoustic cutoff frequency i.e., the frequency beyond which acoustic modes are no longer trapped in the star and behave as traveling waves. Under the assumption of an isothermal atmosphere, one can show that νac is proportional to , where g, M, R, Teff are surface gravity, mass, radius and effective temperature, respectively. Both the shape of the envelope and the value of νmax are determined by the excitation and damping of the oscillation modes. There is as yet no theoretical understanding as to why νmax is proportional to νac.
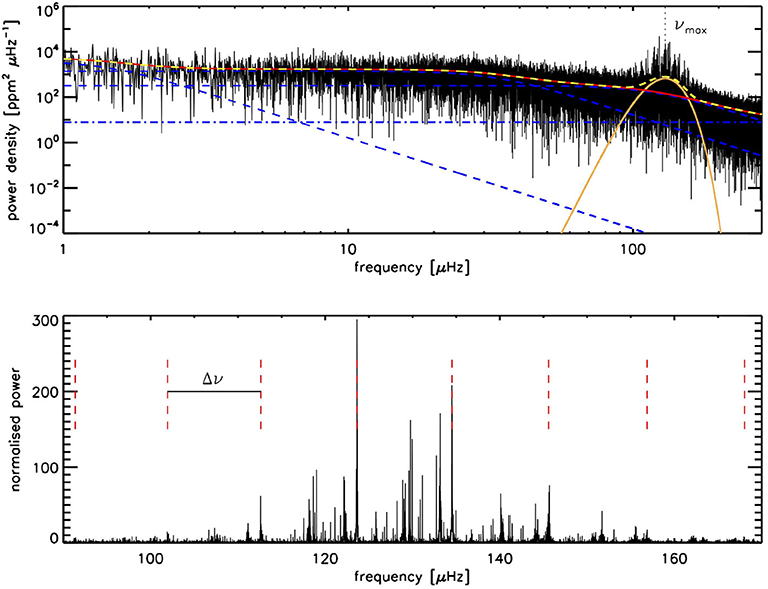
Figure 2. Top: Power density spectrum of KIC 6144777 with the data shown in black. The granulation components are indicated with blue dashed lines and the white noise with the blue dashed-dotted line. The sum of the granulation components and noise comprise the background fit, which is shown with the red solid line. The Gaussian fit to the power excess is shown in orange with the frequency of maximum oscillation power (νmax) indicated by the vertical dotted line. The complete fit (background + oscillation power excess) is shown with the yellow dashed line. Bottom: The power spectrum after the background correction. The regular pattern of radial modes is indicated with the vertical red dashed lines. The distance in frequency between these lines is the large frequency separation Δν.
Another property of the power spectra of solar-like oscillators is the picket-fence, or comb-like, pattern of low degree modes. The modes of a given degree l and consecutive radial orders n are approximately equidistant in frequency, and the separation is called the large frequency separation, Δν. Ulrich (1986) and Christensen-Dalsgaard (1988) showed that the large frequency separation scales approximately with the square root of the mean density () of the star: . The expression is not exact and has well-known deviations that are a function of temperature (White et al., 2011), metallicity (Guggenberger et al., 2016) and at the red-giant end the deviation also depends on mass (Guggenberger et al., 2017). For an extensive overview of ways to mitigate these deviations see Hekker (2020) and references therein. However, despite these deviations, the Δν scaling relation, along with the relation for νmax, have been very useful in getting initial mass and radius estimates of all types of stars (Chaplin et al., 2010; Pinsonneault et al., 2014, 2018). As shown by Ong and Basu (2019a), we now understand why these deviations occur, and have derived ways of calculating Δν for models that give much better approximations to Δν, without resorting to calculating the frequencies.
Solar-like oscillation modes can be divided into acoustic modes (i.e., sound waves with pressure as the restoring force) or gravity modes (with buoyancy as the restoring force). The acoustic modes are the ones that are equidistant in frequency and separated by Δν; gravity modes on the other hand are equidistant in period. Whether a mode is acoustic or gravity depends on two frequencies: the Lamb frequency Sl which depends on the sound-speed profile of the star as well as the degree of a mode; and the buoyancy or Brunt-Väisälä frequency N that is related to the convective stability criterion and is imaginary in convection zones. Acoustic modes have frequency ω such that and ω2>N2, and gravity modes occur in the region where ω2<N2 and . For main-sequence solar-like oscillators, the acoustic modes and gravity modes are trapped in well-separated regions of a star and the observed modes are purely acoustic modes. However, in evolved solar-like oscillators the non-radial (l > 0) oscillation modes are not necessarily pure acoustic modes. As a star evolves, the density of the core increases leading to an increase of the buoyancy frequency values, while at the same time the outer layers of the star expand leading to a decrease of νmax. This can result in a coupling of the acoustic and gravity mode cavities. In Figure 3, we show a so-called “propagation diagram” for red-giant models. This diagram shows the Lamb frequency for l = 1 and l = 2 modes along with the buoyancy frequency. We can see that around νmax for these models, the radial distance between the cavity for acoustic l = 1 modes and for gravity modes is small, allowing g modes (gravity modes) to couple with p modes (acoustic modes). The “mixed” modes have gravity-mode characteristics in the deep interior, and acoustic mode characteristics in the outer layers. In red giants, multiple g modes can couple with a single p mode leading to multiple mixed modes per acoustic radial order. The presence of mixed modes causes multiple peaks for a given l = 1 p mode. We show this in Figure 4. The mixed modes of degree l = 1 (dipole modes) are most evident in red-giant power spectra. Coupling is weaker for the l = 2 (quadrupole) modes because of the larger evanescent zone between the Lamb and Brunt-Väisälä frequency (see Figure 3), as a result only the most p-dominated quadrupole modes are observed easily. Additionally, the l = 2 g-dominated modes would be harder to resolve since the frequency differences between the more p-dominated and the neighboring g-dominated modes is often unresolved given the frequency resolution and width of the modes. More about the nature of the modes can be found in Unno et al. (1989); Aerts et al. (2010), etc.
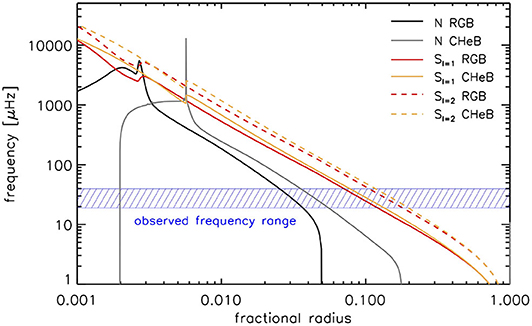
Figure 3. Propagation diagram of a 1 M⊙ model of an ascending the red-giant branch (RGB) star and a core helium burning (CHeB) star on the same evolutionary track. For the RGB model, the Brunt-Väisälä frequency N is shown in black and the Lamb frequency S for dipole (l = 1) and quadrupole (l = 2) modes are shown with the red solid and dashed line, respectively. The Brunt-Väisälä frequency and Lamb frequencies for the core helium burning (CHeB) model are indicated in gray and orange. The region around the νmax value of both models is indicated by the horizontal blue bar.
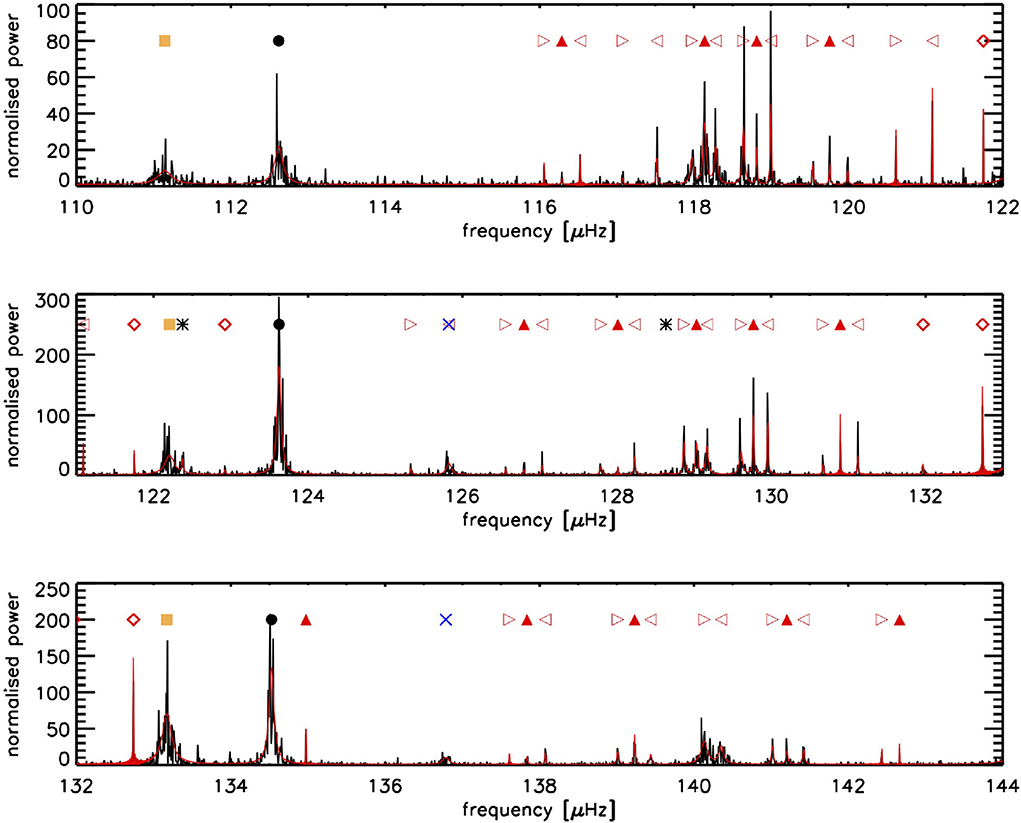
Figure 4. A close look into the region of the three radial orders closest to νmax in the power density spectrum of KIC 6144777. Each row focuses on one radial mode and the adjacent l = 1 and l = 2 modes. The fit to the data as computed with TACO (Hekker et al., in prep) is indicated in red. The radial, dipole, quadrupole and octupole modes are indicated with black dots, red triangles, orange squares and blue crosses, respectively. Note that there are multiple dipole modes associated with each radial mode—these are the mixed modes. Additionally, the dipole modes show rotational splitting, where the m = −1 and m = +1 modes are indicated with right and left pointing open triangles respectively. Dipole modes for which the azimuthal order could not (yet) be identified are indicated with red diamonds. Modes for which no identification could be obtained are indicated with black asterisks.
The mixed dipole modes appear at frequencies that are equidistant in period (ΔΠ) as dictated by the gravity-part of the mode, modulated by the strength of the coupling to the pressure part of the mode (e.g., Mosser et al., 2012c). In other words, close to the nominal pressure mode the coupling is strongest and the observed period spacing deviates from the underlying period spacing of the gravity part of the mode, while further away from the nominal pressure mode the period spacing approaches the underlying value. This underlying period spacing acts as a direct probe of the core of red-giant stars.
In reality, mode-frequencies do not follow a strict separation in frequency (or period for g modes), i.e., the frequency/period separation between adjacent modes differs from the average value of Δν or ΔΠ, although these deviations are small. These deviations are a result of the fact that stars are not homogeneous balls of gas, but are stratified, and this leaves a “curvature” in the frequency spacings that is easily seen in an échelle diagram of the frequencies (see Figure 5). Abrupt changes, so-called glitches, leave an oscillatory pattern in the frequency separations, and the deeper inside the star the location of the glitch occurs, the shorter the wavelength of the pattern (Gough, 1990). The base of the convection zone, and the helium second ionization zone are places where an acoustic glitch occurs. In evolved stars, the hydrogen-burning shell can leave a glitch in the buoyancy frequency which affects period spacings. These glitches provide a direct probe of the location and nature of the change in the stellar structure. We refer reader to Basu and Chaplin (2017) for details on the behavior of acoustic, gravity and mixed modes in different types of solar oscillators, as well as the effect of glitches and how they may be used to study stellar structure.
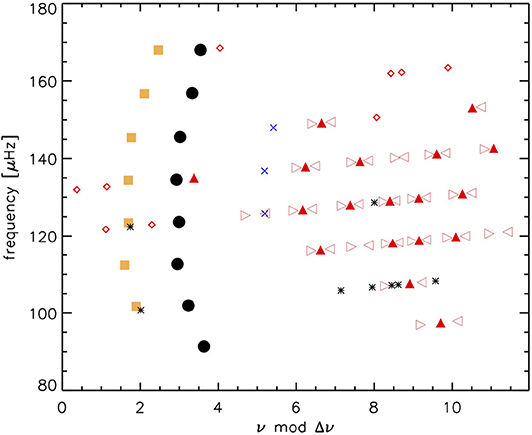
Figure 5. The échelle diagram of the modes of KIC 6144777. As in Figure 4, the black dots are radial modes, the red symbols are dipole modes with the m = 0 indicated by filled triangles, while the m = −1 and m = +1 modes are indicated with right and left pointing open triangles, respectively, the dipole modes with unidentified azimuthal orders are indicated with red diamonds. The orange squares are quadrupole modes and the blue crosses the octupole (l = 3) modes. Modes that could not be identified are indicated by black asterisks. Note that the radial modes line up vertically, but not perfectly, and there is a curvature (see text for more details).
One of the important results obtained with Kepler data was the realization that asteroseismic data can be used to differentiate RGB stars from core-helium burning red-clump stars. Red-clump stars are important because they are standard candles since their luminosity depends very weakly on mass and metallicity (Girardi, 2016). These stars can be used as distance tracers out to ~10 Kpc (e.g., Bovy et al., 2014; Mathur et al., 2016; Ting et al., 2018). Currently, the Gaia mission is providing parallaxes for billions of stars, however, beyond about 3 Kpc Gaia uncertainties can become larger than those provided by standard candles such as red-clump stars (e.g., Mints and Hekker, 2018). In fact red-clump stars have revealed zero-point errors in Gaia data and have aided in showing how these errors can be corrected (Davies et al., 2017; Khan et al., 2019). However, because red-clump stars occur in a Teff and logg range where ascending branch red-giant stars are also found, it is almost impossible to pick them out among field red giants; in clusters on the other hand, the over-density of points in the color-magnitude diagram (CMD) at the characteristic logg facilitates detection.
Bedding et al. (2011) showed that asteroseismic data can distinguish between the two types of giants, and the key discriminant is the period spacing of the dipole model in the two types of stars (see Figure 6) with red-clump stars having higher period spacings than red giants. Secondary clump stars, i.e., stars massive enough to initiate helium burning before their cores become degenerate have intermediate values. It is actually quite easy to understand the result, and in fact, it should have been anticipated. Asymptotically, the period spacing (ΔΠ0) of the g-mode oscillations can be expressed as , where r1 and r2 are the boundaries of the radiative zone; for modes of a given l, the spacing (ΔΠl) is then (Aizenman et al., 1977; Tassoul, 1980). The key to understand the difference in ΔΠ1 for RGB and CHeB stars is in the integral over the buoyancy frequency. As can be seen in Figure 3, the core convection zone in RC stars means that the integral is smaller, and hence ΔΠ is larger. The utility of the period spacing has led to the development of automated methods of determining ΔΠ values (e.g., Vrard et al., 2016) and from that the evolutionary phases of observed red-giant stars.
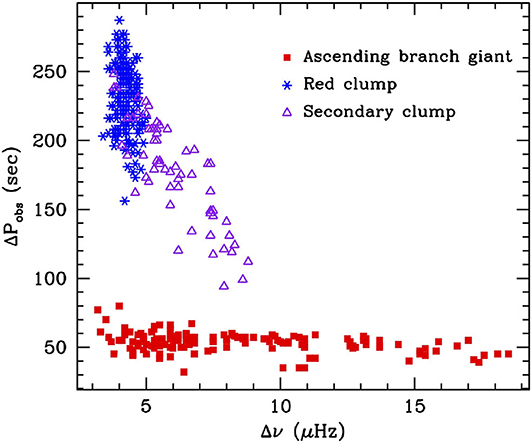
Figure 6. Observed mixed-mode spacings for a sample of red giants observed by Kepler. Data are from Bedding et al. (2011).
Deriving a reliable value of ΔΠ requires a power spectrum that has a reasonably high signal-to-noise, which is not always the case. Kallinger et al. (2012) showed that the asteroseismic phase function ϵ can help. Asymptotically, frequencies follow the relation ν≃Δν(n + l/2+ϵ), where ϵ is the “phase function.” The phase function can be a function of frequency (due to the curvature mentioned earlier), though the value of ϵ around νmax can be defined in a straight forward manner. Kallinger et al. (2012) showed that in a plot of ϵ against Δν or νmax, red-clump stars stand out. There has been some attempts to explain why the phase function behaves different in red-clump stars. Christensen-Dalsgaard et al. (2014) showed that the differences between the phase functions of red-giant and red-clump stars arise from differences in the thermodynamic state of their convective envelopes. Ong and Basu (2019b) subsequently showed that this sensitivity to evolutionary stage arises from differences in the local frequency derivative of the underlying phase function which has a large contribution from the interior of the star too, and as a result this can be used to classify other types of stars as well; interestingly all the RGBs follow a much more well-defined sequence than stars in other states of evolution (Figure 7).
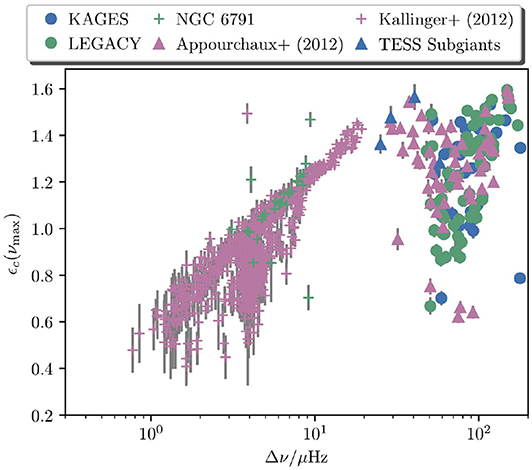
Figure 7. The asteroseismic phase function ϵ at νmax as a function of Δν for stars observed with Kepler. The pink crosses are RGB and RC stars from Kallinger et al. (2012), with the red-clump stars forming a distinct group around a Δν of 4 μHz. KAGES refers to the exoplanet-host sample of Davies et al. (2016) and Silva Aguirre et al. (2015), and LEGACY to the sample of main-sequence stars in Lund et al. (2017) and Silva Aguirre et al. (2017). Appourchaux et al. (2012) has a mix of main-sequence and subgiant stars. NGC 6791 refers to the sample analyzed by McKeever et al. (2019), and “TESS subgiants” are a set of sungiants in the TESS southern continuous viewing zone that show clear oscillations. Image courtesy of Joel Ong.
The importance of red-clump stars to Galactic archaeology has led to the development of a number of automated pipelines that look at different seismic properties in order to classify the stars. These include using a method that uses the measured period spacings (Mosser et al., 2014, 2015), the morphology of the power spectrum (Elsworth et al., 2017), a grid-based method using the ratio Δν/νmax (Hekker et al., 2017), use of the phase factor ϵ (Kallinger et al., 2012), as well as some machine learning based methods based on the power spectrum (Hon et al., 2018), and based directly on the timeseries data (Kuszlewicz et al. in press). None of the techniques is perfect, and a comparison of some of the methods can be found in Elsworth et al. (2019), where the consensus evolutionary stage of the sample of red giants in Pinsonneault et al. (2018) has been presented.
Most of the asteroseismic characterization of red giants that has been done thus far has involved determining the global properties of the stars—surface gravity, masses, radii, and ages—with the ultimate aim of using these to study the chemo-dynamical evolution of the Galaxy. Pinsonneault et al. (2014, 2018) released a catalog of red-giant properties based on asteroseismic data combined with spectroscopy. The uncertainties in the asteroseismic parameters were low enough that the red-clump stood out clearly in a Kiel diagram (see Figure 8). These have been used extensively in studying the evolution of the Galaxy (see, e,g, Nidever et al., 2014; Valentini et al., 2019; Lian et al., 2020; Spitoni et al., 2020, etc.), and have also been used as training sets to for machine-learning based methods of deriving red-giant properties from spectra alone (e.g., Martig et al., 2016). The stellar properties derived in Pinsonneault et al. (2014) were determined from Δν, νmax, Teff and metallicity by searching among pre-computed grids of models. A different approach was taken by Pinsonneault et al. (2018); in this paper masses and radii were determined using the scaling relations for νmax and Δν, after correcting the Δν scaling relation empirically using asteroseismic data of stars in clusters. This work was prompted in part by the result that the use of scaling relations yield masses for halo stars that are well above reasonable values for old stellar populations (Epstein et al., 2014). One of the interesting discoveries made with such analyses is that there are high-mass stars that have a high [α/Fe] ratio (Chiappini et al., 2015; Martig et al., 2015). This is interesting because a high [α/Fe] ratio has been believed to be a hallmark of old, and hence, low-mass stars. Hekker and Johnson (2019) and references therein proposed that the origin of these “α-rich young” stars are main sequence merger remnants.
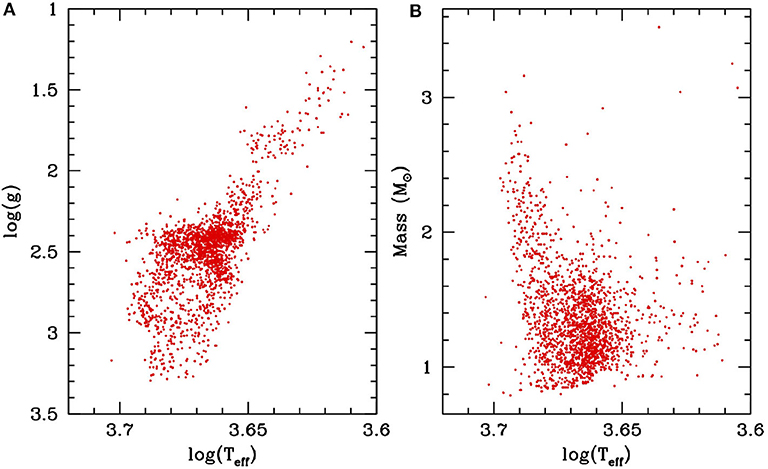
Figure 8. Asteroseismically derived surface gravity (A) and mass (B) of the sample of red giants in Pinsonneault et al. (2014). The over-density of points in (A) around logg ~ 2.5 is caused by the presence of red-clump stars. There is a corresponding over-density in masses, though here the overdensity is confined to low masses; higher-mass stars do not form red-clump stars.
Global asteroseismic parameters are not sufficient to determine the internal structure of red giants. Information about the structure is however, imprinted on the individual oscillations. While there have been concerted efforts in modeling the individual frequencies of main-sequence stars (e.g., Silva Aguirre et al., 2015, 2017), there have been few such efforts in the case of red giants (e.g., Li et al., 2018), even though there are thousands of red giants with high-signal-to-noise oscillation power spectra. One of the main reasons is that the extraction of this wealth of information present in the data has caused difficulties that have been slow to overcome. Some codes have now been developed to extract and identify these modes (e.g., Corsaro and De Ridder, 2014; Garćıa Saravia Ortiz de Montellano et al., 2018; Kallinger, 2019; Hekker et al., in prep.). Another main reason for the lack of results based on individual frequencies is the incredibly complicated frequency structure with all the mixed modes. The frequencies of mixed modes depend on details of the buoyancy-frequency profile, which in turn depends on uncertain internal processes such as convective overshoot and mixing; this is a challenge in modeling. Fortunately, the uncertainties of the modeling outcome will be reduced by accurate data on mixed modes.
A more practical challenge in modeling the frequencies of red giants is the issue of the so-called “surface term.” The surface term is a frequency-dependent frequency offset between models and stars caused by our inability to model the near-surface layers of a star properly, the main culprit being the approximations used to model convection. The way this is taken care of in main-sequence stars is to subtract out a slowly varying function of frequency from the models. There are many ways of doing this (see e.g., Kjeldsen et al., 2008; Ball and Gizon, 2014; Sonoi et al., 2015, etc.), though currently the most popular model is that of Ball and Gizon (2014), who, based on work by Gough (1990) claimed that the surface term produces a frequency difference that can be expressed as
where δνnl is the difference in frequency νnl for a mode of degree l and order n between a star and its model, Inl is the inertia of the mode, and νac is the acoustic cut-off frequency. The coefficients a and b can be determined through a generalized linear least-squares fit. This form appears to work quite well for main-sequence stars and subgiants, and even for radial modes of red giants (Schmitt and Basu, 2015; Ball et al., 2018). However, the l = 1 modes of red giants pose a challenge. Mixed modes, particularly the g-dominated ones, have large inertia and hence the surface effect is small, as a result they do not change much when a surface-term correction is applied. Consequently the usual surface-effect corrections can be large enough to put the non-radial mixed modes in red giants out of order, which is unphysical (see Ball et al., 2018, and Figure 9). Ball et al. (2018) proposed a method to modify the structure of the models to suppress g modes in the cores of stellar models, so that they have only pure p modes on which to apply the surface-term correction. The authors showed that this did work for three double-lined eclipsing binaries, KIC 8410637, KIC 9540226, and KIC 5640750. Note that suppressing the g modes means that information from the core is neglected, but this provides a possible way to begin exploiting the data, and allows us to determine the mass and age of the star quite precisely. There are efforts under way (Ong and Basu, 2020) of calculating pure p- and g-mode frequencies of stars without resorting to modifying the structure of the models. There are also efforts underway to determine red-giant surface-term corrections from simulations of stellar convection (see e.g., Jørgensen et al., 2020).
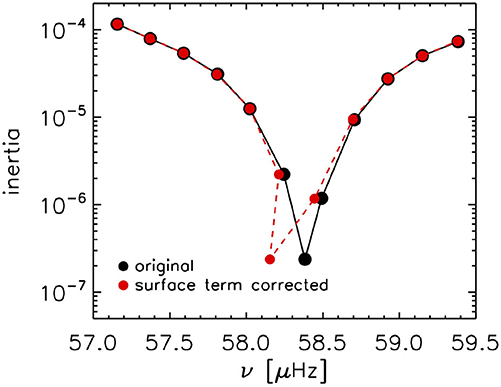
Figure 9. The effects of the Ball and Gizon (2014) surface-term correction on l = 1 modes of red-giant models. Note that the most p-dominated mode shifts enough to confuse its frequency with the more g-dominated mode at lower frequency. Data are from Ball et al. (2018).
Masses and ages of red giants can be determined quite precisely from their radial and quadrupole modes, where the surface term behaves well. This was exploited by McKeever et al. (2019) to determine the age and initial helium abundance of the cluster NGC 6791 using cluster red giants. NGC 6791 is a rather strange cluster—it is old, and yet very metal rich. Although the ages, or for that matter the helium abundance, of individual stars could not be determined to a high precision, using the fact that all cluster stars have the same age and initial metallicity allowed them to obtain a precise age of 8.2±0.3 Gyr (see Figure 10) and an initial helium abundance of Y0 = 0.297±0.003. This is to date, the most precise age and helium estimate for this cluster.
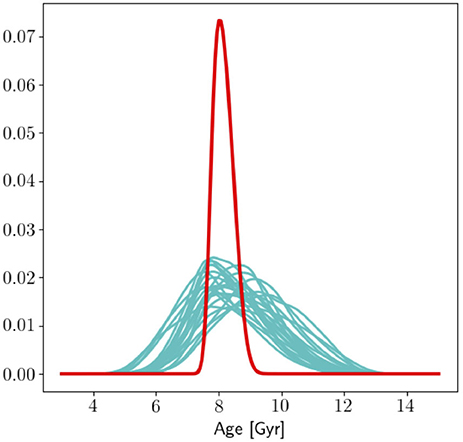
Figure 10. The cyan curves mark the individual probability density functions for age for a sample of red giants in NGC 6791. The red curve is the joint probability assuming that all stars in a cluster have the same age. Note the precision to which the age of the cluster can be determined. Image courtesy of Jean McKeever.
Unlike the case of red-giant structure, a lot more attention has been paid to the internal rotation of red giants. Beck et al. (2012b) showed unequivocally that rotational splittings of red-giant modes can be observed and measured. This opened up the possibility of determining the rotation of RGB cores since mixed modes are most sensitive to conditions in the core. Beck et al. (2012b) and Beck et al. (2012a) showed that the cores of red giants rotate ten times faster than the surface, as is expected from the principle of conservation of angular momentum—as stars evolve, the core contracts while the envelope expands, and the contracting core rotates faster to conserve angular momentum.
Clearly, interpreting the rotational splittings require the knowledge of how the splittings depend on internal rotation. Goupil et al. (2013) showed how the contrast between core and envelope rotation are encoded in the frequency splittings. They showed that the splittings have a linear dependence on the contribution of the core to the total mode inertia and that the slope of this linear relation is related to the ratio of the average envelope rotation to that of the core. The linear theory of rotational splittings predicts symmetric splittings around the m = 0 mode for rotation that does not depend on latitude. However, this is not the case for strongly couple mixed modes. Such asymmetries were first observed by Beck et al. (2014). Deheuvels et al. (2017) showed how the splittings might be calculated under conditions of strong coupling. Their work implied that it is important to obtain a good model of the star being studied in order to obtain the eigenfunctions needed to interpret the data.
Rotational splittings only indicate an average rotation rate, and one has to invert the rotational splittings to determine what the real rotation rate is. Deheuvels et al. (2012) inverted the splittings of KIC 7341231, a star very close to the base of the red-giant branch, and found that the core of the star is rotating at least five times faster than the envelope. This result is interesting because while it shows that the core of stars spin up as they evolve, the spin up is not as fast as simple models of angular momentum transport in stars would suggest. Deheuvels et al. (2014) examined six more stars, all evolved subgiants and red-giants low on the red-giant branch. They obtained estimates of their core rotation rates and upper limits for the rotation in their convective envelopes. The results by Deheuvels et al. (2014) confirmed that the contrast between the rotation rates of the core and the envelope increases along the subgiant branch. They also find evidence of an abrupt change in the radial rotation profile in two of the stars, with the hydrogen-burning shell being the likely location of this change. The evidence for a an abrupt change in rotation rate causing a shear layer was also found by Di Mauro et al. (2016) and Di Mauro et al. (2018) in the star KIC 4448777. They inferred that the entire core rotates rigidly and provide evidence for an angular velocity gradient around the base of the hydrogen-burning shell. In particular their analysis revealed that the shear layer lies partially inside the hydrogen shell above r ~ 0.05 Rstar and extends across the core-envelope boundary. KIC 4448777 is not the only giant with a measured gradient in the rotation rate. By comparing the rotation rate of the convective envelope with the measured surface rotation (Beck et al., 2018) showed that a radial gradient in rotation is also present in KIC 9163796.
While inversions have been very successful in determining the rotation rate of red-giant cores, there has been less success when it comes to inversion results of the envelope. Theoretical work in this regards (Ahlborn et al., 2020) shows how sensitive inversion results are to envelope rotation depends on where the star is on the red-giant branch (see Figure 11). This behavior is associated with a glitch in the buoyancy frequency which is caused by the composition discontinuity left behind by the convective envelope. The authors only looked at models below the luminosity bump as those are the stars for which mixed modes are observed and rotational splittings are resolved. This theoretical results shows that the sensitivity of the resolution kernels obtained from the inversions imply that we may have better success resolving the envelope of higher-luminosity red giants compared with the lower luminosity ones.
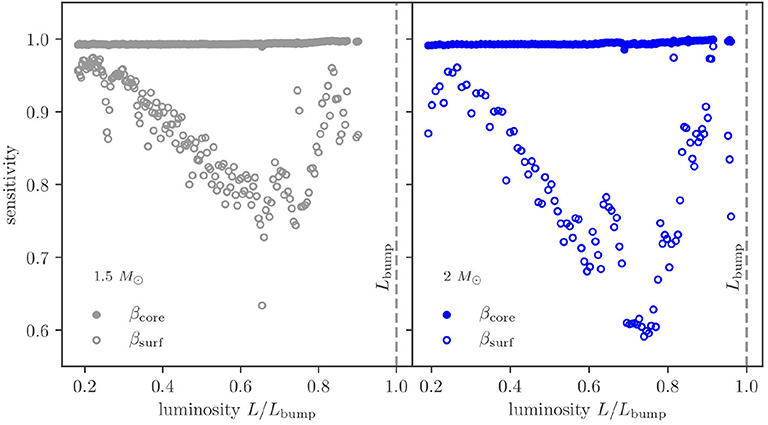
Figure 11. The sensitivity of the resolution, i.e., averaging kernels for models with a mass of 1.5 M⊙ (Left) and 2.0 M⊙ (Right) obtained using dipole mode splittings plotted as a function of luminosity along the red-giant branch. The sensitivity for the core (, where K(r0, r) is the averaging kernel and rcore = 0.003 Rstar) is shown as filled circles, and the surface sensitivity (, rlim = 0.98 Rstar) is shown as open circles. The vertical dashed lines mark the luminosity of the bump. Note that while there is almost complete sensitivity at the core, the sensitivity to near-surface rotation decreases and then increases again. Image with results from Ahlborn et al. (2020) is courtesy of Felix Ahlborn.
The most puzzling results about core-rotation have come from ensemble studies of red giants. Mosser et al. (2012b) claimed that the cores of red giants, contrary to all expectations, spin down instead of spinning up, as they ascend the red-giant branch. Gehan et al. (2018) confirmed this on examining a larger sample of stars, however, they found a smaller trend. Tayar et al. (2019) looked at core-helium burning stars rather than ascending branch stars, and they find that the core-rotation rates of these stars decrease strongly with decreasing surface gravity during the core He-burning phase.
The results above clearly indicate that our models of angular momentum transport within stars are deficient. It is clear that the different layers of a star are dynamically coupled and that angular momentum is transferred from the core to the outer layers. The results have spurred work on trying to understand how angular momentum is transferred between different layers (see e.g., Eggenberger et al., 2012, 2017; Ceillier et al., 2013; Cantiello et al., 2014; Belkacem et al., 2015a,b; Fuller et al., 2019, etc.). The processes being studied range from how models of rotation on shells (so-called “shellular rotation”) can be modified to give the observed splittings, to meridional circulation, as well as internal gravity modes and magnetic instabilities. A comprehensive discussion of the investigations is beyond the scope of this article. Interested readers are directed to Aerts et al. (2019) for a review of angular momentum transport in stars.
The seismic study of red giants is quite new, and their oscillation power spectra, and how best to extract information from them, still poses challenges.
It is known empirically that the power spectra of red-clump stars look noisier than those of inert-core red giants, and we can see this in Figure 12. Given that oscillations in these stars are excited by convection, it is to be expected that granulation would play a role in this. Indeed, Mathur et al. (2011) showed that the granulation power for red-clump stars can be higher than for a red-giant star of the same radius. However, as expected from theory of stellar convection which states that granulation depends only on Teff, logg, and metallicity, there does not appear to be any difference between RGB and RC stars when granulation power is plotted against logg (see Figures 7,11 in Mathur et al., 2011).

Figure 12. Power spectra of an RGB star (Left, KIC 1433730) and an RC star (Right, KIC 1161618).
The power spectra of some red giants show suppressed dipole modes (Mosser et al., 2012a; Garćıa et al., 2014). The suppression has been explained as being caused by remnant magnetic fields in red-giant cores (Fuller et al., 2015; Stello et al., 2016), but this interpretation has been challenged (Mosser et al., 2017), because the depressed dipole modes in these red giants are mixed modes and not the pure depressed acoustic modes that would be seen if the modes were suppressed by magnetic fields. The exact cause of the phenomenon is still under debate and remains a puzzle. See also Loi and Papaloizou (2017, 2018) for updated core magnetic field scenarios that could be consistent with the observational findings of suppressed mixed modes by Mosser et al. (2017).
As mentioned earlier, there have not been many attempts to determine the internal structure of many red giants by modeling their frequencies, partly because of issues with correcting for the surface term. However, without modeling the frequencies, a complete analysis of their rotation is not possible either. Thus clearly to understand red giants properly, the available data need to be exploited fully.
Another overlooked piece of information is the signature of glitches in the buoyancy frequency on period spacings. Cunha et al. (2015) presented a theoretical study of how the spacings will be affected. On the observational side, Mosser et al. (2015) showed how this signature may be extracted from the data. However, there has been little progress in terms of using the signature to determine the properties of red-giant cores. This is not completely surprising, since interpretation depends both on individual frequencies, which are not commonly extracted, and on models whose physics is uncertain. However, there is a wealth of data which should allow us to make progress despite the uncertainties.
The oscillation spectra of red giants are fascinating and complicated. They reflect the large density contrast in the interior. The presence of mixed modes has allowed us to study core rotation of these stars, which in turn will allow us to study processes involved with angular-momentum transport inside stars. Methods to exploit mixed modes to study the interior structure of red giants are still under development. Although Kepler has ceased functioning, the red-giant data obtained by the observatory will be exploited for years to come.
SB planned the outline of the review. Both authors had equal share in the writing.
The authors declare that the research was conducted in the absence of any commercial or financial relationships that could be construed as a potential conflict of interest.
1. ^We drop the degree identification here as we focus only on dipole mixed modes.
Aerts, C., Christensen-Dalsgaard, J., and Kurtz, D. W. (2010). Asteroseismology. Springer Netherlands. doi: 10.1007/978-1-4020-5803-5
Aerts, C., Mathis, S., and Rogers, T. M. (2019). Angular momentum transport in stellar interiors. Ann. Rev. Astron. Astrophys. 57, 35–78. doi: 10.1146/annurev-astro-091918-104359
Ahlborn, F., Bellinger, E. P., Hekker, S., Basu, S., and Angelou, G. C. (2020). On the asteroseismic sensitivity to internal rotation along the red-giant branch. arXiv preprints arXiv:2003.08905. doi: 10.1051/0004-6361/201936947
Aizenman, M., Smeyers, P., and Weigert, A. (1977). Avoided crossing of modes of non-radial stellar oscillations. Astron. Astrophys. 58:41.
Appourchaux, T., Chaplin, W. J., García, R. A., Gruberbauer, M., Verner, G. A., Antia, H. M., et al. (2012). Oscillation mode frequencies of 61 main-sequence and subgiant stars observed by Kepler. Astron. Astrophys., 543:A54. doi: 10.1051/0004-6361/201218948
Baglin, A., Auvergne, M., Boisnard, L., Lam-Trong, T., Barge, P., Catala, C., et al. (2006). “CoRoT: a high precision photometer for stellar ecolution and exoplanet finding,” in 36th COSPAR Scientific Assembly, Vol. 36 (Beijing), 3749.
Ball, W. H., and Gizon, L. (2014). A new correction of stellar oscillation frequencies for near-surface effects. Astron. Astrophys. 568:A123. doi: 10.1051/0004-6361/201424325
Ball, W. H., Themeßl, N., and Hekker, S. (2018). Surface effects on the red giant branch. Mon. Not. R. Astron. Soc. 478, 4697–4709. doi: 10.1093/mnras/sty1141
Balmforth, N. J. (1992). Solar pulsational stability - III. Acoustical excitation by turbulent convection. Mon. Not. R. Astron. Soc. 255:639. doi: 10.1093/mnras/255.4.639
Basu, S., and Chaplin, W. J. (2017). Asteroseismic Data Analysis: Foundations and Techniques. Princeton, NJ: Princeton University Press. doi: 10.23943/princeton/9780691162928.001.0001
Beck, P. G., Bedding, T. R., Mosser, B., Stello, D., Garcia, R. A., Kallinger, T., et al. (2011). Kepler detected gravity-mode period spacings in a red giant star. Science 332:205. doi: 10.1126/science.1201939
Beck, P. G., De Ridder, J., Aerts, C., Kallinger, T., Hekker, S., García, R. A., et al. (2012a). Constraining the core-rotation rate in red-giant stars from Kepler space photometry. Astronomische Nachrichten 333:967. doi: 10.1002/asna.201211787
Beck, P. G., Hambleton, K., Vos, J., Kallinger, T., Bloemen, S., Tkachenko, A., et al. (2014). Pulsating red giant stars in eccentric binary systems discovered from Kepler space-based photometry. A sample study and the analysis of KIC 5006817. Astron. Astrophys. 564:A36. doi: 10.1051/0004-6361/201322477
Beck, P. G., Kallinger, T., Pavlovski, K., Palacios, A., Tkachenko, A., Mathis, S., et al. (2018). Seismic probing of the first dredge-up event through the eccentric red-giant and red-giant spectroscopic binary KIC 9163796. How different are red-giant stars with a mass ratio of 1.015? Astron. Astrophys. 612:A22. doi: 10.1051/0004-6361/201731269
Beck, P. G., Montalban, J., Kallinger, T., De Ridder, J., Aerts, C., García, R. A., et al. (2012b). Fast core rotation in red-giant stars as revealed by gravity-dominated mixed modes. Nature 481, 55–57. doi: 10.1038/nature10612
Bedding, T. R., Mosser, B., Huber, D., Montalbán, J., Beck, P., Christensen-Dalsgaard, J., et al. (2011). Gravity modes as a way to distinguish between hydrogen- and helium-burning red giant stars. Nature 471, 608–611. doi: 10.1038/nature09935
Belkacem, K., Marques, J. P., Goupil, M. J., Mosser, B., Sonoi, T., Ouazzani, R. M., et al. (2015a). Angular momentum redistribution by mixed modes in evolved low-mass stars. II. Spin-down of the core of red giants induced by mixed modes. Astron. Astrophys. 579:A31. doi: 10.1051/0004-6361/201526043
Belkacem, K., Marques, J. P., Goupil, M. J., Sonoi, T., Ouazzani, R. M., Dupret, M. A., et al. (2015b). Angular momentum redistribution by mixed modes in evolved low-mass stars. I. Theoretical formalism. Astron. Astrophys. 579:A30. doi: 10.1051/0004-6361/201526042
Borucki, W. J., Koch, D., Basri, G., Batalha, N., Brown, T., Caldwell, D., et al. (2010). Kepler planet-detection mission: introduction and first results. Science 327:977. doi: 10.1126/science.1185402
Bovy, J., Nidever, D. L., Rix, H.-W., Girardi, L., Zasowski, G., Chojnowski, S. D., et al. (2014). The APOGEE red-clump catalog: precise distances, velocities, and high-resolution elemental abundances over a large area of the milky way's disk. Astrophys. J. 790:127. doi: 10.1088/0004-637X/790/2/127
Brown, T. M., Gilliland, R. L., Noyes, R. W., and Ramsey, L. W. (1991). Detection of possible p-mode oscillations on procyon. Astrophys. J. 368:599. doi: 10.1086/169725
Cantiello, M., Mankovich, C., Bildsten, L., Christensen-Dalsgaard, J., and Paxton, B. (2014). Angular momentum transport within evolved low-mass stars. Astrophys. J. 788:93. doi: 10.1088/0004-637X/788/1/93
Ceillier, T., Eggenberger, P., García, R. A., and Mathis, S. (2013). Understanding angular momentum transport in red giants: the case of KIC 7341231. Astron. Astrophys. 555:A54. doi: 10.1051/0004-6361/201321473
Chaplin, W. J., Appourchaux, T., Elsworth, Y., García, R. A., Houdek, G., Karoff, C., et al. (2010). The asteroseismic potential of Kepler: first results for solar-type stars. Astrophys. J. Letters 713, L169–L175. doi: 10.1088/2041-8205/713/2/L169
Chiappini, C., Anders, F., Rodrigues, T. S., Miglio, A., Montalban, J., Mosser, B., et al. (2015). Young [α/Fe]-enhanced stars discovered by CoRoT and APOGEE: what is their origin? Astron. Astrophys. 576:L12. doi: 10.1051/0004-6361/201525865
Christensen-Dalsgaard, J. (1988). “A Hertzsprung-Russell diagram for stellar oscillations,” in Advances in Helio- and Asteroseismology, Volume 123 of IAU Symposium, eds J. Christensen-Dalsgaard and S. Frandsen, 295 (Aarhus). doi: 10.1017/S0074180900158279
Christensen-Dalsgaard, J., Silva Aguirre, V., Elsworth, Y., and Hekker, S. (2014). On the asymptotic acoustic-mode phase in red giant stars and its dependence on evolutionary state. Mon. Not. R. Astron. Soc. 445, 3685–3693. doi: 10.1093/mnras/stu2007
Corsaro, E., and De Ridder, J. (2014). DIAMONDS: a new Bayesian nested sampling tool. Application to peak bagging of solar-like oscillations. Astron. Astrophys. 571:A71. doi: 10.1051/0004-6361/201424181
Cunha, M. S., Stello, D., Avelino, P. P., Christensen-Dalsgaard, J., and Townsend, R. H. D. (2015). Structural glitches near the cores of red giants revealed by oscillations in g-mode period spacings from stellar models. Astrophys. J. 805:127. doi: 10.1088/0004-637X/805/2/127
Davies, G. R., Lund, M. N., Miglio, A., Elsworth, Y., Kuszlewicz, J. S., North, T. S. H., et al. (2017). Using red clump stars to correct the Gaia DR1 parallaxes. Astron. Astrophys. 598:L4. doi: 10.1051/0004-6361/201630066
Davies, G. R., Silva Aguirre, V., Bedding, T. R., Hand berg, R., Lund, M. N., Chaplin, W. J., et al. (2016). Oscillation frequencies for 35 Kepler solar-type planet-hosting stars using Bayesian techniques and machine learning. Mon. Not. R. Astron. Soc. 456, 2183–2195. doi: 10.1093/mnras/stv2593
Deheuvels, S., Doğan, G., Goupil, M. J., Appourchaux, T., Benomar, O., Bruntt, H., et al. (2014). Seismic constraints on the radial dependence of the internal rotation profiles of six Kepler subgiants and young red giants. Astron. Astrophys. 564:A27. doi: 10.1051/0004-6361/201322779
Deheuvels, S., García, R. A., Chaplin, W. J., Basu, S., Antia, H. M., Appourchaux, T., et al. (2012). Seismic evidence for a rapidly rotating core in a lower-giant-branch star observed with Kepler. Astrophys. J. 756:19. doi: 10.1088/0004-637X/756/1/19
Deheuvels, S., Ouazzani, R. M., and Basu, S. (2017). Near-degeneracy effects on the frequencies of rotationally-split mixed modes in red giants. Astron. Astrophys. 605:A75. doi: 10.1051/0004-6361/201730786
Di Mauro, M. P., Ventura, R., Cardini, D., Stello, D., Christensen-Dalsgaard, J., Dziembowski, W. A., et al. (2016). Internal rotation of the red-giant star KIC 4448777 by means of asteroseismic inversion. Astrophys. J. 817:65. doi: 10.3847/0004-637X/817/1/65
Di Mauro, M. P., Ventura, R., Corsaro, E., and Lustosa De Moura, B. (2018). The rotational shear layer inside the early red-giant star KIC 4448777. Astrophys. J. 862:9. doi: 10.3847/1538-4357/aac7c4
Eggenberger, P., Lagarde, N., Miglio, A., Montalban, J., Ekström, S., Georgy, C., et al. (2017). Constraining the efficiency of angular momentum transport with asteroseismology of red giants: the effect of stellar mass. Astron. Astrophys., 599:A18. doi: 10.1051/0004-6361/201629459
Eggenberger, P., Montalban, J., and Miglio, A. (2012). Angular momentum transport in stellar interiors constrained by rotational splittings of mixed modes in red giants. Astron. Astrophys. 544:L4. doi: 10.1051/0004-6361/201219729
Elsworth, Y., Hekker, S., Basu, S., and Davies, G. R. (2017). A new method for the asteroseismic determination of the evolutionary state of red-giant stars. Mon. Not. R. Astron. Soc. 466, 3344–3352. doi: 10.1093/mnras/stw3288
Elsworth, Y., Hekker, S., Johnson, J. A., Kallinger, T., Mosser, B., Pinsonneault, M., et al. (2019). Insights from the APOKASC determination of the evolutionary state of red-giant stars by consolidation of different methods. Mon. Not. R. Astron. Soc. 489, 4641–4657. doi: 10.1093/mnras/stz2356
Epstein, C. R., Elsworth, Y. P., Johnson, J. A., Shetrone, M., Mosser, B., Hekker, S., et al. (2014). Testing the asteroseismic mass scale using metal-poor stars characterized with APOGEE and Kepler. Astrophys. J. Letters 785:L28. doi: 10.1088/2041-8205/785/2/L28
Fuller, J., Cantiello, M., Stello, D., Garcia, R. A., and Bildsten, L. (2015). Asteroseismology can reveal strong internal magnetic fields in red giant stars. Science 350, 423–426. doi: 10.1126/science.aac6933
Fuller, J., Piro, A. L., and Jermyn, A. S. (2019). Slowing the spins of stellar cores. Mon. Not. R. Astron. Soc. 485, 3661–3680. doi: 10.1093/mnras/stz514
García Saravia Ortiz de Montellano, A., Hekker, S., and Themeßl, N. (2018). Automated asteroseismic peak detections. Mon. Not. R. Astron. Soc. 476, 1470–1496. doi: 10.1093/mnras/sty253
García, R. A., Pérez Hernández, F., Benomar, O., Silva Aguirre, V., Ballot, J., Davies, G. R., et al. (2014). Study of KIC 8561221 observed by Kepler: an early red giant showing depressed dipolar modes. Astron. Astrophys. 563:A84. doi: 10.1051/0004-6361/201322823
Gehan, C., Mosser, B., Michel, E., Samadi, R., and Kallinger, T. (2018). Core rotation braking on the red giant branch for various mass ranges. Astron. Astrophys. 616:A24. doi: 10.1051/0004-6361/201832822
Girardi, L. (2016). Red Clump Stars. Ann. Rev. Astron. Astrophys. 54, 95–133. doi: 10.1146/annurev-astro-081915-023354
Gizon, L., and Solanki, S. K. (2003). Determining the inclination of the rotation axis of a sun-like star. Astrophys. J. 589, 1009–1019. doi: 10.1086/374715
Goldreich, P., and Keeley, D. A. (1977a). Solar seismology. I. The stability of the solar p-modes. Astrophys. J. 211, 934–942. doi: 10.1086/155005
Goldreich, P., and Keeley, D. A. (1977b). Solar seismology. II. The stochastic excitation of the solar p-modes by turbulent convection. Astrophys. J. 212, 243–251. doi: 10.1086/155043
Gough, D. O. (1990). “Comments on helioseismic inference,” in Progress of Seismology of the Sun and Stars, eds Y. Osaki and H. Shibahashi (Berlin, Heidelberg: Springer), 281–318.
Goupil, M. J., Mosser, B., Marques, J. P., Ouazzani, R. M., Belkacem, K., Lebreton, Y., et al. (2013). Seismic diagnostics for transport of angular momentum in stars. II. Interpreting observed rotational splittings of slowly rotating red giant stars. Astron. Astrophys. 549:A75. doi: 10.1051/0004-6361/201220266
Grundahl, F., Kjeldsen, H., Christensen-Dalsgaard, J., Arentoft, T., and Frandsen, S. (2007). Stellar oscillations network group. Commun. Asteroseismol. 150:300. doi: 10.1553/cia150s300
Guggenberger, E., Hekker, S., Angelou, G. C., Basu, S., and Bellinger, E. P. (2017). Mitigating the mass dependence in the Δν scaling relation of red giant stars. Mon. Not. R. Astron. Soc. 470, 2069–2078. doi: 10.1093/mnras/stx1253
Guggenberger, E., Hekker, S., Basu, S., and Bellinger, E. (2016). Significantly improving stellar mass and radius estimates: a new reference function for the Δν scaling relation. Mon. Not. R. Astron. Soc. 460, 4277–4281. doi: 10.1093/mnras/stw1326
Hekker, S. (2013). CoRoT and Kepler results: solar-like oscillators. Adv. Space Res. 52, 1581–1592. doi: 10.1016/j.asr.2013.08.005
Hekker, S. (2020). Scaling relations for solar-like oscillations: a review. Front. Astron. Space Sci. 7:3. doi: 10.3389/fspas.2020.00003
Hekker, S., and Christensen-Dalsgaard, J. (2017). Giant star seismology. Astron. Astrophys. Rev. 25:1. doi: 10.1007/s00159-017-0101-x
Hekker, S., Elsworth, Y., Basu, S., and Bellinger, E. (2017). “Evolutionary states of red-giant stars from grid-based modelling,” in European Physical Journal Web of Conferences, Volume 160 of European Physical Journal Web of Conferences (Azores Islands), 04006. doi: 10.1051/epjconf/201716004006
Hekker, S., and Johnson, J. A. (2019). Origin of α-rich young stars: clues from C, N, and O. Mon. Not. R. Astron. Soc. 487, 4343–4354. doi: 10.1093/mnras/stz1554
Hon, M., Stello, D., and Yu, J. (2018). Deep learning classification in asteroseismology using an improved neural network: results on 15 000 Kepler red giants and applications to K2 and TESS data. Mon. Not. R. Astron. Soc. 476, 3233–3244. doi: 10.1093/mnras/sty483
Jørgensen, A. S., Montalban, J., Miglio, A., Rendle, B. M., Davies, G. R., Buldgen, G., et al. (2020). Investigating surface correction relations for RGB stars. arXiv preprint arXiv:2004.13666. doi: 10.1093/mnras/staa1480
Kallinger, T. (2019). Release note: massive peak bagging of red giants in the Kepler field. arXiv preprint arXiv:1906.09428.
Kallinger, T., Hekker, S., Garcia, R. A., Huber, D., and Matthews, J. M. (2016). Precise stellar surface gravities from the time scales of convectively driven brightness variations. Sci. Adv. 2:1500654. doi: 10.1126/sciadv.1500654
Kallinger, T., Hekker, S., Mosser, B., De Ridder, J., Bedding, T. R., Elsworth, Y. P., et al. (2012). Evolutionary influences on the structure of red-giant acoustic oscillation spectra from 600d of Kepler observations. Astron. Astrophys. 541:A51. doi: 10.1051/0004-6361/201218854
Khan, S., Miglio, A., Mosser, B., Arenou, F., Belkacem, K., Brown, A. G. A., et al. (2019). New light on the Gaia DR2 parallax zero-point: influence of the asteroseismic approach, in and beyond the Kepler field. Astron. Astrophys. 628:A35. doi: 10.1051/0004-6361/201935304
Kippenhahn, R., Weigert, A., and Weiss, A. (2012). Stellar Structure and Evolution. Berlin; Heidelberg: Springer-Verlag. doi: 10.1007/978-3-642-30304-3
Kjeldsen, H., and Bedding, T. R. (1995). Amplitudes of stellar oscillations: the implications for asteroseismology. Astron. Astrophys. 293, 87–106.
Kjeldsen, H., Bedding, T. R., and Christensen-Dalsgaard, J. (2008). Correcting stellar oscillation frequencies for near-surface effects. Astrophys. J. Letters 683:L175. doi: 10.1086/591667
Li, T., Bedding, T. R., Huber, D., Ball, W. H., Stello, D., Murphy, S. J., et al. (2018). Modelling Kepler red giants in eclipsing binaries: calibrating the mixing-length parameter with asteroseismology. MNRAS 475, 981–998. doi: 10.1093/mnras/stx3079
Lian, J., Thomas, D., Maraston, C., Zamora, O., Tayar, J., Pan, K., et al. (2020). The age-chemical abundance structure of the Galaxy I: evidence for a late-accretion event in the outer disc at z ~ 0.6. Mon. Not. R. Astron. Soc. 494, 2561–2575. doi: 10.1093/mnras/staa867
Loi, S. T., and Papaloizou, J. C. B. (2017). Torsional Alfvén resonances as an efficient damping mechanism for non-radial oscillations in red giant stars. Mon. Not. R. Astron. Soc. 467, 3212–3225. doi: 10.1093/mnras/stx281
Loi, S. T., and Papaloizou, J. C. B. (2018). Effects of a strong magnetic field on internal gravity waves: trapping, phase mixing, reflection, and dynamical chaos. Mon. Not. R. Astron. Soc. 477, 5338–5357. doi: 10.1093/mnras/sty917
Lund, M. N., Silva Aguirre, V., Davies, G. R., Chaplin, W. J., Christensen-Dalsgaard, J., Houdek, G., et al. (2017). Standing on the shoulders of dwarfs: the Kepler Asteroseismic LEGACY sample. I. Oscillation mode parameters. Astrophys. J. 835:172. doi: 10.3847/1538-4357/aa9658
Martig, M., Fouesneau, M., Rix, H.-W., Ness, M., Mészáros, S., García-Hernández, D. A., et al. (2016). Red giant masses and ages derived from carbon and nitrogen abundances. Mon. Not. R. Astron. Soc. 456, 3655–3670. doi: 10.1093/mnras/stv2830
Martig, M., Rix, H.-W., Silva Aguirre, V., Hekker, S., Mosser, B., Elsworth, Y., et al. (2015). Young α-enriched giant stars in the solar neighbourhood. Mon. Not. R. Astron. Soc. 451, 2230–2243. doi: 10.1093/mnras/stv1071
Mathur, S., García, R. A., Huber, D., Regulo, C., Stello, D., Beck, P. G., et al. (2016). Probing the deep end of the milky way with Kepler: asteroseismic analysis of 854 faint red giants misclassified as cool dwarfs. Astrophys. J. 827:50. doi: 10.3847/0004-637X/827/1/50
Mathur, S., Hekker, S., Trampedach, R., Ballot, J., Kallinger, T., Buzasi, D., et al. (2011). Granulation in red giants: observations by the Kepler mission and three-dimensional convection simulations. Astrophys. J. 741:119. doi: 10.1088/0004-637X/741/2/119
McKeever, J. M., Basu, S., and Corsaro, E. (2019). The helium abundance of NGC 6791 from modeling of stellar oscillations. Astrophys. J. 874:180. doi: 10.3847/1538-4357/ab0c04
Mints, A., and Hekker, S. (2018). Isochrone fitting in the Gaia era. Astron. Astrophys. 618:A54. doi: 10.1051/0004-6361/201832739
Mosser, B., Barban, C., Montalban, J., Beck, P. G., Miglio, A., Belkacem, K., et al. (2011). Mixed modes in red-giant stars observed with CoRoT. Astron. Astrophys. 532:A86. doi: 10.1051/0004-6361/201116825
Mosser, B., Belkacem, K., Pinçon, C., Takata, M., Vrard, M., Barban, C., et al. (2017). Dipole modes with depressed amplitudes in red giants are mixed modes. Astron. Astrophys. 598:A62. doi: 10.1051/0004-6361/201629494
Mosser, B., Benomar, O., Belkacem, K., Goupil, M. J., Lagarde, N., Michel, E., et al. (2014). Mixed modes in red giants: a window on stellar evolution. Astron. Astrophys. 572:L5. doi: 10.1051/0004-6361/201425039
Mosser, B., Elsworth, Y., Hekker, S., Huber, D., Kallinger, T., Mathur, S., et al. (2012a). Characterization of the power excess of solar-like oscillations in red giants with Kepler. Astron. Astrophys. 537:A30. doi: 10.1051/0004-6361/201117352
Mosser, B., Goupil, M. J., Belkacem, K., Marques, J. P., Beck, P. G., Bloemen, S., et al. (2012b). Spin down of the core rotation in red giants. Astron. Astrophys. 548:A10. doi: 10.1051/0004-6361/201220106
Mosser, B., Goupil, M. J., Belkacem, K., Michel, E., Stello, D., Marques, J. P., et al. (2012c). Probing the core structure and evolution of red giants using gravity-dominated mixed modes observed with Kepler. Astron. Astrophys. 540:A143. doi: 10.1051/0004-6361/201118519
Mosser, B., Miglio, A., and CoRot Team (2016). The CoRoT Legacy Book: The Adventure of the Ultra High Precision Photometry From Space. EDP Sciences. doi: 10.1051/978-2-7598-1876-1.c042
Mosser, B., Vrard, M., Belkacem, K., Deheuvels, S., and Goupil, M. J. (2015). Period spacings in red giants. I. Disentangling rotation and revealing core structure discontinuities. Astron. Astrophys. 584:A50. doi: 10.1051/0004-6361/201527075
Nidever, D. L., Bovy, J., Bird, J. C., Andrews, B. H., Hayden, M., Holtzman, J., et al. (2014). Tracing chemical evolution over the extent of the milky way's disk with APOGEE red clump stars. Astrophys. J. 796:38. doi: 10.1088/0004-637X/796/1/38
Ong, J. M. J., and Basu, S. (2019a). Explaining deviations from the scaling relationship of the large frequency separation. Astrophys. J. 870:41. doi: 10.3847/1538-4357/aaf1b5
Ong, J. M. J., and Basu, S. (2019b). Structural and evolutionary diagnostics from asteroseismic phase functions. Astrophys. J. 885:26. doi: 10.3847/1538-4357/ab425f
Ong, J. M. J., and Basu, S. (2020). Semi-analytic expressions for the isolation and coupling of mixed modes. arXiv [Preprint]. arXiv:2006.13313. Available online at: https://ui.adsabs.harvard.edu/abs/2020arXiv200613313O.
Paxton, B., Smolec, R., Schwab, J., Gautschy, A., Bildsten, L., Cantiello, M., et al. (2019). Modules for experiments in stellar astrophysics (MESA): pulsating variable stars, rotation, convective boundaries, and energy conservation. Astrophys. J. Suppl. Ser. 243:10. doi: 10.3847/1538-4365/ab2241
Pinsonneault, M. H., Elsworth, Y., Epstein, C., Hekker, S., Mészáros, S., Chaplin, W. J., et al. (2014). The APOKASC catalog: an asteroseismic and spectroscopic joint survey of targets in the Kepler fields. Astrophys. J. Suppl. Ser. 215:19. doi: 10.1088/0067-0049/215/2/19
Pinsonneault, M. H., Elsworth, Y. P., Tayar, J., Serenelli, A., Stello, D., Zinn, J., et al. (2018). The second APOKASC catalog: the empirical approach. Astrophys. J. Suppl. Ser.239:32. doi: 10.3847/1538-4365/aaebfd
Salaris, M., and Cassisi, S. (2005). Evolution of Stars and Stellar Populations. Chichestor: John Wiley and Sons. doi: 10.1002/0470033452
Schmitt, J. R., and Basu, S. (2015). Modeling the asteroseismic surface term across the HR diagram. Astrophys. J. 808:123. doi: 10.1088/0004-637X/808/2/123
Silva Aguirre, V., Davies, G. R., Basu, S., Christensen-Dalsgaard, J., Creevey, O., Metcalfe, T. S., et al. (2015). Ages and fundamental properties of Kepler exoplanet host stars from asteroseismology. Mon. Not. R. Astron. Soc. 452, 2127–2148. doi: 10.1093/mnras/stv1388
Silva Aguirre, V., Lund, M. N., Antia, H. M., Ball, W. H., Basu, S., Christensen-Dalsgaard, J., et al. (2017). Standing on the shoulders of dwarfs: the kepler asteroseismic LEGACY sample. II. Radii, masses, and ages. Astrophys. J. 835:173. doi: 10.3847/1538-4357/835/2/173
Sonoi, T., Samadi, R., Belkacem, K., Ludwig, H. G., Caffau, E., and Mosser, B. (2015). Surface-effect corrections for solar-like oscillations using 3D hydrodynamical simulations. I. Adiabatic oscillations. Astron. Astrophys. 583:A112. doi: 10.1051/0004-6361/201526838
Spitoni, E., Verma, K., Silva Aguirre, V., and Calura, F. (2020). Galactic archaeology with asteroseismic ages. II. Confirmation of a delayed gas infall using Bayesian analysis based on MCMC methods. Astron. Astrophys., 635:A58. doi: 10.1051/0004-6361/201937275
Stello, D., Cantiello, M., Fuller, J., Huber, D., García, R. A., Bedding, T. R., et al. (2016). A prevalence of dynamo-generated magnetic fields in the cores of intermediate-mass stars. Nature 529, 364–367. doi: 10.1038/nature16171
Tassoul, M. (1980). Asymptotic approximations for stellar nonradial pulsations. Astrophys. J. Suppl. Ser. 43, 469–490. doi: 10.1086/190678
Tayar, J., Beck, P. G., Pinsonneault, M. H., García, R. A., and Mathur, S. (2019). Core-envelope coupling in intermediate-mass core-helium burning stars. Astrophys. J. 887:203. doi: 10.3847/1538-4357/ab558a
Ting, Y.-S., Hawkins, K., and Rix, H.-W. (2018). A large and pristine sample of standard candles across the milky way: 100,000 red clump stars with 3% contamination. Astrophys. J. Letters 858:L7. doi: 10.3847/2041-8213/aabf8e
Ulrich, R. K. (1986). Determination of Stellar Ages from Asteroseismology. Astrophys. J. Letters 306:L37. doi: 10.1086/184700
Unno, W., Osaki, Y., Ando, H., Saio, H., and Shibahashi, H. (1989). Nonradial Oscillation of Stars. Tokyo: University of Tokyo Press.
Valentini, M., Chiappini, C., Bossini, D., Miglio, A., Davies, G. R., Mosser, B., et al. (2019). Masses and ages for metal-poor stars. A pilot programme combining asteroseismology and high-resolution spectroscopic follow-up of RAVE halo stars. Astron. Astrophys. 627:A173. doi: 10.1051/0004-6361/201834081
Vrard, M., Mosser, B., and Samadi, R. (2016). Period spacings in red giants. II. Automated measurement. Astron. Astrophys. 588:A87. doi: 10.1051/0004-6361/201527259
White, T. R., Bedding, T. R., Stello, D., Christensen-Dalsgaard, J., Huber, D., and Kjeldsen, H. (2011). Calculating asteroseismic diagrams for solar-like oscillations. Astrophys. J. 743:161. doi: 10.1088/0004-637X/743/2/161
Yu, J., Huber, D., Bedding, T. R., Stello, D., Hon, M., Murphy, S. J., et al. (2018). Asteroseismology of 16,000 Kepler red giants: global oscillation parameters, masses, and radii. APJS 236:42. doi: 10.3847/1538-4365/aaaf74
Here we present the inlist of the MESA computations used to compute the tracks shown in Figure 1. We show here the inlist of the 1 M⊙ track and computed the other tracks with exactly the same physics and only changed the mass.
! inlist to evolve a 1 solar mass star
! For the sake of future readers of this file (yourself included),
! ONLY include the controls you are actually using. DO NOT include
! all of the other controls that simply have their default values.
&star_job
! begin with a pre-main sequence model
create_pre_main_sequence_model = .true.
! begin with saved model
load_saved_model = .false.
! save a model at the end of the run
save_model_when_terminate = .true.
save_model_filename = 'bottomAGB10.mod'
! display on-screen plots
pgstar_flag = .true.
pause_before_terminate=.true.
/ !end of star_job namelist
&controls
! starting specifications
initial_mass = 1.0 ! in Msun units
! stop when the star nears ZAMS (Lnuc/L > 0.99)
stop_near_zams = .false.
! stop when the center mass fraction of h1 drops below this limit
xa_central_lower_limit_species(1) = 'he4'
xa_central_lower_limit(1) = 1d-3
!control output
history_interval = 1
write_profiles_flag = .true.
profile_interval = 20
profiles_index_name='profile1.0.index'
profile_data_prefix = 'profile'
max_num_profile_models = 1000
star_history_name = 'historym1.0zsun.data'
/ ! end of controls namelist
Keywords: stellar oscillations, fundamental parameters of stars, stellar evolution, stellar interiors, stellar rotation
Citation: Basu S and Hekker S (2020) Unveiling the Structure and Dynamics of Red Giants With Asteroseismology. Front. Astron. Space Sci. 7:44. doi: 10.3389/fspas.2020.00044
Received: 12 May 2020; Accepted: 17 June 2020;
Published: 04 August 2020.
Edited by:
Karen Kinemuchi, New Mexico State University, United StatesReviewed by:
Tiago Campante, Instituto de Astrofísica e Ciências do Espaço (IA), PortugalCopyright © 2020 Basu and Hekker. This is an open-access article distributed under the terms of the Creative Commons Attribution License (CC BY). The use, distribution or reproduction in other forums is permitted, provided the original author(s) and the copyright owner(s) are credited and that the original publication in this journal is cited, in accordance with accepted academic practice. No use, distribution or reproduction is permitted which does not comply with these terms.
*Correspondence: Sarbani Basu, c2FyYmFuaS5iYXN1QHlhbGUuZWR1
Disclaimer: All claims expressed in this article are solely those of the authors and do not necessarily represent those of their affiliated organizations, or those of the publisher, the editors and the reviewers. Any product that may be evaluated in this article or claim that may be made by its manufacturer is not guaranteed or endorsed by the publisher.
Research integrity at Frontiers
Learn more about the work of our research integrity team to safeguard the quality of each article we publish.