- 1Department of Physics, Andrews University, Berrien Springs, MI, United States
- 2Department of Engineering, Andrews University, Berrien Springs, MI, United States
- 3Princeton Plasma Physics Laboratory, Princeton University, Princeton, NJ, United States
- 4SRI International, Menlo Park, CA, United States
Using electron beam accelerators attached to satellites in Earth orbit, it may be possible to measure arc length and curvature of field-lines in the inner magnetosphere if the accelerator is designed with the capability to vary the beam energy. In combination with additional information, these measurements would be very useful in modeling the magnetic field of the inner magnetosphere. For this purpose, a three step data assimilation modeling approach is discussed. The first step in the procedure would be to use prior information to obtain an initial forecast of the inner magnetosphere. Then, a family of curves would be defined that satisfies the observed geometric attributes measured by the experiments, and the prior forecast would then be used to optimize the curve with respect to the allowed degrees of freedom. Finally, this approximation of the field-line would be used to improve the initial forecast of the inner magnetosphere, resulting in a description of the system that is optimally consistent with both the prior information and the measured curvature and arc length. This article details the method by which a family of possible approximations of the field-line may be defined via a numerical procedure, which is central to the three step approach. This method serves effectively as a pre-conditioner for parameter estimation problems using field-line curvature and arc length measurements in combination with other measurements.
1. Background
1.1. Motivation
Current accelerator technologies allow for the possibility of equipping small to medium satellites with lightweight electron beam accelerators. The scientific potential of such a setup is that an electron beam can be fired into the loss cone from somewhere in the inner magnetosphere and will end up in the ionosphere. Simulations have shown that electron beams fired into the ionosphere would result in observable precipitation (Marshall et al., 2014, 2019), and this could allow for the mapping of field-lines in the inner magnetosphere to their ionospheric foot-points at altitudes ranging between 40 and 75 km above the Earth's surface (Marshall and Bortnik, 2018). Past studies suggest that utilizing both relativistic and non-relativistic electron beams in this way is possible and would provide a means of mapping field-lines at important locations in the inner magnetosphere to the ionosphere. Experiments involving the artificial injection of non-relativistic electron beams (having energies up to 40 keV) have shown that detecting these beams is feasible (Winckler, 1980), and relativistic electron beams are expected to be more stable due to higher relativistic mass and lower beam density (Neubert and Banks, 1992). Additionally, simple linear analysis suggests that relativistic beams traveling through the magnetosphere are stable to two-stream instabilities (Galvez and Borovsky, 1988), and are stable upon entering the ionosphere to resistive hose, ion hose, and filamentation instabilities (Gilchrist et al., 2001).
A necessary consideration for this endeavor is the magnetic moment μ of the electrons in the beam, as the beam will not precipitate unless , where Bi is the magnitude of the field at the ionosphere. At midnight local time in the inner magnetosphere, we may be able to employ a second order asymptotic expansion of μ derived by Gardner (1966), which is valid under conditions discussed in the following section. If we assume that the beam is fired strictly in the direction of the magnetic field, the formula takes a very simple form:
where ρ = γmv/qB, , and κ is the magnitude of the field-line curvature, given by where . Field-aligned electron beams are therefore expected to precipitate if
This relationship reveals an opportunity for obtaining significant information about the field-line geometry if the satellite is capable of varying the energy of the beam. In the case of low energy beams (on the order of 1 keV), μ is well-approximated by the zeroth order term, so v∥ ≈ v. Since the total distance traveled by the particles must then be approximately equal to the arc length of the field-line between the launch and precipitation points, the arc length can be inferred by measuring the electron time of flight. If the energy of the beam is then increased, there may eventually come a critical point where observed precipitation is significantly reduced, indicating that the above inequality is no longer satisfied. Taking ρc to represent the corresponding value of ρ at this critical energy, the radius of curvature at the launch point is determined to be:
This concept has been expanded in greater detail by Willard et al. (2019).
The ability to measure both field-line curvature and arc length using a single satellite would significantly improve our ability to model the magnetic field of the inner magnetosphere. However, the issue of how to properly constrain a model using field-line geometry has not been investigated thoroughly. In particular, using measurements of field-line arc length in the context of parameter estimation would seem to require a highly inefficient procedure. For a given choice of model parameters for the magnetic field, the error in the field-line arc length must be computed by tracing field-lines numerically and computing their arc lengths. This means that the standard approach to parameter estimation, where the error is minimized iteratively, would require solving a non-linear initial value problem once per iteration, substantially increasing computational complexity in comparison to typical parameter estimation problems.
The method presented in this paper is motivated by an alternative approach, which will require that there is a way to use the measurements of field-line geometry to approximate the field-line curves themselves. If reasonable approximations of field-lines are possible, then these approximations can be used to enable parameter estimation without requiring the complex calculation previously described. Instead, model parameters may be estimated to maximize the alignment of the field with the approximated curve, which is a far more straightforward task. An especially elegant case where this could be used is in the context of equilibrium models, where field-line curves are already used to establish boundary conditions (Cheng, 1995; Zaharia et al., 2004, 2005). No matter the approach used, it is certainly true that making predictions about the magnetic field configuration in the inner magnetosphere must require more than just arc length and curvature measurements, and this must also be true of any effort to approximate field-lines themselves. It is therefore useful to consider the method described in this paper in the context of a three step data assimilation procedure (see Figure 1), where field-line geometry measurements would be combined with prior information about the inner magnetosphere. Data assimilation methods have been used in geospace science for some time (Richmond, 1992; Schunk et al., 2004; Kondrashov et al., 2007; Merkin et al., 2016), with no shortage of models that may be used to describe geospace systems (Cheng, 1995; Lyon et al., 2004; Tóth et al., 2007; Janhunen et al., 2012). The first step of this procedure would be to use the prior information to obtain a naive forecast of the magnetic field using traditional parameter estimation techniques. Next, the field-line geometry would be used to infer the field-line curve itself, satisfying the measured geometric restrictions, and would be chosen to be as consistent as possible with the naive forecast. Finally, the field-line curve and the prior information would be used to obtain a complete forecast of the magnetic field, again using traditional parameter estimation techniques.
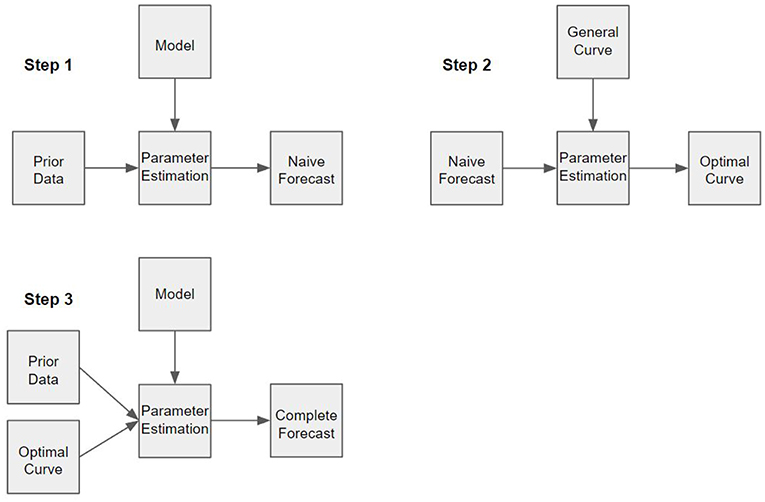
Figure 1. Schematic of the three step data assimilation procedure. In each step, some model is being optimized with respect to provided information. In step one, the physical model is being optimized with respect to prior data to produce a naive forecast. In step two, a family of possible field-line curves is optimized with respect to the naive forecast to produce an optimal field-line curve, which is the best approximation of the field-line. In step three, both the prior data and the optimal curve are used to optimize the physical model and produce a complete forecast.
In the context of this kind of three step approach, it is clear that the approximation of field-lines is merely a means of transforming the measured geometric information into a form that can be more easily used to constrain magnetic field models using parameter estimation. Our method should therefore be thought of as a pre-conditioner for the original problem, provided that there is enough additional data available such that the problem can be solved in the first place. The purpose of this paper is to present a method by which a family of curves, satisfying the measured geometric attributes, may be defined such that all remaining degrees of freedom are expressed in terms of a finite set of free parameters, since it is these free parameters that would need to be optimized in step two of the procedure (Figure 1) resulting in a unique approximation of the field-line.
1.2. Applicability
Since the scope of this method will be restricted only to situations involving data taken from energy-variable electron beam experiments, it is important to clarify the key assumptions upon which the inference of field-line arc length and curvature are based. Central to the former inference is the assumption that the path of the electron beam very closely approximates the field-line curve, so that the arc length is approximately equal to the total distance traveled by the electrons. For field-aligned electron beams, this can only be assumed if μ is dominated by the zeroth order term, which requires ρ κ ≪1. We also must assume that the field-line geometry does not shift appreciably over the particle time of flight, which is on the order of seconds. Central to the later inference is the assumption that Bϕ ≈ 0 and that the field can be well-approximated as axisymmetric to second order, since this is required in order for Gardner's formula to represent an adiabatic invariant. In part, the validity of these assumptions are energy dependent. For field-aligned particles, we can express the kinetic energy as a function of μ:
where Ω = qB/m. From this, we define three relevant energies:
Ê1 is the energy where , and is therefore a reasonable maximum energy where the approximation v∥ ≈ v is valid. Ê2 is the critical energy where the inequality (2) is violated, and Ê3 is the energy where ρ = Lϕ, where Lϕ is defined by
Lϕ is a distance scale corresponding to the second order variation of B in ϕ. We must assume axisymmetry in order to employ Gardner's formula, so Ê3 is therefore the energy where Equation (1) should no longer be expected to apply to field-aligned particles. Note, however, that ρ is not necessarily equal to the gyroradius unless the particle motion becomes completely perpendicular to the direction of the field. It is understood then that Ê3 represents a conservative restriction on where validity in our assumptions is expected. Since the altitude of peak precipitation depends slightly on the energy of the beam, it is important to recognize that Bi is similarly dependent on energy. We have neglected this dependence in the above definitions in light of recent simulations which have shown that electron beams having energies between 0.1 and 10 MeV will observably precipitate within a range of altitudes spanning roughly 35 km (Marshall and Bortnik, 2018), which does not correspond to a significant variation in Bi. In order to perform this experiment successfully, the satellite must be capable of varying the beam energy to reach both Ê1 and Ê2, the energy of the beam must be less than Ê3 everywhere on its path, and Ê2 must be less than Ê3 at the launch point.
Using T89, the Tsyganenko 1989 magnetic field model (Tsyganenko, 1989), we are able to show precisely how these energy criteria affect the scope of the method. In Figure 2, the thresholds Ê1, Ê2, and Ê3 are each calculated over midnight local time in the case where Kp = 1, where Kp is the global geomagnetic activity index. The color scale displays low energies using brighter colors, and high energies using darker colors. Along with these calculations, Figure 2 also indicates the region on midnight local time where the criteria 10 keV ≤ Ê1 < Ê2 ≤ 10 MeV and Ê2 < Ê3 are satisfied. Note that the energy range of 10 keV to 10 MeV is an optimistic range of energies, and it is not known at the present time what energy range is allowed by current or future accelerator technology. Figures 3, 4 display this same information but in the case of Kp = 5 and Kp = 7. From these calculations, we observe that Ê3 is significantly large on midnight local time, and T89 also predicts Bϕ = 0 on midnight. Therefore, we conclude from this that any assumptions that rely on Gardner's formula are valid on this domain. Additionally, we see that the region where this method may be applied is restricted to the case where the satellite is positioned near the equatorial plane. This may be problematic if the value of Ê2 is in the relativistic range, since μ may not necessarily be conserved for relativistic electrons in this region [see Willard et al. (2019) for further discussion on this topic]. However, as Kp increases, we see from Figures 3, 4 that Ê2 decreases significantly. This indicates that the ability to infer field-line curvature may be possible from near the midplane during times where the field-line curvature is large. This is consistent with the dependence on Rc seen in the definition of Ê2 in (5b).
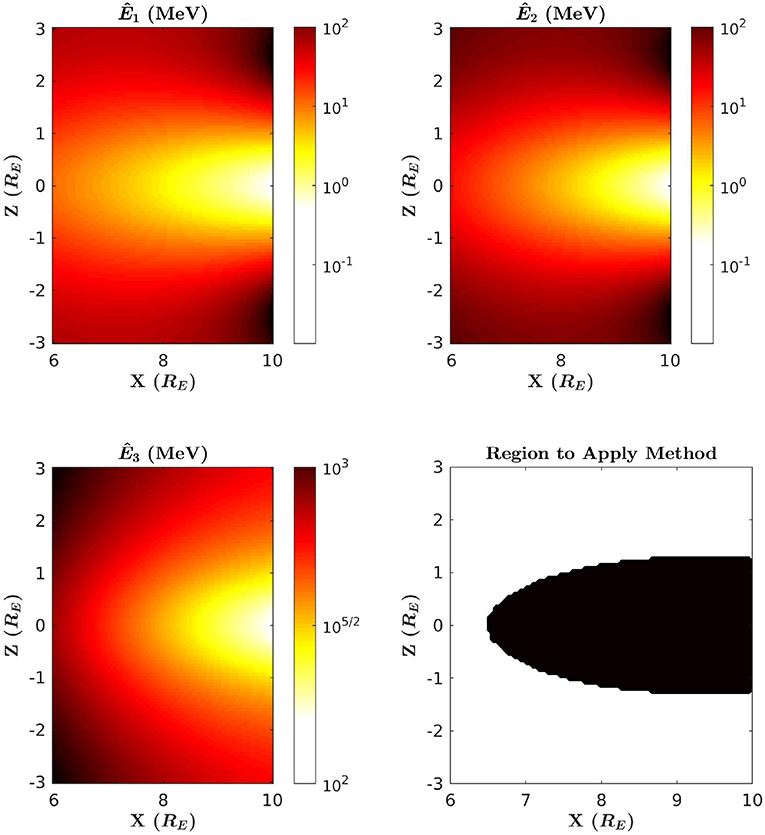
Figure 2. Ê1, Ê2, and Ê3 computed over midnight local time in the case of Kp = 1. Bright colors indicate lower energy, and darker colors indicate higher energy. Ê1 is shown in the top left panel, Ê2 in the top right, and Ê3 in the bottom left. In the bottom right panel, the region where this method should be applied is shown in black.
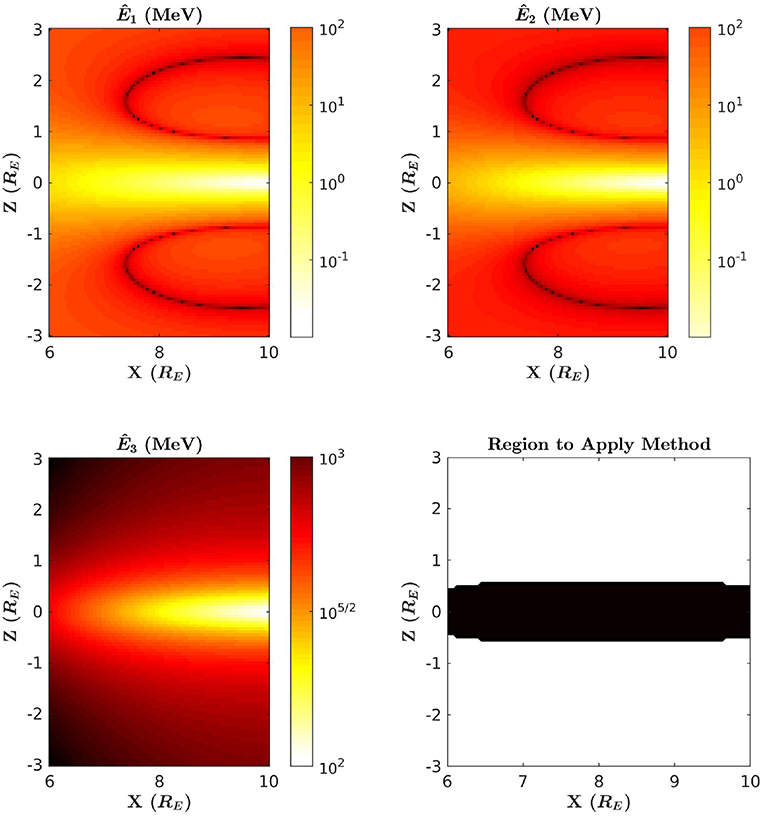
Figure 3. Ê1, Ê2, and Ê3 computed over midnight local time in the case of Kp = 5. Bright colors indicate lower energy, and darker colors indicate higher energy. Ê1 is shown in the top left panel, Ê2 in the top right, and Ê3 in the bottom left. In the bottom right panel, the region where this method should be applied is shown in black.
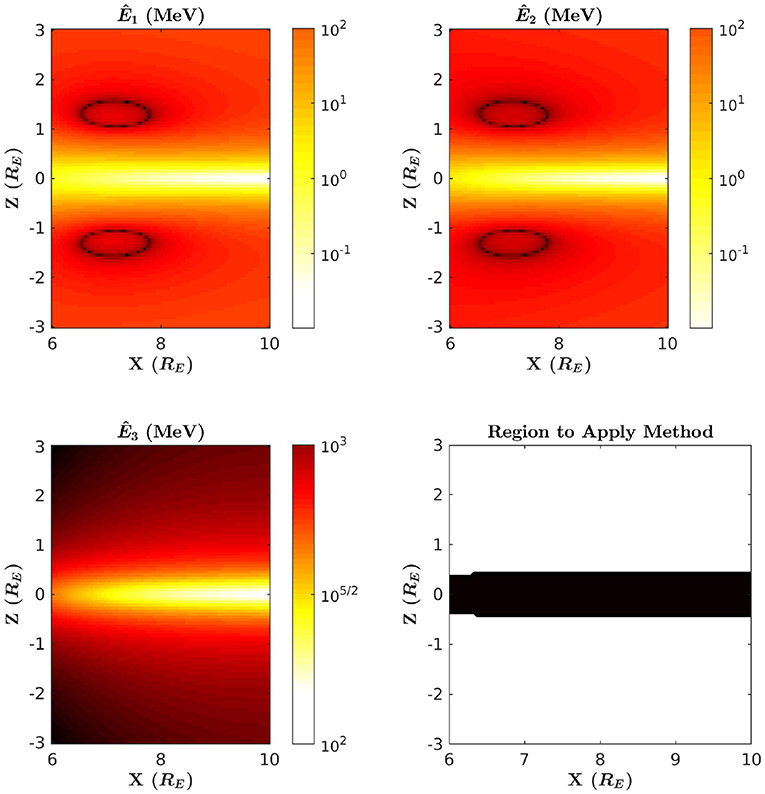
Figure 4. Ê1, Ê2, and Ê3 computed over midnight local time in the case of Kp = 7. Bright colors indicate lower energy, and darker colors indicate higher energy. Ê1 is shown in the top left panel, Ê2 in the top right, and Ê3 in the bottom left. In the bottom right panel, the region where this method should be applied is shown in black.
The precise situation where our method may be applied is as follows: a satellite equipped with an electron beam capable of firing at a range of energies will be in an orbit that intersects midnight local time near the midplane at a radial distance R and latitude θb. Once at midnight, the satellite will then begin to fire a beam with kinetic energy less than Ê1, and the precipitation of the beam in the ionosphere will be observed at a latitude θa. The time delay between the firing and the observation of the precipitation of the beam at the ionosphere is used to infer the total arc length of the field-line . The satellite will then gradually increase the energy of the beam until there is significantly reduced precipitation. We will assume that this critical energy is not greater than Ê3 so that the field-line curvature at the position of the satellite κ will also be inferred. We will also assume that all points on the field-line lie on midnight local time and that the magnetic field can be well-approximated as a dipole near the surface of the earth.
2. Method Description
2.1. Intuition
Our objective is to formalize a method by which field-lines may be approximated with curves that are consistent with measurements. In this section, we describe the problem that must be solved and the strategy that we take in solving it. The problem we would aim to solve is that of finding a family of curves that satisfy a set of constraints: (1) the curve must pass through the precipitation point and be consistent with a dipole field-line near the precipitation point, (2) the curve must pass through the position of the satellite and be consistent with the measured tangent direction and curvature of the field-line at the position of the satellite, and (3) the arc length of the curve between the launch and precipitation points must be consistent with the measured arc length. Our method satisfies these constraints by defining curves analytically near the end-points and defining the curves numerically over the rest of the domain. This strategy amounts to defining the curve piece-wise (see Figure 5), so that (a) the equation of the curve is exactly that of a dipole field-line near the precipitation point (satisfying the first constraint), (b) the equation of the curve is exactly a second-order polynomial near the launch point (satisfying the second constraint while assuming higher order derivatives are zero), and (c) the curve is numerically determined over the rest of the domain to satisfy the third constraint.
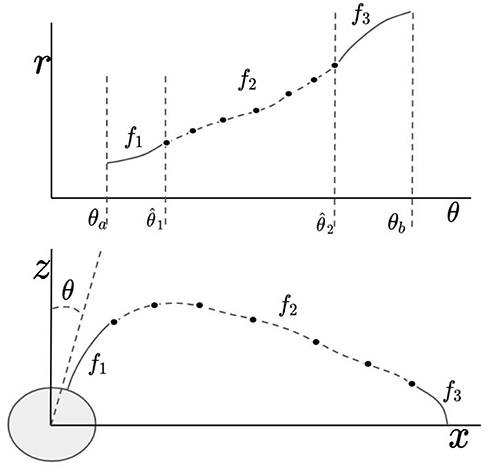
Figure 5. This diagram illustrates how f is defined piece-wise in terms of the functions f1, f2, and f3. In the top image, the three functions are shown as a graph of r vs. θ. In the bottom image, it is shown how the functions correspond to three different parts of the field-line.
This strategy allows for the third constraint to be satisfied through a numerical procedure nearly independently of the first and second constraints. In this way, the problem is essentially simplified to the problem of finding families of curves having a given arc length between set end points. In order to solve this simplified problem, we let the curve be defined as an interpolation of a finite scatter of points. To understand how these points must be chosen to approximately satisfy the arc length constraint, it is best to consider a polygonal chain that has these points as vertices. By approximating the arc length along the curve between two of these prescribed points as merely the straight-line-distance between the points (see Figure 6), constraining the arc length of the curve in this sub-domain is approximately equivalent to constraining the total length of the chain. Our approximation method can then be understood to be that of an iterative process where the vertices of the chain are chosen one by one. At each step in the iteration, the choice of where the next vertex will be located is necessarily restricted, since at every stage of the iteration it is possible to choose a vertex that makes it impossible to finish constructing the chain without changing the length. This restriction can be clearly identified by considering the shortest possible chain connecting the two end points given a chosen vertex (see Figure 7). If this shortest possible chain has a total length greater than the required length, then there must not be a curve within the set of possible curves that passes through that chosen vertex. Restricting the vertex-choosing process in this way guarantees that, after carrying out this process through some number of iterations, the final vertex can always be chosen so that the required length of the chain may be satisfied exactly. The actual curve is then determined here to be an interpolation of the points generated by this iterative procedure. In this way of conceptualizing the method, the degrees of freedom seen in the general solution are manifested as the freedom to construct chains having any particular set of vertices so long as the choice of a particular vertex does not restrict the length of the chain connecting the end points to lengths greater than the required length.
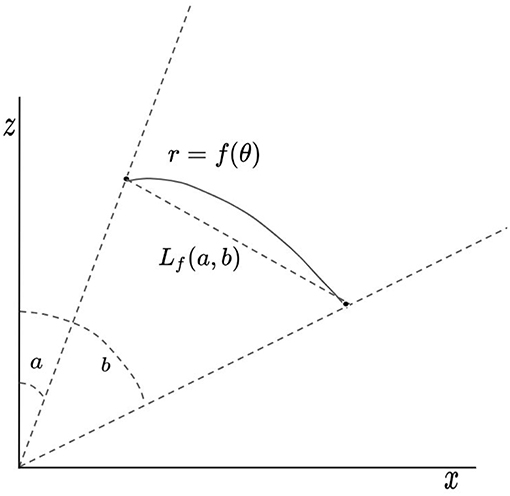
Figure 6. This diagram illustrates the meaning of the function Lf(a, b) given a curve r = f(θ) which passes through points at θ = a and θ = b.
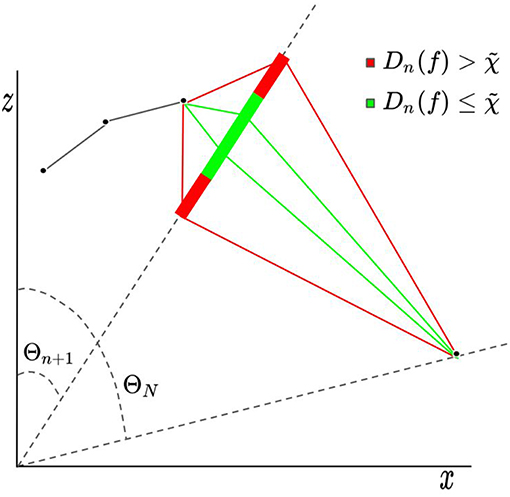
Figure 7. This diagram illustrates the meaning of the criterion . Dn(f) is the length of the shortest possible chain given the choice of f(Θn+1) = Cn+1. If , it is not possible to construct a chain having total length that connects the end points.
To summarize, the problem of finding a general curve that is consistent with the information gathered by energy-variable electron beam experiments is not straightforward. With minimal loss in generality, we employ a strategy where curves are defined analytically near the end points and numerically over the rest of the domain. This allows for the arc length of the curve to be restricted nearly independently of the other constraints, which are localized about the end points. Our method for satisfying the arc length constraint is a numerical procedure where a finite set of points are each chosen iteratively, and the curve is ultimately given as an interpolation of these points.
2.2. Formalism
To represent the field-line, we define the function f such that all points (r, θ) on the field-line satisfy r = f(θ). The known or assumed geometric attributes of the field-line can then be expressed as constraints on f:
Where R is the radial distance of the satellite, θa and θb are the latitude of the precipitation point and the position of the satellite, respectively, κ is the measured curvature, and is the measured arc length. Note that the fourth constraint (7d) follows from the assumption that the field is well-approximated as a dipole near the Earth, since dipole field-lines are expressed as r ∝ sin2(θ). These restrictions define the original problem mentioned previously. Following the strategy already described, we define f piece-wise:
where f1 and f3 are determined by only the first four of the above constraints (7a–7d), as well as the additional constraint that f3 should have no higher order derivatives:
(see Figure 5). We define two length parameters L1 and L2, which will allow the domain to be divided up with respect to distances:
L1 and L2 are distance scales representing how far from the origin the field-line can be expected to match f1 and how far from the launch point it is expected to match f3, respectively. f2 must satisfy:
where we have defined a new arc length variable for brevity:
We define Lf to be a function giving the straight line distance between two points on the curve r = f(θ):
for arbitrary angles a and b (see Figure 6). If we consider a finite set of angles {Θ1, …, ΘN} that are evenly spaced over the domain , and N is chosen such that the discretization is sufficiently fine, then the integral equation may be well-approximated by
At each angle Θn, we define a function Dn(f) by
Dn(f) is the length of the chain having vertices at each of the angles {Θ1, …, Θn+1, ΘN}. Dn(f) represents the minimum length of a chain given a chosen vertex at the angle Θn+1. In order for the chosen vertex to be allowed, one can check that (see Figure 7). We restrict f2 to be a linear combination of functions ϕi, which are commonly known as tent functions:
Note that f2(Θi) = Ci (see Figure 8). Given the reasoning previously described in terms of polygonal chains, the coefficients may be chosen so that they satisfy the following recursion rule:
The degrees of freedom in the general solution are here expressed as the freedom to choose any set of coefficients that satisfy the above relations. This freedom must now be expressed in terms of some finite set of parameters. There are undoubtedly many possible approaches that one could take in doing this. To prove that this is possible, one can check that this can be done simply by replacing the above recursion rule (17b) with the formula:
Any chosen set of real numbers {K1, …, KN−3} correspond to a particular solution to the problem.
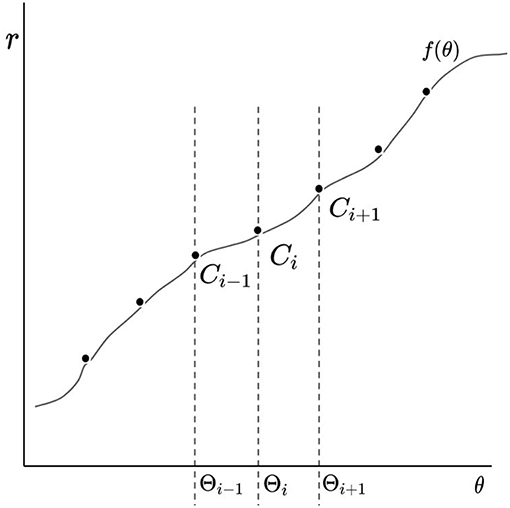
Figure 8. This diagram illustrates the meaning of the coefficients Ci. If f is a linear combination of tent functions, then f(Θi) = Ci.
3. Example Applications
In this section, we will show the approximations that are generated from our method when the parameters and κ are taken from realistic field-lines obtained from T89 on midnight local time with parameters chosen to correspond with Kp = 1. Although the method is consistent, it must be shown that realistic curves can be easily obtained by imposing realistic restrictions on the remaining degrees of freedom. For this purpose, it is not necessary to express these degrees of freedom in terms of any free parameters as described in the previous section. Rather, it is sufficient for our purposes to include an additional restriction to the recursion:
Where l = 0, 1, …, M and ϵ sets a maximum fractional increase between Cn and Cn+1. The set of all particular solutions to the problem is now guaranteed to be a finite set of functions. Through a brute force algorithm, we may then systematically generate each particular solution and then sort them by the average square second derivative of f2, which is equivalent to sorting by
Field-lines with small f″ are typical of T89, so it is expected that choosing f2 as the curve with the least should result in curves that are not very different from the original field-lines from which the parameters and κ were obtained. Field-lines can be traced from T89 as parametric curves (x(s), z(s)) satisfying:
where . Here, s represents the arc length between the point (x(s), z(s)) and the point (x(0), z(0)). The field-lines are traced by iteratively solving the above equation from a chosen launch position until ||(x(sf), z(sf))|| ≤ 1, for some value sf, at which point it is clear that . The curvature at the launch point is then computed from the formula .
For this demonstration, we will make the choices L1 = 3RE, N = 10, M = 15, and ϵ = 0.2. Our choice of L2 is different depending on the launch point: for launch points at the midplane, we choose L2 = Rc, while off the midplane the value is chosen more conservatively to be L2 = RE/3. Figure 9 shows four examples of the smoothest solutions generated with this method alongside the T89 field-lines used to obtain the parameters. Figure 10 shows the ten smoothest generated curves only in comparison with each other so that the remaining degrees of freedom can be visualized. Figure 11 shows the same information as Figures 9, 10, but is an example of using launch points that are not on the equatorial plane and are instead slightly away from the equatorial plane. These examples show that this method can be easily constrained to produce realistic field-lines that match well with the original field-lines used to obtain the parameters.
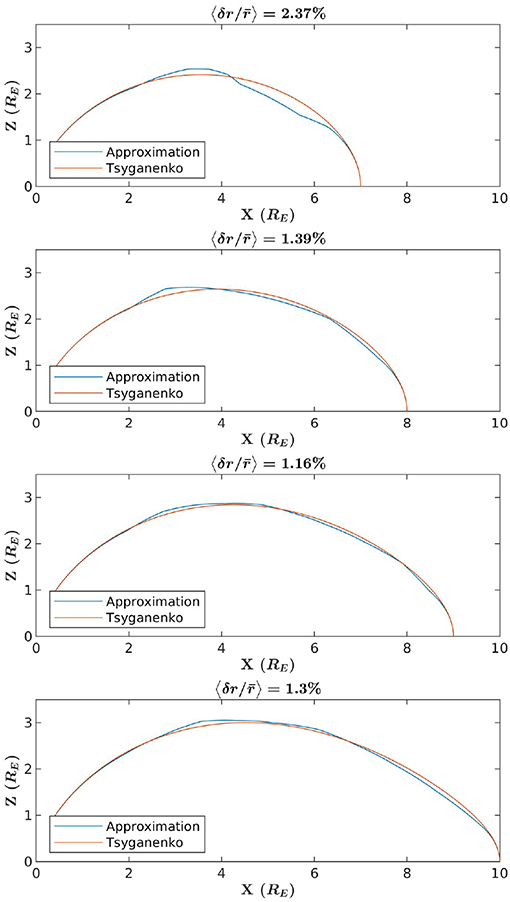
Figure 9. Comparison between T89 field-lines and curves generated via the brute force implementation of the method, where the particular curve that was picked has the least < f″>. Each panel is an example comparison where a different launch point was selected. Above each example is a percent error, here computed from the mean difference between f and the T89 curve divided by the mean averaged over θ.
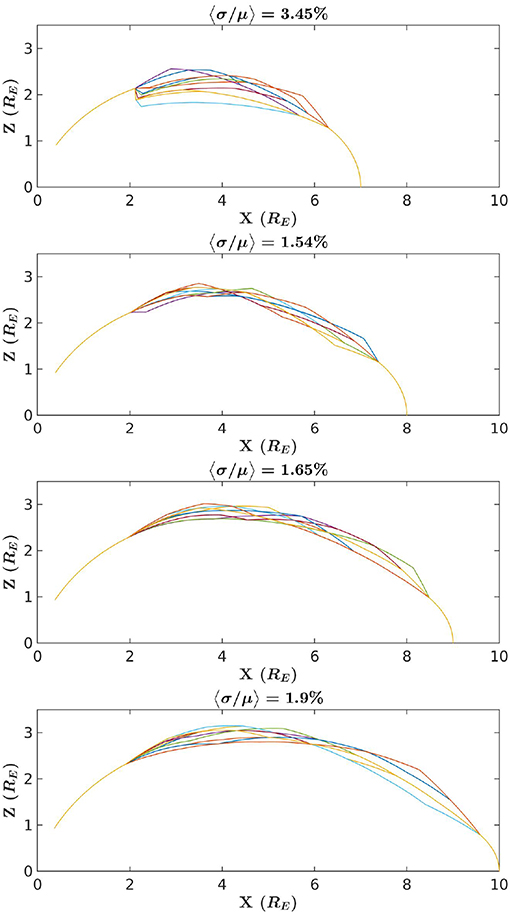
Figure 10. The 10 curves generated by via the brute force implementation of the method that have the least < f″> in comparison to each other. Each panel is an example comparison where a different launch point was selected. Above each example is a percent error, here computed from the mean variance of f divided by the mean averaged over θ.
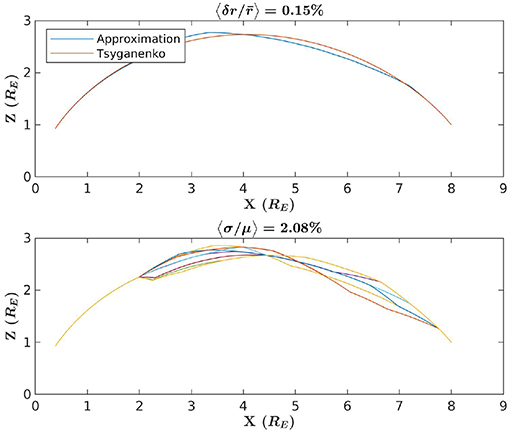
Figure 11. The top image conveys the same information as the images in Figure 9, but the launch point for this example is chosen to be away from the equatorial plane. The bottom image likewise conveys the same information as the images in Figure 10 but for a launch point away from the equatorial plane.
4. Discussion
In the above example, we show that the degrees of freedom seen in the family of curves may be easily constrained to agree well with T89 by minimizing the average square of the second derivative of f. In actual practice, this method should be used as part of the three step data assimilation technique mentioned previously. As an example, suppose the model that we wish to constrain is the axisymmetric Grad-Shafranov equation:
where the magnetic field is , P is the plasma pressure, and we have assumed Bϕ = 0. The first step of the procedure would then be to find a solution to Grad-Shafranov that optimizes some set of measurements to obtain a naive forecast potential ψ. In the second step, ψ would be assimilated to optimize the field-line approximation by minimizing a cost function J related to the variance of ψ on the curve r = f(θ):
where w(θ) is some weight function. The final step of the three step data assimilation approach would be to then assimilate the curve r = f(θ) together with the equilibrium model. This may be done by finding an optimal solution as in the first step only with the added constraint that ψ(f(θ), θ) = constant. This example is particularly elegant, since the added constraint is a Dirichlet boundary condition, provided that the domain of the calculation is restricted to the region enclosed by the approximated field-line.
Further investigation is necessary in order to fully justify the experimental techniques described at the start of this paper. The ability to infer the curvature of field-lines relies on the ability to accurately aim the electron beam, and it has yet to be determined how feasible this is given the current technology. As mentioned previously, this inference also relies on the assumption that Gardner's asymptotic expansion of μ is conserved, and the degree to which this assumption can still be made given perturbations of the magnetic field has yet to be determined. It is also a possibility that artificially injecting electrons into the ambient plasma may drive instabilities that will significantly affect the path of the beam. Although past experiments have shown that this possibility is not necessarily significant (Winckler, 1980), further investigation is necessary in order to fully determine which conditions would require that the ambient plasma is taken into account.
The task of designing energy-variable electron beam experiments certainly has many difficult challenges that must be overcome, so it is necessary to consider the importance of this feature with respect to our method. Primarily, the ability to vary the energy of the beam is required in order to directly measure the field-line curvature at the launch position. However, curvature is also necessary in order to know the value of Ê1, and therefore a lack of knowledge of the curvature leads to a source of uncertainty in the arc length measurement. Without an energy-variable experiment, it would therefore be necessary to simply infer the field-line curvature by some other means. For example, if the satellite is positioned well above the equatorial plane, it may be reasonable to simply assume that κ ≈ 0 and Ê1 is relatively large. However, it is uncertain as to whether or not this application would be of much use to modeling the inner magnetosphere if the field-line curvature is not actually measured.
As mentioned previously, this method as a whole is only applicable in those cases where the arc length and curvature may be measured using a single satellite equipped with an energy-variable accelerator. However, various techniques and concepts employed in this method may be adapted to be used in alternative cases. For example, the technique used to approximate the arc length constraint using polygonal chains may be adapted to any context where the arc length of field-lines is known. Provided some method by which the field-line torsion may be inferred, we may additionally consider generalizing this method to study field-lines that are not restricted to midnight local time. This method should therefore be seen as a particular implementation of a more general approach to utilizing measurements of field-line geometry that may utilize a wider variety of measurements than discussed here.
5. Summary
In this article, we discuss a way in which it may be possible to measure field-line curvature and arc length using energy-variable electron beam experiments. In order to use these measurements to constrain models of Earth's inner magnetosphere, we discuss a three step data assimilation approach where prior information about the field may be used to approximate the field-line. The prior information may then be used in conjunction with this approximation to better constrain the model. Central to this approach is the method presented in this article, which is a means of approximating a general solution to a set of constraints, such that the problem is only slightly more restricted than mere adherence to the measurements of field-line arc length and curvature, and the degrees of freedom in this general solution can be expressed in terms of free variables. As an example, we obtain parameters from realistic field-lines traced from T89, and compare these curves with select approximations generated using the method to show that T89 curves can be reproduced to good accuracy using the method by imposing a realistic bias.
Data Availability
The raw data supporting the conclusions of this manuscript will be made available by the authors, without undue reservation, to any qualified researcher.
Author Contributions
JW wrote the manuscript and created necessary programming tools with the help from JJ and JS. JS devised the chain approximation approach to satisfying arc length constraints. JW and JJ devised the data assimilation procedure. JW developed the formalism in consultation with JJ, JS, AP, IK, and ES. JW, JJ, JS, AP, IK, and ES contributed to discussing the scope and advantages of the method.
Funding
Work at Andrews University was performed under NASA Grants NNX17AI47G, NNX16AR10G, NNH15AB17I, NNX16AQ87G, NNX17AI50G, NNX15AJ01G, and 80NSSC18K0835 and NSF Grant AGS1832207.
Conflict of Interest Statement
The authors declare that the research was conducted in the absence of any commercial or financial relationships that could be construed as a potential conflict of interest.
Acknowledgments
We thank the National Science Foundation and the National Aeronautics and Space Administration for supporting this research.
References
Cheng, C. Z. (1995). Three-dimensional magnetospheric equilibrium with isotropic pressure. Geophys. Res. Lett. 22, 2401–2404. doi: 10.2172/61213
Galvez, M., and Borovsky, J. E. (1988). The electrostatic two-stream instability driven by slab-shaped and cylindrical beams injected into plasmas. Phys. Fluids 31:857. doi: 10.1063/1.866767
Gardner, C. S. (1966). Magnetic moment to second order for axisymmetric static field. Phys. Fluids 9:1997. doi: 10.1063/1.1761557
Gilchrist, B. E., Khazanov, G., Krause, L. H., and Neubert, T. (2001). Study of Relativistic Electron Beam Propagation in the Atmosphere-Ionosphere-Magnetosphere. Technical report, University of Michigan, Ann Arbor, MI.
Janhunen, P., Palmroth, M., Laitinen, T., Honkonen, I., Juusola, L., Facskó, G., et al. (2012). The GUMICS-4 global MHD magnetosphere–ionosphere coupling simulation. J. Atmos. Solar Terr. Phys. 80, 48–59. doi: 10.1016/j.jastp.2012.03.006
Kondrashov, D., Shprits, Y., Ghil, M., and Thorne, R. (2007). A Kalman filter technique to estimate relativistic electron lifetimes in the outer radiation belt. J. Geophys. Res. Space Phys. 112:A10227. doi: 10.1029/2007JA012583
Lyon, J., Fedder, J., and Mobarry, C. (2004). The lyon–fedder–mobarry (LFM) global MHD magnetospheric simulation code. J. Atmos. Solar Terr. Phys. 66, 1333–1350. doi: 10.1016/j.jastp.2004.03.020
Marshall, R. A., and Bortnik, J. (2018). Pitch angle dependence of energetic electron precipitation: energy deposition, backscatter, and the bounce loss cone. J. Geophys. Res. Space Phys. 123, 2412–2423. doi: 10.1002/2017JA024873
Marshall, R. A., Nicolls, M., Sanchez, E., Lehtinen, N. G., and Neilson, J. (2014). Diagnostics of an artificial relativistic electron beam interacting with the atmosphere. J. Geophys. Res. Space Phys. 119, 8560–8577. doi: 10.1002/2014JA020427
Marshall, R. A., Xu, W., Kero, A., Kabirzadeh, R., and Sanchez, E. (2019). Atmospheric effects of a relativistic electron beam injected from above: chemistry, electrodynamics, and radio scattering. Front. Astron. Space Sci. 6:6. doi: 10.3389/fspas.2019.00006
Merkin, V. G., Kondrashov, D., Ghil, M., and Anderson, B. J. (2016). Data assimilation of low-altitude magnetic perturbations into a global magnetosphere model. Space Weather 14, 165–184. doi: 10.1002/2015SW001330
Neubert, T., and Banks, P. M. (1992). Recent results from studies of electron beam phenomena in space plasmas. Planet. Space Sci. 40, 153–183. doi: 10.1016/0032-0633(92)90055-S
Richmond, A. (1992). Assimilative mapping of ionospheric electrodynamics. Adv. Space Res. 12, 59–68. doi: 10.1016/0273-1177(92)90040-5
Schunk, R. W., Scherliess, L., Sojka, J. J., Thompson, D. C., Anderson, D. N., Codrescu, M., et al. (2004). Global Assimilation of Ionospheric Measurements (GAIM). Radio Sci. 39:RS1S02. doi: 10.1029/2002RS002794
Tóth, G., De Zeeuw, D. L., Gombosi, T. I., Manchester, W. B., Ridley, A. J., Sokolov, I. V., et al. (2007). Sun-to-thermosphere simulation of the 28-30 October 2003 storm with the Space Weather Modeling Framework. Space Weather. 5:S06003. doi: 10.1029/2006SW000272
Tsyganenko, N. (1989). A magnetospheric magnetic field model with a warped tail current sheet. Planet. Space Sci. 37, 5–20. doi: 10.1016/0032-0633(89)90066-4
Willard, J. M., Johnson, J. R., Snelling, J. M., Powis, A. T., Kaganovich, I. D., and Sanchez, E. R. (2019). Effect of field-line curvature on the ionospheric accessibility of relativistic electron beam experiments. Front. Astron. Space Sci. 6:56. doi: 10.3389/fspas.2019.00056
Winckler, J. R. (1980). The application of artificial electron beams to magnetospheric research. Rev. Geophys. 18:659. doi: 10.1029/RG018i003p00659
Zaharia, S., Birn, J., and Cheng, C. Z. (2005). Toward a global magnetospheric equilibrium model. J. Geophys. Res. 110:A09228. doi: 10.1029/2005JA011101
Keywords: field-line geometry, data assimilation, field-line approximation, beam injection from space, energy-variable accelerator
Citation: Willard JM, Johnson JR, Snelling JM, Powis AT, Kaganovich ID and Sanchez ER (2019) Method for Approximating Field-Line Curves Using Ionospheric Observations of Energy-Variable Electron Beams Launched From Satellites. Front. Astron. Space Sci. 6:59. doi: 10.3389/fspas.2019.00059
Received: 20 December 2019; Accepted: 26 August 2019;
Published: 18 September 2019.
Edited by:
Joseph Eric Borovsky, Space Science Institute, United StatesReviewed by:
Mark Eric Dieckmann, Linköping University, SwedenMichael Schulz, Lockheed Martin Solar and Astrophysics Laboratory (LMSAL), United States
Copyright © 2019 Willard, Johnson, Snelling, Powis, Kaganovich and Sanchez. This is an open-access article distributed under the terms of the Creative Commons Attribution License (CC BY). The use, distribution or reproduction in other forums is permitted, provided the original author(s) and the copyright owner(s) are credited and that the original publication in this journal is cited, in accordance with accepted academic practice. No use, distribution or reproduction is permitted which does not comply with these terms.
*Correspondence: Jake M. Willard, d2lsbGFyZEBhbmRyZXdzLmVkdQ==
 Jake M. Willard
 Jay R. Johnson
 Jesse M. Snelling
 Andrew T. Powis
 Igor D. Kaganovich
 Ennio R. Sanchez