 Joseph Rungee
 Qin Ma
 Michael L. Goulden3
 Roger Bales
- 1Sierra Nevada Research Institute, University of California, Merced, Merced, CA, United States
- 2Department of Forestry, Mississippi State University, Starkville, MS, United States
- 3Department of Earth System Science, University of California, Irvine, Irvine, CA, United States
Spatially resolved annual evapotranspiration was calculated across the 14 main river basins draining into California's Central Valley, USA, using a statistical model that combined satellite greenness, gridded precipitation, and flux-tower measurements. Annual evapotranspiration across the study area averaged 529 mm. Average basin-scale annual precipitation minus evapotranspiration was in good agreement with annual runoff, with deviations in wet and dry years suggesting withdrawal or recharge of subsurface water storage. Evapotranspiration peaked at lower elevations in the colder, northern basins, and at higher elevations in the southern high-Sierra basins, closely tracking the 12.3°C mean temperature isocline. Precipitation and evapotranspiration are closely balanced across much of the study region, and small shifts in either will cause disproportionate changes in water storage and runoff. The majority of runoff was generated below the rain-snow transition in northern basins, and originated in snow-dominated elevations in the southern basins. Climate warming that increases growing season length will increase evapotranspiration and reduce runoff across all elevations in the north, but only at higher elevations in the south. Feedback mechanisms in these steep mountain basins, plus over-year subsurface storage, with their steep precipitation and temperature gradients, provide important buffering of the water balance to change. Leave-one-out cross validation revealed that the statistical model for annual evapotranspiration is sensitive to the number and distribution of measurement sites, implying that additional strategically located flux towers would improve evapotranspiration predictions. Leave-one-out with individual years was less sensitive, implying that longer records are less important. This statistical top-down modeling of evapotranspiration provides an important complement to constraining water-balance measurements with gridded precipitation and unimpaired runoff, with applications such as quantifying water balance following forest die-off, management or wildfire.
Introduction
Predicting responses of basin-scale water balances to variability and change is important for managing source-water areas, particularly in semi-arid mountain basins with a high ratio of evapotranspiration to precipitation. As mountain basins provide water to sustain ecosystems and human societies around the world, predicting the response of runoff to a warming climate and the associated changes in vegetation water use within the basin, as well as seasonal shifts in runoff patterns, are key to informing decisions that will affect our global sustainable future (Messerli et al., 2004). Four important feedback mechanisms affect the relation between precipitation and runoff in the Sierra Nevada, and many other mountain basins worldwide (Bales et al., 2018a). The annual water balance, given as Q = P – ET – ΔS, where Q is basin discharge (runoff), P is precipitation, ET is evapotranspiration, and ΔS is the change in subsurface storage within the basin, responds to interannual and longer changes in precipitation and temperature. The effect of changes in precipitation and temperature on water supply (Q) therefore reflects the difference between P and (ET + ΔS). For example, a drop in P directly reduces Q, but quantifying this non-linear impact is complicated by the additional effects of precipitation changes on ET and ΔS.
The first mechanism that affects the relation between P and Q is that evaporative processes have first access to local precipitation, which means that a greater fraction of P goes to ET during dry periods and a smaller fraction during wet periods (Bales et al., 2018a). This can be seen by a plot of P vs. Q for the 4800 km2 American River basin in the central Sierra Nevada, which closely parallels the 1:1 line (slope of 0.92) across a wide range of annual precipitation data (Figures 1, 2A). This plot also highlights a second mechanism, the role of subsurface water storage attenuating the effects of inter-annual P on ET (Klos et al., 2018). Where the difference between P and Q, commonly used to estimate ET, is relatively constant despite 5-fold differences in precipitation between the wettest and driest years (Figure 2B). This can also be seen in plots of annual P and ET vs. elevation for the Kings River basin in the southern Sierra Nevada (Figure 3). A third mechanism apparent in Figure 3 is that runoff from higher elevations helps sustain Q in dry years, such as 2012–15; and a fourth mechanism affecting the P-Q relation is the lower ET in 2016 resulting from drought-associated dieback and wildfire, decreasing vegetation water use (Bales et al., 2018a).
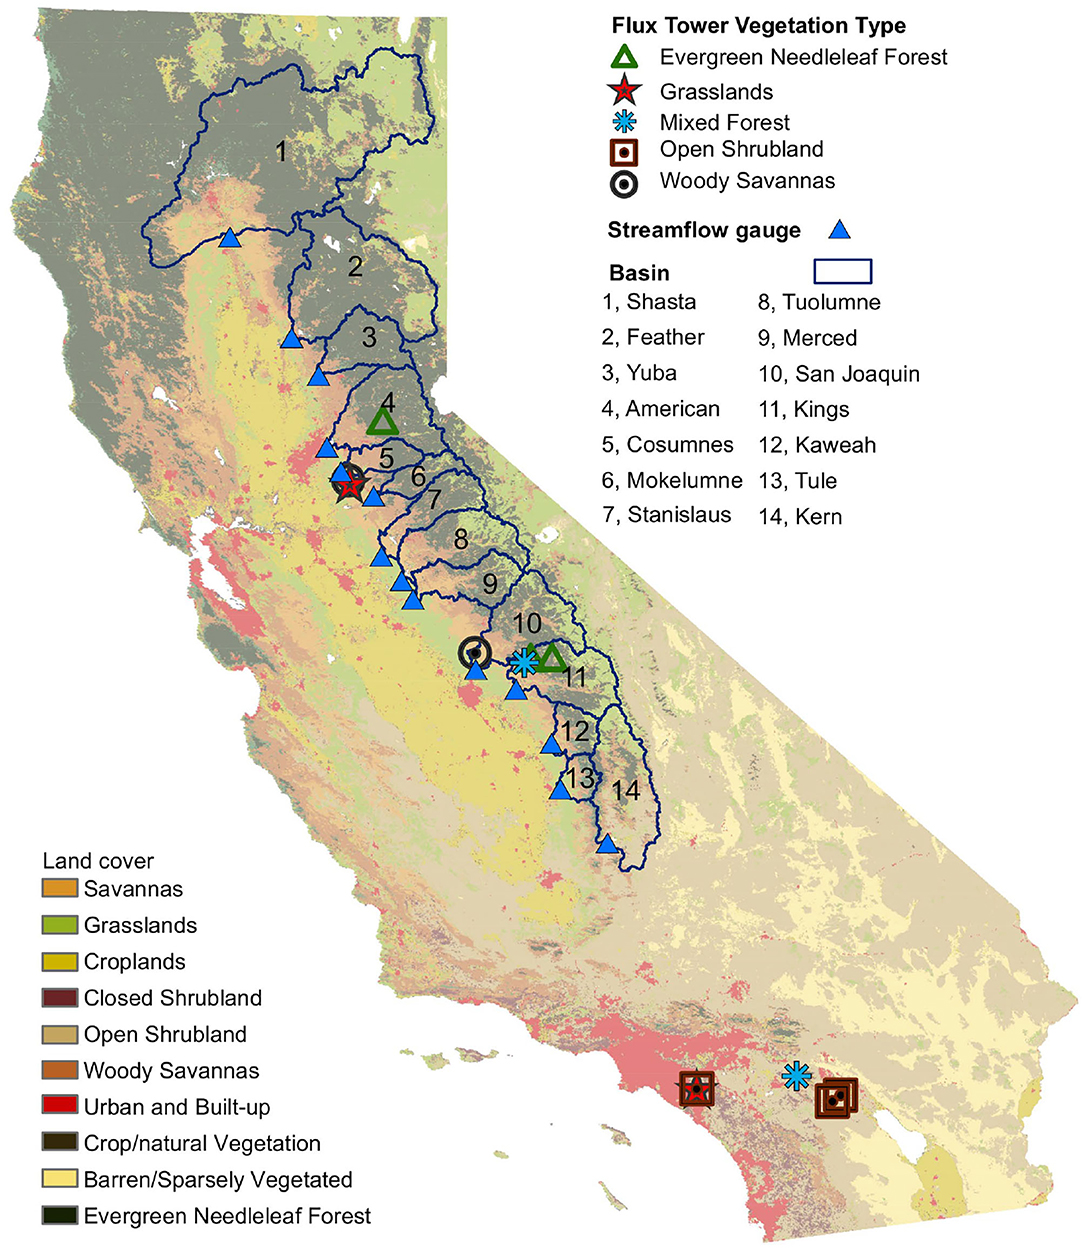
Figure 1. Study area showing locations of flux towers and land-cover classification, unimpaired streamflow gauges, and delineated river basins. The background shows the International Geosphere-Biosphere Programme land cover types.
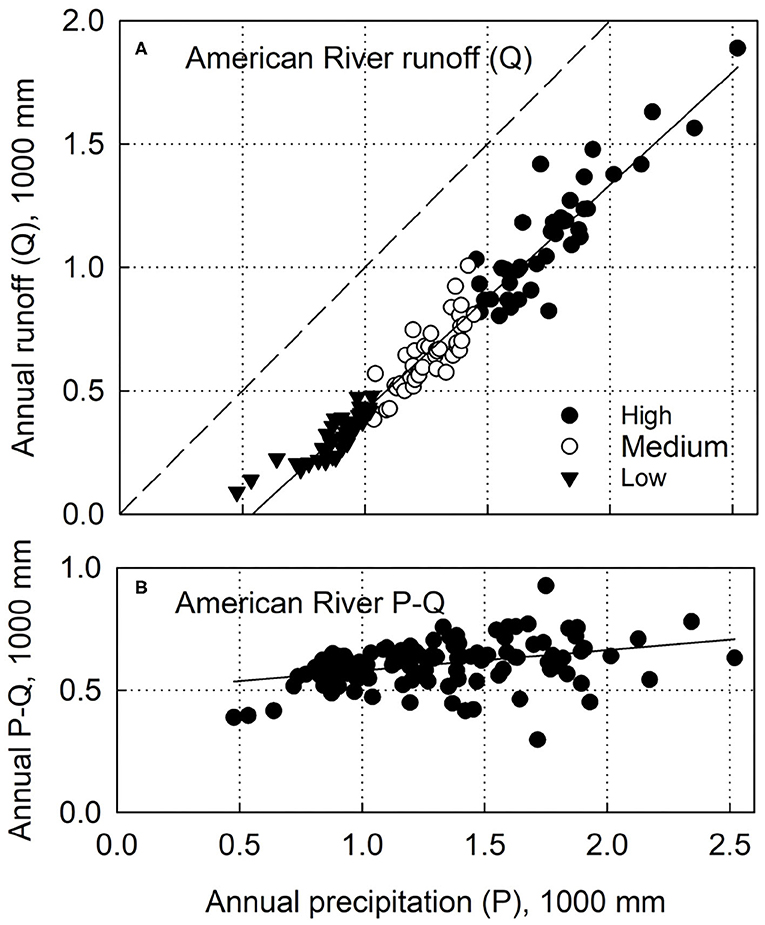
Figure 2. Historical water-year (A) runoff and (B) precipitation minus discharge vs. annual precipitation for American River basin, 1901–2018. Runoff is full-natural flow, the calculated runoff that would occur in the absence of human influences (dams, diversions); data from California Department of Water Resources (http://cdec.water.ca.gov/), accessed Nov 27, 2020. Data are plotted by terciles for low, medium and high precipitation years. Basin-average precipitation summed from 800-m PRISM product (http://www.prism.oregonstate.edu), for area above runoff measurement point below Folsom Reservoir.
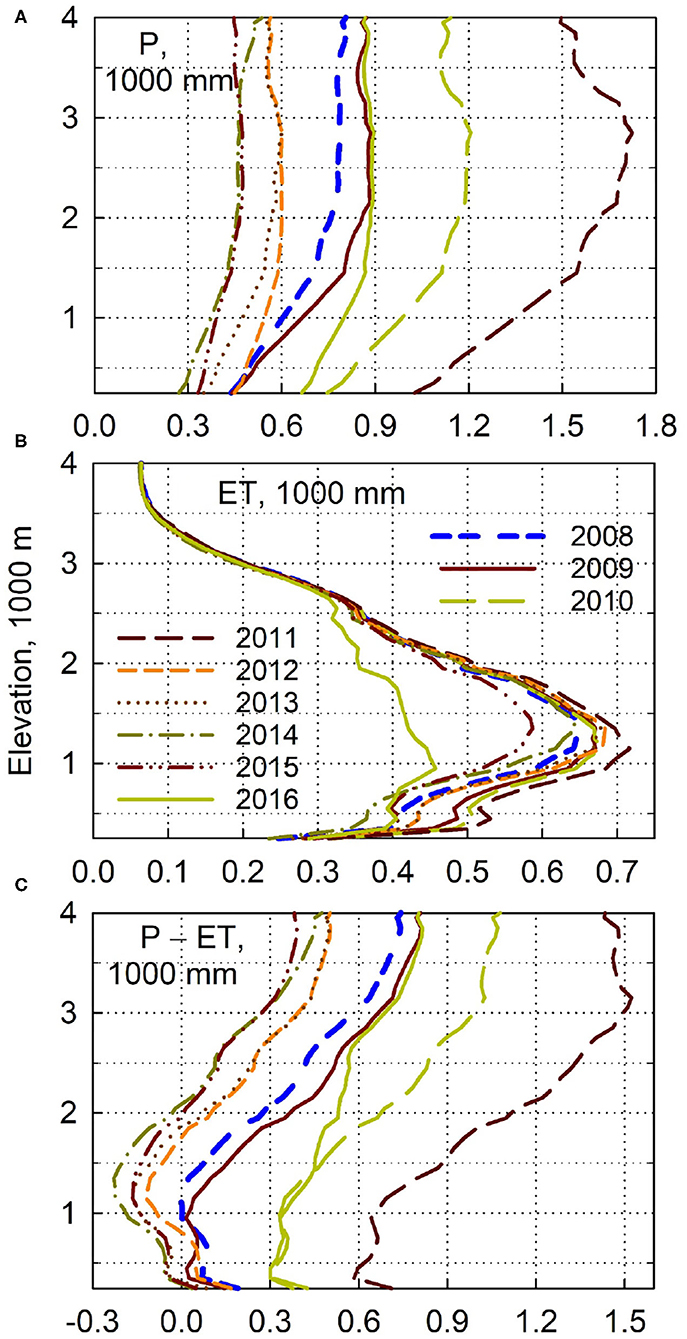
Figure 3. Elevation profiles of annual (A) precipitation (P), (B) evapotranspiration (ET), and (C) P – ET by water year for the Kings River basin. Adapted from Bales et al. (2018b).
In order to assess the response patterns of evapotranspiration and runoff to variability and change, we need independent estimates of these three quantities (P, Q, ET). Eddy-covariance provides a direct measure of evapotranspiration at the local scale (0.01–1.0 km2), and has been cited as the most-accurate approach for measuring evapotranspiration (Rana and Katerji, 2000; Wilson and Baldocchi, 2000; Wang et al., 2015). Flux towers have been installed around the globe over the last 20 years to measure water, carbon and energy exchanges across various climates and land-cover types (Ryu et al., 2008). Multi-year, continuous time-series data are increasingly available, providing information on both average evapotranspiration and responses to meteorological variability. Upscaling can be by either data-driven or data-assimilation methods, with the former based on empirical, statistical models trained with flux observations and explanatory variables such as vegetation indices and climate (Glenn et al., 2010; Xiao et al., 2012).
Physically based methods for estimating ET are derived from surface-energy-budget equations such as Penman-Monteith (Mu et al., 2007, 2011) and Priestley-Taylor (Jin et al., 2011). While these methods provide a more mechanistic representation of evapotranspiration (Zheng et al., 2017), they require multiple accurate meteorological and biophysical inputs that have high spatial variability in mountain regions (Goulden et al., 2012; Wang et al., 2015; Lettenmaier, 2017). Current methods to estimate evapotranspiration across the landscape have been shown to produce considerable differences in evapotranspiration (Chen et al., 2014). This is due in part to the spatial and temporal variability of evapotranspiration, especially in Mediterranean-climate mountainous regions with distinct wet and dry seasons, high heterogeneity in topography and land cover, and sharp gradients in precipitation and temperature (Bales et al., 2006). Evapotranspiration is often estimated through model simulations, as the residual of extrapolated precipitation and runoff, or as its potential using an empirical relationship with temperature and validated with pan evaporation (Farahani et al., 2007; Ryu et al., 2008). While this has proven acceptable in some cases, it is subject to large errors owing to competing processes (Wilson et al., 2001; Wang et al., 2015). Physically based models may ultimately provide the best solution for quantifying evapotranspiration in heterogeneous terrain, but are currently bottlenecked by inadequate input data (Goulden and Bales, 2014).
Satellite-based observations are especially useful for extrapolating evapotranspiration to regional and global scales (Allen et al., 2007; Jung et al., 2010; Goulden et al., 2012; Chen et al., 2014). Many studies have revealed a strong correlation between annual evapotranspiration and vegetation indices such as NDVI (normalized difference vegetation index) and EVI (enhanced vegetation index) in semi-arid regions (Groeneveld et al., 2007; Goulden et al., 2012). However, vegetation indices may miss the variability of evapotranspiration during meteorological extremes and droughts, and in regions dominated by evergreen forests (Nagler et al., 2005). It has also been shown that current flux towers do not cover all combinations of climate and vegetation (Rungee et al., 2019). It is thus important to develop scaling strategies to extend measurements beyond the areas sampled.
California provides an opportune study area to use statistical scaling of evapotranspiration, owing to the presence of several multi-year flux-tower datasets sampling many of the major vegetation types in the state. In this study we focus on 14 mountainous river basins draining into California's Central Valley, building on prior success in closing the annual water balance in the Kings River basin in the southern Sierra Nevada (Bales et al., 2018a). Our primary objectives were to use the 14 study basins to: (1) assess how well-statistical scaling of measured evapotranspiration at an annual time step matches available data on precipitation minus runoff, (2) map areas across elevation, precipitation and temperature gradients where evapotranspiration closely matches average annual precipitation, vs. areas where precipitation exceeds evapotranspiration and thus runoff originates, and assess how feedbacks may buffer water-balance responses to change across the large temperature and precipitation gradients in the study area, and (3) assess where limitations in estimating the components of the water balance exist and how uncertainty can be reduced.
Methods and Data
We used 111 measurements of annual evapotranspiration across 13 eddy-covariance flux towers (Table 1), plus remotely sensed NDVI from MODIS and Landsat and spatially distributed precipitation data, to scale annual evapotranspiration across the landscape, building on the method developed by Goulden et al. (2012) and expanded by Roche et al. (2020). The annual evapotranspiration product (ET) was subtracted from available gridded precipitation data (P), and the difference (P – ET) compared with published values of each basin's unimpaired runoff. Finally, gridded ET and P – ET values were binned by elevation and basin to assess the patterns with latitude, elevation, temperature and precipitation.
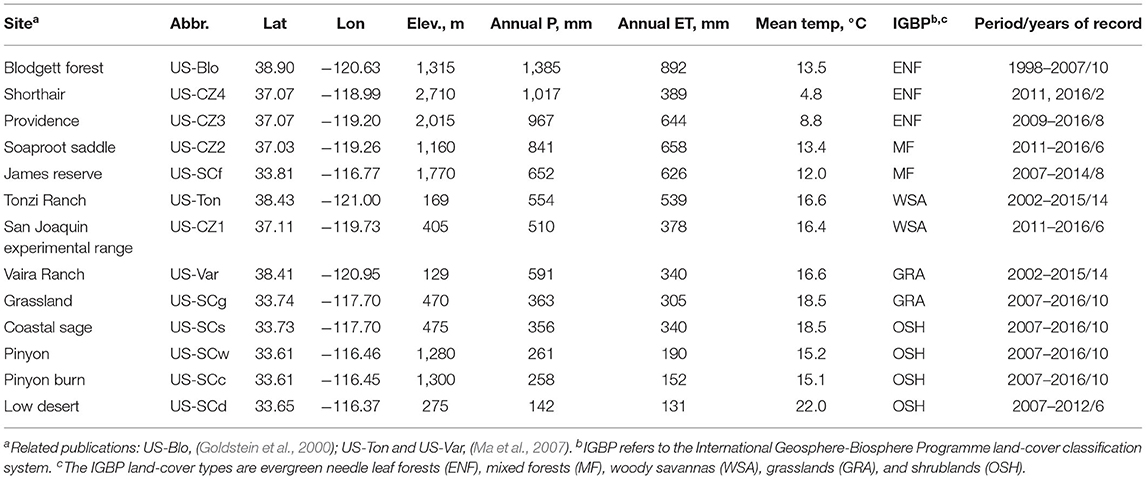
Table 1. Site characteristics.
Study Area
This study focused on the main 14 headwater river basins draining into California's Central Valley (Figure 1). California is characterized by a Mediterranean climate, experiencing mild to cold wet winters and mild to hot dry summers. The majority of annual precipitation in this region occurs during a few large storms (Bales et al., 2006; Dettinger et al., 2011). On average, 61% of California's annual precipitation is allocated to evapotranspiration in source-water river basins (DWR (California Department of Water Resources), 2014), and annual evapotranspiration can exceed annual precipitation during dry years, sustained by drawing from multi-year subsurface storage (Rungee et al., 2019).
Study-area elevation ranged from 37 to 4412 m, and basin mean-annual precipitation and temperature ranged from 561 to 1631 mm and 6.7 to 13.4°C, respectively. Five vegetation types make up 92% of the study area: evergreen needle leaf forests (56%, percent of total area), mixed forest (2%), open shrublands (3%), woody savannas (14%) and grasslands (17%).
Precipitation Data
Daily precipitation data were obtained from PRISM (Parameter-elevation Regression on Independent Slopes Model), (Daly et al., 2008). Both the 800-m and 4-km products were evaluated for developing the statistical scaling model for gridded evapotranspiration (ET). The same precipitation data were also averaged across each basin (P) and used to estimate runoff as the residual of P and ET.
Gridded Evapotranspiration Data
We evaluated both MODIS and Landsat NDVI, mapped at 250-and 30-m resolution, respectively, in order to scale evapotranspiration data taken at 13 eddy-covariance flux towers in California (Supplementary Table 1; Supplementary Figure 1) across the study area.
Landsat NDVI values were calculated from the Tier 1 surface-reflectance product downloaded from Google Earth Engine (Gorelick et al., 2017). Values among Landsat 5, 7 and 8 were homogenized by cross-calibrating Landsat 7 (NDVI in 2012–2013) and Landsat 8 (NDVI in 2014–2016) into Landsat 5 (Sulla-Menashe et al., 2016; Su et al., 2017). Annual Landsat NDVI maps were generated by averaging all pixels in a water year. Pixels with shadow, snow, or cloud were excluded from the calculation (Zhu and Woodcock, 2012). MODIS NDVI was obtained from the MYD13Q1.006 Terra Vegetation Indices 16-Day NDVI 250-m product, providing a continuous time series of maps from 2000 to 2016 (Didan, 2015). Annual MODIS NDVI maps were generated by averaging all pixels in a water year. The 250-m 16-day pixel-reliability band was used to detect and remove poor pixels.
A 0.5 × 1.0-km rectangle was used for flux-tower footprints, where the x direction is perpendicular to the mean-annual wind direction. Flux-tower coordinates were centered in the x direction (0.25-km on either side), consistent with relevant literature (Amiro, 1998; DuBois et al., 2018). Each footprint is dominated by a single vegetation category, although winds from different directions may sample different vegetation densities. More-precise estimates of each flux-tower footprint would require information on canopy structure, the distribution of sources and sinks, and atmospheric conditions to resolve complex and heterogeneous flows (Kljun et al., 2015). Owing to heterogeneity in the prevailing wind direction, the footprints for flux towers in southern California (James Reserve, Grassland, Coastal Sage, Pinyon, Pinyon Burn, and Low Desert) were viewed as the coordinate point determined most representative by Goulden et al. (2012).
NDVI explained 74% of the variance, but showed greater variability in measured evapotranspiration (ETm) than in NDVI, especially for mixed-forest and woody-savanna sites (Supplementary Figure 2A). At some sites NDVI has a smaller response to wet vs. dry years, possibly reflecting large multi-year storage or a lagged response to stress (Supplementary Figure 1), (Bales et al., 2018a). Precipitation explained 68% of the variance in measured evapotranspiration, with more outliers observed during dry years, most notably in forest sites (Supplementary Figure 2B), when some evapotranspiration is drawn from storage (Rungee et al., 2019). A combination of MODIS NDVI with 800-m PRISM precipitation produced the lowest error (Supplementary Figure 3), expressed as:
where ET is predicted evapotranspiration, NDVI is the normalized difference vegetation index based on MODIS, and PP is the mean of the current and previous years' precipitation based on the 800-m PRISM data (see Supplemental Material for details).
The model was used to estimate annual evapotranspiration, gridded across the 14 river basins, with whole-basin P-ET compared to unimpaired runoff. Trends by elevation and latitude were assessed by binning predicted ET, NDVI, P, T, and P – ET into 100-m elevation increments by basin. Finally, the difference of binned P – ET was multiplied by basin areas to calculate the elevational distribution of runoff origin.
Leave-one-out cross validation was used to assess the individual models' temporal and spatial sensitivities. Temporal sensitivities were assessed by removing an individual water year for model building and then evaluating on the water year removed. This was iterated over all water years on record. The number of site years of data removed varied between years, with only one active site in 2001, vs. eleven active sites in 2011. Spatial sensitivities were also assessed by removing an individual site for model building and then evaluating on the site removed. This was iterated over all sites, leading to 2 (US-CZ4) to 14 (US-Ton and US-Var) site years removed in a single iteration. Performance was assessed by comparing the root-mean-square and mean-absolute errors. Results show RMSE and MAE for the leave-one-year-out calculation to be near that for the model with all data, but higher for the leave-one-site-out option (Supplementary Figure 4).
Unimpaired Runoff
Calculations of unimpaired runoff, defined as the runoff from a basin considering no upstream damming, diversions or human alterations, were obtained from the California Data Exchange Center (CDEC) of the California Department of Water Resources (DWR), (accessed November 19, 2020). Values were taken for the United States Geological Survey (USGS) streamflow-gauge locations that best represented each of the 14 basins (Figure 1; Supplementary Table 1). All basins had water-year data for 1995–2016, except Shasta (1999–2016).
Elevation, Temperature and Snow Cover Data
The 30-m Shuttle Radar Topography Mission (SRTM, accessed January 16, 2018) digital-elevation data were downloaded from Google Earth Engine, and used to bin all data in 100-m elevation increments (Farr et al., 2007). The elevation labels refer to the lower limit of each bin (e.g., the 100-m label corresponds to 100–199 m). Temperature data were obtained from PRISM (see Precipitation Data). Snow-covered area was obtained from the snow reanalysis dataset developed from Landsat 5–8 data (Margulis et al., 2016). This dataset was used to determine the historical basin-mean rain-snow-transition elevation. January 1 to March 15 daily snow-covered-area maps were averaged by basin for each year and then over the 1985–2016 period. The averaged maps were then binned into 100-m elevation bands and linear interpolation was used between the two elevation bands above and below the 50% fractional-snow-covered area to estimate the altitudinal transition from rain to snow.
Results
Water-Balance Patterns by Elevation and Latitude
Equation 1 was used to estimate evapotranspiration (ET) across the Sierra Nevada for 16 years (2001–2016), with the period average shown on Figure 4. Temperature decreases with both latitude and elevation. The apparent temperature gradient is greatest between latitudes 36.1 and 37.8°, corresponding with the greatest range in elevation. While precipitation (P) increases with elevation in the central and southern Sierra, the pattern is mixed in the northern basins with no consistent elevation gradient owing to rain-shadow effects. The greatest ranges of annual P are observed at higher latitudes, with values exceeding 1,500 mm at high elevations. The patterns of NDVI and ET are similar. The lowest values of NDVI occurred at high elevations, and values exceeding 0.80 were generally observed between 37.7 and 39.2° latitude, and between 500 and 1,300 m elevation. The greatest NDVI value was observed at 41.4° latitude and 1,000 m elevation.
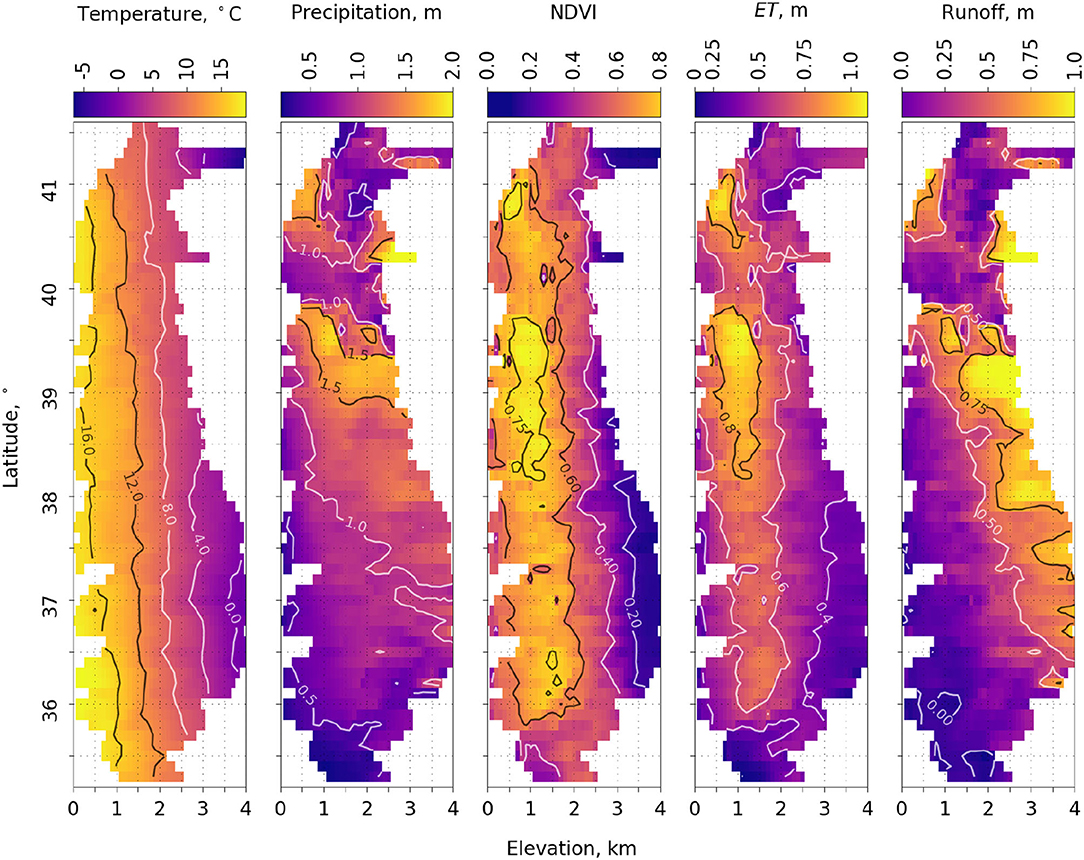
Figure 4. Maps of 2001–16 average 800-m PRISM temperature and precipitation, MODIS NDVI, predicted evapotranspiration (ET) (Equation 1), and runoff calculated as the difference of precipitation and evapotranspiration by latitude and elevation. Different color contour lines are to improve clarity only. See Supplementary Figure 5 for patterns of P, ET, and P – ET in wet, dry and normal years.
ET was greatest in the mid to higher latitudes, peaking at mid to lower elevations, and somewhat lower at lower latitudes (Figure 4). Latitude 39.7° had the greatest ET (1,023 mm) at an elevation of 1,000 m. Only latitudes above 39.5° observed ET values >1,000 mm, with these values at elevation 500–1,200 m. The lowest values of ET were generally observed at or near the highest elevations at all latitudes. Average annual ET across the Sierra Nevada is 529 mm. Peak ET generally followed the 12.3 ± 2.2°C (mean ± standard deviation) isocline. Runoff (Q), calculated as P – ET, showed that runoff is more efficiently generated at higher elevations. Q over 2,200 mm was observed at latitude 40.4° at 3,100-m elevation. Q approached zero at some lower-elevation, lower-latitude areas.
Basin-scale runoff vs. P – ET follows a 1:1 line, with an average offset of about 52 mm (Figure 5). Basins show a general increase from south to north, with the exception of the Shasta and Feather, which have a partial rain shadow (40–42°N on Figure 4), and lower-elevation Cosumnes basin (see Supplementary Figure 5 for whole-basin annual values). Interannual variability is lower in the 4 most-northern basins vs. 4 most-southern basins, with respective coefficients of variation of P – ET of 0.5–0.6 and 0.8–1.1 or higher (data on Supplementary Figure 6).
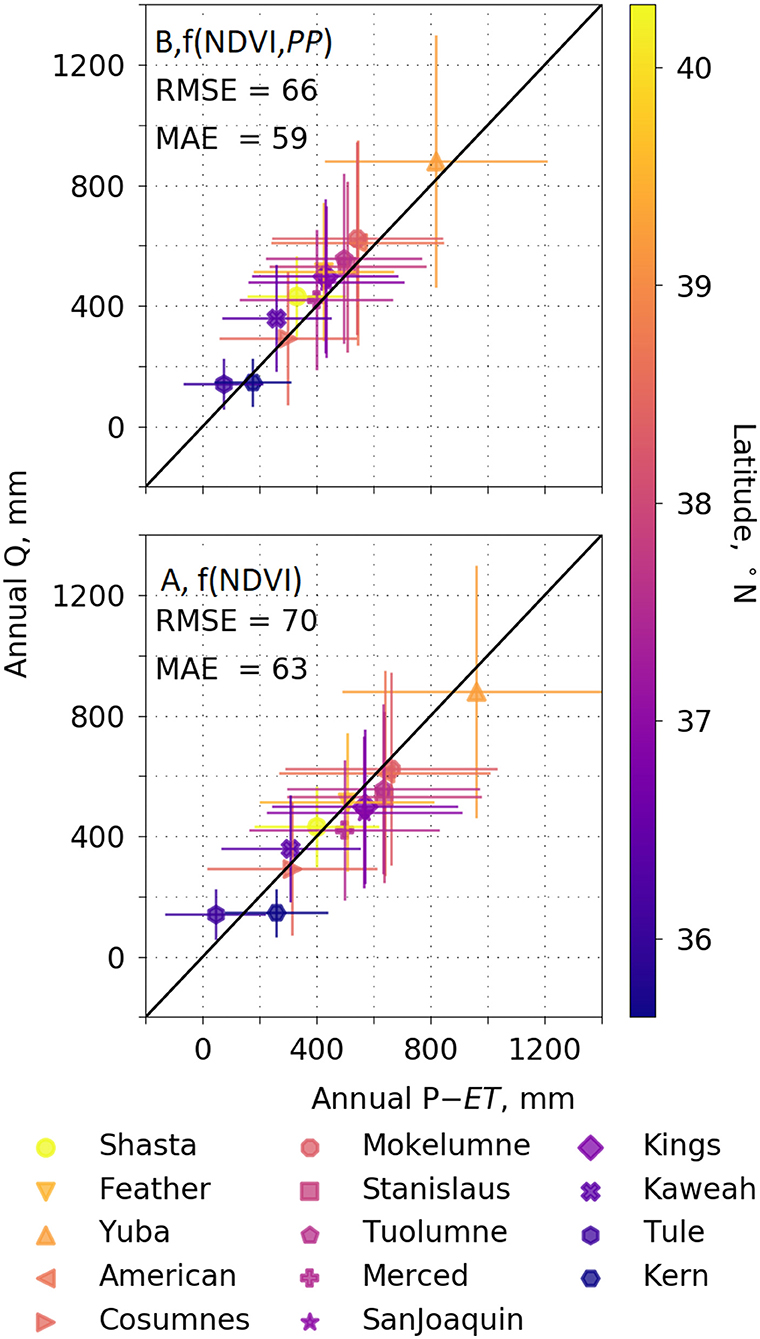
Figure 5. Water-year runoff for each of the 14 river basins on Figure 1 estimated as P – ET, vs. unimpaired flow (Q), averaged over 2001–2016. ET in the Upper panel is estimated from f(NDVI, PP) model, and in the bottom panel ET is from f(NDVI) model. Error bars show interannual variability. Annual values of P and ET for each basin can be seen in Supplementary Figure 5, and P – ET vs. Q by basin are on Supplementary Figure 5. See Supplementary Figure 6 for a comparison with the other input data and models evaluated.
Basin Runoff Generation
P increases with elevation in most basins, with the Shasta and Feather basins showing a rain-shadow zone centered on 1,500 m elevation (Figure 6a). ET peaks near the rain-snow transition elevation in most basins, being water limited below and energy limited above. ET peaks at a lower elevation in the Shasta and Feather basins, reflecting the rain shadow. The ratio of annual P to ET is greatest at higher elevations for all basins (Figure 6a). Q depends on the area at each elevation (Figure 6b), with Q coming mainly from the snow zone in most basins. Exceptions are the low-elevation Cosumnes and Shasta basins, and to some extend the Feather (Figure 6c). The ratio of P to ET ranges from 0.9 to 5.7 across all basins and elevation bins. On average, 61% of Q originates below the basin-mean rain-snow transition in more-northern basins (Shasta, Feather, Yuba, American and Cosumnes), with 79% originating above the rain-snow transition in the remaining basins. Overall, 65% of Q in the study area was from above the rain-snow transition (Figure 6c). ET exceeded P during several of the study years at 1,000–1,800 m elevation in the Tule, and 1,200–1,500 m in the Kaweah (Figure 6a). The snowline, or rain-snow-transition elevation, generally increases in elevation from north to south, and occurs near an annual temperature of 10.8 ± 0.8°C (mean ± standard deviation).
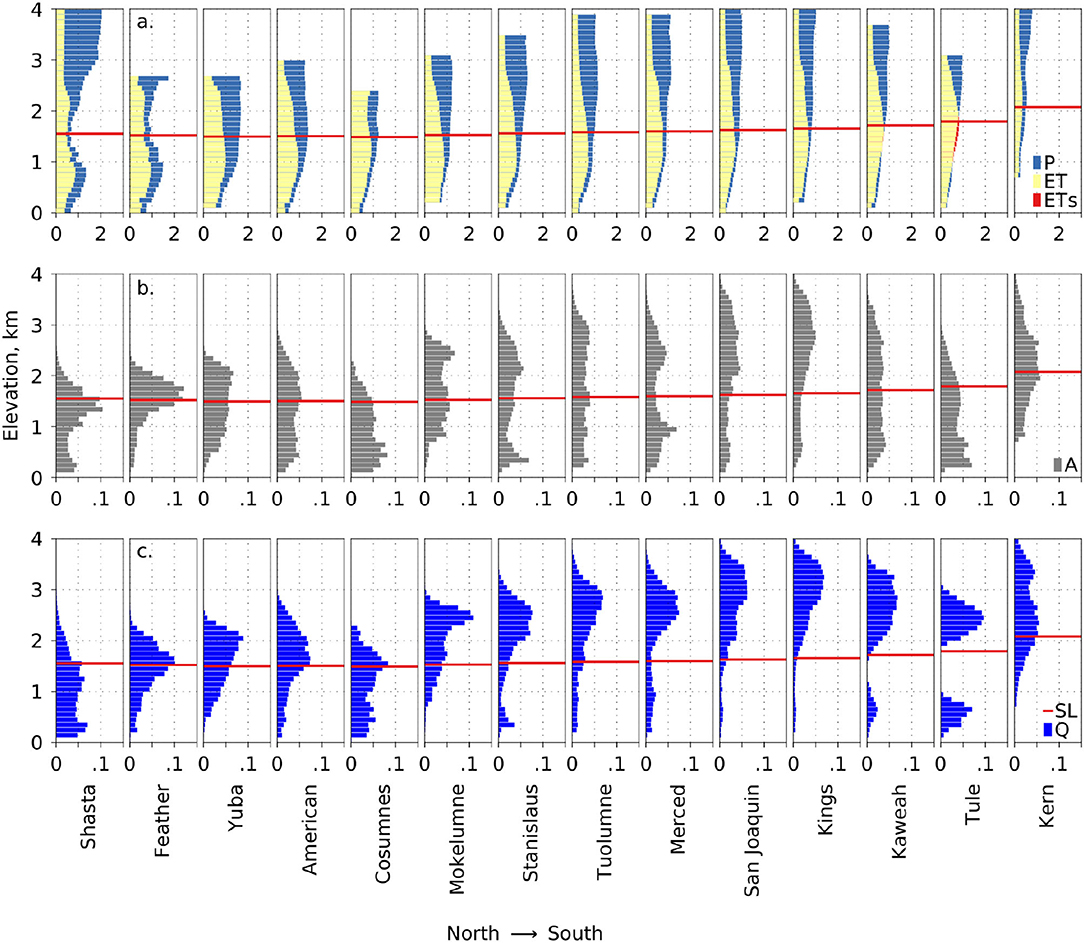
Figure 6. (a) mean-annual precipitation (P), evapotranspiration (ET) and evapotranspiration from storage (ETs) by basin and per 100 m in elevation; (b) fraction basin area by elevation; (c) fraction of volumetric runoff by elevation. The snowline (SL) indicates the historical rain-snow transition.
Discussion
Basin-Scale P-ET vs. Unimpaired Runoff
Our statistical approach for scaling evapotranspiration provides an independent assessment of water balance that can be compared to precipitation and unimpaired runoff. This provides an opportunity to carry out water-balance assessments at multiple scales. One important application for this analysis is estimating changes in evapotranspiration, and thus potential runoff following disturbance (Bales et al., 2018a; Roche et al., 2018; Ma et al., 2020) or forest thinning (Saksa et al., 2017; Roche et al., 2020). It should have further application for predictions in ungauged basins (Immerzeel and Droogers, 2008; Zhang et al., 2009).
Scaled evapotranspiration minus precipitation (P – ET) had an RMSE of 66 mm and MAE of 59 mm across all 224 basin years of data (Figure 5). While our estimated ET in the northern basins is less well-constrained by eddy-covariance measurements, it still provides an annual water-balance input that should have comparable uncertainty to P and to evapotranspiration estimated as precipitation minus reported values of unimpaired runoff. Basin-scale P – ET was about 358 mm per year, 11% lower than reported values of unimpaired runoff, for the six northern basins (Figure 5). This is within the uncertainty in streamflow measurements reported by Hayes et al. (1996) and Markham et al. (1996). The three most-northern basins have more volcanic bedrock and thus more subsurface flow than the more granitic basins further south, which may contribute to lower P – ET values. Uncertainty in both P and unimpaired runoff has also been reported (see discussion below). Binning the basin means into wet, dry, and normal years, based on the 35-year PRISM 800-m precipitation data, showed a negative bias in P – ET compared to unimpaired runoff of 52% during extreme dry years (lower 25th percentile), negative bias of 6% during the wet (upper 75th percentile), and 7% during normal years (between the 25th and 75th percentiles). Over the period studied, 28% were dry, 15% wet, and 57% normal years.
It is also possible that the difference between P – ET and unimpaired runoff reflects uncertainties in ET, especially at high elevations. A temperature component could be explored to help explain some of this uncertainty, as the relationship between temperature and evapotranspiration is generally positive (Goulden and Bales, 2014, 2019).
Where Does Basin Runoff Originate?
The values from Figure 6 show peak basin runoff (Q), estimated as P – ET, occurring 675 ± 250 m above peak ET in four of the more-northern basins (Feather, Yuba, American and Cosumnes) and 1,289 ± 558 m in the nine further-south basins (Mokelumne, Stanislaus, Tuolumne, Merced, San Joaquin, Kings, Kaweah, Tule and Kern). The ratio of potential runoff to precipitation (1-ET/P) was greater above the rain-snow transition than below for all basins. The ratio of potential runoff below the snowline was far greater in the northern (0.31) vs. southern (0.18) basins. This suggests that runoff generated in the southern basins is more sensitive to snowpack interannual variability. The importance of high-elevation P and P – ET can also be seen on the maps of wet, dry and normal years on Supplementary Figure 5. While the third mechanism, affecting P – ET, the resilience of runoff in basins with large areas in the snow zone, is currently strong, it will weaken with a higher snowline.
These two modes of runoff generation suggest that a warming climate will affect the water balance of southern vs. northern basins through different mechanisms. Increasing temperature is expected to increase evapotranspiration in energy-limited forests, even if vegetation density remains constant, leading to decreased runoff (Goulden and Bales, 2019). The northern basins are predominantly energy limited, as indicated by the overall temperature patterns on Figure 4, and have abundant water, making them susceptible to this effect. The northern set (Shasta, Feather, Yuba, American and Cosumnes) includes basins that have historically been critical for California's water supply. The southern basins are mostly water limited at lower elevations and energy limited at higher elevations, as indicated by the snowline on Figure 6. Warming at lower elevations in the southern basins is unlikely to decrease runoff, given that ET approaches P in much of this area (Figure 6), but rather increase stress and episodic dieback (fourth mechanism affecting precipitation minus evapotranspiration). Most of the runoff in the south is from sparsely vegetated higher elevations that are currently energy limited. Warming that reduces this energy limitation and allows upslope vegetation expansion has the potential to reduce runoff (Goulden and Bales, 2014). However, vegetation colonization at high elevation is poorly understood, and may lag warming (Kelly and Goulden, 2008; Salzer et al., 2009).
Answers to three critical questions bear on the response of this region's water balance to warming. First, to what extent has and will warming accelerate evapotranspiration in lower-elevation, northern forests? Second, to what extent has and will warming increase episodic stress in lower elevation, southern forests? Third, how rapidly and to what extent will warming drive vegetation expansion at higher, southern locations? The recent 2012–2015 warm-dry period triggered feedbacks that reduced precipitation minus evapotranspiration in homogeneous vegetation basins. Feedbacks involved either evaporative processes receiving first access to available water or the 1°C above-average temperature resulting in above-average evapotranspiration (Bales et al., 2018a). The warm drought increased this difference in the heterogeneous Sierra Nevada basins, where runoff is generated at high elevations, or from reductions in evapotranspiration due to drought-induced forest dieback and wildfires. This motivates a fifth feedback mechanism affecting precipitation minus evapotranspiration that we have previously observed, the increase in evapotranspiration with warmer temperatures (Goulden and Bales, 2019), illustrated by the parallel increases in temperature and vegetation greenness over a 30-year period across the southern Sierra Nevada (Su et al., 2017).
There is a need to restore mountain watersheds in California and across the western United States by thinning overstocked forests; this effort may prioritize areas with important co-benefits for reducing the risk of high-intensity wildfire, enhancing stream runoff, sequestering carbon, and other services (Saksa et al., 2017; Krofcheck et al., 2018; Liang et al., 2018). This creates a need for more-accurate information about how hydrologic fluxes and stores respond to climate variability and change, and to predict responses of evapotranspiration and runoff to watershed management (Roche et al., 2018).
How Can Uncertainty Be Reduced?
Spatial Evapotranspiration
The leave-one-out evaluations showed that at the scale of the current analysis the statistical modeling of evapotranspiration is more sensitive to a lack of spatial vs. temporal sampling. RMSE for leave-one-year-out was 90, vs. 105 for leave-one-site-out, compared to 87 for all sites and site years included (see Supplementary Figure 7 for further comparisons). This corroborates Papale et al. (2015), who used an artificial neural network to upscale eddy-covariance flux-tower observations of latent heat and gross primary production, concluding that uncertainty in temporal extrapolation is relatively small compared to spatial extrapolation. Papale et al. (2015) also found that sample size affected uncertainty by ±25% in latent heat and ±50% in gross primary production, with uncertainty being greatest where spatial variability was high. Flux towers in the California sample the main vegetation types (Figure 1), and in P-T space sample about 17% of the land area (Figure 7). The current network underrepresents evapotranspiration in cooler areas (mean-annual temperature ≳2.5°C), with both high and low precipitation, and in wetter areas (mean-precipitation ≲1,500 mm) and thus high ET. Additional flux towers that sample these unrepresented areas would reduce extrapolation from warmer, drier areas to cooler, wetter areas.
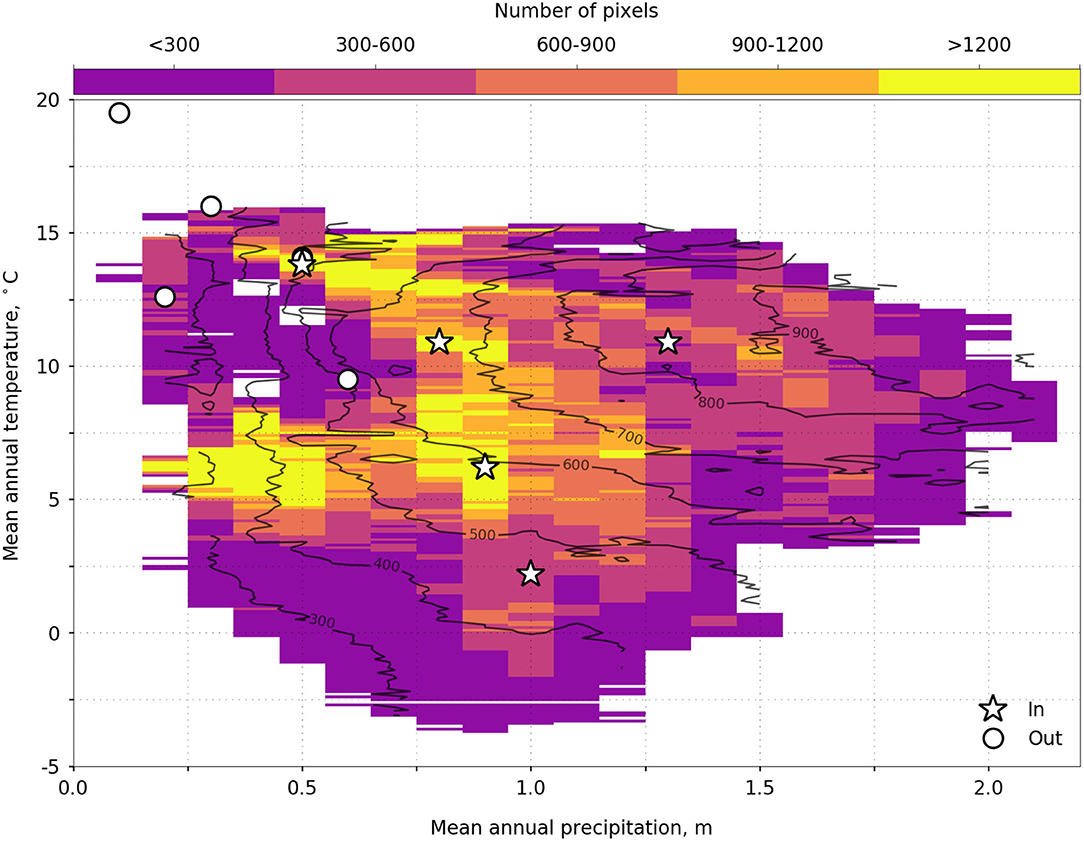
Figure 7. Flux tower representativeness of precipitation, temperature, and predicted evapotranspiration. Stars are flux towers within the boundary of the study area, and the circles are the remaining flux towers in California.
The slopes of the regression lines between P – ET and unimpaired runoff during wet and dry years were close to 1.0 (1.1 and 0.9, respectively), but offset about 54 mm higher for wet years and 96 mm lower for dry years (Supplementary Figure 7). The 54 mm offset above unimpaired runoff during wet years may be explained by a limited ability to constrain evapotranspiration at higher, energy-limited elevations where evapotranspiration will increase with precipitation. These areas in the Sierra Nevada are dominated by evergreen-needle leaf forests, which show a positive relationship between evapotranspiration and temperature (Goulden and Bales, 2019). The 96 mm offset below unimpaired runoff during dry years may be caused by an under measure of precipitation, an over measure of runoff, or evapotranspiration being supplemented by multi-year storage. PRISM and other gridded precipitation data show considerable differences in the high Sierra (Henn et al., 2018), in part reflecting a lack of representative data (Zhang et al., 2017). Lundquist et al. (2015) showed that some weather patterns are associated with a significant under measure of annual precipitation as snow in parts of the northern Sierra Nevada. Overall, the 51% uncertainty with P – ET during dry years represents 103 mm. It is important to note that evapotranspiration drawing on multi-year storage can account for some or all of this difference (Bales et al., 2018a; Klos et al., 2018; Rungee et al., 2019). Future research should consider strategies to improve data related to the water balance, including new precipitation measurements, assessment of the uncertainties in unimpaired runoff, and partitioning evapotranspiration source water into recent (current water year) and multi-year storage.
The slopes of P – ET vs. unimpaired runoff across years within individual basins ranged from 0.54 to 1.1 (Supplementary Figure 7). These slopes, and lower variability in P – ET compared to unimpaired runoff, may reflect basin-scale P – ET underestimates of unimpaired runoff during dry years when precipitation at some elevations is supplemented by multi-year subsurface water storage; and overestimates in wet years, when storage is replenished. The broader range of unimpaired runoff values compared to P – ET, after accounting for possible bias by adjusting the mean P-ET to match mean unimpaired runoff for each basin, may be interpreted as change in storage, where negative represents drawdown and positive represents recharge. Unimpaired runoff values also illustrate the bias in P – ET, with most P – ET values being < unimpaired runoff (Figure 5; Supplementary Figure 8).
MODIS NDVI outperformed Landsat NDVI in predictions of evapotranspiration, while differences in climate-data resolution had a negligible effect. MODIS provides daily scenes that are aggregated to 8-and 16-day cloud-free, atmospherically corrected composite images, whereas Landsat scenes are collected less frequently, leading to fewer cloud-free images. Snow and increased cloud cover during winter could lead to growing-season biased annual Landsat NDVI values. Future research is needed to assess the importance of seasonal biases in processing Landsat imagery in areas with snow cover. Further, Landsat NDVI has been found to be more sensitive to mountainous terrain, especially during months with low solar elevation, whereas MODIS NDVI was found to be notably insensitive (Sesnie et al., 2012). A 0.5-km2 footprint results in the inclusion of about 556 Landsat pixels vs. around eight for MODIS, making Landsat more sensitive to errors in footprint direction, shape and size.
The flux towers are mainly in water-limited vs. energy-limited locations, thus covering only part of the climatic range of the study area. The Sierra Nevada has been cited as especially under represented (Yang et al., 2008), although more flux towers have been added in the last decade.
Evapotranspiration Measurements
Regarding tower measurements, seven potential sources of uncertainty should be considered. Four sources of tower-based uncertainty previously evaluated for carbon dioxide (CO2) fluxes are applicable to evapotranspiration fluxes (Goulden et al., 2011): (i) measurement and aggregation accuracy, (ii) site-to-site and year-to-year precision, (iii) across-landscape sampling accuracy, and (iv) temporal sampling accuracy. Three sources of measurement and aggregation accuracy for CO2 fluxes have been identified (Goulden, 1996): (v) uniform systematic errors that are constant and independent of measurement conditions, (vi) selective systematic errors that result when the accuracy of the exchange measurement varies as a function of the physical environment, and (vii) sampling uncertainty that results when summing an incomplete data set to calculate long-term exchange. Three additional analyses should be considered when extrapolating tower-based ET to larger scales: (viii) statistical uncertainties in the model fit, i.e., not enough data points to know the true fit, (ix) weaknesses in the basic model, in that the independent variables will not give a perfect explanation of ET, and (x) extrapolation errors, i.e., estimating ET for climatic and/or vegetation conditions beyond the observations.
As issues related to the first two sources of uncertainty are also considered in v–vii, we focused on the latter three. As issues related to iii and iv are reduced by using remote-sensing data to spatially extrapolate, we put more emphasis on the last two sources (ix and x). For the middle block of tower-based uncertainties (v–vii), it is relevant to build on the findings from the analysis of CO2 fluxes by Goulden (1996). We addressed uniform systematic errors (v) by forcing closure of the energy balance following Twine et al. (2000), which enables improving upon uncertainties identified in CO2 flux estimates by Goulden (1996), which could be as much as 15–20%. The uncertainty in our ET fluxes, estimated to be up to 10%, is driven by uncertainty in the assumption that the Bowen Ratio is correct, uncertainty in soil and other heat-storage terms, and to a lesser extent net radiation. Selective systematic errors (vi), important for night time CO2 fluxes, should be relatively minor for ET, and are assumed to be up to 10%. Sampling uncertainty (vi) should be about 5%, similar to that estimated for CO2 (Goulden, 1996). Thus, the uncertainty of annual ET from an individual tower is about 20%. This uncertainty should be random from tower to tower, and to a lesser extent year to year, so the overall uncertainty should be less for the full dataset.
Precipitation
PRISM precipitation data have a reported monthly mean absolute error of 4.7 to 12.6 mm for the western U.S., leading to a potential annual error of ±98.2 mm (Daly et al., 2008). It has also been noted that across different gridded data sets, annual precipitation in the Sierra Nevada and other mountains of the western United States differ by up to 200 mm yr−1 (Henn et al., 2018). In addition, bias in point measurements used in the interpolation are biased, reflecting under catch due to wind, wetting loss, evaporation, and trace precipitation (Yang et al., 1999). Adjustments for errors in gauge measurements are done routinely, and in open, windy areas can be over 50% (Allerup et al., 2000; Bales et al., 2009; Ma et al., 2015; Mernild et al., 2015). In the Sierra Nevada, a comparison of PRISM precipitation with snow-water equivalent calculated from snow-pillow data has shown that PRISM precipitation can under measure some individual storms by 50% (Lundquist et al., 2015). However, in the Southern Sierra, Kirchner et al. (2014) found good agreement between LiDAR-measured snow accumulation and PRISM data above about 2,800 m. Nevertheless, it is likely that under catch leads to an underestimation of basin-scale evapotranspiration when estimated as the difference of PRISM precipitation and unimpaired runoff.
Overall, analyses suggest that PRISM data are less reliable in snow-dominated areas, and at sites with exceptionally low precipitation, where precipitation is extrapolated from distant meteorological stations. The total uncertainty in precipitation may thus be near or less than the reported west-wide potential annual interpolation error of ±98 mm for PRISM in rain-dominated areas with more data, and upwards of 50% or more in snow-dominated, open areas.
Unimpaired Runoff
Quantifying uncertainty in the unimpaired-runoff calculations remains a challenge. Updating instrumentation, data-processing and gap-filling techniques, and efforts to account for all diversions could improve this calculation. Further research is needed to quantify this uncertainty and assess benefits of better understanding the water balance of river basins. The Department of Water Resources (DWR) calculates unimpaired runoff by adding to measured streamflow the measured or estimated reservoir-storage change, reservoir evaporation, exports to other basins and diversions to irrigation, while subtracting imports from other basins and return flows from irrigation diversions to streamflow measurements downstream of the basins' major reservoirs (Qualley et al., 2000). Uncertainty results from: (i) unmeasured diversions, (ii) using historical monthly data for changes in storage, imports and exports where measured data are unavailable, (iii) estimates of open-water evaporation where measurements are unavailable, and (iv) correction adjustments made with constant values if measurements are unavailable. Discussions with DWR personnel revealed they have not estimated sources of uncertainty, and generally do not feel they are large. However, it is likely that uncertainty in annual unimpaired runoff is at least as much as the 10% bound reported for USGS measurements.
The USGS has reported estimates of stream-gauge accuracy for eight of the reservoir gauges relevant to this study, and reported that measurements from these gauges are generally within 10% of true, with one showing poor accuracy (uncertainty >15%) during extreme low-flow events (Hayes et al., 1996; Markham et al., 1996). Note that these are only for daily streamflow measurements and not estimates of annual unimpaired runoff.
Conclusion
Statistical scaling of evapotranspiration (ET) was, on average, in good agreement when compared with reported values of unimpaired runoff as precipitation (P) minus ET. Interannual variability provided further evidence of the availability of multi-year storage, where P – ET was generally <Q during dry years, suggesting a drawdown of storage, and greater in wet years, suggesting storage recharge. Improved estimates of the subsurface water storage flux can help forest managers link the relationship between drought, vegetation die-off and fire risk, and assess the effectiveness of treatments to mitigate these hazards.
We found that ET is greatest in northern basins peaking at mid elevation, and lower in magnitude but peaking at higher elevations further south. Runoff, estimated as P-ET, in northern basins was generated primarily below the rain-snow-transition, where P exceeded ET, and at higher elevations in the southern basins where evapotranspiration is energy limited. The runoff volume in northern basins under a warmer climate is particularly vulnerable to increased evaporative demand, whereas the steep temperature gradient with elevation in the southern basins may somewhat limit this effect.
The statistical scaling of evapotranspiration showed no significant sensitivity to resolution of gridded climatic data, and a slight sensitivity to the use of MODIS vs. Landsat NDVI. Precipitation remains a large uncertainty in closing the water balance across mountain basins and limits our ability to quantitatively assess the impact of forest die-off, disturbance and annual meteorology on runoff. The current placement of eddy-covariance flux towers showed that parts of the precipitation-temperature space are not sampled, leading to the greatest source of uncertainty in predicted evapotranspiration. Additionally, strategically placed instrumentation could improve the understanding and representation of this system.
Data Availability Statement
The datasets presented in this study can be found in online repositories. The names of the repository/repositories and accession number(s) can be found below: https://datadryad.org/stash/dataset/10.6071/M3M660.
Author Contributions
JR developed the majority of the spatial products, performed all analyses, and wrote parts of the manuscript. QM aided in development of the spatial products. MG helped develop the gap-filling and spatial extrapolation approach used. RB developed the research idea and edited and revised the manuscript. All authors contributed to the article and approved the submitted version.
Funding
This research was supported by the National Science Foundation through the Southern Sierra Critical Zone Observatory (EAR-0725097, 1239521, and 1331939), and the UC Water Security and Sustainability Research Initiative (Grant No. 13941), and the USDA National Institute of Food and Agriculture, McIntire Stennis project 1022944.
Conflict of Interest
The authors declare that the research was conducted in the absence of any commercial or financial relationships that could be construed as a potential conflict of interest.
Publisher's Note
All claims expressed in this article are solely those of the authors and do not necessarily represent those of their affiliated organizations, or those of the publisher, the editors and the reviewers. Any product that may be evaluated in this article, or claim that may be made by its manufacturer, is not guaranteed or endorsed by the publisher.
Acknowledgments
We would like to forward our sincere thanks to Sean de Guzman and the California Department of Water Resources for providing data and in-depth detail of the methods for calculating unimpaired runoff, and to the reviewers and editors for comments that greatly improved the manuscript. Eddy-covariance data are available at https://ameriflux.lbl.gov/. PRISM data are accessible at http://www.prism.oregonstate.edu/. MODIS data can be accessed at https://modis.gsfc.nasa.gov/data/. Landsat data are available at https://landsat.usgs.gov/landsat-surface-reflectance-data-products. Snow-water equivalent data can be accessed at https://margulis-group.github.io/data/. Unimpaired runoff data are accessible at https://cdec.water.ca.gov/. SRTM data are available at https://www2.jpl.nasa.gov/srtm/.
Supplementary Material
The Supplementary Material for this article can be found online at: https://www.frontiersin.org/articles/10.3389/frwa.2021.655485/full#supplementary-material
References
Allen, R. G., Tasumi, M., and Trezza, R. (2007). Satellite-based energy balance for mapping evapotranspiration with internalized calibration (METRIC)—model. J. Irrig. Drain. Eng. 133, 380–394. doi: 10.1061/(ASCE)0733-9437(2007)133:4(380)
Allerup, P., Madsen, H., and Vejen, F. (2000). Correction of precipitation based on off-site weather information. Atmos. Res. 53, 231–250. doi: 10.1016/S0169-8095(99)00051-4
Amiro, B. D. (1998). Footprint climatologies for evapotranspiration in a boreal catchment. Agric. For. Meteorol. 90, 195–201. doi: 10.1016/S0168-1923(97)00096-8
Bales, R., Stacy, E., Safeeq, M., Meng, X., Meadows, M., Oroza, C., et al. (2018b). Spatially distributed water-balance and meteorological data from the rain-snow transition, southern Sierra Nevada, California. Earth Syst. Sci. Data. 10, 1795–1805. doi: 10.5194/essd-10-1795-2018
Bales, R. C., Goulden, M. L., Hunsaker, C. T., Conklin, M. H., Hartsough, P. C., O'Geen, A. T., et al. (2018a). Mechanisms controlling the impact of multi-year drought on mountain hydrology. Sci. Rep. 8:690. doi: 10.1038/s41598-017-19007-0
Bales, R. C., Guo, Q., Shen, D., McConnell, J. R., Du, G., Burkhart, J. F., et al. (2009). Annual accumulation for Greenland updated using ice core data developed during 2000–2006 and analysis of daily coastal meteorological data. J. Geophys. Res. Atmos. 114:D6. doi: 10.1029/2008JD011208
Bales, R. C., Molotch, N. P., Painter, T. H., Dettinger, M. D., Rice, R., and Dozier, J. (2006). Mountain hydrology of the western United States. Water Resour. Res. 42, 1–13. doi: 10.1029/2005WR004387
Chen, Y., Xia, J., Liang, S., Feng, J., Fisher, J. B., Li, X. X., et al. (2014). Comparison of satellite-based evapotranspiration models over terrestrial ecosystems in China. Remote Sens. Environ. 140, 279–293. doi: 10.1016/j.rse.2013.08.045
Daly, C., Halbleib, M., Smith, J. I., Gibson, W. P., Doggett, M. K., Taylor, G. H., et al. (2008). Physiographical sensitive mapping of climatological temperature and precipitation across the conterminous United States. Int. J. Climatol. 28, 2031–2064. doi: 10.1002/joc.1688
Dettinger, M. D., Ralph, F. M., Das, T., Neiman, P. J., and Cayan, D. R. (2011). Atmospheric rivers, floods and the water resources of California. Water 3, 445–478. doi: 10.3390/w3020445
DuBois, S., Desai, A. R., Singh, A., Serbin, S. P., Goulden, M. L., Baldocchi, D. D., et al. (2018). Using imaging spectroscopy to detect variation in terrestrial ecosystem productivity across a water-stressed landscape. Ecol. Appl. 28, 1313–1324. doi: 10.1002/eap.1733
DWR (California Department of Water Resources) (2014). California Water Plan 2013: Strategic Plan (Volume 1). Available online at: https://cawaterlibrary.net/document/california-water-plan-2013-strategic-plan-volume-1/?_sft_keywords=california-water-plan (accessed November 01, 2019).
Farahani, H. J., Howell, T. A., Shuttleworth, W. J., and Bausch, W. C. (2007). Evapotranspiration: progress in measurement and modeling in agriculture. Trans. ASABE 50, 1627–1638. doi: 10.13031/2013.23965
Farr, T. G., Rosen, P. A., Caro, E., Crippen, R., Duren, R., Hensley, S., et al. (2007). The shuttle radar topography mission. Rev. Geophys. 45:RG2004. doi: 10.1029/2005RG000183
Glenn, E. P., Nagler, P. L., and Huete, A. R. (2010). Vegetation index methods for estimating evapotranspiration by remote sensing. Surv. Geophys. 31, 531–555. doi: 10.1007/s10712-010-9102-2
Goldstein, A. H., Hultman, N. E., Fracheboud, J. M., Bauer, M. R., and Panek, J. A. (2000). Effects of climate variability on the carbon dioxide, water, and sensible heat fluxes above a ponderosa pine plantation in the Sierra Nevada (CA). Agric. For. Meteorol. 101, 113–129. doi: 10.1016/S0168-1923(99)00168-9
Gorelick, N., Hancher, M., Dixon, M., Ilyushchenko, S., Thau, D., and Moore, R. (2017). Google earth engine: planetary-scale geospatial analysis for everyone. Remote Sens. Environ. 202, 18–27. doi: 10.1016/j.rse.2017.06.031
Goulden, M. L. (1996). Carbon assimilation and water-use efficiency by neighboring Mediterranean-climate oaks that differ in water access. Tree Physiol. 16, 417–424. doi: 10.1093/treephys/16.4.417
Goulden, M. L., Anderson, R. G., Bales, R. C., Kelly, A. E., Meadows, M., and Winston, G. C. (2012). Evapotranspiration along an elevation gradient in California's Sierra Nevada. J. Geophys. Res. 117:G03028. doi: 10.1029/2012JG002027
Goulden, M. L., and Bales, R. C. (2014). Mountain runoff vulnerability to increased evapotranspiration with vegetation expansion. Proc. Nat. Acad. Sci. U.S.A. 111, 14071–14075. doi: 10.1073/pnas.1319316111
Goulden, M. L., and Bales, R. C. (2019). California forest die-off linked to multi-year deep soil drying in 2012–2015 drought. Nat. Geosci. 12, 632–637. doi: 10.1038/s41561-019-0388-5
Goulden, M. L., McMillan, A. M. S., Winston, G. C., Rocha, A. V., Manies, K. L., Harden, J. W., et al. (2011). Patterns of NPP, GPP, respiration, and NEP during boreal forest succession. Glob. Chang. Biol. 17, 855–871. doi: 10.1111/j.1365-2486.2010.02274.x
Groeneveld, D. P., Baugh, W. M., Sanderson, J. S., and Cooper, D. J. (2007). Annual groundwater evapotranspiration mapped from single satellite scenes. J. Hydrol. 344, 146–156. doi: 10.1016/j.jhydrol.2007.07.002
Hayes, P. D., Rockwell, G. L., and Anderson, S. W. (1996). Water Resources Data, California, Water Year 1995. Volume 3. Southern Central Valley Basins and the Great Basin from Walker River to Truckee River (Legacy Rep). Water Data Report. USGS.
Henn, B., Newman, A. J., Livneh, B., Daly, C., and Lundquist, J. D. (2018). An assessment of differences in gridded precipitation datasets in complex terrain. J. Hydrol. 556, 1205–1219. doi: 10.1016/j.jhydrol.2017.03.008
Immerzeel, W. W., and Droogers, P. (2008). Calibration of a distributed hydrological model based on satellite evapotranspiration. J. Hydrol. 349, 411–424. doi: 10.1016/j.jhydrol.2007.11.017
Jin, Y., Randerson, J. T., and Goulden, M. L. (2011). Continental-scale net radiation and evapotranspiration estimated using MODIS satellite observations. Remote Sens. Environ. 115, 2302–2319. doi: 10.1016/j.rse.2011.04.031
Jung, M., Reichstein, M., Ciais, P., Seneviratne, S. I., Sheffield, J., Goulden, M. L., et al. (2010). Recent decline in the global land evapotranspiration trend due to limited moisture supply. Nature 467, 951–954. doi: 10.1038/nature09396
Kelly, A. E., and Goulden, M. L. (2008). Rapid shifts in plant distribution with recent climate change. Proc. Nat. Acad. Sci. U.S.A. 105, 11823–11826. doi: 10.1073/pnas.0802891105
Kirchner, P. B., Bales, R. C., Molotch, N. P., Flanagan, J., and Guo, Q. (2014). LiDAR measurement of seasonal snow accumulation along an elevation gradient in the southern Sierra Nevada, California. Hydrol. Earth Syst. Sci. 18, 4261–4275. doi: 10.5194/hess-18-4261-2014
Kljun, N., Calanca, P., Rotach, M. W., and Schmid, H. P. (2015). A simple two-dimensional parameterisation for flux footprint prediction (FFP). Geosci. Model Dev. 8, 3695–3713. doi: 10.5194/gmd-8-3695-2015
Klos, P. Z., Goulden, M. L., Riebe, C. S., Tague, C. L., O'Geen, A. T., Flinchum, B. A., et al. (2018). Subsurface plant-accessible water in mountain ecosystems with a Mediterranean climate. Wiley Interdiscip. Rev.: Water 5:e1277. doi: 10.1002/wat2.1277
Krofcheck, D. J., Hurteau, M. D., Scheller, R. M., and Loudermilk, E. L. (2018). Prioritizing forest fuels treatments based on the probability of high-severity fire restores adaptive capacity in Sierran forests. Glob. Chang. Biol. 24, 729–737. doi: 10.1111/gcb.13913
Lettenmaier, D. P. (2017). Observational breakthroughs lead the way to improved hydrological predictions. Water Resour. Res. 53, 2591–2597. doi: 10.1002/2017WR020896
Liang, S., Hurteau, M. D., and Westerling, A. L. (2018). Large-scale restoration increases carbon stability under projected climate and wildfire regimes. Front. Ecol. Environ. 16, 207–212. doi: 10.1002/fee.1791
Lundquist, J. D., Hughes, M., Henn, B., Gutmann, E. D., Livneh, B., Dozier, J., et al. (2015). High-elevation precipitation patterns: using snow measurements to assess daily gridded datasets across the Sierra Nevada, California*. J. Hydrometeorol. 16, 1773–1792. doi: 10.1175/JHM-D-15-0019.1
Ma, Q., Bales, R. C., Rungee, J., Conklin, M. H., Collins, B. M., and Goulden, M. L. (2020). Wildfire controls on evapotranspiration in California's Sierra Nevada. J Hydrol. 590:125364. doi: 10.1016/j.jhydrol.2020.125364
Ma, S., Baldocchi, D. D., Xu, L., and Hehn, T. (2007). Inter-annual variability in carbon dioxide exchange of an oak/grass savanna and open grassland in California. Agric. For. Meteorol. 147, 157–171. doi: 10.1016/j.agrformet.2007.07.008
Ma, Y., Zhang, Y., Yang, D., Farhan, S., and Bin. (2015). Precipitation bias variability vs. various gauges under different climatic conditions over the third pole environment (TPE) region. Int. J. Climatol. 35, 1201–1211. doi: 10.1002/joc.4045
Margulis, S. A., Cortés, G., Girotto, M., and Durand, M. (2016). A landsat-era Sierra Nevada snow reanalysis (1985–2015). J. Hydrometeorol. 17, 1203–1221. doi: 10.1175/JHM-D-15-0177.1
Markham, K. L., Anderson, S. W., Rockwell, G. L., and Friebel, M. F. (1996). Water Resources Data, California, Water Year 1995. Volume 4. Northern Central Valley Basins and the Great Basin from Honey Lake Basin to Oregon State Line. USGS.
Mernild, S. H., Hanna, E., McConnell, J. R., Sigl, M., Beckerman, A. P., Yde, J. C., et al. (2015). Greenland precipitation trends in a long-term instrumental climate context (1890–2012): evaluation of coastal and ice core records. Int. J. Climatol. 35, 303–320. doi: 10.1002/joc.3986
Messerli, B., Viviroli, D., and Weingartner, R. (2004). Mountains of the world: vulnerable water towers for the 21st century. Ambio 29–34. doi: 10.1007/0044-7447-33.sp13.29
Mu, Q., Heinsch, F. A., Zhao, M., and Running, S. W. (2007). Development of a global evapotranspiration algorithm based on MODIS and global meteorology data. Remote Sens. Environ. 111, 519–536. doi: 10.1016/j.rse.2007.04.015
Mu, Q., Zhao, M., and Running, S. W. (2011). Improvements to a MODIS global terrestrial evapotranspiration algorithm. Remote Sens. Environ. 115, 1781–1800. doi: 10.1016/j.rse.2011.02.019
Nagler, P., Scott, R., Westenburg, C., Clevery, J., Glenn, E., and Huete, A. (2005). Evapotranspiration on western U.S. rivers estimated using the enhanced vegetation index from MODIS and data from eddy covariance and Bowen ratio flux towers. Remote Sens. Environ. 97, 337–351. doi: 10.1016/j.rse.2005.05.011
Papale, D., Black, T. A., Carvalhais, N., Cescatti, A., Chen, J., Jung, M., et al. (2015). Effect of spatial sampling from European flux towers for estimating carbon and water fluxes with artificial neural networks. J. Geophys. Res. Biogeosci. 120, 1941–1957. doi: 10.1002/2015JG002997
Qualley, G. T., Buer, S. M., and Nemeth, S. E. (2000). Derivation of Unimpaired Runoff in the Cooperative Snow Surveys Program. Memorandum report. California Department of Water Resources.
Rana, G., and Katerji, N. (2000). Measurement and estimation of actual evapotranspiration in the field under Mediterranean climate: a review. Eur. J. Agron. 13, 125–153. doi: 10.1016/S1161-0301(00)00070-8
Roche, J. W., Goulden, M. L., and Bales, R. C. (2018). Estimating evapotranspiration change due to forest treatment and fire at the basin scale in the Sierra Nevada, California. Ecohydrology 11:e1978. doi: 10.1002/eco.1978
Roche, J. W., Ma, Q., Rungee, J., and Bales, R. C. (2020). Evapotranspiration mapping for forest management in California's Sierra Nevada. Front. For. Glob. Change 3:69. doi: 10.3389/ffgc.2020.00069
Rungee, J., Bales, R., and Goulden, M. (2019). Evapotranspiration response to multiyear dry periods in the semiarid western United States. Hydrol. Process. 33, 182–194. doi: 10.1002/hyp.13322
Ryu, Y., Baldocchi, D. D., Ma, S., and Hehn, T. (2008). Interannual variability of evapotranspiration and energy exchange over an annual grassland in California. J. Geophys. Res. 113:D09104. doi: 10.1029/2007JD009263
Saksa, P. C., Conklin, M. H., Battles, J. J., Tague, C. L., and Bales, R. C. (2017). Forest thinning impacts on the water balance of Sierra Nevada mixed-conifer headwater basins. Water Resour. Res. 53, 5364–5381. doi: 10.1002/2016WR019240
Salzer, M. W., Hughes, M. K., Bunn, A. G., and Kipfmueller, K. F. (2009). Recent unprecedented tree-ring growth in bristlecone pine at the highest elevations and possible causes. Proc. Nat. Acad. Sci. U.S.A. 106, 20348–20353. doi: 10.1073/pnas.0903029106
Sesnie, S. E., Dickson, B. G., Rosenstock, S. S., and Rundall, J. M. (2012). A comparison of Landsat TM and MODIS vegetation indices for estimating forage phenology in desert bighorn sheep (Ovis canadensis nelsoni) habitat in the Sonoran Desert, USA. Int. J. Remote Sens. 33, 276–286. doi: 10.1080/01431161.2011.592865
Su, Y., Bales, R. C., Ma, Q., Nydick, K., Ray, R. L., Li, W., et al. (2017). Emerging stress and relative resiliency of giant sequoia groves experiencing multiyear dry periods in a warming climate. J. Geophys. Res. Biogeosci. 122, 3063–3075. doi: 10.1002/2017JG004005
Sulla-Menashe, D., Friedl, M. A., and Woodcock, C. E. (2016). Sources of bias and variability in long-term landsat time series over Canadian boreal forests. Remote Sens. Environ. 177, 206–219. doi: 10.1016/j.rse.2016.02.041
Twine, T. E., Kustas, W. P., Norman, J. M., Cook, D. R., Houser, P. R., Meyers, T. P., et al. (2000). Correcting eddy-covariance flux underestimates over a grassland. Agric. For. Meteorol. 103, 279–300. doi: 10.1016/S0168-1923(00)00123-4
Wang, S., Pan, M., Mu, Q., Shi, X., Mao, J., Brümmer, C., et al. (2015). Comparing evapotranspiration from eddy covariance measurements, water budgets, remote sensing, and land surface models over Canada a, b. J. Hydrometeorol. 16, 1540–1560. doi: 10.1175/JHM-D-14-0189.1
Wilson, K. B., and Baldocchi, D. D. (2000). Seasonal and interannual variability of energy fluxes over a broadleaved temperate deciduous forest in North America. Agric. For. Meteorol. 100, 1–18. doi: 10.1016/S0168-1923(99)00088-X
Wilson, K. B., Hanson, P. J., Mulholland, P. J., Baldocchi, D. D., and Wullschleger, S. D. (2001). A comparison of methods for determining forest evapotranspiration and its components: sap-flow, soil water budget, eddy covariance and catchment water balance. Agric. For. Meteorol. 106, 153–168. doi: 10.1016/S0168-1923(00)00199-4
Xiao, J., Chen, J., Davis, K. J., and Reichstein, M. (2012). Advances in upscaling of eddy covariance measurements of carbon and water fluxes. J. Geophys. Res. Biogeosci. 117, 1–4. doi: 10.1029/2011JG001889
Yang, F., Zhu, A.-X., Ichii, K., White, M. A., Hashimoto, H., and Nemani, R. R. (2008). Assessing the representativeness of the AmeriFlux network using MODIS and GOES data. J. Geophys. Res. Biogeosci. 113, 1–11. doi: 10.1029/2007JG000627
Yang, D., Ishida, S., Goodison, B. E., and Gunther, T. (1999). Bias correction of daily precipitation measurements for Greenland. J. Geophys. Res. Atmos. 104, 6171–6181. doi: 10.1029/1998JD200110
Zhang, Y., Chiew, F. H. S., Zhang, L., and Li, H. (2009). Use of remotely sensed actual evapotranspiration to improve rainfall–runoff modeling in Southeast Australia. J. Hydrometeorol. 10, 969–980. doi: 10.1175/2009JHM1061.1
Zhang, Z., Glaser, S., Bales, R., Conklin, M., Rice, R., and Marks, D. (2017). Insights into mountain precipitation and snowpack from a basin-scale wireless-sensor network. Water Resour. Res. 53, 6626–6641. doi: 10.1002/2016WR018825
Zheng, H., Yu, G., Wang, Q., Zhu, X., Yan, J., Wang, H., et al. (2017). Assessing the ability of potential evapotranspiration models in capturing dynamics of evaporative demand across various biomes and climatic regimes with ChinaFLUX measurements. J. Hydrol. 551, 70–80. doi: 10.1016/j.jhydrol.2017.05.056
Keywords: evapotranspiration, runoff, mountain basins, Sierra Nevada, water balance
Citation: Rungee J, Ma Q, Goulden ML and Bales R (2021) Evapotranspiration and Runoff Patterns Across California's Sierra Nevada. Front. Water 3:655485. doi: 10.3389/frwa.2021.655485
Received: 18 January 2021; Accepted: 18 October 2021;
Published: 23 November 2021.
Edited by:
Sajjad Ahmad, University of Nevada, United StatesReviewed by:
Xi Chen, University of Cincinnati, United StatesKazi Tamaddun, University of Virginia, United States
Copyright © 2021 Rungee, Ma, Goulden and Bales. This is an open-access article distributed under the terms of the Creative Commons Attribution License (CC BY). The use, distribution or reproduction in other forums is permitted, provided the original author(s) and the copyright owner(s) are credited and that the original publication in this journal is cited, in accordance with accepted academic practice. No use, distribution or reproduction is permitted which does not comply with these terms.
*Correspondence: Joseph Rungee, jprungee@gmail.com; Qin Ma, qm153@msstate.edu