
94% of researchers rate our articles as excellent or good
Learn more about the work of our research integrity team to safeguard the quality of each article we publish.
Find out more
ORIGINAL RESEARCH article
Front. Water, 21 August 2020
Sec. Water and Critical Zone
Volume 2 - 2020 | https://doi.org/10.3389/frwa.2020.00023
This article is part of the Research TopicChemical Export to River Systems from the Critical ZoneView all 11 articles
 Julien Ackerer1,2*
 Carl Steefel2
 Fengjing Liu3
 Ryan Bart1
 Mohammad Safeeq1,4Anthony O'Geen5Carolyn Hunsaker6Roger Bales1
Concentration-discharge (C-Q) relations can provide insight into the dynamic behavior of the Critical Zone (CZ), as C-Q relations integrate the spatial distribution and timing of watershed hydrogeochemical processes. This study blends geomorphologic analysis, C-Q relations and reactive-transport modeling using a rich dataset from an elevation gradient of eight watersheds in the Southern Sierra Nevada, California. We found that the CZ structure exerts a strong control on the C-Q relations, and on the hydrogeochemical behavior of headwater watersheds. Watersheds with thin regolith, a large stream network, and limited water storage have fast mean transit times along subsurface flow lines, and show limited seasonal variability in ionic concentrations in streamflow (i.e., chemostatic behavior). In contrast, watersheds with thicker regolith, a small stream network and more water storage have longer transit times along subsurface flow lines, and exhibit greater chemical variability (i.e., chemodynamic behavior). Independent estimates of mean transit times and water storage from other isotopic, hydrologic and geophysical studies were consistent with results from modeling C-Q relations. The stream chemistry and its variability were controlled by lateral flow within the regolith, and no mixing with deep groundwater was needed to explain the observed chemical variability. This study opens the possibility to estimate water-storage capacity and mean transit times, and thus drought resistance in watersheds, by using quantitative modeling of C-Q relations.
Improving our understanding of the critical zone (CZ), which is defined as the uppermost layer of Earth and is a key interface between the lithosphere, atmosphere, hydrosphere and biosphere, is important for predicting future soil and water societal issues. One of the most important questions in CZ science is what are the links and feedbacks between long-term CZ evolution (i.e., soil and regolith mineralogy, CZ structure and thickness) and the short-term hydrogeochemical behavior of watersheds (i.e., water availability, stream chemistry and water storage). This question is raised by the growing need for accurate estimates for water storage capacity and water transit times in watersheds, which are central to understanding water availability, water quality and drought responses (Hubbert et al., 2001; Bart and Hope, 2014; Safeeq and Hunsaker, 2016; Bales et al., 2018; Klos et al., 2018; O'Geen et al., 2018; Visser et al., 2019). How regolith structure and landscape evolution influence the hydrochemical behavior of watersheds depends on multiple physical, chemical and biological processes (Chorover et al., 2011; Ackerer et al., 2016; Reis and Brantley, 2019). Depicting how these processes are linked will depend on our ability to cross long-term monitoring efforts and the development of integrative modeling approaches (Steefel et al., 2015; Brantley et al., 2017; Li et al., 2017; Ackerer et al., 2018).
One promising approach to link CZ structure with the spatial distribution and timing of hydrogeochemical processes in watersheds is the quantitative interpretation of Concentration-Discharge (C-Q) relations (e.g., Godsey et al., 2009; Chorover et al., 2017; Moatar et al., 2017; Diamond and Cohen, 2018; Zhi et al., 2019). C-Q relations from stream water are acknowledged to aggregate a large number of processes, from climate, geochemical and ionic exchange reactions to hydrologic, biological and transport processes (Chorover et al., 2017). Recent reports show that C-Q relations can provide constraints on water flow paths along hillslopes (Ameli et al., 2017), mixing of different water end members in rivers (Liu et al., 2017; Torres et al., 2017) or seasonal variability of water transit times in headwater watersheds (Ackerer et al., 2018). There are ongoing debates around the extent to which C-Q relations are controlled by mixing between deep and shallow waters (Kim et al., 2017), synchronous dissolution of clay minerals (Li et al., 2017) and/or seasonally variable flow paths (Herndon et al., 2018).
Although C-Q relations have been intensively studied, few studies have coupled reactive-transport modeling, geomorphological investigations and regolith sciences to clearly assess what are the main CZ attributes that control the shapes of C-Q relations. Recent reports indicate that landscape heterogeneities are an important determinant of C-Q relations (e.g., Herndon et al., 2015; Musolff et al., 2015; Wymore et al., 2017; Sullivan et al., 2019). Understanding the specific roles of regolith thickness, bedrock geochemistry and watershed structures is an important new step to use C-Q relations to gain insight into water storage and water availability across landscapes. A detailed knowledge on how CZ structure controls the hydrogeochemical behavior of watersheds is also needed to anticipate the response of watersheds to perturbations from global warming, because this response will rely on regolith properties acquired through its long-term evolution (Bales et al., 2011; Safeeq et al., 2013; O'Geen et al., 2018).
The major objectives of the research reported here were to determine: (a) how the CZ structure constrains the hydrogeochemical behavior of watersheds, and (b) how the variability of bedrock geochemistry and regolith thickness can impact stream water chemistry, mean transit times and water storage in headwater watersheds. Our hypotheses were that the features of subsurface flow lines and stream networks, together with the regolith thickness, have a strong control on the stream water chemistry and hydrological behavior of watersheds. To evaluate these points, our work combines a detailed analysis of geomorphologic features, C-Q relations, and reactive-transport modeling in eight headwater watersheds along a unique elevation gradient in California's Sierra Nevada.
This study focused on the Kings River Experimental Watersheds (KREW), an elevation gradient of watersheds characterized by different climates and geomorphologic features in the southern Sierra Nevada in California (37,068°N, 119,191°W; Goulden et al., 2012; Liu et al., 2013; Holbrook et al., 2014; Safeeq and Hunsaker, 2016; Hunsaker and Johnson, 2017; Bales et al., 2018; O'Geen et al., 2018). KREW is a long-term and integrated project for CZ research and is operated by the U.S. Forest Service, Pacific Southwest Research Station.
KREW includes eight watersheds, four in Providence site (P301, P303, P304, and D102) and four in Bull site (B201, B203, B204, and T003; Figure 1). The study area is underlain by the Sierra Nevada Batholith with bedrock dominated by Mesozoic granitoids and metamorphic rocks from granitic roof pendants (Lackey et al., 2012; Callahan et al., 2019). The Landscape is characterized by a sequence of range-parallel ridges and valleys, with alternating steep and gentle terrain (Holbrook et al., 2014). Providence is located east of a tread edge in an area with generally intermediate slopes (Jessup et al., 2011). Bull is located southeast of Providence, with erosion and soil formation rates that are generally slower than Providence (Callahan et al., 2019). More geological description of the region and additional chemical and mineralogical data are available from the US Geological Survey (Bateman and Lockwood, 1976; Bateman and Busacca, 1983).
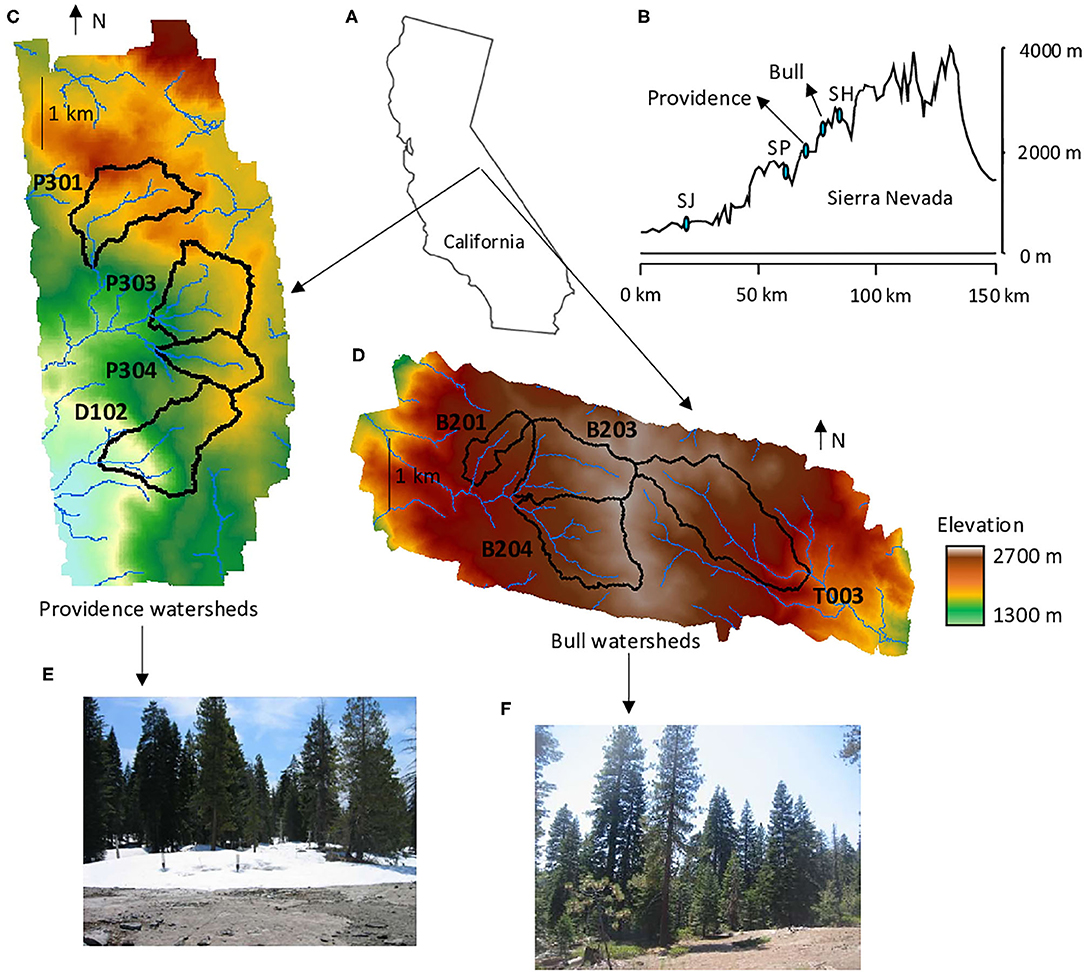
Figure 1. (A) Providence and Bull watershed locations in California, USA. (B) West to East elevation transect from the San Joaquin valley over the Sierra Nevada, and showing SSCZO sites at the San Joaquin Experimental Range (SJ), Soaproot Saddle (SP) and Short Hair (SH). (C) Topographic map of the area including Providence watersheds: P301, P303, P304, and D102, (D) and of the area including Bull watersheds: B201, B203, B204, and T003. Topographic maps are derived from a 1m-resolution DEM. (E) Photo from Providence. (F) Photo from Bull.
The climate is mountainous and Mediterranean with long dry summers and the majority of precipitation falling in winter. Providence watersheds have mean elevations between 1782 and 1979 m (Figure 1), a mean annual temperature around 8°C and a mean annual precipitation of approximately 1015 mm.yr−1 (Safeeq and Hunsaker, 2016). The Providence group is located near the rain-snow transition zone (30–60% snow). Bull watersheds have mean elevations ranging from 2122 to 2373 m, a mean annual temperature around 7°C and a mean annual precipitation of approximately 1386 mm.yr−1. Most of the winter precipitation falls as snow in the Bull watersheds (70–90%; Hunsaker and Johnson, 2017). Soils are relatively shallow (<1 m) Shaver and Cagwin soils and are all derived from granite (Johnson et al., 2011). Vegetation in Providence is dominated by Sierran mixed-conifer forest with some mixed chaparral and barren land cover (Bales et al., 2011; Safeeq and Hunsaker, 2016). Vegetation in Bull is predominately red fir forest with some mixed-conifer forest at lower elevations.
This study is based on the long-term monitoring of the KREW and on the database from the Southern Sierra Critical Zone Observatory (SSCZO, Liu et al., 2013; Holbrook et al., 2014; Safeeq and Hunsaker, 2016; Hunsaker and Johnson, 2017; Bales et al., 2018). Recent efforts have been undertaken to characterize the CZ structure and regolith properties along the SSCZO elevation gradient (O'Geen et al., 2018; Tian et al., 2019).
A drilling campaign involving Geoprobe sampling was organized to better estimate the regolith thickness and its variability across the SSCZO (O'Geen et al., 2018). Measured regolith thicknesses indicated thin regolith (1–2 m) at low elevation (400 m, SJ site, Figure 1B) and at high elevation (2,700 m, SH site, Figure 1B). From 1,100 to 2,000 m, measured thicknesses were higher but tended to decrease with elevation, with mean values around 5–6 m at 1,100 m and around 2–3 m at 2,000 m (O'Geen et al., 2018). For the Providence and Bull watersheds (Figure 1B), regolith thickness was investigated in P301, P303, and D102 (1,700–2,000 m, 49 sampled sites), with mean thicknesses around 4–6 m.
Regolith density and porosity were estimated at several sites on samples collected during the Geoprobe campaigns (O'Geen et al., 2018). Mean regolith density was approximately 1.5–1.7 g.cm−3 and mean regolith porosity was approximately 0.35–0.40 between 0 and 6 m of depth. Hydraulic conductivities at saturation (Ksat) were also measured on Geoprobe samples collected by O'Geen et al. (2018), and ranged from 0 to 7 × 10⁻⁵ m.s−1. Ksat values were high for a few points near the surface (7 × 10⁻⁵ m.s−1), but much lower over the rest of the regolith column (0–8 × 10⁻⁶ m.s−1). The mean value of Ksat was 6 × 10⁻⁶ m.s−1 for the entire regolith column.
Soil and regolith samples were also collected in the KREW for geochemical and mineralogical analysis from soil-pit, hand-auger and/or Geoprobe campaigns (Johnson et al., 2011; O'Geen et al., 2018; Tian et al., 2019). Sampling depth was between 0 and 2 m, with a few samples from Geoprobe campaigns reaching 10 m in Providence. Mineralogical composition of regolith samples was determined by the quantitative interpretation of X-ray analysis reported by Tian et al. (2019), following Ackerer et al. (2016). Elemental concentrations in bulk regolith samples were also determined by ICP-AES following Tian et al. (2019). Regolith geochemistry and mineralogy were significantly different between Providence and Bull. The granite from Providence showed higher contents of Biotite, Anorthite, Albite and higher concentrations of Ca and Mg compared to Bull (Table 1). Bull bedrock is a quartz-rich granite with higher concentrations of SiO2 but lower concentrations of Ca and Mg than Providence. Abundances of K-feldspar (6–9%) and concentrations of K (2.42–2.66 %) were much more similar in the regolith of Providence and Bull watersheds (Table 1).
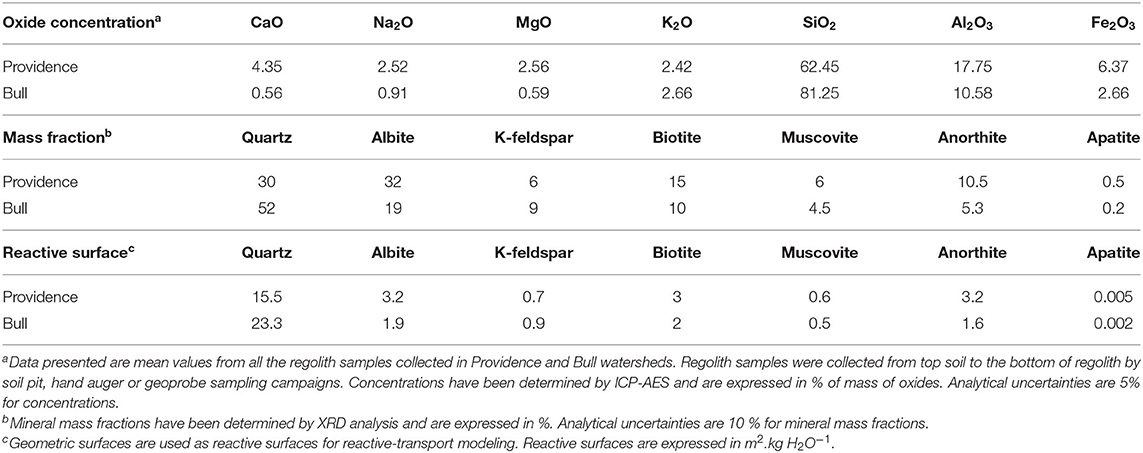
Table 1. Geochemical and mineralogical data for the regolith of the KREW.
The SSCZO database on regolith geochemistry and mineralogy is supplemented by the hydrologic and geochemical monitoring of stream waters in the KREW (Liu et al., 2013; Safeeq and Hunsaker, 2016; Hunsaker and Johnson, 2017). Water discharge, pH, specific conductivity and solute concentrations of Na+, Ca2+, K+, and Mg2+ were reported for the stream water at the KREW outlets for 2003–2007 (Liu et al., 2013). Mean annual water discharge, standard deviation of water discharge, and mean annual concentrations of Ca2+ and Na+ are given in Table 2. The complete database for stream chemistry over the 2003–2007 period is available in Supplementary Materials (Table SM1). The hydroclimatic characteristics and other hydrologic signatures (e.g., base flow index) of the KREW have been reported by Safeeq and Hunsaker (2016).
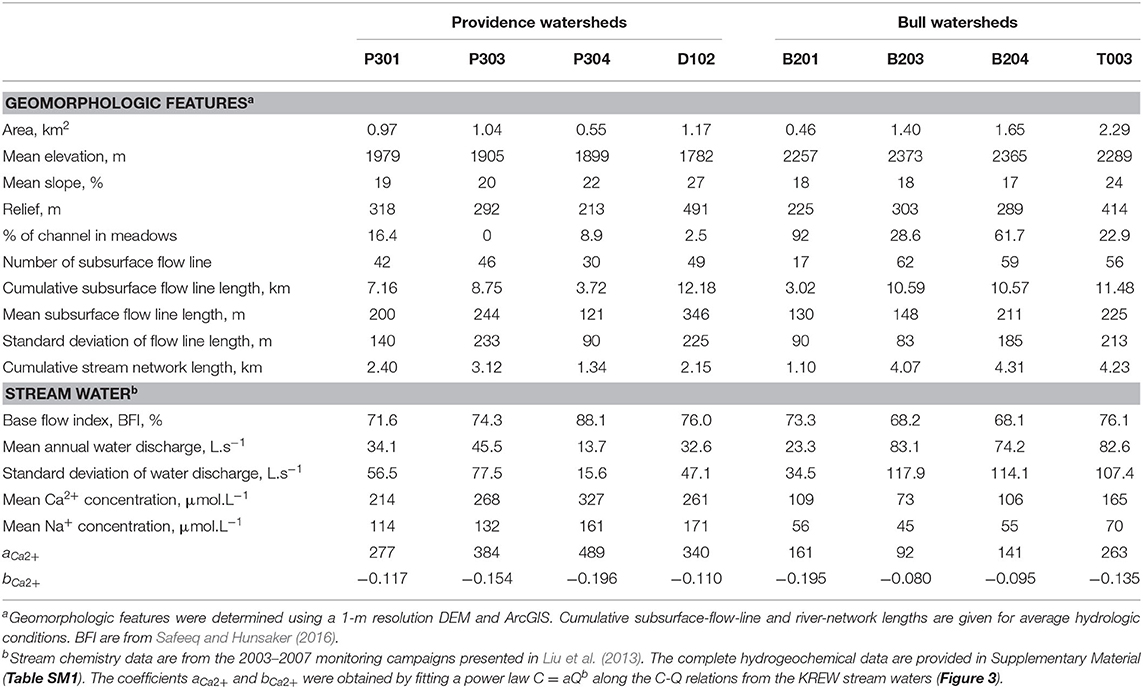
Table 2. Main geomorphologic features and stream water chemistry data.
A 1-m resolution digital elevation model (DEM) derived from a recent airborne Lidar survey was analyzed to better constrain the geomorphologic features of all watersheds (Figure 1). Watershed areas, elevations, slopes and reliefs were calculated (Table 2). Accumulated flow from up-slope contributing areas to each cell of the DEM was determined (ArcGIS) to map the hydrologic drainage networks (Storck et al., 1998; Liu et al., 2003). A flow-accumulation threshold of 2,000 m2 was selected to capture the main hydrologic drainage network along slopes, and the same threshold was used to highlight the inter-watershed differences. Comparison with the topographic maps from the U.S. Geological Survey and with field observations was performed to evaluate the hydrologic drainage networks and to distinguish streams and subsurface drainage networks. The stream networks represent observed channelized streams that are directly connected with the watershed outlets. The subsurface drainage networks represent the hydrologic drainage along the slopes, following the main topographic depressions, but where streams are not observed. Subsurface drainage networks connect with stream networks on the valley floors.
C-Q relations were studied at the outlet of the KREW on the basis of the hydrologic and geochemical database of stream waters. Concentration-discharge relations were interpreted by fitting power laws of type C = aQb (e.g., Godsey et al., 2009; Chorover et al., 2017; Kim et al., 2017; Liu et al., 2017), with C the solute concentrations in stream waters (μmol.L−1) and Q the stream discharges at watershed outlets (L.s−1). Linear scales were preferred to better visualize the contrasting behavior of watersheds during dry periods. The a coefficient of the power law C = aQb controls the height of the C-Q relation (y-intercept, the constant in the power law equation), and has a strong correlation with the mean annual concentrations of stream waters. The b coefficient controls the curvature of the C-Q relation (the exponent in the power law equation), and is an indicator of the degree of chemodynamic behavior of stream waters. We used the threshold b = −0.1 to distinguish chemostatic (0 > b> −0.1) and chemodynamic watersheds (−0.1 > b) as in Herndon et al. (2015) and Hunsaker and Johnson (2017).
To highlight the control of CZ structure on C-Q relations, we recommend working with a lithogenic solute sensitive to transit time variations along the subsurface flow lines: a solute with a strong Concentration-Mean Transit Time slope (C-MTT slope, Ackerer et al., 2020). The C-MTT slope considers the competition between primary mineral dissolution and incorporation into clay minerals, and indicates how fast a solute concentration rises with an increase of water transit time. A strong C-MTT slope facilitates the expression of CZ structure (e.g., length of subsurface flow paths, topography, watershed structure) on water chemical composition because stream water concentrations will be sensitive to physical attributes controlling water circulations in the watershed. In contrast, a solute with a low C-MTT slope may have stream water concentrations that are weakly responsive to the seasonal variability of transit times. In granitic watersheds, Ca2+ and H4SiO4 typically have strong C-MTT slopes, while K+ and Mg2+ frequently show lower C-MTT slopes (Ackerer et al., 2020). We focused in this study on the detailed understanding of C-Q relations for Ca2+ as this ion has an extensive database, a strong C-MTT slope, and shows the most contrast in C-Q relations across the KREW. The a and b coefficients for Ca2+ are written aCa2+ and bCa2+ in the following sections.
Hydrogeochemical simulations were performed with the 1D thermo-kinetic code KIRMAT (KInectic of Reaction and MAss Transport; Gérard et al., 1998; Ngo et al., 2014; Lucas et al., 2017; Ackerer et al., 2018). KIRMAT is based on the Transition State Theory (TST) and solves the equations describing geochemical reactions and transport mass balance in a porous medium. Transport processes include the effects of convection, diffusion and kinematic dispersion. Chemical reactions account for the dissolution of primary minerals, oxido-reduction reactions, and the formation of secondary minerals and clay minerals. The clay fraction is defined in KIRMAT as a solid solution made up of a combination of pure clay end-members (Tardy and Fritz, 1981). The clay solid solution is precipitated at thermodynamic equilibrium and its composition varies over time depending on the water chemistry and the evolution of regolith mineralogy (Ackerer et al., 2018). The KIRMAT code also considers feedback effects between mineral mass budgets, reactive surfaces, and changes in bedrock porosity (Ngo et al., 2014). The framework of geochemical modeling with KIRMAT in granitic watersheds is available in Ackerer et al. (2018, 2020). More specific data on the geochemical modeling, kinetic and thermodynamic constants are available in Tables SM2–SM5.
The modeling strategy to consider the variability of the CZ structure over the KREW is adapted from Ackerer et al. (2018, 2020). Reactive-transport modeling was first performed on P301, as this reference watershed has the most extensive database and a high density of regolith-thickness measurements. Regolith mineralogy and geochemistry were constrained in P301 by the mineralogical and geochemical analysis (Table 1). Simple geometric surfaces are used as reactive surfaces for the dissolution reactions of primary minerals (Table 1). Estimates from Geoprobe campaigns of mean porosity (0.35) and mean hydraulic conductivity (6 × 10⁻⁶ m.s−1) along the regolith column were used for all simulations. Slopes are known from the DEM, and the C-Q relations at the P301 outlet were constrained by the hydrochemical database (Table 2, Table SM1). Average saturated zone thickness is unknown over P301 but measurements of regolith thickness provide a maximum value.
A schematic view of the modeling strategy is presented for P301 in Figure 2. Modeling was performed for a selection of dates covering the entire range of hydrologic conditions, from summer and fall dry periods to winter and spring floods. Dates were selected on the basis of stream discharges at the outlets by selecting days corresponding to 1, 10, 35, 50, and 100% of the maximum observed stream discharge. The selection is biased toward lower discharges because chemical concentrations vary dramatically at lower discharges, which dictates the C-Q power-law curvature. A set of simulations was done for each date. Reactive-transport simulations were performed along the subsurface drainage network identified by the geomorphologic analysis. For a given date and along each subsurface flow line, a 1D simulation with KIRMAT was performed to constrain the evolution of the subsurface water chemistry (Figure 2). Soil solutions were used as input solutions percolating into the regolith (Figure 2B, chemical data from Liu et al., 2013). Flow velocities along the subsurface flow lines were estimated using the ArcGIS groundwater toolset. Flow velocities were controlled by slopes, porosity, hydraulic conductivity and saturated thickness. These parameters were generated from the KREW database, except the saturated zone thicknesses, which was adjusted by a Monte-Carlo approach to obtain the best fit between modeled and measured C-Q relations at the P301 outlet. The fits were quantified using the root mean square error (RMSE, Table 3) and the mean value of regolith thickness on P301 was used as a maximum boundary.
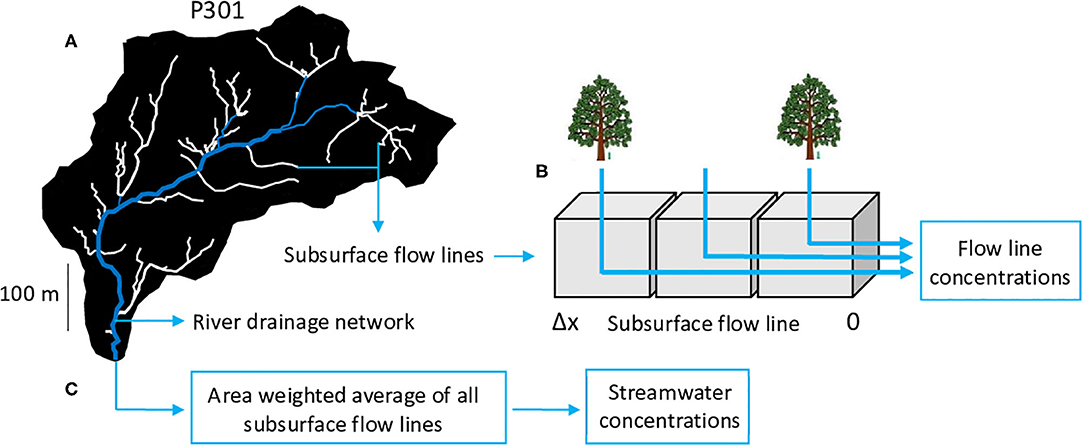
Figure 2. Conceptual scheme used in modeling ionic concentrations in streamwater for all watersheds. (A) River network (in blue) and subsurface flow lines (in white) are determined by geomorphologic analysis using a 1-m DEM. The river network collects water coming from the subsurface flow lines, and the water chemical composition is assumed unchanged during the fast transfer in the streams. (B) Reactive-transport modeling along the 1D subsurface flow lines in the watersheds. The regolith is horizontally discretized into a 1D succession of cells along the subsurface flow lines. Within each cell, the geochemical and transport equations are numerically solved using the KIRMAT hydrogeochemical code. Subsurface flow lines are assumed to deliver subsurface water to the stream once reaching the river network. Δx to 0 is the distance from stream along the subsurface flow lines. A single layer with depth-averaged regolith properties is used along the vertical direction. (C) Final streamwater concentrations are calculated by taking the average chemical compositions across all subsurface flow lines. This average is weighed by the drainage area of each subsurface flow line to consider that long flow lines carry more water than shorter ones.
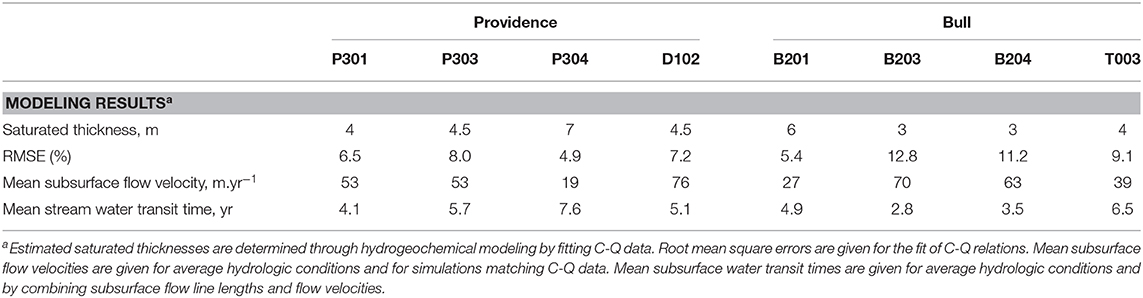
Table 3. Modeling results for the eight watersheds.
The modeled C-Q relations were determined as follows. The simulated concentrations in the stream at a watershed's outlet were calculated by taking the landscape surface-area-weighted average of concentrations from all the subsurface flow lines (Figure 2). The simulated stream discharge was calculated by summing the water discharges over all the subsurface flow lines. This sum was also landscape surface-area weighted to consider that longer subsurface flow lines draining large areas carry more water than shorter flow lines. Water transit times were calculated along each subsurface flow line by combining lengths of subsurface flow lines and subsurface flow velocities. The mean transit time for stream water was determined by taking the surface-area-weighted average of transit times from all subsurface flow lines.
Our depth-integrated, reactive-transport modeling was performed within a single regolith layer with averaged mineralogical, geochemical and physical properties. It is assumed that the subsurface waters are delivered to stream once the subsurface flow lines reach the stream network. Chemical composition of stream water is also assumed to remain unchanged during the fast transfer within the stream network. This assumption is supported by the short length of the stream network in this type of headwater watersheds (<1 km).
After the P301 watershed, this modeling strategy was extended to other seven watersheds. Differences in regolith mineralogy and chemical composition were considered for the Providence and the Bull groups (Table 1). Modeling also considers the variability of the geomorphologic features between the watersheds (Table 2). Regolith porosity and hydraulic conductivity measured in P301 were used for all the other watersheds. Modeled stream water concentrations and stream discharges were compared to measured values. The modeling of C-Q relations was used to estimate the saturated thicknesses over the watersheds where data on stream water and regolith are available but where regolith thicknesses are unknown (Table 3).
The watersheds show contrasting CZ structures and subsurface-flow line distributions along the elevation gradient (Figure 3 and Table 2, Figure SM1 in Supplementary Materials). P304 and B201 are the smallest watersheds (0.5 km2), with limited stream networks (1.2 km), and a limited number of subsurface flow lines (20) characterized by compact length distributions around low values. T003 and B204 are the largest watersheds (2 km2), with the longest stream networks (4.2 km), and a high number of subsurface flow lines (60) characterized by relatively scattered length distributions around intermediate values. P301, P303, and D102 are intermediate size watersheds (1 km2), with intermediate stream networks (2.5 km), and a moderate number of subsurface flow lines (40). The standard deviation of the subsurface-flow-line lengths increases from P301 to P303 and D102. B203 is a relatively large watershed (1.7 km2), with a large stream network (4 km), but a high number of subsurface flow lines (60) characterized by a compact length distribution around short value. These contrasting CZ structures imply different degrees of connectivity between the subsurface drainage networks and streams.
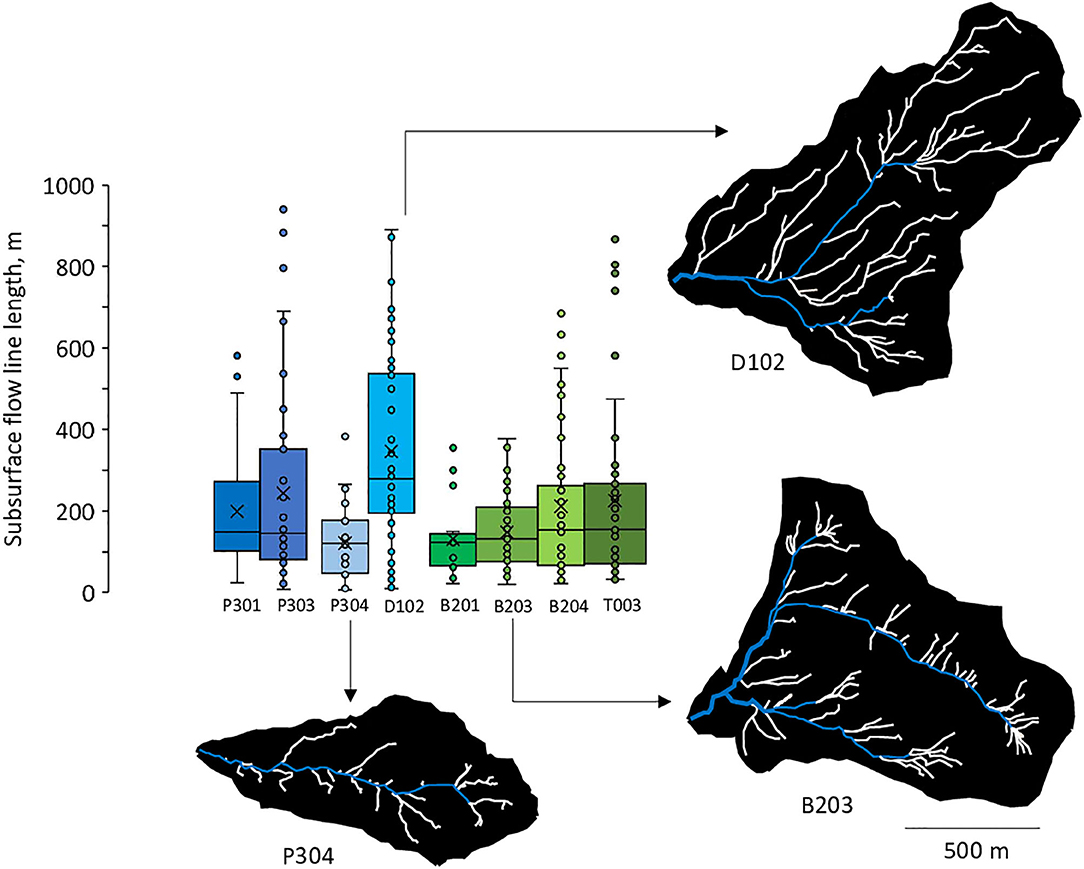
Figure 3. Distribution of the subsurface flow line lengths. Boxes, crosses, vertical lines and points represent interquartile ranges, mean values, variability outside the interquartile ranges and outliers, respectively. The distribution is shown for average hydrologic conditions. River network (in blue) and subsurface flow lines (in white) were determined by the geomorphological study and the delineation of a 1-m DEM. Illustrations are provided for three watersheds: P304, D102, and B203.
The watersheds are characterized by distinctive hydrogeochemical behaviors. Mean annual stream discharges are generally higher at Bull (B203, B204, T003), but stream discharges in these watersheds also show a higher annual variability with higher standard deviations (Table 2). B201 is an exception in the Bull group, with lower mean discharge and standard deviation. Providence watersheds have relatively low mean annual stream discharges, with P304 having the lowest discharge and standard deviation (Table 2). These trends in stream discharge are consistent with the base flow index (BFI) calculated over the KREW watersheds by Safeeq and Hunsaker (2016). The BFI is low for watersheds with a greater variability of discharge (B203, B204) and high for the watersheds with low and less variable discharges (B201, P304; Table 2).
Mean annual Ca2+ concentrations in stream water are lower in Bull compared to Providence watersheds (Table 2 and Figure 4A). The mean ionic concentrations in stream waters in Providence and Bull span the range between those of snowmelt and deep groundwater (Figure 4A). The mean concentrations in soil water are outside of this trend. Concentrations in stream water also vary seasonally, as illustrated by Ca2+ concentrations on Figure 4B. Periods of higher discharge during winter and spring are typically characterized by lower concentrations, while values during summer and fall being frequently higher. The interannual variability of stream concentrations mainly follows climatic patterns, with higher concentrations in dry years and lower ones in wet years.
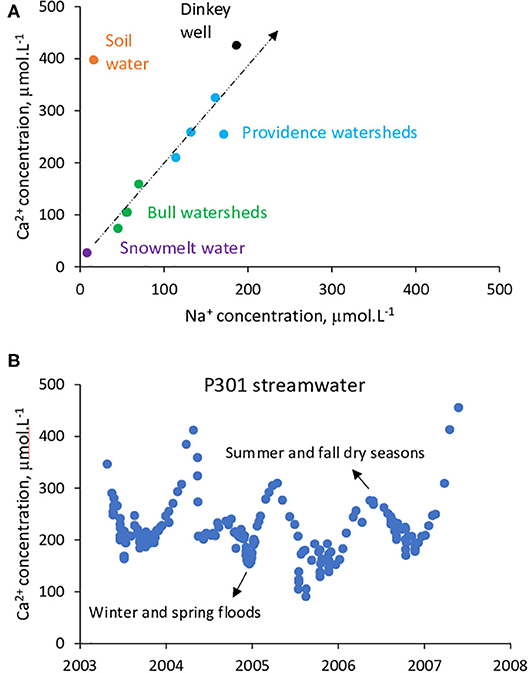
Figure 4. Overview of the chemical variability for Providence and Bull stream waters. (A) Elemental Na+ – Ca2+ diagram with mean annual solute concentrations for Providence and Bull stream waters, snowmelt, soil water and Dinkey well groundwater (4 km from Providence). Data from Liu et al. (2013). (B) Seasonal variability of Ca2+ concentrations for P301 streamwaters. Data are shown for period studied (2003–2007).
The diversity of CZ structures produces contrasting C-Q relations along the elevation gradient (Figure 5 and Figure SM4). B203 and B204 show low a coefficient and chemostatic behavior (aCa2+ = 92 to 141, 0>bCa2+ >-0.1 with bCa2+ = −0.080 to −0.095) (Figures 5F,G). P301, P303, D102, and T003 show intermediate a coefficient and slightly chemodynamic behavior (aCa2+ =277 to 384, –0.1 > bCa2+ > –0.16 with bCa2+ = −0.110 to −0.154) (Figures 5A,B,D,H). B201 and P304 are the most chemodynamic watersheds (–0.1 > bCa2+with bCa2+ = −0.195 to −0.196) (Figures 5C,E), but B201 displays low a coefficient (aCa2+ = 161), while P304 is characterized by high a coefficient (aCa2+ = 489). Two extreme end members can be identified. P304 is the most chemodynamic, with also the highest a coefficient (bCa2+ = −0.196, aCa2+ = 489, Table 2 and Figure 5C). In contrast, B203 is the most chemostatic, with also the lowest a coefficient (bCa2+ = −0.080, aCa2+ = 92, Table 2 and Figure 5F). The combination of chemostatic behavior with high mean concentration is not observed in any of the watersheds. Although a different threshold for distinguishing chemostatic and chemodynamic behavior (bCa2+ = –0.1) would slightly change the above classification, we highlight that we did not necessarily seek an absolute separation between watersheds classified as chemostatic or chemodynamic. Instead, our objective was to interpret the general trend of bCa2+and to propose a physical interpretation of this trend.
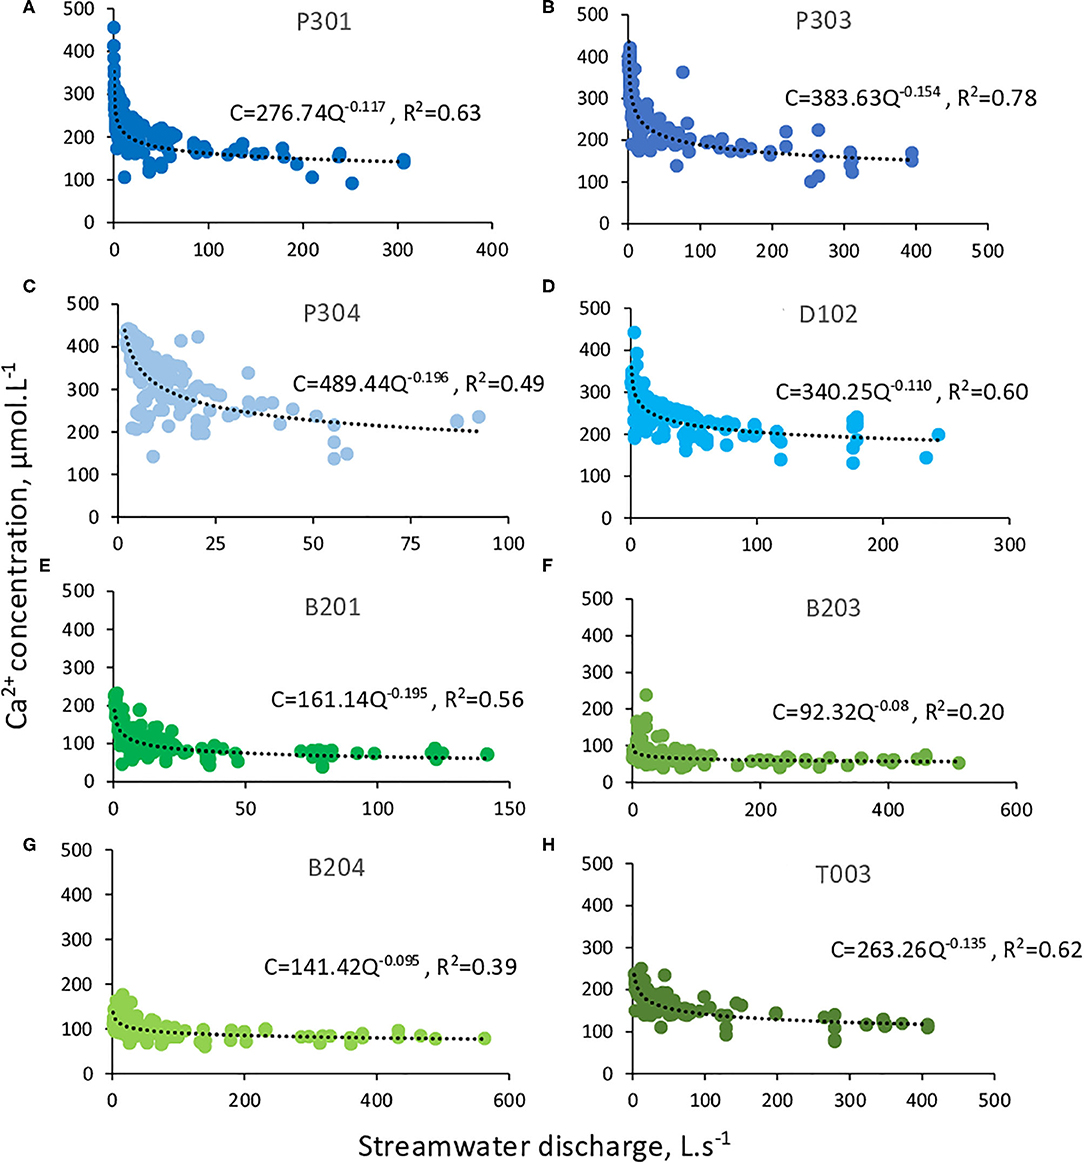
Figure 5. (A–H) Ca2+ concentration-discharge relations for the eight watersheds. Each point represents a stream water sample. Power laws were fitted by using the expression C = aQb, with C the solute concentration in μmol.L−1, Q the streamwater discharge in L.s−1, a the coefficient determining the height of the law and b the coefficient setting the curvature of the law.
The aCa2+ coefficient tends to decrease with increasing watershed elevation (Figure 6A), following the first-order difference of regolith geochemistry between the Providence and Bull groups (Table 1). The aCa2+ coefficient is also strongly correlated with the base flow index (BFI) calculated over the watersheds (Figure 6B). In Figure 6B, Providence and Bull groups are shifted, with higher aCa2+ values for Providence, but within each group the aCa2+ coefficient clearly increases with BFI. The bCa2+ coefficient shows correlations with cumulative subsurface-flow-line length and to a lesser extent with mean annual stream discharge (Figures 6C,D). Watersheds with lower values of cumulative subsurface flow line length and with both lower annual mean discharge and discharge variability are the most chemodynamic (P304 and B201, bCa2+ = −0.195 to −0.196). Watersheds with higher values of cumulative subsurface flow line length and with both higher annual mean discharge and discharge variability are more chemostatic (B203 and B204, bCa2+=-0.080 to −0.095). No correlations were found between stream discharge, aCa2+, bCa2+ and the meadow area (Table 2).
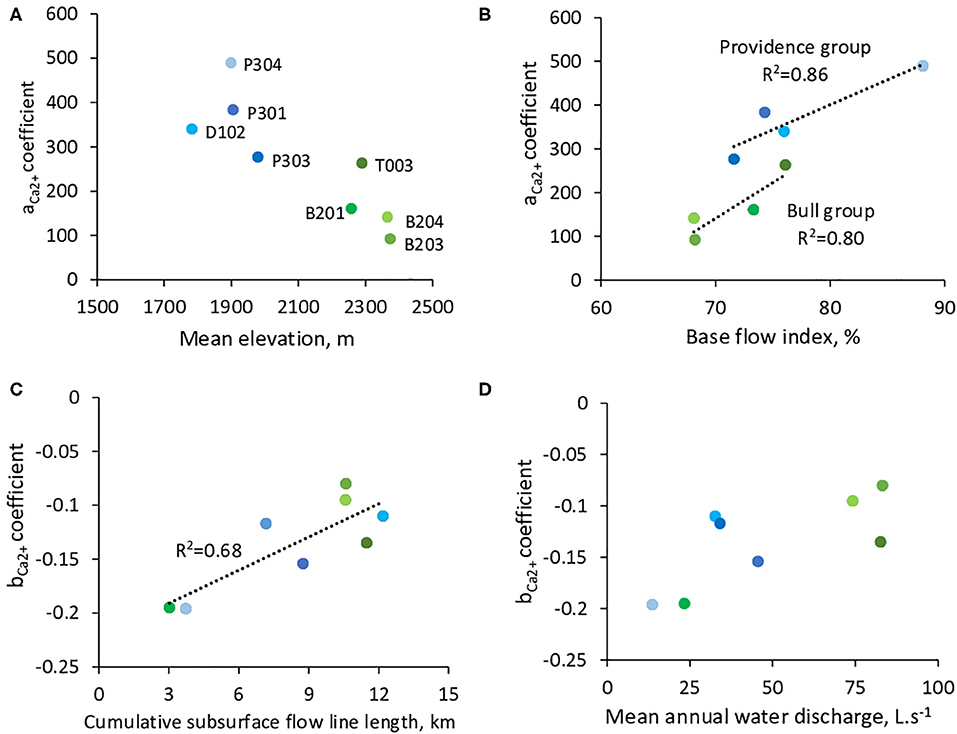
Figure 6. Relations between C-Q shapes (aca2+ and bca2+ coefficients) and a selection of geomorphologic and hydrologic features for the KREW watersheds. (A) aca2+ vs. mean watershed elevations (m). (B) Relationship between aca2+ and the base flow index for the KREW watersheds. The values of base flow index are from Safeeq and Hunsaker (2016). (C) bca2+ vs. cumulative length of the subsurface flow lines. (D) bca2+ vs. mean annual water discharge from the streams at the outlets.
The best agreement between measured and modeled C-Q relations for the reference watershed P301 was obtained with a mean saturated thickness of 4 m (Figure 7). With a 4-m thickness both discharge and Ca2+ concentrations were correctly captured at the P301 outlet (Figure 7A). Simulations with a thinner or thicker mean saturated thicknesses underestimate or overpredict Ca2+ concentrations, respectively. For illustration, simulations with a mean saturated thickness of 1 m produced faster subsurface flows, shorter transit times and underestimated the Ca2+ concentrations at the outlet (Figures 7A,B). In contrast, simulations with a mean saturated thickness of 10 m generated slower flows and longer transit times, but overpredict stream water Ca2+ concentrations (Figures 7A,B).
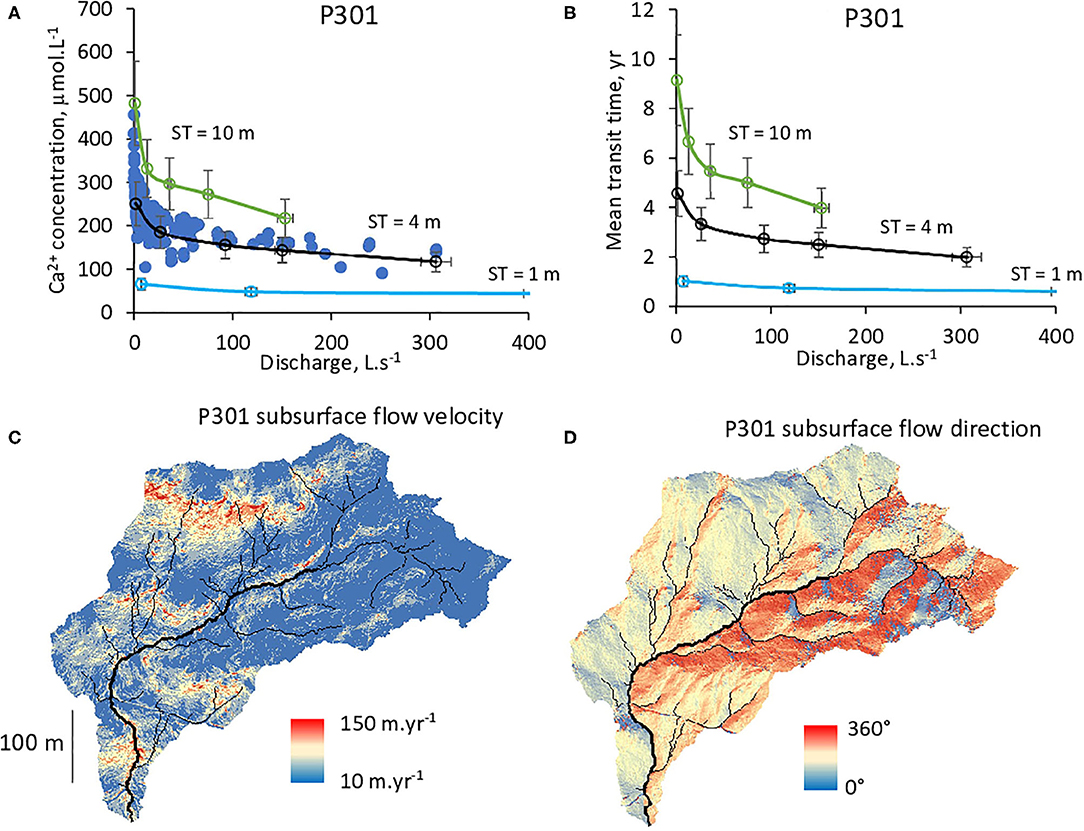
Figure 7. Hydrogeochemical modeling of the P301 watershed. (A) C-Q diagram for Ca2+ and stream water. Dark blue points represent measured values. Green, black and light blue lines represent modeling results with saturated thicknesses (ST) of 10, 4, and 1 m, respectively. (B) Modeled mean transit times. (C) Map of subsurface flow velocity generated with a saturated thickness of 4 m. (D) Map of subsurface flow direct ion generated with a saturated thickness of 4 m.
For the best fit with a saturated thickness of 4 m, the simulated subsurface flow velocities vary between 10 and 150 m.yr−1 along the watershed's slopes (Figure 7C). Gentle parts (slope <20 %) of the watershed have slower velocities while faster subsurface flows take place in the steep (slope >20 %) northern parts (Figure 7C). The calculated mean transit times for the stream waters range between 2 year for the wettest conditions and 5 year for the driest periods observed between 2003 and 2007 (Figure 7B). The average mean transit time over the 2003–2007 period for the P301 stream water is 4.1 year (Table 3).
The estimated values of mean saturated thicknesses that best match the C-Q relations vary between 3 and 7 m (Table 3). The thinnest mean saturated thicknesses (ST) are located in the higher-elevation B203 and B204 watersheds (3 m). T003, D102, P301, and P303 have intermediate values (4–5 m). The largest estimates of mean saturated thickness are in B201 and P304 (6–7 m). Mean subsurface flow velocities are between 27 and 76 m.yr−1 (Table 3). Steep slopes (D102) and/or thin saturated thicknesses (B203) generate higher velocities (Figure 8), while watersheds with gentler slopes and thicker saturated thicknesses (B201, P304) have lower velocities (Figure 8, Figure SM2 in Supplementary Materials).
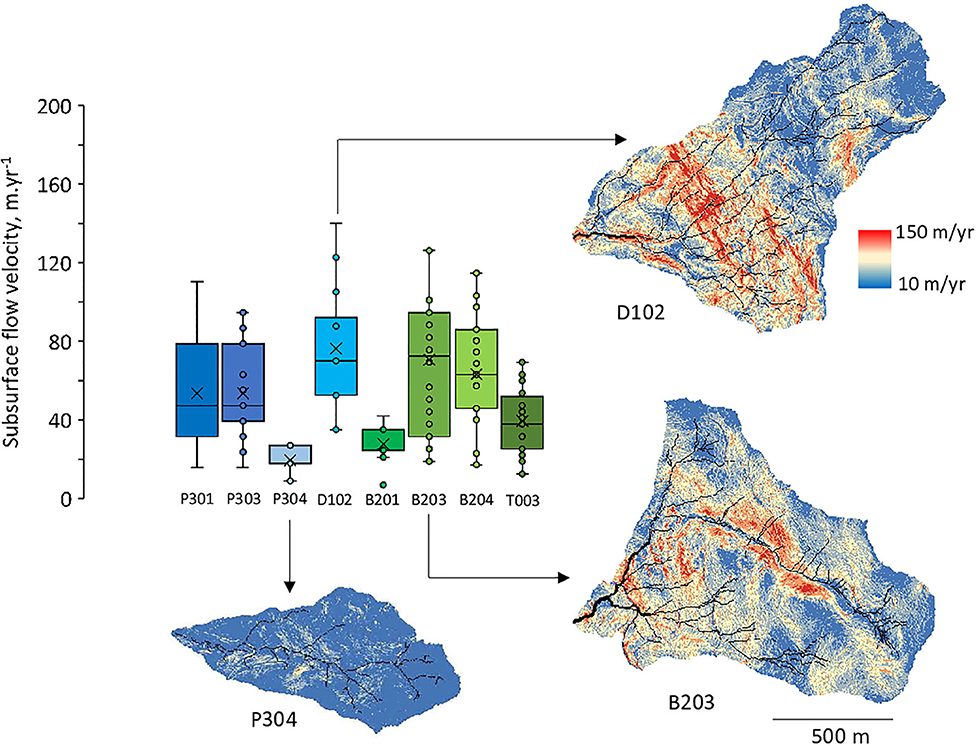
Figure 8. Distribution of the simulated subsurface flow velocities along the flow lines. The distribution is shown for average hydrologic conditions. Illustrations are provided for three watersheds: P304, D102, and B203. The color scale is identical for all the watersheds to highlight the contrast between sites.
The contrasting CZ structures and subsurface-drainage networks imply different distributions of mean transit times along the subsurface flow lines. Both velocities and flow line lengths control mean transit times. Shorter flow lines and faster velocities generate shorter transit times (Figures 9, 10, i.e. B203 and B204). Watersheds with longer subsurface flow lines and/or slower velocities tend to have longer transit times (Figures 9, 10, i.e., B201, T003 and P304, Figure SM3 in Supplementary Materials). Estimated average mean transit times range from 2.8 year (B203) to 7.6 year (P304, Table 3). The simulated C-Q relations and mean transit times for all the KREW are given in Figure 10. Simulations capture the observed C-Q relations for the watersheds.
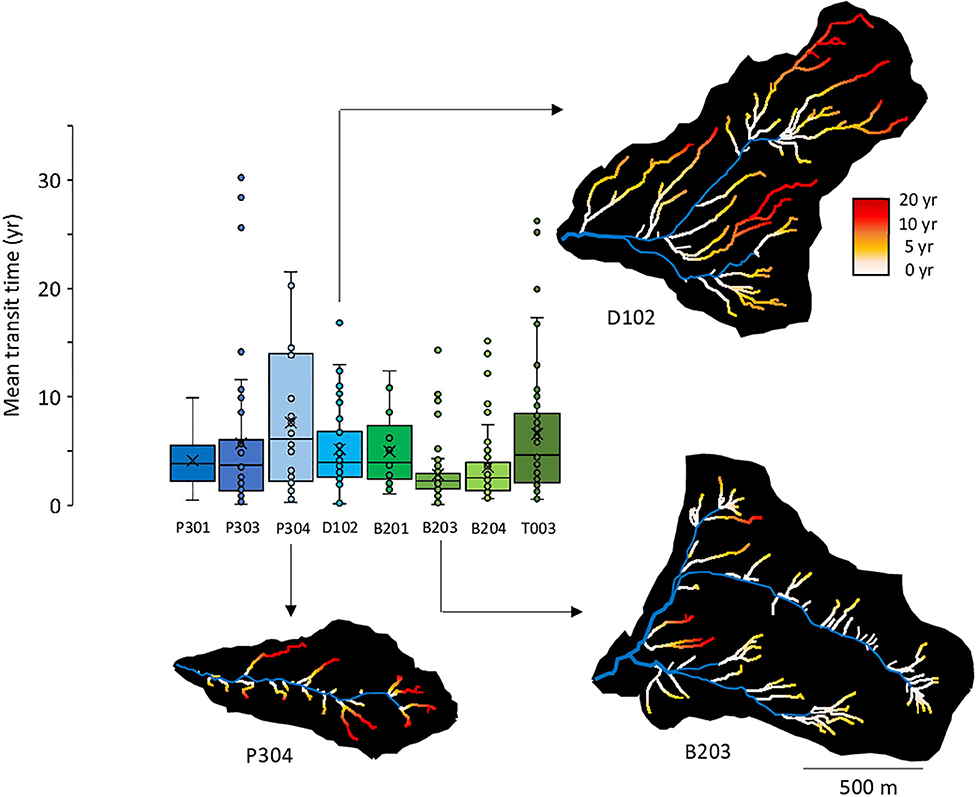
Figure 9. Distribution of the simulated mean transit times along the subsurface flow lines. The distribution is shown for average hydrologic conditions. Mean transit times were calculated by combining subsurface flow line lengths and flow velocities. Illustrations are provided for three watersheds: P304, D102, and B203. The color scale is identical for all the watersheds to highlight the contrast between sites.
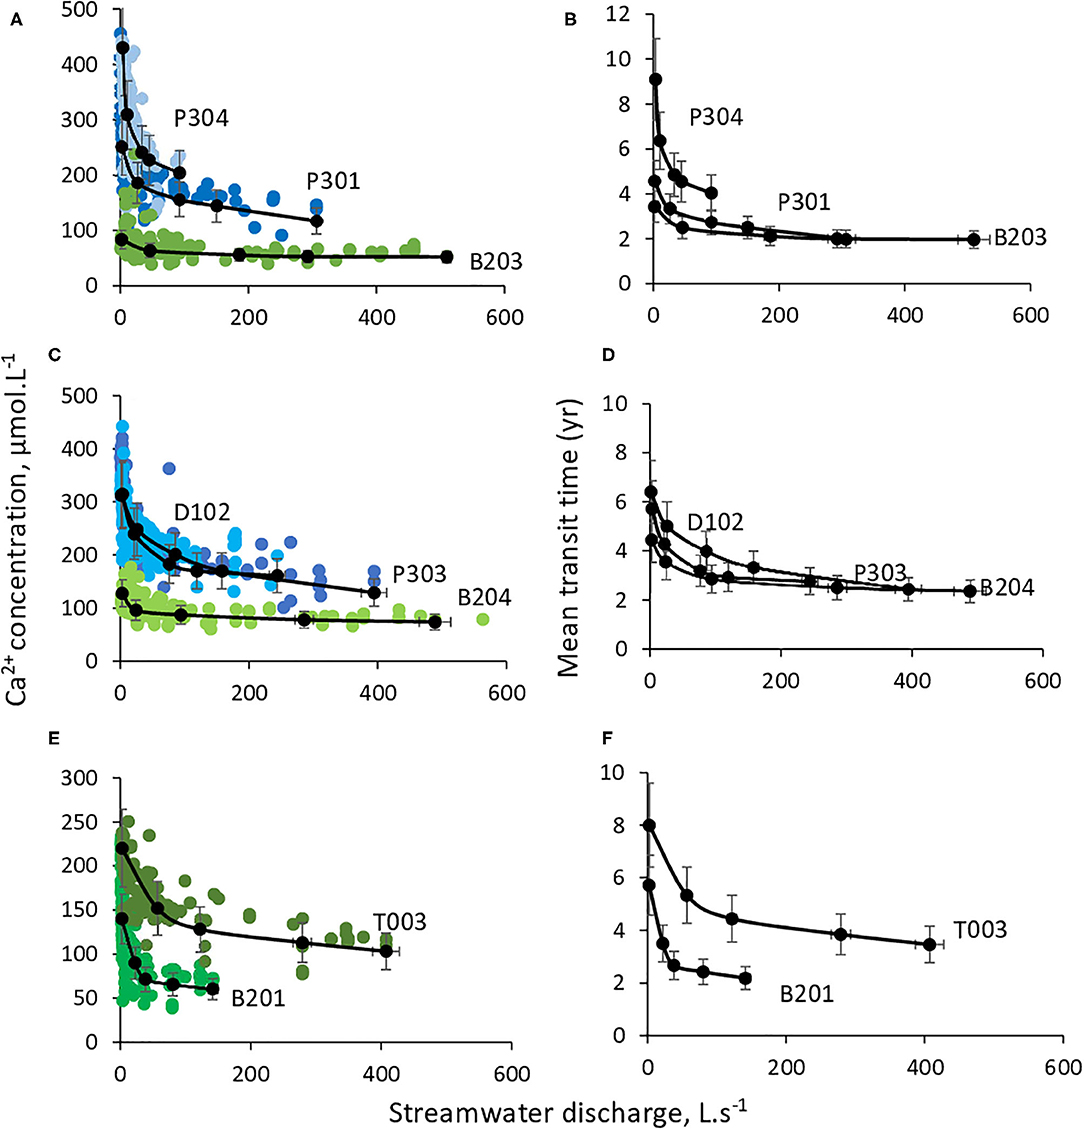
Figure 10. Modeling results of C-Q relations (A,C,E) and mean transit times (B,D,F) for all the KREW stream waters. Black lines show modeling results and color points represent measured values.
A strong negative correlation is observed between bCa2+ and the estimated saturated thicknesses (R2 = 0.86, Figure 11A). Watersheds with thin saturated thicknesses are the most chemostatic (B203 and B204, ST = 3 m, bCa2+ = −0.080 to −0.095), while watersheds with thicker saturated thicknesses are more chemodynamic (B201 and P304, ST=6 to 7 m, bCa2+= −0.195 to −0.196). A good correlation is also found between the calculated mean transit times of stream water and BFI (Figure 11B). The watersheds with a higher proportion of base flows are consistently characterized by longer mean transit times.
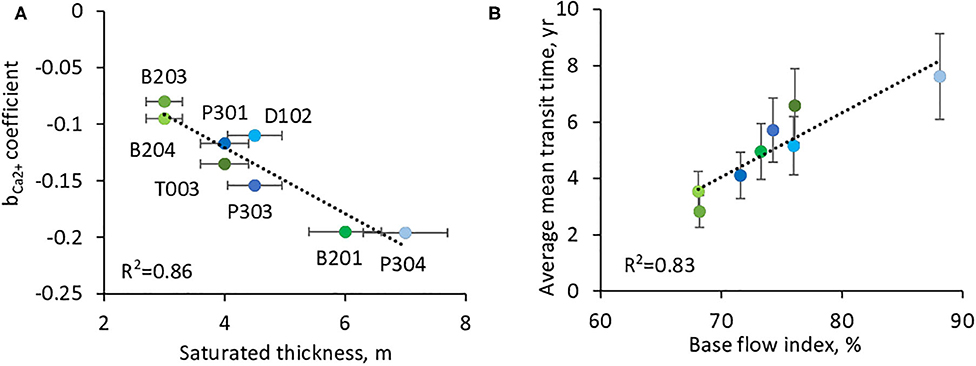
Figure 11. Relations between water storage capacity, bca2+ coefficient and average mean transit times. (A) Relationship between the bca2+ coefficient of C-Q relations and the estimated saturated thicknesses. (B) Relationship between the modeled average mean transit times and the base flow index (BFI) of watersheds.
Multiple tests and simulations were performed to evaluate the sensitivity of the model to data uncertainties. This exercise allows to estimate how the uncertainties from regolith properties could impact model results and simulated C-Q relations. The first set of simulations was performed to estimate the impact of analytical uncertainties in regolith mineralogy on ionic concentrations in stream water. Increasing the mass fraction of Ca-bearing minerals by 10% while keeping other parameters constant increases the Ca2+ concentrations in P301 stream water by approximately 6%. The aCa2+ coefficient of the simulated C-Q relation increases by 6%, while the bCa2+ coefficient increases only by 1%. Thus, the simulated C-Q relation is affected by the mineralogical variations primarily though changes in the height of the C-Q relation (aCa2+). Simulated mean transit times are not impacted by mineralogical variations.
We also tested the impact of uncertainties in soil-solution composition on simulated stream water concentrations. An increase of 1% of Ca2+ concentration in soil solutions has a negligible impact on mean Ca2+ concentrations in stream waters and aCa2+ (variations of 0.5%). The coefficient bCa2+ is insensitive to variations of soil solution concentrations. Variations of the soil solution pH from 6 to 6.5 modify aCa2+ by 1–8 % but have no effects on bCa2+. The modeled chemodynamic behavior is therefore not very sensitive to chemical compositions of soil solutions used as input solutions into the regolith. Simulated mean transit times are not impacted by soil-solution variations.
The model sensitivity to variations of regolith porosity and hydraulic conductivity at saturation (Ksat) has been also explored. aCa2+ is affected by variations of porosity, with a 5–20% increase associated with 5–30% increase in porosity. bCa2+ only weakly responds by 1–2%, and the mean transit times are not impacted by porosity variation alone. Our sensitivity analysis reveals that hydraulic conductivity is a key parameter for the modeling of C-Q relations. Both aCa2+ and bCa2+ are sensitive to modifications of Ksat. Increasing Ksat by 5–30% decreases aCa2+ by 6–20% and decreases bCa2+ by 3–6%. Mean transit times inferred from the modeling are also sensitive to Ksat, with transit times decreasing by 5–30% when Ksat increases by 5–30%. Relying on field measurements of Ksat as well as porosity and regolith mineralogical characterization is therefore important for accurate modeling of C-Q relations.
Modeling results can be compared with independent estimates from field campaigns, geophysical sampling and results from isotopic studies. In a recent study, cosmogenic isotopes in stream water (tritium, sodium-22 and sulfur-35) were combined with the modeling of age-ranked storage selection to estimate water ages for the P301 stream (Visser et al., 2019). They found the mean age of stream water for 2004–2016 was 4.4 year. The value for 2003–2007 was 4.5 year, which was similar to the 4.1 year estimate of mean transit time our study computed from hydrogeochemical modeling over the same period (Table 3).
On the basis of age-ranked storage-selection modeling, Visser et al. (2019) also found that the regolith of P301 averaged 3 m of water in storage, varying between 2.7 m for dry years and 4 m for wet years. Other geophysical investigations involving seismic refraction and tomographic inversion have estimated a water-storage potential between 1 and 5 m along P301 slopes, averaging 3 m for P301 (Holbrook et al., 2014). All of these mean values are similar to the average saturated thickness of 4 m inferred in P301 from our hydrogeochemical modeling of C-Q relations.
The estimates of mean saturated thicknesses obtained from hydrogeochemical modeling can be compared with the regolith thicknesses that have been measured from Geoprobe sampling in Providence (O'Geen et al., 2018). The mean saturated thicknesses must be equal or less than the average regolith thicknesses measured in the watersheds. In all cases our mean saturated thicknesses (4–4.5 m) are lower and compatible with measured mean regolith thicknesses (4–6 m) on the watersheds. No regolith thickness measurements are available in P304, but the higher water storage determined by the hydrogeochemical modeling is consistent with the dampened hydrologic behavior and the higher base flow index in P304 (Safeeq and Hunsaker, 2016).
Little data are available for a direct comparison of modeled results in the Bull watersheds. However, the lower water storage and saturated thickness inferred from the geochemical modeling over three Bull watersheds (T003, B203, and B204) are consistent with previous studies in the region (e.g., Hubbert et al., 2001; Klos et al., 2018; O'Geen et al., 2018). By investigating plant-accessible water in mountain ecosystems, Klos et al. (2018) concluded that regolith thickness and water-storage capacity decrease with increasing elevation in the higher parts of the Sierra Nevada. Measured regolith thicknesses along the SSCZO elevation gradient (Figure 1) also show a trend of decreasing thickness from 2000 to 2700 m, with mean regolith thickness decreasing from 5 to 1.5 m between Providence and Short Hair (Short Hair on Figure 1; O'Geen et al., 2018). The lowest saturated thicknesses estimated by the hydrogeochemical modeling were located in the B203 and B204 watersheds, and corresponded to the lowest base flow indexes. Our modeling results using reactive-transport approaches and C-Q relations are therefore consistent with several independent estimates from hydrologic, geophysical and isotopic studies.
The principal contribution of our study is to determine how CZ structure controls hydrogeochemical behavior and C-Q relations in headwater watersheds (Figure 12). We found that mean stream concentrations and heights of C-Q relations (aCa2+ coefficient) are primarily controlled by regolith mineralogy and mean transit times of stream water (Figures 6B, 10). The control of regolith geochemistry on stream chemistry is consistent with previous studies conducted at the KREW (Hunsaker and Johnson, 2017). Additionally, hydrogeochemical modeling indicates that the degree of chemodynamic behavior (bCa2+ coefficient) is mainly controlled by the seasonal variability of mean transit times during dry periods (Figure 10). This seasonal variability itself is controlled by the geomorphologic features governing the water-storage capacity. Watersheds with thinner saturated thicknesses, a larger stream network and shorter subsurface flow lines have limited storage capacity and show limited variability of water transit times and chemostatic behaviors (e.g., B204, B203 in Figure 12). Watersheds with thicker saturated thicknesses and a more limited stream network have larger storage capacity and show higher variability of mean transit times and more chemodynamic behavior (e.g., B201, P304 in Figure 12).
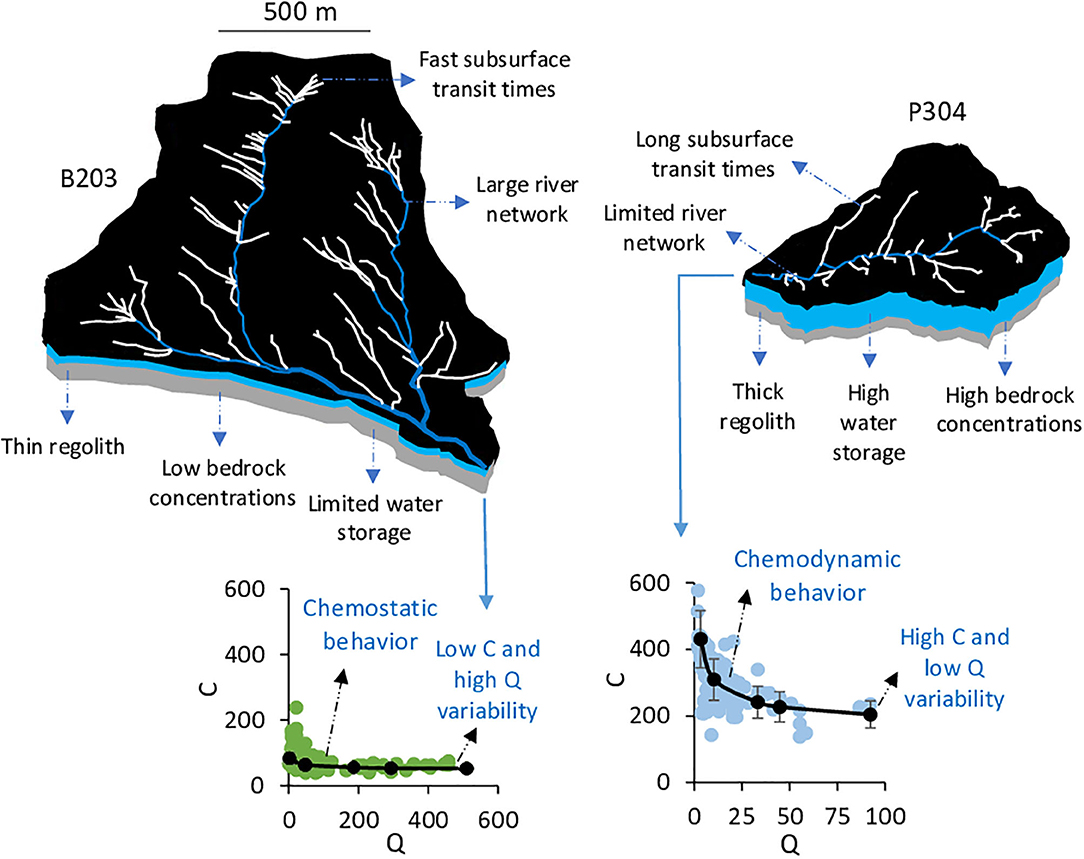
Figure 12. Summary diagram of the CZ structures acquired through long-term processes that control the C-Q relations and hydrogeochemicaI behavior of watersheds. Thin regolith, large river network, fast subsurface transit times, limited water storage and low bedrock concentrations enhance low mean concentrations and chemostatic behavior for the stream waters. In contrast, thick regolith, limited stream networks, slow subsurface transit times, high water storage and high bedrock concentrations enhance high mean concentrations and chemodynamic behavior for the streamwaters.
The combination of chemostatic behavior with high mean stream water concentrations was not observed (section Hydrology and C-Q Relations), and this is explained by the fact that chemostatic behavior is caused by an absence of significant water storage, preventing the presence of waters with long transit times and high concentrations. This scheme is also consistent with the variability of water discharge and the base flow index (BFI, Table 2). The chemostatic watersheds clearly have hydrologic characteristics pointing to an absence of large water storage, with a high seasonal variability of water discharge and low BFI (Table 2). The chemodynamic watersheds show the opposite hydrologic characteristics, with low seasonal variability of stream discharge and a higher BFI (Table 2).
One of the important takeaways from this study is that the CZ structure in headwater watersheds matters more than their watershed areas for the understanding of hydrogeochemical behavior. For example, B203 has a watershed area that is 2.5 times the area of P304 (Table 2), however, its CZ structure with a thin saturated thickness, short subsurface flow lines and fast transit times generates low stream water concentrations and chemostatic behavior. P304 has higher water storage and longer transit times that generate high stream water concentrations and chemodynamic behavior. These results suggest that the analysis and modeling of C-Q relations should not be done solely with surface-area-normalized stream discharge (e.g., Wymore et al., 2017; Zhi et al., 2019), as stream water chemistry is primarily controlled by the CZ structure and the distribution of subsurface flow lines, and not by watershed surface areas. At this stage, this point applies only for small headwater watersheds where our approach has been tested. The application of surface-area-normalized data cannot be evaluated with our study for larger watersheds (e.g., Moatar et al., 2017).
Since CZ structure constrains the shapes of C-Q relations, our study opens the possibility of estimating CZ attributes from existing C-Q data where the rich set of field investigations that we had are not available. For example, while combining data on regolith mineralogy with C-Q data from stream waters, the reactive-transport modeling of C-Q relations can be used to estimate water storage and water transit times. This point has implications for using C-Q relations as a tool to estimate water-storage and drought resistance.
We underline that these applications and implications hold when interpreting solutes in stream water with an important lithogenic origin, a strong C-MTT slope, and negative C-Q relations (C tend to decrease with Q, i.e., Ca2+, H4SiO4, …). Different strategies could be developed for other species with positive C-Q relations (C tend to increase with Q, i.e., , ; Moatar et al., 2017). We expect that species with positive C-Q relations would not be explained in this way by the variability of transit times in the subsurface. Modeling positive C-Q relations could potentially be used to explore other processes in watersheds, such as remobilization processes from channels and soils, or interactions with the vegetation. This needs to be clearly tested in future studies with a specific focus on positive C-Q relations.
A number of recent studies have debated the extent to which C-Q relations are controlled by mixing processes between different water sources (Liu et al., 2017; Torres et al., 2017; Zhi et al., 2019). In our study, the mixing of different subsurface waters occurs when subsurface flow lines reach the stream network (Figure 2). No mixing with deep groundwater or with tributary streams was needed to explain the chemical variability. The variability of transit times within the regolith and the mixing of different subsurface flow lines connected to the stream is sufficient to explain the C-Q relations. Our results support that at the small scale of headwater watersheds (0–2 km2), stream chemistry and its variability are primarily controlled by the lateral flows within the regolith and the CZ structure controlling the architecture of the subsurface flow lines. The importance of lateral flows has been also highlighted in the modeling of geomorphologic evolution of hills (Brantley et al., 2017).
At lower elevations in the Sierra Nevada and for larger watersheds (500–2,000 km2), an influence from deep groundwater has been identified from the interpretation of C-Q relations from river waters (Liu et al., 2017). The magnitude of the deep-groundwater influence tends to increase when the elevation decreases and the river size increases (Liu et al., 2017). For major rivers, the mixing between different waters can be important when different tributaries draining contrasting lithologies are merged (Torres et al., 2017). Our results and the comparison with previous studies suggest that the nature and magnitude of mixing processes affecting C-Q relations depend to the river order from which water samples are coming. Complexity and contributions of mixing processes appear to increase from headwater streams to large-scale rivers.
In this study, we did not address the potential mixing of different waters coming from different vertical layers in the regolith. Vertically-averaged regolith properties, as used in this study, permit reduced computation times and the number of parameters in the model; however, this modeling approach cannot show the role of different regolith layers (i.e., superficial soil, soil base, lower saprolith) in the acquisition of C-Q relations. A potential improvement of our modeling strategy in future studies is a more detailed description of the CZ vertical heterogeneity and its incorporation in our modeling approach. This would imply that we either consider 2D cross-sections rather than 1D subsurface flow lines, or that we consider multiple subsurface flow lines distributed vertically with mixing between them. However, it is worth noting that this increase in model complexity would significantly increase the amount of field data needed to constrain the regolith physical, geochemical, and hydrologic properties for all the regolith layers in the KREW. In addition, our study did not evaluate the effect of direct input of snowmelt waters into the streams.
This study, which was conducted along an elevation gradient of eight watersheds, has implications for understanding the impact of droughts and hydrologic changes in a warmer climate. Presently, higher-elevation watersheds generate a greater fraction of runoff from the Sierra Nevada (Harrington and Bales, 1998; Meixner et al., 2004; Rice et al., 2011; Hunsaker et al., 2012). Our modeling results showed that higher-elevation watersheds (i.e., B203, B204) with thinner regolith and dilute stream chemistry have lower water-storage capacity and shorter water-transit times than the mid-elevation watersheds (i.e., P301, P303, P304). These results imply that in a warming climate with decreasing snowpacks, higher-elevation watersheds may not have sufficient storage capacity in the regolith to compensate for the water that is currently stored in snowpack during winter. Higher temperatures are also expected to produce larger flood events during the winter, followed by longer and drier summers with less runoff available for downstream users. This scenarios of the future hydrologic response in the Sierra Nevada is consistent with previous studies investigating changes in runoff (Hunsaker et al., 2012), vegetation (Goulden and Bales, 2014) and flooding (Das et al., 2013). More broadly, mountain watersheds that experienced Pleistocene glaciations have been scoured by glacial and periglacial processes (Ackerer et al., 2016; Callahan et al., 2019), resulting in thinner regolith and potentially lower water-storage capacities. The CZ structure, which is acquired through long-term processes, may not be adaptable to the rapid changes in climate and snowpack that are currently being observed. This will change the hydrologic behavior of mountain watersheds and have implications for downstream storage capacity and operations.
Detailed geomorphologic analysis, characterization of C-Q relations and reactive-transport modeling from a unique elevation gradient determined how CZ structure controls hydrogeochemical behavior of watersheds. Our results indicate that (1) CZ attributes and structure are key determinants of C-Q relations (2) mean stream water concentrations and heights of C-Q relations are primarily controlled by the regolith mineralogy and mean transit times of subsurface water, and (3) the degree of chemodynamic behavior is very sensitive to the water-storage in watersheds. Watersheds with thinner regolith, larger stream networks and limited water storage have faster transit times along subsurface flow lines and show stream chemistry with limited seasonal variability (i.e., chemostatic behavior). In contrast, watersheds with thicker regolith, smaller stream networks and larger water storage have longer transit times along subsurface flow lines and exhibit greater chemical variability (i.e., chemodynamic behavior). No mixing with deep groundwater was needed to explain the chemical variability of stream water. Independent estimates of mean transit times and water-storage from other isotopic, hydrologic and geophysical studies were consistent with our results inferred from the modeling of C-Q relations. This study opens the possibility to estimate CZ characteristics such as water-storage capacity and mean transit times in headwater watersheds by using quantitative modeling of C-Q relations.
All datasets generated for this study are included in the article/Supplementary Material.
JA performed the majority of the research presented in this manuscipt. CS was involved for the reactive-transport modeling. FL was involved for the chemical data and interpretation of C-Q relations. RBar was involved for the using of ArcGIS and DEM interpretation. MS was involved for the using of ArcGIS and DEM interpretation as well along with hydrometeorological data from KREW. AO'G was involved for regolith data, regolith thickness data, and mineralogical data. CH was involved for KREW data. RBal was involved for manuscript reading and re-writing and KREW data. All authors contributed to the article and approved the submitted version.
This study was supported by the U.S. National Science Foundation (NSF) through the Southern Sierra Critical Zone Observatory (EAR-0725097). This research was also supported by the long-term collaborations with the Pacific Southwest Research Station and the U.S Forest Service. CS was supported by the Watershed Function Science Focus Area at Lawrence Berkeley National Laboratory funded by the U.S. Department of Energy, Office of Science, Biological and Environmental Research under Contract No. DE-AC02-05CH11231.
The authors declare that the research was conducted in the absence of any commercial or financial relationships that could be construed as a potential conflict of interest.
The Supplementary Material for this article can be found online at: https://www.frontiersin.org/articles/10.3389/frwa.2020.00023/full#supplementary-material
Ackerer, J., Chabaux, F., Lucas, Y., Clément, A., Fritz, B., Beaulieu, E., et al. (2018). Monitoring and reactive-transport modeling of the spatial and temporal variations of the Strengbach spring hydrochemistry. Geochim. Cosmochim. Acta 225, 17–35. doi: 10.1016/j.gca.2018.01.025
Ackerer, J., Chabaux, F., Van der Woerd, J., Viville, D., Pelt, E., Kali, E., et al. (2016). Regolith evolution on the millennial timescale from combined U–Th–Ra isotopes and in situ cosmogenic 10Be analysis in a weathering profile (Strengbach watershed, France). Earth Planet. Sci. Lett. 453, 33–43. doi: 10.1016/j.epsl.2016.08.005
Ackerer, J., Jeannot, B., Delay, F., Weill, S., Lucas, Y., Fritz, B., et al. (2020). Crossing hydrological and geochemical modeling to understand the spatiotemporal variability of water chemistry in an elementary watershed (Strengbach, France). Hydrol. Earth Syst. Sci. 24, 3111–3133. doi: 10.5194/hess-24-3111-2020
Ameli, A. A., Beven, K., Erlandsson, M., Creed, I. F., McDonnell, J. J., and Bishop, K. (2017). Primary weathering rates, water transit times, and concentration-discharge relations: A theoretical analysis for the critical zone. Water Resour. Res. 53, 942–960. doi: 10.1002/2016WR019448
Bales, R. C., Goulden, M. L., Hunsaker, C. T., Conklin, M. H., Hartsough, P. C., O'Geen, A. T., et al. (2018). Mechanisms controlling the impact of multi-year drought on mountain hydrology. Sci. Rep. 8:690. doi: 10.1038/s41598-017-19007-0
Bales, R. C., Hopmans, J. W., O'Geen, A. T., Meadows, M., Hartsough, P. C., Kirchner, P., et al. (2011). Soil moisture response to snowmelt and rainfall in a Sierra Nevada mixed-conifer forest. Vadose Zone J. 10, 786–799. doi: 10.2136/vzj2011.0001
Bart, R., and Hope, A. (2014). Inter-seasonal variability in baseflow recession rates: the role of aquifer antecedent storage in central California watersheds. J. Hydrol. 519, 205–213. doi: 10.1016/j.jhydrol.2014.07.020
Bateman, P. C., and Busacca, A. J. (1983). Millerton Lake Quadrangle, Westcentral Sierra Nevada, California – Analytic Data, US Geological Survey Professional Paper, Vol. 1261. Reston, VA: US Geological Survey. doi: 10.3133/pp1261
Bateman, P. C., and Lockwood, J. P. (1976). Shaver Lake Quadrangle, Westcentral Sierra Nevada, California – Analytic Data. US Geological Survey Professional Paper, Vol. 774-D. Reston, VA: US Geological Survey. doi: 10.3133/pp774D
Brantley, S. L., Lebedeva, M. I., Balashov, V. N., Singha, K., Sullivan, P. L., and Stinchcomb, G. (2017). Toward a conceptual model relating chemical reaction fronts to water flow paths in hills. Geomorphology 277, 100–117. doi: 10.1016/j.geomorph.2016.09.027
Callahan, R. P., Ferrier, K. L., Dixon, J., Dosseto, A., Hahm, W. J., Jessup, B. S., et al. (2019). Arrested development: Erosional equilibrium in the southern Sierra Nevada, California, maintained by feedbacks between channel incision and hillslope sediment production. GSA Bulletin 131, 1179–1202. doi: 10.1130/B35006.1
Chorover, J., Derry, L. A., and McDowell, W. H. (2017). Concentration-Discharge Relations in the Critical Zone: Implications for Resolving Critical Zone Structure, Function, and Evolution. Water Resour. Res. 53, 8654–8659. doi: 10.1002/2017WR021111
Chorover, J., Troch, P. A., Rasmussen, C., Brooks, P. D., Pelletier, J. D., Breshears, D. D., et al. (2011). How water, carbon, and energy drive critical zone evolution: The Jemez–Santa Catalina Critical Zone Observatory. Vadose Zone J. 10, 884–899. doi: 10.2136/vzj2010.0132
Das, T., Maurer, E. P., Pierce, D. W., Dettinger, M. D., and Cayan, D. R. (2013). Increases in flood magnitudes in California under warming climates. J. Hydrol. 501, 101–110. doi: 10.1016/j.jhydrol.2013.07.042
Diamond, J. S., and Cohen, M. J. (2018). Complex patterns of watershed solute–discharge relationships for coastal plain rivers. Hydrol. Processes 32, 388–401. doi: 10.1002/hyp.11424
Gérard, F., Clement, A., and Fritz, B. (1998). Numerical validation of a Eulerian hydrochemical code using a 1D multisolute mass transport system involving heterogeneous kinetically controlled reactions. J. Contam. Hydrol. 30, 201–216. doi: 10.1016/S0169-7722(97)00047-8
Godsey, S. E., Kirchner, J. W., and Clow, D. W. (2009). Concentration–discharge relationships reflect chemostatic characteristics of US watersheds. Hydrol. Processes 23, 1844–1864. doi: 10.1002/hyp.7315
Goulden, M. L., Anderson, R. G., Bales, R. C., Kelly, A. E., Meadows, M., and Winston, G. C. (2012). Evapotranspiration along an elevation gradient in California's Sierra Nevada. J. Geophys. Res. 117:G3. doi: 10.1029/2012JG002027
Goulden, M. L., and Bales, R. C. (2014). Mountain runoff vulnerability to increased evapotranspiration with vegetation expansion. Proc. Natl. Acad. Sci. 111, 14071–14075. doi: 10.1073/pnas.1319316111
Harrington, R., and Bales, R. C. (1998). Modeling ionic solute transport in melting snow. Water Resour. Res. 34, 1727–1736. doi: 10.1029/98WR00557
Herndon, E. M., Dere, A. L., Sullivan, P. L., Norris, D., Reynolds, B., and Brantley, S. L. (2015). Landscape heterogeneity drives contrasting concentration–discharge relationships in shale headwater watersheds. Hydrol. Earth Syst. Sci. 19, 3333–3347. doi: 10.5194/hess-19-3333-2015
Herndon, E. M., Steinhoefel, G., Dere, A. L., and Sullivan, P. L. (2018). Perennial flow through convergent hillslopes explains chemodynamic solute behavior in a shale headwater watershed. Chem. Geol. 493, 413–425. doi: 10.1016/j.chemgeo.2018.06.019
Holbrook, W. S., Riebe, C. S., Elwaseif, M. L., Hayes, J., Basler-Reeder, K., Harry, D. L., et al. (2014). Geophysical constraints on deep weathering and water storage potential in the Southern Sierra Critical Zone Observatory. Earth Surface Processes Landforms 39, 366–380. doi: 10.1002/esp.3502
Hubbert, K. R., Beyers, J. L., and Graham, R. C. (2001). Roles of weathered bedrock and soil in seasonal water relations of Pinus jeffreyi and Arctostaphylos patula. Can. J. Forest Res. 31, 1947–1957. doi: 10.1139/x01-136
Hunsaker, C. T., and Johnson, D. W. (2017). Concentration-discharge relationships in headwater streams of the S ierra N evada, C alifornia. Water Resour. Res. 53, 7869–7884. doi: 10.1002/2016WR019693
Hunsaker, C. T., Whitaker, T. W., and Bales, R. C. (2012). Snowmelt runoff and water yield along elevation and temperature gradients in California's southern sierra nevada 1. J. Am. Water Res. Association 48, 667–678. doi: 10.1111/j.1752-1688.2012.00641.x
Jessup, B. S., Jesse Hahm, W., Miller, S. N., Kirchner, J. W., and Riebe, C. S. (2011). Landscape response to tipping points in granite weathering: The case of stepped topography in the Southern Sierra Critical Zone Observatory. Appl. Geochem. 26, S48–S50. doi: 10.1016/j.apgeochem.2011.03.026
Johnson, D. W., Hunsaker, C. T., Glass, D. W., Rau, B. M., and Roath, B. A. (2011). Carbon and nutrient contents in soils from the Kings River Experimental Watersheds, Sierra Nevada Mountains, California. Geoderma 160, 490–502. doi: 10.1016/j.geoderma.2010.10.019
Kim, H., Dietrich, W. E., Thurnhoffer, B. M., Bishop, J. K., and Fung, I. Y. (2017). Controls on solute concentration-discharge relationships revealed by simultaneous hydrochemistry observations of hillslope runoff and stream flow: The importance of critical zone structure. Water Resour. Res. 53, 1424–1443. doi: 10.1002/2016WR019722
Klos, P. Z., Goulden, M. L., Riebe, C. S., Tague, C. L., O'Geen, A. T., Flinchum, B. A., et al. (2018). Subsurface plant-accessible water in mountain ecosystems with a Mediterranean climate. Wiley Interdiscipl. Rev. 5:e1277. doi: 10.1002/wat2.1277
Lackey, J. S., Cecil, M. R., Windham, C. J., Frazer, R. E., Bindeman, I. N., and Gehrels, G. E. (2012). The Fine Gold intrusive suite: the roles of basement terranes and magma source development in the Early Cretaceous Sierra Nevada batholith. Geosphere 8, 292–313. doi: 10.1130/GES00745.1
Li, L., Bao, C., Sullivan, P. L., Brantley, S., Shi, Y., and Duffy, C. (2017). Understanding watershed hydrogeochemistry: 2. Synchronized hydrologic and geochemical processes drive stream chemostatic behavior. Water Res. Res. 53, 2346–2367. doi: 10.1002/2016WR018935
Liu, F., Conklin, M. H., and Shaw, G. D. (2017). Insights into hydrologic and hydrochemical processes based on concentration-discharge and end-member mixing analyses in the mid-Merced R iver B asin, S ierra N evada, C alifornia. Water Resour. Res. 53, 832–850. doi: 10.1002/2016WR019437
Liu, F., Hunsaker, C., and Bales, R. C. (2013). Controls of streamflow generation in small watersheds across the snow–rain transition in the Southern Sierra Nevada, California. Hydrol. Processes 27, 1959–1972. doi: 10.1002/hyp.9304
Liu, Y. B., Gebremeskel, S., De Smedt, F., Hoffmann, L., and Pfister, L. (2003). A diffusive transport approach for flow routing in GIS-based flood modeling. J. Hydrol. 283, 91–106. doi: 10.1016/S0022-1694(03)00242-7
Lucas, Y., Chabaux, F., Schaffhauser, T., Fritz, B., Ambroise, B., Ackerer, J., et al. (2017). Hydrogeochemical modeling (KIRMAT) of spring and deep borehole water compositions in the small granitic Ringelbach watershed (Vosges Mountains, France). Appl. Geochem. 87, 1–21. doi: 10.1016/j.apgeochem.2017.10.005
Meixner, T., Gutmann, C., Bales, R., Leydecker, A., Sickman, J., Melack, J., et al. (2004). Multidecadal hydrochemical response of a Sierra Nevada watershed: sensitivity to weathering rate and changes in deposition. J. Hydrol. 285, 272–285. doi: 10.1016/j.jhydrol.2003.09.005
Moatar, F., Abbott, B. W., Minaudo, C., Curie, F., and Pinay, G. (2017). Elemental properties, hydrology, and biology interact to shape concentration-discharge curves for carbon, nutrients, sediment, and major ions. Water Resour. Res. 53, 1270–1287. doi: 10.1002/2016WR019635
Musolff, A., Schmidt, C., Selle, B., and Fleckenstein, J. H. (2015). Catchment controls on solute export. Adv. Water Resour. 86, 133–146. doi: 10.1016/j.advwatres.2015.09.026
Ngo, V. V., Delalande, M., Clément, A., Michau, N., and Fritz, B. (2014). Coupled transport-reaction modeling of the long-term interaction between iron, bentonite and Callovo-Oxfordian claystone in radioactive waste confinement systems. Appl. Clay Sci. 101, 430–443. doi: 10.1016/j.clay.2014.08.020
O'Geen, A. T., Safeeq, M., Wagenbrenner, J., Stacy, E., Hartsough, P., Devine, S., et al. (2018). Southern sierra critical zone observatory and kings river experimental watersheds: a synthesis of measurements, new insights, and future directions. Vadose Zone J. 17:81. doi: 10.2136/vzj2018.04.0081
Reis, F. D. A., and Brantley, S. L. (2019). The impact of depth-dependent water content on steady state weathering and eroding systems. Geochim. Cosmochim. Acta 244, 40–55. doi: 10.1016/j.gca.2018.09.028
Rice, R., Bales, R. C., Painter, T. H., and Dozier, J. (2011). Snow water equivalent along elevation gradients in the Merced and Tuolumne River basins of the Sierra Nevada. Water Resour. Res. 47:8. doi: 10.1029/2010WR009278
Safeeq, M., Grant, G. E., Lewis, S. L., and Tague, C. L. (2013). Coupling snowpack and groundwater dynamics to interpret historical streamflow trends in the western United States. Hydrol. Processes 27, 655–668. doi: 10.1002/hyp.9628
Safeeq, M., and Hunsaker, C. T. (2016). Characterizing runoff and water yield for headwater watersheds in the southern Sierra Nevada. J. Am. Water Res. Association 52, 1327–1346. doi: 10.1111/1752-1688.12457
Steefel, C. I., Appelo, C. A. J., Arora, B., Jacques, D., Kalbacher, T., Kolditz, O., et al. (2015). Reactive transport codes for subsurface environmental simulation. Comp. Geosci. 19, 445–478. doi: 10.1007/s10596-014-9443-x
Storck, P., Bowling, L., Wetherbee, P., and Lettenmaier, D. (1998). Application of a GIS-based distributed hydrology model for prediction of forest harvest effects on peak stream flow in the Pacific Northwest. Hydrol. Process 12, 889–904.
Sullivan, P. L., Stops, M. W., Macpherson, G. L., Li, L., Hirmas, D. R., and Dodds, W. K. (2019). How landscape heterogeneity governs stream water concentration-discharge behavior in carbonate terrains (Konza Prairie, USA). Chem. Geol. 527:118989. doi: 10.1016/j.chemgeo.2018.12.002
Tardy, Y., and Fritz, B. (1981). An ideal solid solution model for calculating solubility of clay minerals. Clay Minerals 16, 361–373. doi: 10.1180/claymin.1981.016.4.05
Tian, Z., Hartsough, P. C., and O'Geen, A. T. (2019). Lithologic, climatic and depth controls on critical zone transformations. Soil Sci. Soc. Am. J. 83, 437–447. doi: 10.2136/sssaj2018.03.0120
Torres, M. A., Baronas, J. J., Clark, K. E., Feakins, S. J., and West, A. J. (2017). Mixing as a driver of temporal variations in river hydrochemistry: 1. Insights from conservative tracers in the Andes-Amazon transition. Water Res. Res. 53, 3102–3119. doi: 10.1002/2016WR019733
Visser, A., Thaw, M., Deinhart, A., Bibby, R., Safeeq, M., Conklin, M., et al. (2019). Cosmogenic isotopes unravel the hydrochronology and water storage dynamics of the Southern sierra critical zone. Water Resour. Res. 55, 1429–1450. doi: 10.1029/2018WR023665
Wymore, A. S., Brereton, R. L., Ibarra, D. E., Maher, K., and McDowell, W. H. (2017). Critical zone structure controls concentration-discharge relationships and solute generation in forested tropical montane watersheds. Water Resour. Res. 53, 6279–6295. doi: 10.1002/2016WR020016
Keywords: critical zone, hydrogeochemical modeling, elevation gradient, watershed, C-Q relation
Citation: Ackerer J, Steefel C, Liu F, Bart R, Safeeq M, O'Geen A, Hunsaker C and Bales R (2020) Determining How Critical Zone Structure Constrains Hydrogeochemical Behavior of Watersheds: Learning From an Elevation Gradient in California's Sierra Nevada. Front. Water 2:23. doi: 10.3389/frwa.2020.00023
Received: 23 March 2020; Accepted: 14 July 2020;
Published: 21 August 2020.
Edited by:
Kamini Singha, Colorado School of Mines, United StatesReviewed by:
Matthys Alois Dippenaar, University of Pretoria, South AfricaCopyright © 2020 Ackerer, Steefel, Liu, Bart, Safeeq, O'Geen, Hunsaker and Bales. This is an open-access article distributed under the terms of the Creative Commons Attribution License (CC BY). The use, distribution or reproduction in other forums is permitted, provided the original author(s) and the copyright owner(s) are credited and that the original publication in this journal is cited, in accordance with accepted academic practice. No use, distribution or reproduction is permitted which does not comply with these terms.
*Correspondence: Julien Ackerer, anVsaWVuLmFja2VyZXJAb3JhbmdlLmZy
Disclaimer: All claims expressed in this article are solely those of the authors and do not necessarily represent those of their affiliated organizations, or those of the publisher, the editors and the reviewers. Any product that may be evaluated in this article or claim that may be made by its manufacturer is not guaranteed or endorsed by the publisher.
Research integrity at Frontiers
Learn more about the work of our research integrity team to safeguard the quality of each article we publish.