 Geison Carlos Xisto da Silva1Carlos Henrique Medeiros de Abreu2
 Nicholas D. Ward3,4*Liana Pereira Belúcio1Daímio Chaves Brito2Helenilza Ferreira Albuquerque Cunha1
 Alan Cavalcanti da Cunha1*
- 1Department of Environment and Development, Federal University of Amapá, Macapá, Brazil
- 2Department of Chemistry, University of Amapá State, Macapá, Brazil
- 3Marine Sciences Laboratory, Pacific Northwest National Laboratory, Sequim, WA, United States
- 4School of Oceanography, University of Washington, Seattle, WA, United States
Mitigating the environmental impacts caused by hydroelectric dams is a worldwide challenge. Aquatic ecosystems are most impacted during the reservoir filling phase, yet water quality and biogeochemical dynamics are not well-studied at this stage. Here we evaluate water quality and hydraulic parameters in the Araguari River (Amapá, Brazil) during the filling of the Ferreira Gomes Hydroelectric Power Plant reservoir (HPPFG). The following key variables were monitored along with 19 other physical and chemical variables: Trophic State Index (TSI), Total Coliform (TC), E. coli (EC), and Chlorophyll-a (Chl-a). The following hydraulic-operational variables were also investigated: inflows (QA), outflows (QD), and variation in reservoir volume (Vol%). Multiple Regression Analyses showed that the key parameters were both significantly influenced by physio-chemical and hydraulic variables. Dissolved oxygen levels showed significant spatial variation, likely due to influence of turbulence from two other hydropower complexes upstream of the HPPFG reservoir. Vol% influenced TSI, which ranged from oligotrophic to hypertrophic and eventually stabilized at mesotrophic. Levels of TSI, TC, and Chl-a decreased and the level of E. coli increased as a function of Vol%. Cluster Analysis showed the formation of three spatial groups—two inside the reservoir and one downstream. This suggests that in the rainy season or transition season, the hydraulic residence time in the reservoir is very low (16–36 h) when hydrodynamic processes are dominant. In the dry season residence times of roughly 1 month suggest that biogeochemical (e.g., nutrient utilization) and hydrodynamic processes occur at similar time scales. Overall, results from this study confirm the hypothesis that the filling phase has significant impacts on the key parameters of the water quality, which were at times above legal limits. We conclude that the filling phase generated environmental impacts and their repercussions should be considered in environmental assessment of future hydropower developments.
Introduction
As dam construction continues to rapidly expand around the world, it is necessary to evaluate and mitigate the social, economic, and ecological ramifications of impounding naturally flowing waters. Globally, more than 3,700 large dams are currently in the planning or construction stages, which are projected to reduce the number of free-flowing rivers on earth by 21% (Zarfl et al., 2015). The majority of planned hydropower projects are in developing nations. For example, there are currently 1,228 hydroelectric power plants (HPPs) planned in Brazil, among which 245 will be large HPPs (≥30 MW) and 983 small HPPs (<30 MW) (SIGEL/ANEEL, 2018). In total, these planned projects would add 52,151 MW to current Brazilian hydropower generation. This expansion is driven by human population growth, economic development, and the growing global energy demand; hydroelectric capacity is projected to grow 73%, globally over the next 20 years to ~1,700 GW (Ansar et al., 2014; Westin et al., 2014; Winemiller et al., 2016). However, even this dramatic expansion in hydroelectric capacity will not be sufficient to meet the planet's current and future energy demands while also reducing climate change impacts, in part due to emissions of carbon dioxide and methane associated with hydropower operations (Barros et al., 2011; Bastviken et al., 2011).
Approximately 40% of all water discharged by rivers worldwide is intercepted by dams, which retain 25% of the sediment flow from the riverbanks to the oceans (Vörösmarty et al., 2003). Consequently, rivers that are impounded by dams suffer physical, chemical, and biological alterations. Negative impacts are caused by changes in the hydraulic-flow system, in the canal geometry, and especially in the exchange of nutrients and energy between terrestrial and aquatic ecosystems. These changes occur before, during, and after the reservoir filling phase. The most significant consequences are the loss of connections between balanced and interdependent habitats, changes in trophic structures, and unpredictable responses from the environmentally-altered habitats (Cunha A. C. et al., 2013; Westin et al., 2014). Water quality is generally impacted the most during the early periods of dam operation (Barros et al., 2011), which are not well-studied (Araújo et al., 2019). In most cases the damage caused to ecosystems by dam operations are thought to be irreversible (Tundisi, 2003; Santos et al., 2018).
Hydroelectric energy is an appealing alternative for Brazil since it provides energy at a relatively low cost compared to fossil fuels. However, the social and environmental impacts of hydropower are not appropriately accounted for in current cost-benefit assessments. For instance, development of hydropower in the Amazon is a sensitive subject considering the region's enormous biodiversity (Nogueira et al., 2009) and indigenous peoples threatened by a swath of environmental damage (van Solinge, 2010). Large dams not only harm biological diversity, but also cause flooding of land, fragmentation of habitats, isolation of species, interruption of nutrient exchange between ecosystems, and blockage of migratory routes. These effects are caused by the reduction water and sediment flows to the habitats downstream, as well as the nature of the rivers and estuaries (Li et al., 2013; Santos et al., 2018; Talukdar and Pal, 2018; Abd-Elhamid et al., 2019). Further, filling reservoirs within short time spans pose additional threats to local and downstream regions, particularly if the filling process coincides with drought (Santos et al., 2018; Ahmed, 2019). These impacts are especially prominent in the hydraulic characteristics, leading to reduced capacity for dispersion of constituents and self-purification of the waters.
This study focuses on the impacts of reservoir filling on water quality in the Araguari River in Amapá (Amazônia, Brazil) related to the recently constructed Ferreira Gomes Hydroelectric Power Plant (HPPFG). HPPFG is downstream of two other hydropower plants, the Coaracy Nunes Hydroelectric Power Plant (HPPCN) and the Cachoeira Caldeirão Hydroelectric Power Plant (HPPCC) (Figure 1). HPPCN began operating in 1976, but to date there are no records of the environmental impacts of its filling and operations. Initiation of water quality monitoring from the initial operating stage of new hydropower plants followed by long-term monitoring in the future is essential for evaluating the overall impacts throughout an operation's life cycle. This study evaluates the filling phase of a new reservoir, as this is a unique and irreproducible stage, providing a scientific “baseline” for the future of HPPFG as well as ecosystem management in the state of Amapá. Likewise, this study provides an assessment of the cumulative synergetic effects of fragmenting the natural flowing river along a series of dams constructed along the river.
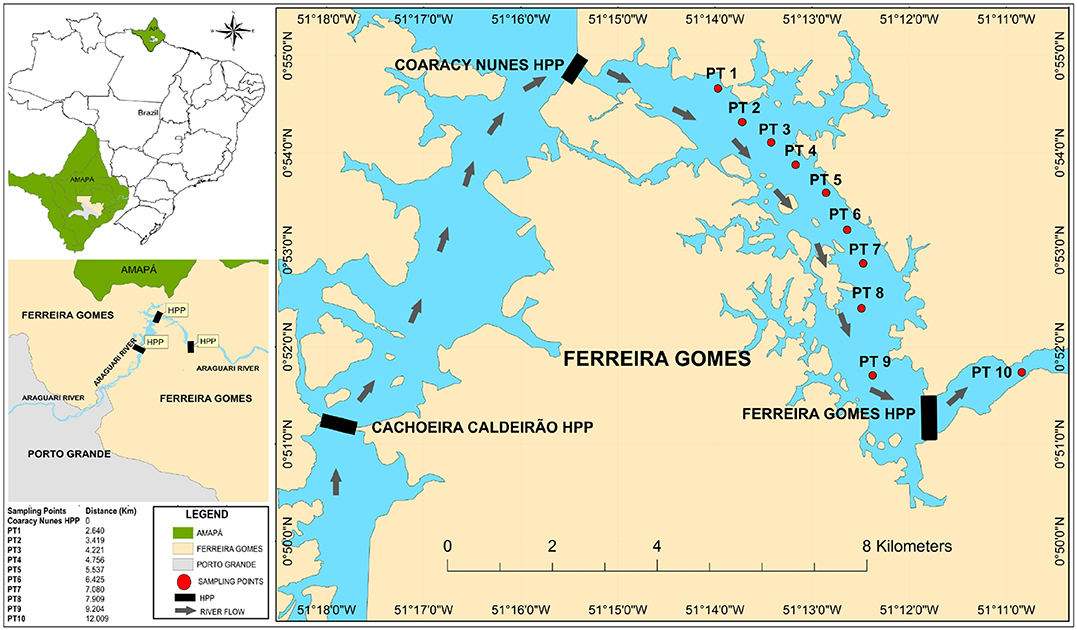
Figure 1. Area of study in the Municipality of Ferreira Gomes showing the Ferreira Gomes Hydroelectric Plant (HPPFG), the dam reservoir, and the water quality sampling sites (PT1-10). The arrows indicate flow direction. The reservoirs of the HPPCN and Cachoeira Caldeirão and Hydroelectric Plants are upstream of the HPPFG reservoir.
We evaluate the impacts of the HPPFG reservoir filling on water quality in the new reservoir, as well as identifying the ecological and environmental effects on the reservoir and its surroundings downstream. We hypothesize that upon initiation of reservoir filling, spatial and temporal variations in the water quality occurred that compromised its legal compliance, which is represented by the National Environment Council (CONAMA) of the Ministry of Environment. In order to test this hypothesis we addressed the following objectives: (1) identify and quantify the main spatial and temporal changes in water quality parameters before, during, and after the filling of the HPPFG reservoir; and (2) analyze the limnological and hydraulic-operational influence of HPPFG on key water quality, physio-chemical, and hydraulic parameters. To our knowledge, there are no studies available in the literature that evaluate both hydraulic and water quality parameters during the filling phase of reservoirs in tropical rivers such as the Amazon. This data gap is of critical importance to the hydropower sector for evaluating compliant management of water resources and biological conservation.
Materials and Methods
Study Area
The Araguari River is the largest river in the Brazilian state of Amapá, with a length of ~617 km and a drainage index of 0.955 m km−1 (Brito, 2008). Its headwaters are located in the northwest to eastern region of the river basin, notably in protected areas (Dias et al., 2016). The Araguari River basin and the HPPFG reservoir is located in the Municipality of Ferreira Gomes and partially in the Municipality of Porto Grande (Figure 1).
HPPFG is considered a large dam in the Amazon (installed capacity ≈252 MW, flooded area ≈17.7 km2, Volume = 137 km3, maximum length ≈10 km, maximum width ≈1.2 km, average depth ≈11.4 m). During the filling period, there were mining operations located in the Upper Araguari River, as well as HPPCN operation and the construction project for the HPPCC (not shown).The rainfall in the state of Amapá follows a distinct local seasonal pattern, consisting of two seasons: the rainy season (≈400 mm month−1) and the less rainy season (≈70 mm month−1) (Cunha et al., 2014; Santos and Cunha, 2018).
Monitoring Period
Water quality sampling was carried out at nine points along the central longitudinal axis of the reservoir (P1 to P9, equidistant ≈800 m apart) and one point downstream of the reservoir (P10). Since the flow dynamics of the new reservoir were unknown, these 10 sampling sites were selected in order to obtain more detailed records of the water quality variation during the short time period of the filling phase. The distances between the sampling points were ~1/8 of the longitudinal length of the reservoir (Lmaximum≈10 km), which enabled greater spatial resolution, intensity, and sampling frequency during the brief filling phase.
Five sampling campaigns were performed with variable collection times: July-August (2014), September (2014), December (2014), March (2015), and August (2015). During the July-August period the sampling procedure was more intense, lasting 10 days with a 2-day interval between each campaign. In this time period the volume of the reservoir (Vol%) grew to ≈95% of the total volume. After this phase, sampling was done on a trimestral basis. All 11 sites were sampled during each campaign.
Hydraulic parameters were obtained from the Institute for Environmental and Territorial Management (IO-FGO, 2014; IMAP, 2015). The hydraulic parameters measured were: distance (Dist) in relation to the upstream dam (HPPCN), inflow rate to the reservoir (QA), outflow rate from the reservoir (QD), spillway flow rate (QV), and water level in the reservoir upstream of the HPPFG dam (NUp) and downstream of the reservoir (NDown). The instantaneous flow rates were defined as those during the exact moment of sample collection due to the daily variations of the reservoir volume. The filling volume levels (Vol%) in relation to the total volume of the full reservoir (≈138 km3) were also recorded.
The hydraulic parameters (Table 1) are the natural flow rate, regulated flow rate ≈948 m3 s−1 (Average from January 1928 to December 2012), nominal regulated flow rate (95%) ≈1,049 m3 s−1, maximum average monthly flow on record (May 2000) ≈3,142 m3 s−1, projected flow rate, with a return time RT = 10,000 years ≈7,431 m3 s−1, minimum average monthly flow rate (January 1970) ≈25 m3 s−1, maximum flow rate on record (April 13, 2011) ≈4,222 m3 s−1, sanitary flow rate ≈52.1 m3 s−1, average flow rate accumulated ≈48.3 m3s−1, annual average precipitation ≈2,399 mm, and average total annual evaporation ≈1,772 mm (local variation). The average ratio between the average annual precipitation and total evaporation is ≈1.35. In other words, ≈35% of the precipitation can evaporate and the rest flows through the Araguari River (IO-FGO, 2014).
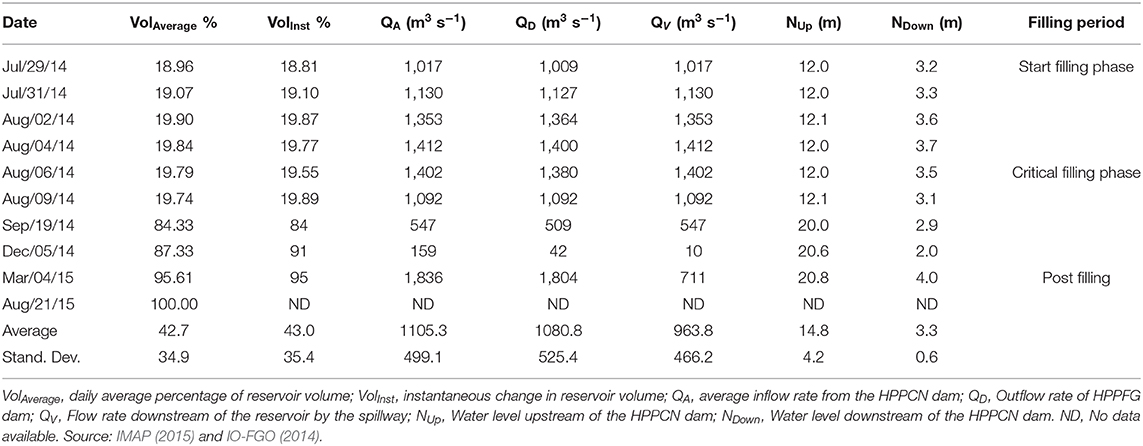
Table 1. Hydraulic parameters of the HPPFG reservoir during the filling periods.
Water Quality
Water quality sampling was performed at a depth of 0.5 m below the surface. For all other parameters, whole water samples were collected in acid-washed 2 L high-density polyethylene bottles and transported to the lab in the dark on ice prior to further analysis (≈24 h). Methods for each parameter are described in Table 2 (APHA-American Public Health Association, 2005).
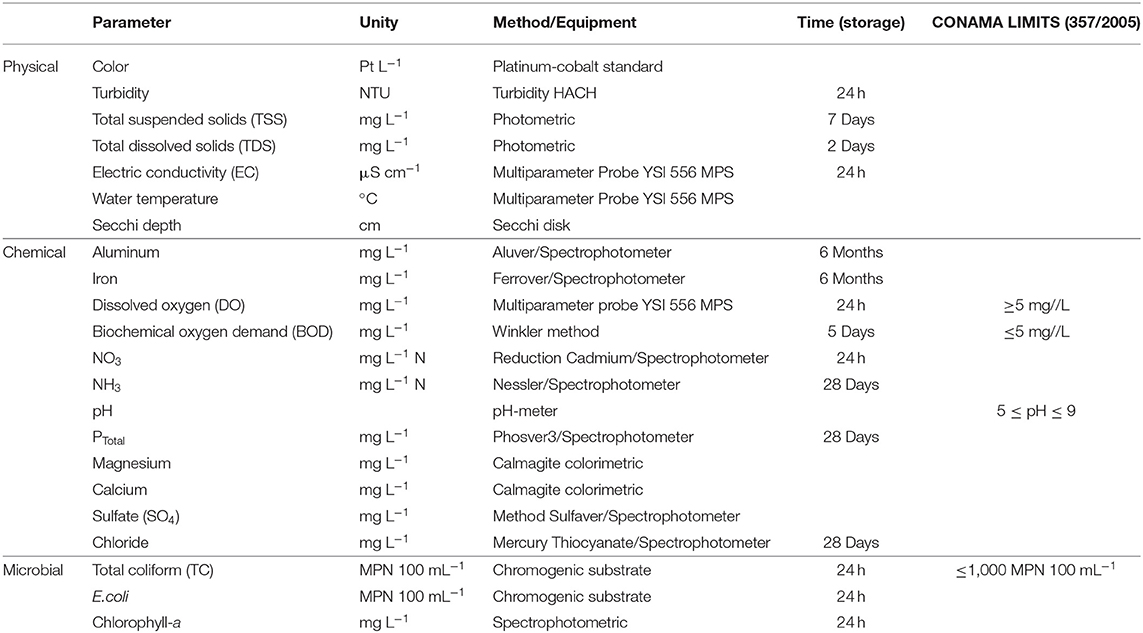
Table 2. Units of measurement of the parameters used, their methods, analysis equipment, and legislation limits (Conselho Nacional do Meio Ambiente, 2005).
The results of the analyses were compared with the maximum or minimum values permitted by CONAMA Resolution 357/2005 (based on class II bodies of water and the criteria and limits for this category).
Microbiological parameters consisted of total fecal coliforms (TC) and Escherichia coli (E. coli) abundance. The Colilert method was used to determine the most probable number (MPN 100 mL−1) of these parameters. After sealing and incubating the samples in combusted 60 mL glass bottles for 24 h at a temperature of 35°C, a selective count was performed (yellow for TC and fluorescent with 365 nm ultraviolet light for E. coli).
The trophic state index (TSI), which is considered a key variable, was determined utilizing both the values of the Chlorophyll-a (Chl-a) concentrations and the Total Phosphorous concentration (Ptotal), in addition to measurements from the Secchi depth (transparency index). The calculation of TSI is an optimization performed by Lamparelli (2004). Measurement of TSI is thus a direct measure of the concentration of Chl-a and Ptotal, instead of using transparency values, which are often not representative of the state of hypertrophy. TSI is thus calculated according to the procedures cited by the National Water Agency (ANA, 2014), based on the concentrations of Chl-a (Equation 1) and Ptotal (Equation 2), and later evaluated according to the classification bands:
where Chl is Chlorophyll-a concentration measured near the water surface in μg L−1 and PT is the concentration of PTotal measured near the water surface in μg L−1.
For Chl-a analysis, 300 mL of water was collected and stored in a dark cooler with ice. In the laboratory, this water was filtered through a 0.45 μm pore size, glass-fiber filter (Whatman). The filters were inserted in glass test tubes containing 10 mL of 90% acetone to extract the pigment, and then wrapped in aluminum foil and refrigerated for a period of 24 h. The extracted material was centrifuged for 10 min at a velocity of 4,500 RPM so that the supernatant could be removed and sent for spectrophotometric analysis at the wavelengths of 630, 645, 665, and 750 nm, according to Parsons and Strickland (1963).
Statistical Analysis
Data was submitted to multivariate statistical analysis using the “R-project” statistical software (R Development Core Team, 2016). The statistical treatment consisted of descriptive analysis of the variables, evaluation of their standard of distribution (normality, Shapiro-Wilk test), Friedman non-parametric hypothesis tests, multiple correlation analyses (Spearman non-parametric), simple linear regressions and multiple linear regressions, and finally a clusters analysis to test similarities between different Sampling Unit values or spatial variation.
The objectives of the aforementioned statistical tests were: (i) to test the spatial and temporal influence of physical, chemical, and hydraulic variables (independent) on the variation of the key variables (Chl-a, TC, E. coli, and TSI) (dependent), before, during, and after the filling phase using the non-parametric Friedman test (α ≤ 0.05, n = 10, totaling 29 water quality and hydraulic variables); and (ii) to perform a global analysis (spatiotemporal similarity cluster) of how the key variables were influenced by the variation in reservoir volume.
Results and Discussions
Hydraulic Behavior and Filling of the HPPFG Reservoir
HPPFG reservoir Vol% was determined instantaneously during the time of sampling and also on a daily average for the period from July 20, 2014 to June 15, 2015 (Figure 2). The reservoir began being filled on July 20, 2014 and reached the critical filling phase (highest rate of elevation over time) on August 28, 2015. The end of the filling phase was considered to be June 15, 2015, when the volume oscillated between 86.7 ≤ Vol% ≤ 100 (operational control).
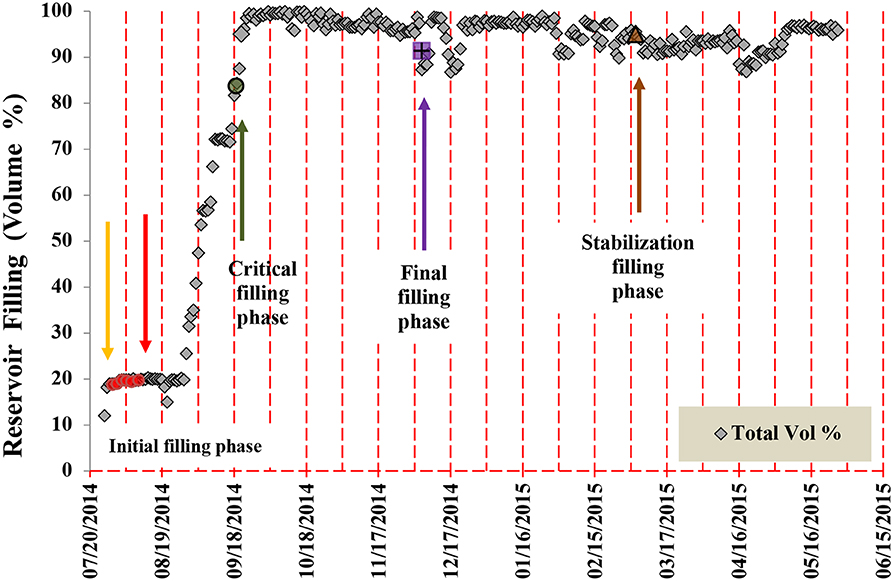
Figure 2. Daily average (light gray diamond) and instantaneous (red circle, green circle, cyan square, brown triangle) measurements of volumetric variation (Vol%) of the HPPFG reservoir filling as a function of time. The five water quality sampling campaigns are also indicated by the colored arrows (yellow, red, green, cyan, and brown). Total reservoir volume (i.e., 100%) is 137.7 km3 (≈ 137.7 x 10⁹ m3).
The normal operational level is roughly 21.3 m, which corresponds to a max volume of 138 km3 (IO-FGO, 2014). The initial sampling phase occurred few days after the initiation of filling with a Vol% of 11.0%. The phase considered critical began precisely on Aug 28, 2014, during a strong temporal evolution (a nearly vertical rise on the graph) that lasted just 24 days, stabilizing on Sept 23, 2014. On that date the Vol% reached ≈98%. On Sept 19, 2014 the volume was 83.7%, having begun at only 20.0% on Aug 28, 2014. The final phase began on Sept 24, 2014 with a Vol% of 99.5% (the rest of the curve oscillates near 90–100%; Figure 2).
The hydraulic characteristics of the post-filling phase (operational) define the reservoir as functioning “at a trickle,” with low variation in the reservoir volume. There are only small hourly volume oscillations throughout the day (IO-FGO, 2014). After this last phase, the system is also subject to operational regulations, both in the flood control period and the non-flood control period (IO-FGO, 2014). However, the operational control of the HPPFG depends also on the hydraulic control of both HPPCN and HPPCC, both upstream (Figure 1) (Cunha A. C. et al., 2013).
Spatial and Temporal Variation of the Water Quality
Physical Parameters
The water temperature showed significant seasonal variation (p < 0.05), varying between 25 and 32.5°C, which was similar to other reaches of the Araguari River basin (Brito, 2008; Bárbara et al., 2010; Santos, 2012). Water temperature oscillated in accordance with the local climate and hydrology, but is also sensitive to the high levels of turbulence caused by the HPPCN (upstream of P1) and HPPFG (downstream of P1-P9) dams. This variability may interfere with reaction kinetics, adaptation of aquatic life, and absorption of dissolved oxygen (DO) (Bárbara et al., 2010). Regarding the reduction of DO solubility, temperature elevation affects other biochemical reactions (C, P, N, O, S cycles), indirectly causing high mortality rates for aquatic life, especially fish. Thus, one of the most notable downstream physical effects of dams on aquatic systems is the alteration of the natural temperature and flow regime (Robinson et al., 2004). In this study, the temperature presented no significant spatial variation (p > 0.05) but was correlated with several parameters and filling variation (p < 0.05) (Tables 3–5).
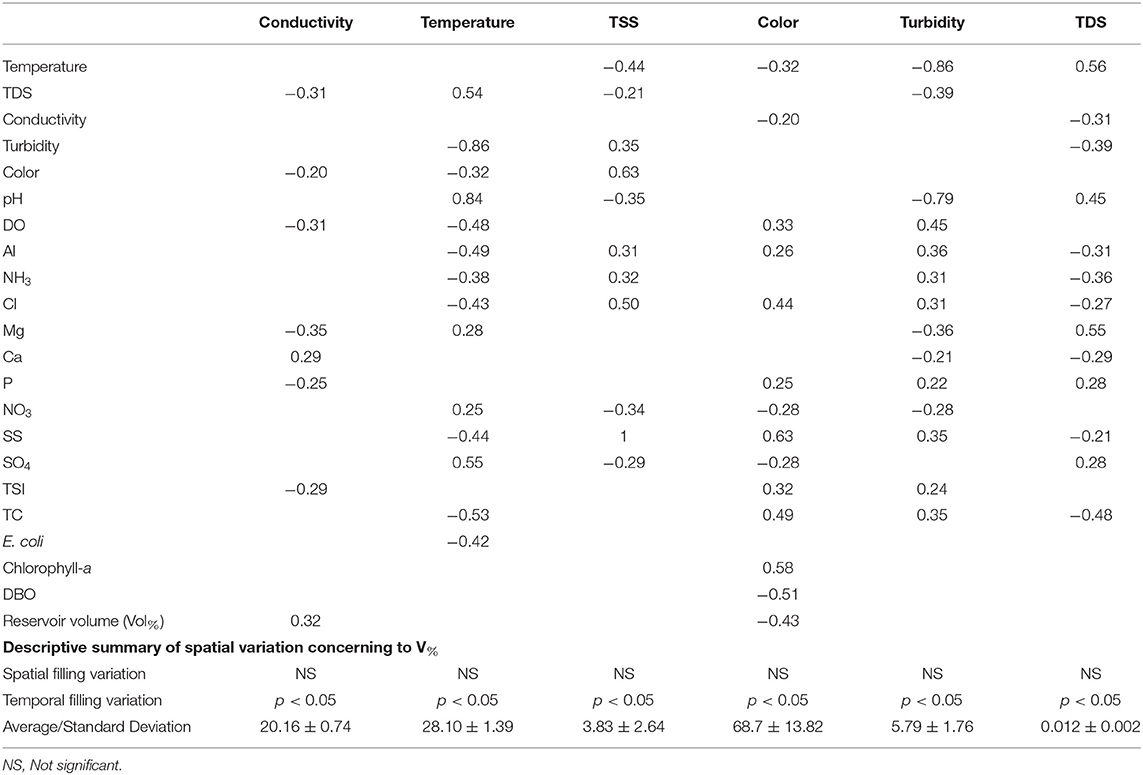
Table 3. Spearman correlations and descriptive statistics of physical and Vol% parameters.
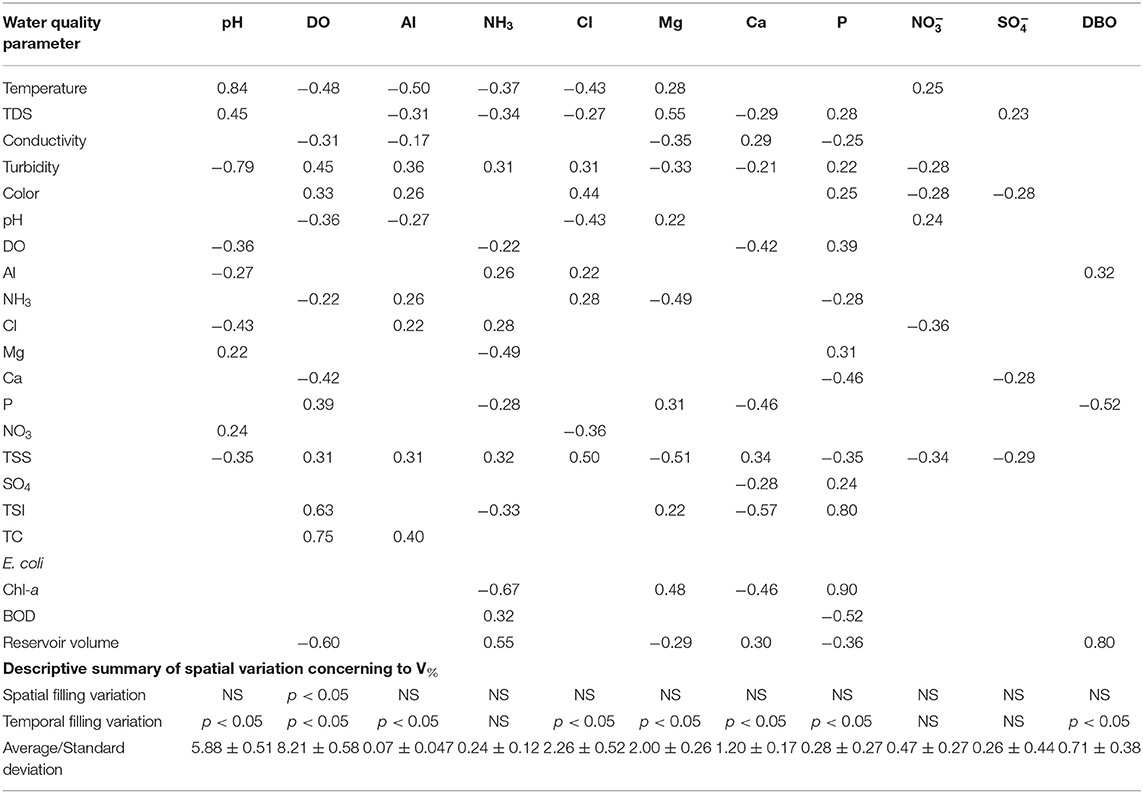
Table 4. Spearman correlations and descriptive statistics of the physiochemical and filling variables.
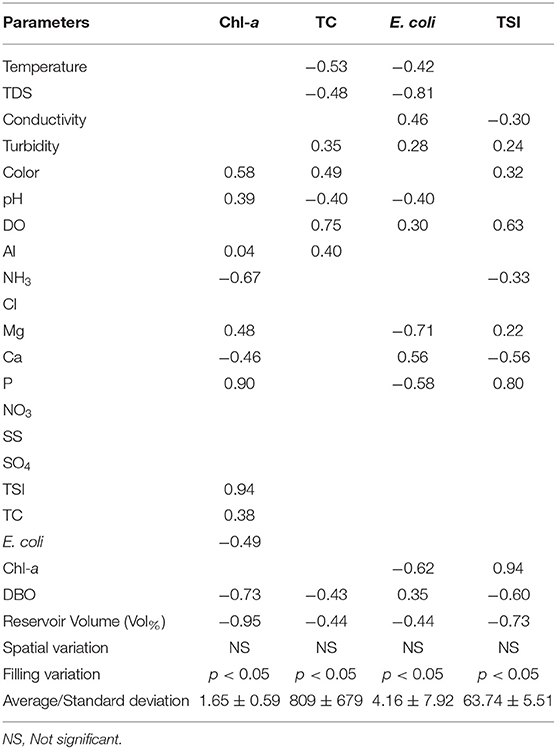
Table 5. Spatiotemporal analysis and correlation of microbiological parameters.
River color had an average value of 65 Pt L−1, which is within the limit of 75 Pt L−1 defined by Conselho Nacional do Meio Ambiente (2005) (Table 2). However, river color ranged beyond this limit, varying between 44 Pt L−1 and 104 Pt L−1 with the highest values observed during the rainy transition period and during the most intense filling phase (July and August of 2014). The elevated color may be associated with natural influences as well as the process of leaching organic material from the forest (Boyd, 2000; Ward et al., 2016). Sampling point P7 had the greatest degree of variation observed, oscillating between 20 and 104 Pt L−1. During the filling period, this parameter tended to vary significantly temporally (p < 0.05), but not spatially (p > 0.05). Color was correlated with several parameters (Tables 3–5).
Water turbidity did not vary significantly with filling time (p > 0.05). However, this parameter ranged from 2.06 to 10.50 NTU and was correlated with several parameters (Tables 3–5). But, this is much lower than the maximum value of 100 NTU prescribed by the Conselho Nacional do Meio Ambiente (2005). After the filling of the reservoir, a decrease in turbidity was observed over time with an average of 2.90 NTU. Previous studies indicate values that range from 30 NTU (HPPCN or P1) up to 3,948 NTU at the mouth of the Araguari River, an area that is influenced by the Amazon River (Brito, 2008; Cunha A. C. et al., 2013; Cunha and Sternberg, 2018; Santos et al., 2018).
The average total suspended solids (TSS) concentration was 4 mg L−1 throughout the study period (Table 3). There was no significant spatial variation in TSS (p > 0.05), but significant filling variation (p < 0.05) and correlation with other parameters (Tables 3–5). The filling variation likely influenced this parameter. For a short period of time (August 2014) TSS values reached 12 mg L−1. This occurred during the beginning of the filling of the reservoir. TSS varied directly with the turbidity and transparency of water (Table 3). The larger the TSS value, the greater the turbidity and the less the transparency. One important observation about the low level of spatial variation in this parameter is that the upstream dam (HPPCN) tends to retain the larger particles and let only the smaller particles through the spillway and turbines. This is probably one of the most important impacts made by dams on downstream ecosystems throughout the world (Boyd, 2000; Vörösmarty et al., 2003; Wildi, 2010; Cope et al., 2011; Górski et al., 2012). TSS showed no correlation with microbiological parameters (Table 5).
However, there were no significant variations in total dissolved solids (TDS) over space but only with the filling time. The recorded values were between 0.008 and 0.017 mg L−1. These are below values observed in other studies performed in this region by Bárbara et al. (2010), which observed levels of up to 9.40 mg L−1. TDS was correlated with most physicochemical and microbiological parameters (Tables 3–5).
Electrical conductivity showed significant variation with filling time (p < 0.05), but no spatial variation (p > 0.05), ranging between 19 and 21 μS cm−1. As expected, this parameter was correlated with some parameters (Tables 3–5). By comparison, the studies by Bárbara et al. (2010) showed lower conductivity values than those found in this study. The increase in the ion concentration probably resulted from the transport of soil salts that were leached during the filling of the reservoir. The Conselho Nacional do Meio Ambiente (2005) does not establish standards for electric conductivity, although values above 1,000 μS cm−1 are considered undesirable for surface waters.
Chemical Parameters
Dissolved oxygen was the only chemical parameter that showed significant spatial and temporal variation (p < 0.05). DO concentrations ranged from 7.2 to 9.7 mg L−1 (Table 4), which is well above the minimum allowable value of 5.0 mg L−1 prescribed by Conselho Nacional do Meio Ambiente (2005). The spatial variability can mostly be explained by the influence of the two dams upstream (Cunha et al., 2011; IO-FGO, 2014) (Figure 3). The values measured downstream of the dam (P10) were very close to atmospheric saturation, and this behavior was similar throughout the period and along the other sampling points. The distance between the sampling points can explain only 7.2% of the variation in DO (not shown), but this variation was significant (p < 0.05). It must be stressed that this behavior was non-linear and DO levels became highly saturated (8.4 mg L−1) near P1 (Figure 3), with concentrations decreasing downstream and along the longitudinal canal of the reservoir, until halfway (7 km downstream of HPPCN), with DO = 8.05 mg L−1 between P6 and P7. DO was most elevated at P10, reaching a maximum value of 9.4 mg L−1 in front of the city of Ferreira Gomes. These high DO levels are high for fish and can cause embolism (Carlson, 2014).
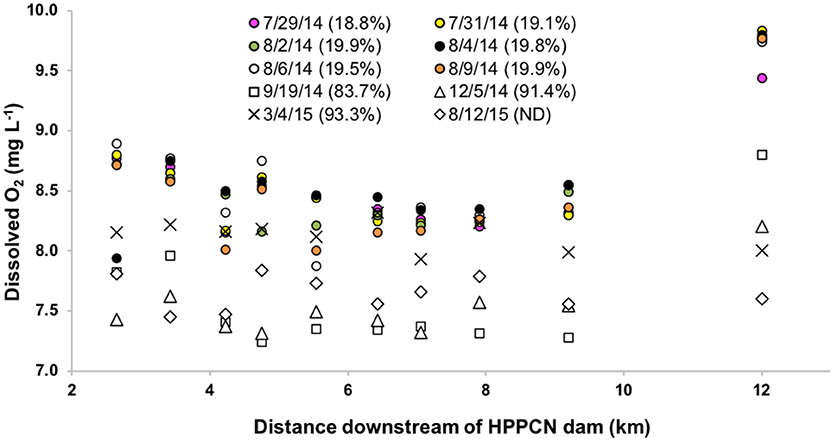
Figure 3. Dissolved O2 (DO) concentrations across the sampling transect during the initial filling phase (circles), critical filling stage (squares), final filling stage (triangles), stabilization filling phase (crosses), and stabilized phase (diamond). The reservoir volume percentage (Vol%) for each sampling date is indicated in parentheses.
Biochemical oxygen demand (BOD) varied significantly with filling time (p < 0.05), but not spatially (p > 0.05) (Tables 3–5). BOD values ranged from 0.12 to 1.34 mg L−1 throughout the study period, which is well below the Conselho Nacional do Meio Ambiente (2005) maximum threshold of 5.0 mg L−1. These values suggest that, despite the load of organic material from the reservoir filling, in this stretch, there is a high capacity for self-purification (dilution of pollutants, high rate of degradation of organic material, turbulence, and reaeration) (Cunha A. C. et al., 2013). There are also thermodynamic influences, such as temperature variation due to the seasonality characteristics. In short, while a rise in temperature tends to reduce DO, the increase in turbulence reverses this trend due to the intensification of atmospheric reaeration (Cunha et al., 2011), which likely induces a more rapid consumption of BOD. In addition, dilution processes are favored by periods of high flow (July and August), reducing the diffused organic loads from the filling process. Apparently, there was also a low impact of the BOD in the consumption of DO within the reservoir and downstream, since the mass balance DO showed no significant interference (p > 0.05). However, it is important to note that before filling the reservoir, much of the plant biomass was withdrawn. This procedure most likely reduced potential BOD. Consequently, the BOD levels observed during the filling were also below what would be expected without the removal of part of the vegetation from the new flooded area (Brito, 2008; Weissenberger et al., 2010).
Chloride showed significant seasonal variation (p < 0.05), but no significant spatial variation (Tables 3, 4). Cl concentrations ranged from 1.2 to 3.9 mg L−1, which is well below Conselho Nacional do Meio Ambiente (2005) maximum limit for chloride of 250 mg L−1. Chloride was correlated with several other physio-chemical parameters (Tables 3, 4), but not with microbiological parameters (Table 5).
Magnesium concentrations ranged from 1.54 to 2.80 mg L−1 (Table 4). Magnesium can be active in formation of the Chl-a molecule. Magnesium, along with calcium, also determines the hardness of water, which is an indicator of its drinkability (Gupta, 2010). Inputs of metals to the aquatic environment is often related to human activity, mainly in urban and industrial centers (Weissenberger et al., 2010).
Calcium concentrations showed no variation in space but indicated significant filling variation. Ca concentrations ranged from 0.84 to 1.82 mg L−1. The sum of the Ca and Mg cations always remained below the hardness limit of 500 mg L−1 for drinkable water indicating compliance with Conselho Nacional do Meio Ambiente (2005). No correlation was observed between Ca and Mg, but these parameters indicated correlation with others parameters (Tables 3, 4).
NH3 concentrations also remained below the maximum limit of 3.7 mg L−1 established by Conselho Nacional do Meio Ambiente (2005), ranging from 0.07 to 0.64 mg L−1. NH3 levels varied significantly across the study domain (p < 0.05), decreasing as temperatures increased. However, elevation of the temperature tends to liberate the more toxic compound in the aquatic environment. In this case, even during the filling phase, NH3 levels parameter were in compliance in the reservoir as well as downstream of the HPPFG dam (P10). The highest concentrations occurred in the final period of the reservoir filling (March 2015). The concentrations tended to be lower at the point downstream from the dam. For comparison, NH3 levels below 3.7 mg L−1 were also found in the studies performed by Bárbara et al. (2010).
concentrations remained below the maximum limit of 10.0 mg L−1 established by Conselho Nacional do Meio Ambiente (2005). The highest concentration observed was 1.5 mg L−1, and the lowest was 0.01 mg L−1. results from the process of nitrification in the presence of oxygen. At high concentrations, in drinking water can cause serious and even lethal effects in children (Madoux-Humery et al., 2013). These problems can become critical near farming regions through both single and diffuse sources. levels correlated with others parameters and the variation was negative and temporally significant (p < 0.05), but not spatially significant (p > 0.05) (Table 4), except with biological parameters (Table 5). According to Pedrozo and Kapusta (2010), the quantities of phosphorous and nitrogen available in the assimilable form of phosphates and nitrates are small in the surface of the photosynthetic zone. Both tend to accumulate in deep water, where they are formed by bacterial decomposition of organic material (animal and vegetal) (Weissenberger et al., 2010).
The concentration of PTotal decreased as a function of distance in relation to the entrance at point P1. However, this trend was not significant (p > 0.05). Ptotal had a negative and significant correlation with Vol% (p < 0.05) (Figure 4, Tables 3–5). The average concentration of Ptotal was 0.28 mg L−1 throughout the study period, which is more than double the limit of 0.10 mg L−1 required by Conselho Nacional do Meio Ambiente (2005). This varied significantly by season, with the highest values observed at the beginning of the filling (0.62 mg L−1). After the filling of the reservoir, this value fell to an average of 0.22 mg L−1, still above the maximum limit. Ptotal values reached a maximum of 5.0 mg L−1 during the filling period, which suggests high potential for eutrophication (Lamparelli, 2004; Abreu and Cunha, 2016). As a nutrient, phosphorous is one of the parameters that can indicate the level of eutrophication (TSI) and pollution of the water.
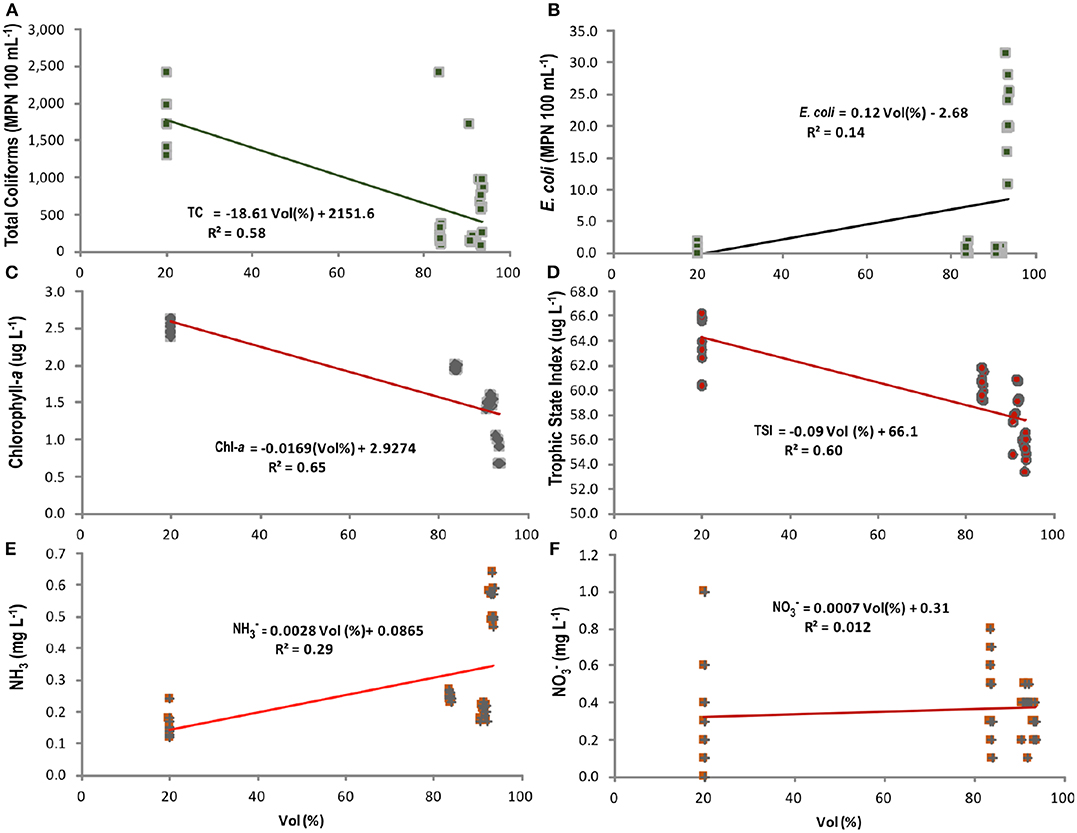
Figure 4. Variation of (A) Total Coliforms, (B) E. coli, (C) Chlorophyll-a, (D) Trophic State Index, (E) NH3, and (F) NO3 in relation to the percentage of volume filled (Vol%).
pH did not vary significantly with space (p > 0.05) but significantly with filling variation time (p < 0.05) (Tables 3–5). However, at least 30% of the samples had pH levels that were more acidic (pH = 5.8) than the Conselho Nacional do Meio Ambiente (2005) limits of 6.0 < pH <9.0. There is a tendency for natural waters to stay within a relatively narrow range of hydrogen ion activity due to the presence of buffers that resist pH changes (Padeddaa et al., 2015). For instance, heterogeneous reactions with the atmosphere and the food chain occur on time scales of hours to days, absorbing or removing CO2 from the water. In turn, the CO2 takes part in the rapid reactions between inorganic carbon types and is dependent on various hydraulic parameters, such as the flow rate and the seasonal hydrological cycle. CO2 is strongly related to respiration/photosynthesis in aquatic ecosystems (Ward et al., 2018).
Microbiological Parameters and Trophic State Index
Forty-five percent of the total coliform (TC) concentrations measured in the filling period fall outside the standards of the resolution Conselho Nacional do Meio Ambiente (2005). They varied from 105 to >2,420 NMP 100 mL−1, compared to the maximum regulated concentration of 1,000 NMP 100 mL−1. TC was negatively correlated with Vol% (Table 5) and its level fell to within legal standards during the reservoir filling period at sampling points P1 to P9. Only the point downstream from the reservoir (P10) remained above the (Conselho Nacional do Meio Ambiente, 2005) standards for a longer period than the critical filling period July/August,2014. This could be due to the location of the sampling point in front of the city of Ferreira Gomes. It is likely influenced by infiltration from single and diffuse sources of untreated sewage (Wildi et al., 2003, 2004; Talukdar and Pal, 2018; Ahmed, 2019). However, the concentration of TC trended downwards soon after the critical filling period (Figure 4A). There were significant seasonal variations (p < 0.05), but no significant spatial variations (p > 0.05).
Both CONAMA and the Ministry of Health limit the maximum value of E. coli to 0 NMP 100 mL−1 for drinkable water. In this research, 38% of the results showed values above the recommended limits during the reservoir filling, with an average of 1.3 NMP 100 mL−1. Although these values are considered low, the presence of E. coli may be dangerous to human health when ingested or used in food preparation. There were significant seasonal variations (p < 0.05), but no significant spatial variation (p > 0.05) in E. coli levels.
Other studies have shown a marked seasonal variation in the levels of fecal coliforms in the Araguari River, ranging from 10 to 2,200 NMP 100 mL−1 (Santos and Cunha, 2013; Santos et al., 2018). In this study TC levels of 400 to 1,200 NMP 100 mL−1 were observed with the highest values generally occurring during the dry season. When wastewater mixes with river water, it causes severe degradation of ecological functions in the receiving surface waters (Madoux-Humery et al., 2013), resulting in increased mineral, organic, and microbiological pollutants, which impact public health (Carlson, 1997; Consiliu Meio Ambiente & Projetos e Systema Natura e Consultoria Ambiental Ltda, 2008; Affonso et al., 2011; Cope et al., 2011). An additional factor is the hydraulic pressure of the reservoir on the subterranean (phreatic) waters near Ferreira Gomes city, which potentially increases inputs of untreated sewage into the aquatic environment. This is especially reflected in point P10 downstream of the dam.
It is important to consider in this context the “sanitary flow rate” cited in the report from IO-FGO (2014). This is defined as the minimum outflow recommended for maintaining the minimal conditions necessary in the downstream riverbed, QSanitary≈52.1 m3/s, aiming to meet the legal requirements of environmental agencies (Santos and Cunha, 2018). In November 2015, this low level was recorded. Very low flow rates represent a larger sanitary risk in areas of greater social vulnerability (Santos et al., 2017). This is the case for the city of Ferreira Gomes, since the urban pollutants tend to be concentrated during the dry periods (Cunha E. D. S. et al., 2013). However, during the November 2016 sampling a very low QSanitary of 35.0 m3 s−1 was recorded, which is 32% less than the minimum of the minimum flow (Santos and Cunha, 2013). On the other hand, pollution from diffuse sources tends to be greater during the rainier periods (dilution with high load intake). Despite the opposite effects, both trends can explain what happens in the reservoir and downstream in other periods of the year (Cunha E. D. S. et al., 2013; Santos and Cunha, 2013). But neither TC nor E. coli showed significant spatial variation (p > 0.05).
In the HPPCN reservoir upstream from HPPFG, more favorable environmental conditions have been observed for the development of greater diversity of phytoplankton species than in less altered environments upstream from this dam (Cunha E. D. S. et al., 2013). For instance, the Upper and Middle sections of the Araguari River show compliance with the majority of the physical, chemical, and microbiological water parameters (Conselho Nacional do Meio Ambiente, 2005). The waters are characterized as predominantly oligotrophic (Cunha A. C. et al., 2013; Abreu and Cunha, 2016), except during the filling period, when the levels frequently fell outside the legal limits (Figure 4).
Peaks in the trophic state index (TSI) occurred with the greatest intensity in August 2014 indicating hypertrophic conditions (80.2 μg L−1) in August 2014. The lowest values were registered in March 2015 ~8 months after the critical filling phase indicating mesotrophic conditions (55.0 μg L−1). In contrast, in the first field report from HPPFG (Azurit Ltda Visao Ambiental, 2015), the trophic state was recorded as oligotrophic. That is the same classification level suggested by Cunha A. C. et al. (2013) in HPPCN before the current filling. That analysis may also be correct, but it differs from the findings of this research, which indicated a permanently mesotrophic state up to the moment of the final sampling campaign in August 2015.
These results indicate that the level of eutrophication in the reservoir during the filling period showed variation in the concentrations of phosphorous (liberation of organic material and nutrient loads), causing changes in the water quality in the new environment of the reservoir. Throughout the filling process in this case, TSI showed a tendency to reduce algae flowering potential in the reservoir (especially during dry periods with lower renewal rates), in contrast to the suggestions of other authors in the literature (Müller and Mossel, 1982; Hofstra and Huisin't Veld, 1988; Vörösmarty et al., 2003; Labadie, 2004; Robinson et al., 2004; Sanches et al., 2006; Kentzer et al., 2010; Wildi, 2010; Cope et al., 2011; Górski et al., 2012; Cunha A. C. et al., 2013; Westin et al., 2014; Poff et al., 2015; Zarfl et al., 2015). However, this tendency in the HPPFG reservoir may be explained by its hydraulic behavior, which is more similar to a canal with a longitudinal profile than a lake (Cunha E. D. S. et al., 2013).
It was also observed that the elevation in the concentration of phosphorous and NH3 in the beginning of the critical filling phase (July-August, 2014) shows a seasonally variable character. This can increase the potential for causing fish death (Santos et al., 2017), which adversely affects the multiple uses of the water.
Total Coliform, E. coli, Trophic State Index, and Nutrient Variations vs. Vol%
Algal biomass (Chl-a) varied negatively with Vol% (R2 = −0.64, p < 0.05) (Figure 4A) followed by a reduction in TC (R2 = −0.37, p < 0.05) (Figure 4B), and an increase in E. coli (R2 = 0.23, p < 0.05) (Figure 4C). TSI declined with Vol% (R2 = −0.65, p < 0.05) (Figure 4D). In addition, NH3 declined with Vol% (R2 = −0.30, p < 0.05) (Figure 4E) and showed no significant variation as a function of Vol% (R2 ≈ −0.04, p > 0.05) (Figure 4F).
The linear regressions show that the filling phase (Vol%) is related to the average variation in the concentration of microbes and nutrients (P and N) (−0.65 < R2 < 0.37, p < 0.05), with the exception of . Regarding , it is possible that because the biogeochemical processes are controlled by the hydraulic dynamics of the reservoir (very fast), the nitrogen cycle has not been completed in the transformation reaction of NH3 to (Weissenberger et al., 2010).
Regarding the specific cases of TC and TSI, the worst indicators occurred when Vol% ranged from 10 to 20%. In the case of E. coli, a higher concentration was observed only in the final phase of the filling (Vol%≈92% or greater). On the other hand, the concentration of Chl-a decreased from 2.5 μg L−1 at the beginning of the filling to around 0 μg L−1 when the reservoir was full (Vol%≈100%). That is, depending on the parameter analyzed, the hydraulic (dam operation) and hydrological (natural hydrology) processes present two fundamental roles in the behavior of water quality (Cunha E. D. S. et al., 2013).
Integrated Analyses
Variation in Vol% during the filling phase significantly influenced water Color (R2 = 0.18, p < 0.01), but not turbidity (p > 0.05). However, the variation of Color can be explained by the variation of Chl-a (R2 = 0.29, p < 0.01), which showed the same downward trend as a function of the Vol%. Turbidity also explains the variation of Chl-a (R2 = 0.12, p < 0.05), but with less influence than Color. These variations in Chl-a can likely be explained by the hydraulic dynamics operating “at a trickle” (Cunha E. D. S. et al., 2013).
Some effects appear to have been quickly “absorbed” by the high self-purification capability of the Araguari River. Bárbara et al. (2010) previously observed this physical characteristic in these sections of the Araguari River, which was also confirmed by IO-FGO (2014). This perhaps explains why DO was the only physio-chemical parameter that showed spatial variation along the ≈10.0 km length of the reservoir [7.5 ≤ DO ≤ 10.0 mg L−1 and 0.1 ≤ BOD ≤ 1.5 mg L−1]. BOD and DO levels are probably not the main causes of fish morbidity (anoxia post-filling phase) (Santos et al., 2017), which is more likely caused by other physiological factors such as embolism or “barotrauma” during the passage of fish through the spillways or turbines (Carlson, 2014). However, the potential increase in the environmental toxicity in the reservoir, such as sediment contamination by micro-pollutants and resuspension due to turbulence, can cause anoxic conditions and high sulfur concentrations. The increase in the concentration of contaminants caused by sedimentation of thick fractions throughout the reservoir may increase its toxicity due to the action of benthic organisms (Wildi, 2010). However, this study analyzed the SO4 concentration (not shown), which showed very low levels with neither spatial nor seasonal variation (p > 0.05).
It is also common for cumulative impacts on the water quality to occur, beyond the simple natural flooding and restoration of species (algae, for example). When there is a greater number of dams on the same river (hydraulic fragmentation) (Rytwinski et al., 2017), the loss of habitats becomes a physical barrier. It drastically changes the flow system and the supply of thick and fine sediments, decreasing the liberation of nutrients since P and N attach to these particles in a different way in addition to impeding fish migrations (Wildi, 2010; Górski et al., 2012; International Rivers, 2014; Richmond et al., 2014; Rytwinski et al., 2017). For example, flow fragmentation can inhibit gene flow of vegetal species by the water (Cunha et al., 2017). Some kinds of seeds are very dependent on hydrochory syndrome, such as the macrolobium bifolium, a riparian species very common in the Falsino and Araguari rivers and some types of seeds can be significantly blocked by dams.
A combination of various hydraulic operational factors, legal conventions (consensus about the appropriate environmental flow rate), extremely dry weather in 2015 (impact of a strong El Niño on the estuarine Amazon Delta) (Cunha and Sternberg, 2018), in addition to various economic interests, such as energy production (upstream and downstream quotas, integrated water management), environmental interests, and sustainable maintenance of fish populations (Santos et al., 2017), may have contributed to the extreme reduction in the outflow Qd (< sanitary flow). This hydrological behavior is exactly the opposite of what happened in April 2011, when the highest flow rate in the history of the Araguari River was measured (4,222 m3 s−1) (Cunha et al., 2014; Santos et al., 2018). Besides that, the reservoirs can also significantly improve the majority of their water quality variables by reducing the concentration of suspended material, on average by more than 50%, 40% of BOD5, and 50–60% of Chl-a (Kentzer et al., 2010). This dilution process appears to have occurred in this study, with the reduction of BOD, Chl-a, TSI, P, TC, and NH3 (Figure 4).
Multivariate Analysis of Water Quality and Hydraulic-Operational Parameters
Chlorophyll-a was significantly influenced by six water quality variables (Color, pH, Mg, SST, E. coli, and TSI) and two hydraulic-operational variables (Qd and Vol%; Table 6). Color, Mg, Qd, and Vol% parameters show signs contrary to the increase in concentration of Chl-a in contrast to pH, TSS, and E. coli. For example, a reduction in pH reflects an elevation in the production of Chl-a, but may be dependent on the BOD5 loads during the filling of the reservoir (Vol%). However, in the case of BOD5, it was not significant. Thus, only eight independent variables explain ≈99% of the variation in Chl-a ( = 0.99, p < 0.01) (Table 6).
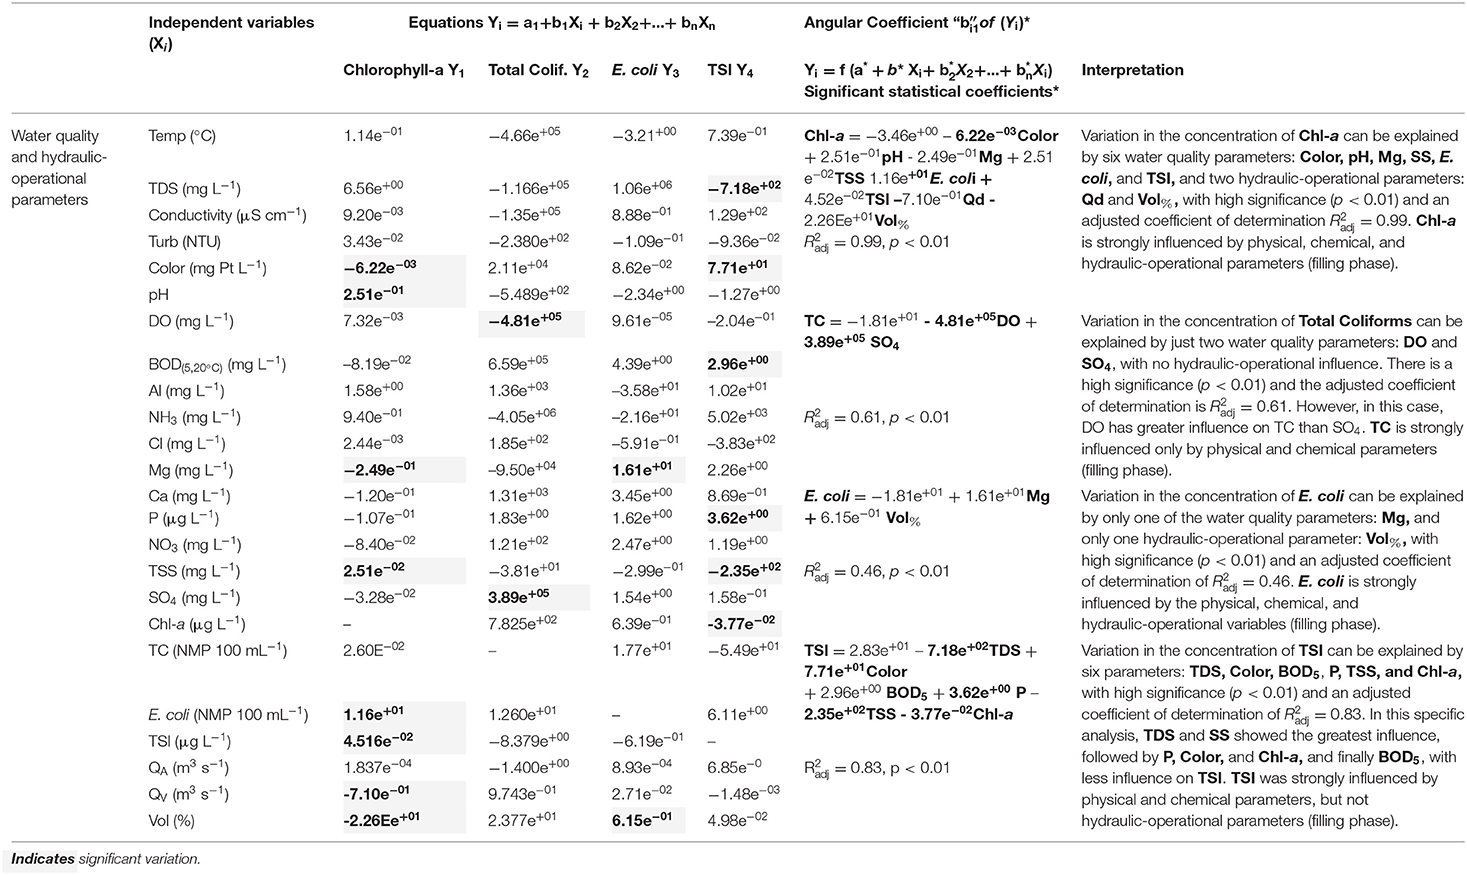
Table 6. MRA Results with 24 water quality and hydraulic-operational parameters.
In the case of TC, two water quality parameters show significant influence: DO (negatively) and SO4 (positively), but without explicit significant influence from the hydraulic variables (Table 6). The increase in TC is apparently inversely related to the hydrodynamic processes, which are reflected by the DO variable. That is, more lentic environments tend to favor an increase in TC, and lotic environments tend to favor a decrease in TC. However, other studies in the Araguari River basin showed the opposite effect, but under normal conditions of river outflow (Brito, 2008; Bárbara et al., 2010). Therefore, this result may have been a “specific anomaly” resulting from the filling of the HPPFG reservoir. Regarding the , it is probable that its presence during the filling of the reservoir is due to contact with flooded soils, where sulfur has been liberated by bacteria (Consiliu Meio Ambiente & Projetos e Systema Natura e Consultoria Ambiental Ltda, 2008). In the case of , it is common to observe correlations between the properties of the soil and the composition of bacteria. This indicates that the change in the physical and chemical composition of the water, which has had recent contact with flooded soils, also shows a greater concentration of bacteria, including TC (Table 6).
E. coli as a dependent variable was significantly influenced by water quality variables (Mg) and by the variation in the HPPFG reservoir volume (Table 6). However, there was no influence from inflow, QA (HPPCN). Previous analyses observed that the concentration of E. coli and Chl-a were the key variables whose concentration increased with Vol%. The importance of this becomes clear because it presents a series of potential sanitary consequences for the city of Ferreira Gomes, elevating the risk of water-borne diseases.
Cluster Analysis shows the degree of spatial and temporal dissimilarity between the sampling points (P1 to P10) when considering all parameters, differentiated from the perspective of the water quality dynamics or the hydraulic-operational dynamics. There are similarities between monitoring sections but they are dependent on the local variations of water quality parameters and hydraulic-operational parameters of the reservoir. There is a greater similarity between the first two dendrograms (Figures 4A,B). Both represent an order organized by distance among the sampling points, following the same sequence with three distinct groups, G1 (P1 to P5) and G2 (P6 to P9), both within the reservoir, and G3 (P10) downstream. P10 is distinct from the other monitoring points in all of the analyses (Figure 5). In effect, there is a greater similarity between the groups G1 and G2 than between G1 and G3 or G2 and G3. Hydraulic properties exert the most influence on key parameters (Chl-a, TC, E. coli, and TSI). Without the hydraulic effects, the ordering of the key parameters becomes more random or more disorganized (Figure 5C), but point P10 (G3) is still differentiated in relation to the other points.
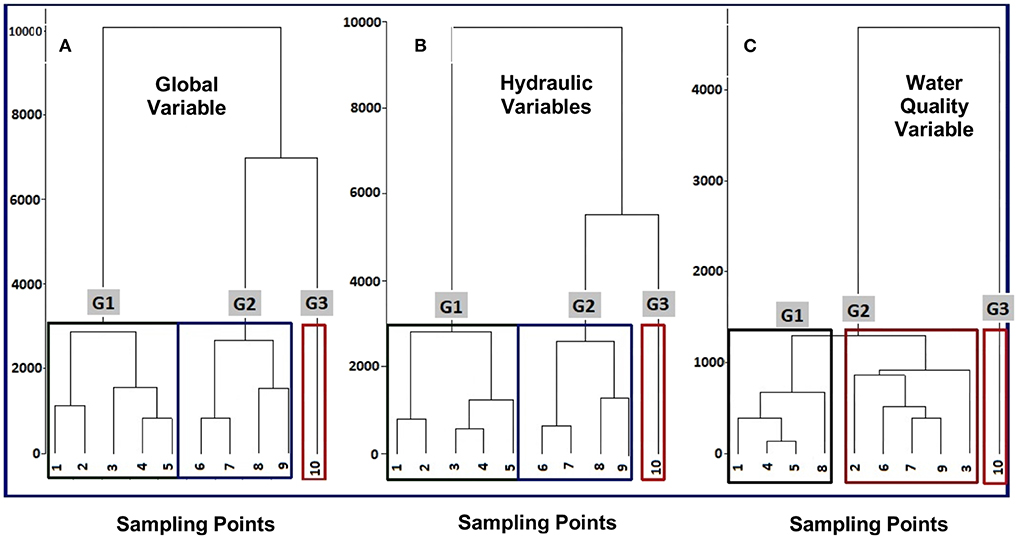
Figure 5. Cluster analysis showing the dissimilarity of key variables based on (A) Global parameters using all 24 variables (water quality and hydraulic parameters); (B) key variables and only hydraulic parameters; and (C) key variables and only water quality parameters. In all three cases, the formation of three characteristic groups can be observed, indicating significant spatial variations between the sampling points P1 to P9 (reservoir) and P10 (downstream of the dam).
Therefore, the hypothesis of significant hydraulic influence is also corroborated by hydrodynamic parameters (Cunha E. D. S. et al., 2013); that is, the estimate of hydraulic residence time (thr) in the reservoir is a function of the volume and instant flow (Abreu et al., 2020). According to IO-FGO (2014), the reservoir volume at an operational level is Vol≈137.7 km3. If the reservoir operates at this full volume, there is the possibility of three hydraulic scenarios that explain the similarity between the dendrograms in Figures 4A,B. For example, when the flow rate is near the maximum average value (rainy season), thr would be about 16 h. If the flow rate is near average (transition season), then thr would be about 36 h. Finally, if the flow is near the minimum (dry season) thr would be as much as 27.8 days. The dissimilarities observed in Figure 4C in relation to Figures 4A,B, show periods of lesser hydrological influence (greater thr), typical of the dry season, when limnological processes are more controlled by the internal biogeochemical dynamics in the reservoir itself.
During the dry period (November 2015), the QD ≈54 m3 s−1 of the HPPFG reservoir automatically generates an average water renewal time of 29.5 days. This is enough time for a series of physical and biogeochemical transformations to occur (sedimentation, dilution, etc.) as well as chemical changes (reactions) and microbiological changes (metabolism) (Kentzer et al., 2010; Li et al., 2013; Fearnside, 2017; Talukdar and Pal, 2018; Tanga et al., 2019; Abreu et al., 2020).
Another operational aspect related to the reservoir filling phase for HPPFG (Vol%) was the excessively short time period for filling. Between July and August, 2014 the volume rose from 18 to 86% in only 24 days. Ultimately, the speed of the filling may have aggravated the deterioration in the water quality (mainly TSI) in this same time period, including favoring fish death (Richmond et al., 2014; Rytwinski et al., 2017; Santos et al., 2017). For instance, fish death was observed to have occurred precisely in the following periods: July 28–31, 2014; August 30 to September 4, 2014; and September 30 to October 14, 2014, with a new incidence in November 2015 (Santos et al., 2017). Based on the DO and BOD analyses, the cause was probably not anoxia, since the water was practically supersaturated with DO.
In November 2015, there was an extreme case of low flow, with discharge 50% lower than the historical average minimum (Cunha E. D. S. et al., 2013). The local residents attributed the fish death to this fact (Santos et al., 2017). For example, in a rare study of a reservoir filling phase in Brazil, Cope et al. (2011) recorded the cases of Paraitinga (Areservoir ≈6.43 km2, with the filling beginning on January 10, 2005 and ending on May 6, 2006 at 95% of the full volume, flow rate of 2 m3 s−1, a total of 185 days for filling) and Biritiba (Areservoir ≈9.24 km2, with the filling beginning on May 13, 2005 and ending on April 21, 2006 at 100% of the full volume, flow rate of 1.75 m3 s−1, i.e., a total of 383 days for filling). Both the reservoirs are part of the High Tietê Producer System, with important roles in sanitation and public water supply in that region. Roughly, in comparative terms with the current case, the thr can explain the strong influence of hydraulic parameters on the key parameters associated with the rainy periods (Figures 5A,B) and the dry periods (Figure 5C).
The complexity of these processes, as stated by Labadie (2004); Wildi et al. (2004), and Poff et al. (2015), points to the need for integrated management of the entire river basin. In the case studied, this will depend on improving communication between dam operators on the same river, as stated by Weissenberger et al. (2010). The integrated management of dams is essential for avoiding undesirable environmental events, including seed flow block, fish death, and growth of toxic algae (eutrophication) and aquatic plants. These effects may also be aggravated by climate change. Thus, there is a lack of quantitative and transparent information that can facilitate decisions in times of environmental crises, such as the loss of biodiversity and sanitary deterioration (Fearnside, 1999, 2014, 2016, 2017).
According to Agostinho et al. (2016), the intensity and nature of these changes are related to the peculiarities of the local biota and the location, morphometric, and hydrological characteristics of the reservoir, operation of the dam and interactions with other uses of the basin, including other reservoirs. These impacts exhibit substantial spatiotemporal variability. The filling phase is marked by sudden and intense changes in the key attributes of aquatic habitats, followed by predominantly heterotrophic processes, with possible thermal stratification and anoxic conditions. Fish richness generally increases immediately after filling and decreases in subsequent years (Santos et al., 2017). Trophic depletion is expected, and diversity gradients are intensified toward more lentic stretches, average fish length decreases and fish fauna is dominated by species with sedentary strategies and/or parenting care.
For instance, Morais et al. (2009) observed that the interruption of river flow during the filling of the Alqueva dam (Portugal), influenced the variability of abiotic and biotic factors in the Guadiana River estuary, especially in the abundance and distribution of anchovy eggs (reduced the abundance of anchovy eggs by 99.99%). The inflow of the river was considered to be the most relevant factor in determining the abiotic and biotic variability in the Guadiana River estuary. Along these lines, ~25 years after the Balbina impoundment (Brazilian Amazon), the giant otter population only doubled from relative to before filling. This is 4.5 times lower population growth than was expected based on the total available habitat and the population density in an undisturbed neighboring region (Palmeirim et al., 2014). The discrepancy between predicted and actual otter population growth is likely due to low fish productivity and worse habitat quality than was expected.
The Three Gorges Dam (TGD) in China is another example of how water quality and ecosystem productivity can be significantly altered during and after reservoir filling. Since being filled, there has been widespread proliferation of algae (primarily dinoflagellates) across the tributary network of the Yangtze River directly linked to reduced river flow and land use management (Li et al., 2013). This eutrophication coincides with substantially increased nutrient levels as well as increased levels of toxic trace elements (As, Hg, Ti, Cd, Cr, Cu, and Zn) both in the water column and sediments over the last 20 years. Finally, sediment discharge from the Yangtze River was reduced from 500 million tons (pre-impoundment) to only 64 million tons in 2006 (Li et al., 2013). Reduced sediment loads have important impacts on both coastal geopmorphology and river ecology. For example, reduced sedimentation rates in the lower reaches of the Araguari River since 2011 has resulted in the Amazon River eroding a channel that connects the two systems. This has effectively eliminated the natural tidal bore (“pororoca”) in the Araguari River and likely altered habitat structure (Santos et al., 2018). Along these same lines, a sediment deficit downstream of dams in the Lima River (Portugal and Spain) caused incision of the channel resulting in narrowing of the channel and redistribution of vegetation communities (Fernandes et al., 2020).
Conclusions
After a year of observing and monitoring the water quality and hydraulic parameters, our results confirm the hypothesis of a significant environmental impact during the critical filling phase of the HPPFG reservoir. Among the most notable finding from this study are:
(1) The most significant spatial and temporal variations in water quality were observed downstream of the dam (P10) as a consequence of the hydraulic and limnological characteristics between the reservoir and the location of the downstream section. The area is in an environmentally- and sanitarily-vulnerable condition.
(2) Seasonal variations in the key variables, in addition to the physio-chemical variables, were very significant (p < 0.01) and dependent on the hydrological cycle and operational condition of the reservoirs. However, the only parameter that varied significantly in space was DO due to the strong hydraulic influence of HPPCN (upstream from point P1) and HPPFG (downstream) on P10.
(3) Lack of legal compliance (CONAMA/357-2005) was observed for Color, TC, E. coli, and pH (frequently). There was a strong spike in TC concentration immediately at the beginning of the filling (critical phase). TC levels returned to the initial state, following a spatial decline in the direction of the HPPFG dam. They also varied with the filling volume (Vol%). The levels of TC and E. coli were related to secondary effects, probably sewage disposal downstream at P10 (an effect of urban population growth), along with pollution from various sources and probably by the flow of subterranean waters toward the area around the reservoir. Urban sewage disposal potentially increased the concentration of E. coli downstream of the dam.
(4) The concentration of Chl-a went down as Vol% increased, probably due to the dilution factor in the rainy and transition periods, also reducing residence time. However, the dilution factor alone did not explain the Ptotal concentration or the TSI, which seem to depend on other limnological processes that contribute to the hydraulic operations of HPPFG and HPPCN.
(5) The results indicate a high capacity for self-purification in this altered section of the Araguari River, despite the hydraulic fragmentation caused by the two previously installed power plants (HPPCN and HPPCC). This shows high resilience in the face of environmental impacts of this nature. These are explained by hydraulically favorable factors, such as the reduced residence time of 16 h when there is high or average flow. However, they are highly dependent on the local hydrological behavior, since in the dry season residences times increase to ~1 month.
(6) Hydraulic influence appears to have been the most relevant environmental and ecological factor in the HPPFG reservoir filling process, which shows hydrodynamic behavior more typical of a river (lotic) than a lake (lentic). However, this favorable hydraulic scenario is rare in Amazonian hydropower plants. Therefore, other similar studies are needed to make comparisons and assess whether our results are a trend or an exception.
It should be noted that our results represent detailed horizontal resolution of surface water conditions, but due to sampling logistics the dataset is limited in terms of changes along the reservoir's depth profile at each station. For example, parameters such as DO and nutrients vary substantially with depth in reservoirs and lakes. Our finding that there was limited spatial variability in water quality parameters within the reservoir system, aside from DO, suggest that future studies could consider prioritizing more detailed depth profiling at fewer stations to further understand how water quality varies during the filling phase.
The long-term ecological impacts of dams are becoming increasingly recognized and characterized in river systems throughout the world. However, short-term impacts during the filling phase have been neglected and poorly studied to date. These short-term impacts during the filling phase can both exceed legal compliance in terms of water quality and also be compounded by other disturbances such as land use change, amplifying long-term alterations. Thus, we suggest that greater attention should be paid to the impacts of the filling phase process by planners, managers, lawyers, scientists, and especially local communities impacted by dams. Results from this study provide an initial framework for assessing environmental impacts of reservoir filling that can be further developed and adopted for hydropower projects planned in the future.
Data Availability Statement
All datasets generated for this study are included in the article/supplementary material.
Author Contributions
GS, CM, LB, and DB carried out the field work and laboratory/statistical analyses. AC and HC oversaw project logistics and secured funding for the work. NW and AC guided development of the manuscript along with GS. All authors discussed the results and commented on the manuscript.
Funding
Funding was provided by CNPq award #'s: 475614/2012-7, 303715/2015-4, and 303715/2015-4 and FAPESP award #08/58089-9.
Conflict of Interest
The authors declare that the research was conducted in the absence of any commercial or financial relationships that could be construed as a potential conflict of interest.
Acknowledgments
The authors are grateful to CNPq for supporting Project n. 309684/2018-8, TEDPLAN Project (2018)/ FUNASA – UNIFAP, FAPESP Grant no 08/58089-9, and NSF DEB Grant #1256724. We also thank the PPGBIO, PPGCA, and BIONORTE graduate programs and the LQSMSA Laboratory and Laboratory of Hydraulic and Environment Sanitation at UNIFAP.
References
Abd-Elhamid, H., Abdelaty, I., and Sherif, M. (2019). Evaluation of potential impact of grand Ethiopian renaissance dam. on seawater intrusion in the nile delta aquifer. Int. Environ. Sci. Technol. 16, 2321–2332. doi: 10.1007/s13762-018-1851-3
Abreu, C. H. M., Brito, D., Barros, M. L., Teixeira, M. R., and Cunha, A. C. (2020). Hydrodynamic modeling and simulation of water residence time in the Estuary of the Lower Amazon River. Water 12, 1–30. doi: 10.3390/w12030660
Abreu, C. H. M., and Cunha, A. C. (2016). Qualidade da água e índice trófico em rio de ecossistema tropical sob impacto ambiental. Eng. San. Amb. 22, 45–56. doi: 10.1590/s1413-41522016144803
Affonso, A. G., Barbosa, C., and Novo, E. M. L. M. (2011). Water quality changes in floodplain lakes due to the Amazon River flood pulse: lago grande de curuaí (Pará). Braz. J. Biol. 71, 601–610. doi: 10.1590/S1519-69842011000400004
Agostinho, A. A., Gomes, L. C., Santos, N. C., Ortega, J. C., and Pelicice, F. M. (2016). Fish assemblages in Neotropical reservoirs: Colonization patterns, impacts and management. Fish. Res. 173, 26–36. doi: 10.1016/j.fishres.2015.04.006
Ahmed, M. T. (2019). The grand Ethiopian renaissance dam and the sustainability of water resources: would monetary compensation warrant some more restrictions on dams? Sustain. Water Res. Manage. 5, 1327–1334. doi: 10.1007/s40899-019-00307-4
ANA (2014). Agência Nacional de Águas. Available online at: www.ana.gov.br
Ansar, A., Flyvbjerg, B., Budzier, A., and Lunn, E. D. (2014). Should we build more large dams? the actual costs of hydropower megaproject development. Energy Policy 69, 43–56. doi: 10.1016/j.enpol.2013.10.069
APHA-American Public Health Association American Water Works Association-AWWA, and Water Pollution Control Facilities–WPCF. (2005). Standard Methods for Examination of Water and Wastewater, 21th Edn. Washington, DC.
Araújo, K. R. D., Sawakuchi, H. O., Bertassoli, D. J. Jr, Sawakuchi, A. O., Silva, K. D. D., Vieira, T. B., et al. (2019). Carbon dioxide (CO2) concentrations and emission in the newly constructed Belo Monte hydropower complex in the Xingu River, Amazonia. Biogeosciences 16, 3527–3542. doi: 10.5194/bg-16-3527-2019
Bárbara, V. F., Cunha, A. C., Rodrigues, A. S., and de Siqueira, E.Q. (2010). Monitoramento sazonal da qualidade da água do rio Araguari/AP. Rev. Biociências 16, 57–72.
Barros, N., Cole, J. J., Tranvik, L. J., Prairie, Y. T., Bastviken, D., Huszar, V. L. M., et al. (2011). Carbon emission from hydroelectric reservoirs linked to reservoir age and latitude. Nat. Geosci. 9, 593–596. doi: 10.1038/ngeo1211
Bastviken, D., Tranvik, L. J., Downing, J. A., Crill, P. M., and Enrich-Prast, A. (2011). Freshwater methane emissions offset the continental carbon sink. Science 331:6013. doi: 10.1126/science.1196808
Boyd, C. E. (2000). Water quality particulate matter, turbidity, and color. Boyd C. E. (2000). “Particulate matter, turbidity, and color,” in Water Quality (Boston, MA: Springer), 95–103. doi: 10.1007/978-1-4615-4485-2_6
Brito, D. C. (2008). Aplicação do Sistema de Modelagem da Qualidade da Água Qual2kw em Grandes Rios: o caso do Alto e Médio Rio Araguari-AP (Dissertação, Mestrado em Biodiversidade Tropical). Universidade Federal do Amapá, Macapá, Brazil.
Carlson, R. E. (1997). A trophic state index for lakes. Limnol. Oceanogr. 22, 361–369. doi: 10.4319/lo.1977.22.2.0361
Carlson, T. J. (2014). Quantifying barotrauma risk to juvenile fish during hydro-turbine 865 passage. Fish. Res. 154, 152–164. doi: 10.1016/j.fishres.2014.01.007
Conselho Nacional do Meio Ambiente CONAMA. (2005). Resolução no. 357, de 17 de Março de 2005. Brasilia: Publicada no Diário Oficial da União (DOU).
Consiliu Meio Ambiente & Projetos e Systema Natura e Consultoria Ambiental Ltda (2008). T021 – Programa de Monitoramento Limnológico e de Qualidade da Água UHE Foz do Rio. Claro, 65.
Cope, V., Mercante, C. T. J., Carmo, C. F., Sendacz, S., and Monteiro Júnior, A. J. (2011). Mass balance of nutrients during the filling phase of two reservoirs of Sistema Produtor Alto Tietê (SPAT). Acta Sci. Biol. Sci. 33, 49–57. doi: 10.4025/actascibiolsci.v33i1.7313
Cunha, A. C., Brito, D. C., Cunha, H. F. A., and Schulz, H. E. (2011). “Dam Effect on Stream Reaeration Evaluated with the Qual2kw Model: Case Study of the Araguari River, Amazon Region, Amapá State/Brazil,” in Sustainable Water Management in the Tropics and Subtropics - and Case Studys in Brazil-Technics: Energy, Industry, Sewage, Waste, Waste Water, Chemistry, Toxicology and GIS, 1Edn. eds O. Hensel, J. Selbach, and C. Bilibio (Jaguarão; CDU Chemical Tecnhology; UniKassel: Fundaç: Fundação Univ. Fed. do Pampa, Unikassel, PGCult-UFMA. v. 2), 150-174.
Cunha, A. C., Pinheiro, L. A. R., and Cunha, H. F. A. (2013). Modelagem e simulação do escoamento e dispersão sazonais de agentes passivos no rio Araguari: Cenários para o AHE Ferreira Gomes I - Amapá/Brasil. Rev. Bras. Recursos Hídricos 18, 57–85. doi: 10.21168/rbrh.v18n1.p67-85
Cunha, A. C., and Sternberg, L. S. L. (2018). Using stable isotopes 18O and 2H of lake water and biogeochemical analysis to identify factors affecting water quality in four estuarine Amazonian shallow lakes. Hydrol. Proc. 32, 1188–1201. doi: 10.1002/hyp.11462
Cunha, A. C., Vilhena, J. E. S., Santos, E., Saraiva, J. B., Kuhn, P. A. F., Brito, D. C., et al. (2014). Evento extremo de chuva-vazão na Bacia Hidrográfica do Rio Araguari/Amapá. Rev. Bras. Meteorol. 29, 95–110. doi: 10.1590/0102-778620130051
Cunha, E. D. S., Cunha, A. C., Silveira, A. M. Jr., and Faustino, S. M. M. (2013). Phytoplankton of two rivers in the eastern Amazon: characterization of biodiversity and new occurrences. Acta Bot. Bras. 27, 364–377. doi: 10.1590/S0102-33062013000200011
Cunha, A. C., Mustin, K., Dos Santos, E. S., Dos Santos, É. W. G., Guedes, M. C., Cunha, H. F. A., et al. (2017). Hydrodynamics and seed dispersal in the lower Amazon. Freshw. Biol. 62, 1721–1729. doi: 10.1111/fwb.12982
Dias, T. C. A. C., Cunha, A. C., and Silva, J. M. C. (2016). Return on investment of the ecological infrastructure in a new forest frontier in Brazilian Amazonia. Biol. Conserv. 194, 184–193. doi: 10.1016/j.biocon.2015.12.016
Fearnside, P. M. (1999). Social impacts of Brazil's Tucurui Dam. Environ. Manage. 24, 483–495. doi: 10.1007/s002679900248
Fearnside, P. M. (2014). Impacts of brazil's madeira river dams : unlearned lessons for hydroelectric development in Amazonia. Environ. Sci. Policy 38, 164–172. doi: 10.1016/j.envsci.2013.11.004
Fearnside, P. M. (2016). Environmental and social impacts of hydroelectric dams in brazilian amazonia: implications for the aluminum industry. World Dev. 77, 48–65. doi: 10.1016/j.worlddev.2015.08.015
Fearnside, P. M. (2017). Belo Monte: actors and arguments controversial Amazonian dam. J. Geogr. Soc. 148, 14–26. doi: 10.12854/erde-148-27
Fernandes, L. F. S., Pinto, A. A. S., Terêncio, D. P. S., Pacheco, F. A. L., and Cortes, R. M. V. (2020). Combination of ecological engineering procedures applied to morphological stabilization of estuarine banks after dredging. Water 12:391. doi: 10.3390/w12020391
Górski, K., van den Bosch, L. V, Van de Wolfshaar, K. E., Middelkoop, H., Nagelkerke, A. J. L., Filippov, O. V., et al. (2012). Post-damming flow regime development in a large lowland river (Volga, Russian Federation): implications for floodplain inundation and fisheries. River Res. Appl. 28, 1121–1134. doi: 10.1002/rra.1499
Gupta, S. K. (2010). Modern Hydrology and Sustainable Water Development, 1 Edn. Oxford, UK: Blackwell Publishing Ltd. doi: 10.1002/9781444323962
Hofstra, H., and Huisin't Veld, J. H. (1988). Methods for the detection and isolation of Escherichia coli including pathogenic strains. J. Appl. Bacteriol. Symp. Suppl. 17, 197S−212S. doi: 10.1111/j.1365-2672.1988.tb04564.x
IMAP (2015). Instituto do Meio Ambiente e Ordenamento Territorial do Amapá. Available online at: www.imap.ap.gov.br
International Rivers (2014). Protegendo Rios e Direitos. World Comission Dams (WCD). Available online at: http://www.internationalrivers.org/pt-br/resources/protegendo-rios-e-direitos-dez-anos-depois-do-relat%C3%B3rio-da-comiss%C3%A3o-mundial-de-barragens (accessed Jan 23, 2015)
IO-FGO (2014). Procedimentos para operação do reservatório da UHE Ferreira Gomes. Centro de Operação: Geração de Energia.
Kentzer, A., Dembowska, E., Gizinski, A., and Napiórkowski, P. (2010). Influence of the Włocławek Reservoir on hydrochemistry and plankton of a large, lowland river (the Lower Vistula River, Poland). Ecol. Eng. 36, 1747–1753. doi: 10.1016/j.ecoleng.2010.07.024
Labadie, J. W. (2004). Optimal operation of multireservoir systems: state-of-the-art review. J. Water Res. Plan. Manage. 130, 93–111. doi: 10.1061/(ASCE)0733-9496(2004)130:2(93)
Lamparelli, M. C. (2004). Grau de trofia em corpos d'água do estado de São Paulo: avaliação dos métodos de monitoramento. São Paulo: USP/Departamento de Ecologia. 235p. Tese de doutorado, Universidade de São Paulo.
Li, K., Li, C., Zhu, L., Wu, L., and Huang, L. (2013). Problems caused by the three gorges dam construction in the yangtze river basin: a review. Environ. Rev. 21, 127–135. doi: 10.1139/er-2012-0051
Madoux-Humery, A. S., Dorner, S., Sauvé, S., Aboulfadl, K., Galarneau, M., and Servais, P. (2013). Temporal variability of combined sewer overflow contaminants: evaluation of wastewater micropollutants as tracers of fecal contamination. Water Res. 47, 4370–4382. doi: 10.1016/j.watres.2013.04.030
Morais, P., Chícharo, M. A., and Chícharo, L. (2009). Changes in a temperate estuary during the filling of the biggest European dam. Sci. Total Environ. 2245–2259. doi: 10.1016/j.scitotenv.2008.11.037
Müller, H. E., and Mossel, D. A. A. (1982). Observation on the occurrence of salmonella in 20.000 samples of drinking water and a note on the choice of marker organisms for monitoring water supplies. Antonie Van Leeuwenhock 48, 641–643. doi: 10.1007/BF00399554
Nogueira, C., Valdujo, P. H., Paese, A., Ramos Neto, M. B., and Machado, R. B. (2009). Desafios para a identificação de áreas para conservação da biodiversidade. Megadiversidade 5, 43–53.
Padeddaa, B. M., Sechia, N., Laia, G. G., Mariania, M. A., Pulinab, S., Sattaa, C. T., et al. (2015). A fast-response methodological approach to assessing and managing nutrient loads in eutrophic Mediterranean reservoirs. Ecol. Eng. 85, 47–55. doi: 10.1016/j.ecoleng.2015.09.062
Palmeirim, A. F., Peres, C. A., and Rosas, C. W. (2014). Giant otter population responses to habitat expansion and degradation induced by a mega hydroelectric dam. Biol. Conserv. 174, 30–38. doi: 10.1016/j.biocon.2014.03.015
Parsons, T. R., and Strickland, J. D. H. (1963). Discussion of spectrophotometric determination of marine-plant pigments, with revised equations for ascertaining chlorophylls and carotenoids. J. Mar. Res. 2, 155–163.
Pedrozo, C. S., and Kapusta, S. C. (2010). Indicadores Ambientais Em Ecossistemas Aquáticos. Porto Alegre: Instituto Federal do Rio Grande do Sul.
Poff, N. L., Brown, C. M., Grantham, T. E., Matthews, J. H., Palmer, M. A., Spence, C. M., et al. (2015). Sustainable water management under future uncertainty with eco-engineering decision scaling. Nat. Clim. Change 14, 1–10. doi: 10.1038/nclimate2765
R Development Core Team (2016). R: A Language And Environment for Statistical Computing. Vienna: R Foundation for Statistical Computing. Available online at: http://www.R-project.org
Richmond, M. C., Serkowski, J. A., Ebner, L. I., Sick, M., Brown, R. S., and Carlson, T. J. (2014). Quantifying barotrauma risk to juvenile fish during hydro-turbine passage. Fish. Res. 154, 52–164.
Robinson, C. T., Uehlinger, U., and Monaghan, M. T. (2004). Stream ecosystem response to multiple experimental floods from a reservoir. River Res. Appl. 20, 359–377. doi: 10.1002/rra.743
Rytwinski, T., Algera, D. A., Taylor, J. J., Smokorowski, K. E., Bennett, J. R., Harrison, P. M., et al. (2017). What are the consequences of fish entrainment and impingement associated with hydroelectric dams on fish productivity? a systematic review protocol. Environ. Evid. 6:8. doi: 10.1186/s13750-017-0087-x
Sanches, P. V., Nakatani, K., Bialetzki, A., Baumgartner, G., Gomes, L. C., and Luiz, E. A. (2006). Flow regulation by dams affecting ichthyoplankton: the case of the Porto Primavera Dam, Paraná river, Brazil. River Res. Appl. 22, 555–565. doi: 10.1002/rra.922
Santos, E. S. (2012). Modelagem Hidrodinâmica e Qualidade da Água na Foz do Rio Araguari - AP (Dissertação Mestrado em Biodiversidade Tropical). Universidade Federal do Amapá, Macapá, Brazil.
Santos, E. S., Cunha, A. C., and Cunha, H. F. A. (2017). Hydroelectric power plant in the amazon and socioeconomic impacts on fishermen in Ferreira Gomes county - Amapá State. Ambiente Soc. 20, 191–208. doi: 10.1590/1809-4422asoc0088r2v2042017
Santos, E. S., Lopes, P. P. P., Nascimento, O. O., Pereira, H. H. S., Collin, R., Sternberg, L. S. L., et al. (2018). The impact.of channel capture on estuarine hydro-morphodynamics and water quality in the Amazon delta. Sci. Total Environ. 624, 887–899. doi: 10.1016/j.scitotenv.2017.12.211
Santos, P. V. C. J., and Cunha, A. C. (2018). Potencial de Vazão Ambiental (PVA): Método Participativo para estimar vazão ambiental em rios da Amazônia. Eng. Sanit. Ambient. 23, 137–150. doi: 10.1590/s1413-41522018140637
Santos, P. V. J., and Cunha, A. C. (2013). Outorga de recursos hídricos e vazão ambiental no Brasil: perspectivas metodológicas frente ao desenvolvimento no setor hidrelétrico na Amazônia. Rev. Bras. Recursos Hídricos 18, 81–95. doi: 10.21168/rbrh.v18n3.p81-95
SIGEL/ANEEL (2018). Sistema de Informações Geográficas do Setor Elétrico. Available online at: https://sigel.aneel.gov.br/Down/ (accessed July 30, 2018).
Talukdar, S., and Pal, S. (2018). Impact of dam on flow regime and flood plain modification in punarbhaba river basin of indo-bangladesh barind tract. Water Conserv. Sci. Eng. 3, 59–77. doi: 10.1007/s41101-017-0025-3
Tanga, H., Wasowskib, J., and Juang, C. H. (2019). Geohazards in the three Gorges Reservoir Area, China – Lessons learned from decades of research. Eng. Geol. 261:105267. doi: 10.1016/j.enggeo.2019.105267
Tundisi, J. G. (2003). Água no século XXI: enfrentando a escassez. Rima 3, 1–247. doi: 10.1007/s10612-010-9120-x
van Solinge, T. B. (2010). Deforestation crimes and conflicts in the Amazon. Crit. Criminol. 18, 263–277.
Vörösmarty, C. J., Meybeck, M., Fekete, B., Sharma, K., Green, P., and Syvitski, J. P. (2003). Anthropogenic sediment retention: major global impact from registered river impoundments. Glob. Planet. Change 39, 169–190. doi: 10.1016/S0921-8181(03)00023-7
Ward, N. D., Bianchi, T. S., Sawakuchi, H. O., Gagne-Maynard, W., Cunha, A. C., Brito, D. C., et al. (2016). The reactivity of plant-derived organic matter and the potential importance of priming effects along the lower Amazon River. J. Geophys. Res. Biogeosci. 121, 1522–1539. doi: 10.1002/2016JG003342
Ward, N. D., Sawakuchi, H. O., Diniz, J. E., Neu, V., Less, D. F. S., Valerio, A. M., et al. (2018). Velocity-amplified microbial respiration rates in the lower Amazon River. Limnol. Oceanogr. Lett. 3, 1–10. doi: 10.1002/lol2.10062
Weissenberger, S., Lucotte, M., Houel, S., Soumis, N., Duchemin, É., and Canuel, R. (2010). Modeling the carbon dynamics of the La Grande hydroelectric complex in northern Quebec. Ecol. Model. 221, 610–620. doi: 10.1016/j.ecolmodel.2009.10.037
Westin, F. F., Santos, M. A., and Martins, I. D. (2014). Hydropower expansion and analysis of the use of strategic and integrated environmental assessment tools in Brazil. Renew. Sustain. Energy Rev. 37, 750–761. doi: 10.1016/j.rser.2014.04.071
Wildi, W. (2010). Environmental hazards of dams and reservoirs. NEAR curriculum in natural environmental science. Terre Environ. 88, 187–197.
Wildi, W., Dominik, J., Loizeau, J. L., Thomas, R. L., Favarger, P. Y., Haller, L., et al. (2004). River, reservoir and lake sediment contamination by heavy metals downstream from urban areas of Switzerland. Lakes Reserv. Res. Manage. 9, 75–87. doi: 10.1111/j.1440-1770.2004.00236.x
Wildi, W., Hofmann, A., Monnerat, M., and Perroud, A. (2003). Contaminated sediments in a river reservoir (Wettingen reservoir, Switzerland): present situation and history. Eclogae Geol. Helv. 96 (Suppl. 1), S127–S133. doi: 10.1007/978-3-0348-7992-7_15
Winemiller, K. O., McIntyre, P. B., Castello, L., Fluet-Chouinard, E., Giarrizzo, T., Nam, S., et al. (2016). Balancing hydropower and biodiversity in the Amazon, Congo, and Mekong. Science 351, 128–129. doi: 10.1126/science.aac7082
Keywords: reservoir, water quality, self-purification, hydroelectric, hydraulic fragmentation
Citation: da Silva GCX, Medeiros de Abreu CH, Ward ND, Belúcio LP, Brito DC, Cunha HFA and da Cunha AC (2020) Environmental Impacts of Dam Reservoir Filling in the East Amazon. Front. Water 2:11. doi: 10.3389/frwa.2020.00011
Received: 16 October 2019; Accepted: 14 April 2020;
Published: 08 May 2020.
Edited by:
Abhishek Gaur, National Research Council Canada (NRC-CNRC), CanadaCopyright © 2020 da Silva, Medeiros de Abreu, Ward, Belúcio, Brito, Cunha and da Cunha. This is an open-access article distributed under the terms of the Creative Commons Attribution License (CC BY). The use, distribution or reproduction in other forums is permitted, provided the original author(s) and the copyright owner(s) are credited and that the original publication in this journal is cited, in accordance with accepted academic practice. No use, distribution or reproduction is permitted which does not comply with these terms.
*Correspondence: Nicholas D. Ward, bmljaG9sYXMud2FyZCYjeDAwMDQwO3BubmwuZ292; Alan Cavalcanti da Cunha, YWxhbmN1bmhhMTImI3gwMDA0MDtnbWFpbC5jb20=