
94% of researchers rate our articles as excellent or good
Learn more about the work of our research integrity team to safeguard the quality of each article we publish.
Find out more
ORIGINAL RESEARCH article
Front. Water , 17 March 2020
Sec. Water and Hydrocomplexity
Volume 2 - 2020 | https://doi.org/10.3389/frwa.2020.00002
This article is part of the Research Topic Model-Data Fusion in Hydrology View all 6 articles
 Angela Gregory1
 Chao Chen2
 Rui Wu3
 Sarah Miller4
 Sajjad Ahmad2
 John W. Anderson5
 Hays Barrett6
 Karl Benedict7*Dan Cadol4
 Sergiu M. Dascalu8
 Donna Delparte9
 Lynn Fenstermaker10
 Sarah Godsey9
 Frederick C. Harris Jr.8
 James P. McNamara11Scott W. Tyler12John Savickas6
 Luke Sheneman5
 Mark Stone1
 Matthew A. Turner13
Due to the complexity and heterogeneity inherent to the hydrologic cycle, the modeling of physical water processes has historically and inevitably been characterized by a broad spectrum of disciplines including data management, visualization, and statistical analyses. This is further complicated by the sub-disciplines within the water science community, where specific aspects of water processes are modeled independently with simplification and model boundary integration receiving little attention. This can hinder current and future research efforts to understand, explore, and advance water science. We developed the Virtual Watershed Platform to improve understanding of hydrologic processes and more generally streamline model-data integration and data integration with tools for data visualization, analysis, and management. Currently, four models have been developed as components and integrated into the overall platform, demonstrating data prepossessing (e.g., sub gridding), data interaction, model execution, and visualization capabilities. The developed data management technologies provide a suite of capabilities, enabling diverse computation capabilities, data storage capacity, connectivity, and accessibility. The developed Virtual Watershed Platform explored the use of virtual reality and 3D visualization for scientific experimentation and learning, provided web services for the transfer of data between models and centralized data storage, enabled the statistical distribution of hydrometeorological model input, and coupled models using multiple methods, both to each other and to a distributed data management and visualization system.
Mechanisms responsible for observed and projected hydrologic change in high-elevation catchments are poorly understood, especially with respect to snow pack dynamics, surface-water/groundwater linkages, and interactions with vegetation. Mountain watersheds provide a large proportion of the water and ecosystem services for communities throughout the western U.S. Climate change threatens these resources through the risks of intensified drought, earlier snow-melt runoff, and increased fire frequency and severity (Running, 2006; Westerling et al., 2006). Management activities aimed at mitigating expected climate change impacts would benefit from a better understanding of the nature of watershed response to climate forcings that impact these complex systems. However, forecasting change under such complexity is beyond the capabilities of conventional approaches (e.g., modeling, observation) performed in isolation of one another (National Research Council, 2012).
When the National Science Foundation funded the Western Consortium for Watershed Analysis, Visualization, and Experimentation (WC-WAVE) project1 in 2014, the overall project goal was to address the problem of watershed-scale hydrologic modeling in the broader context of integration of modeling environments, data visualization and analysis systems, and data management capabilities through the development and adoption of a loosely-coupled architectural model that places data management, documentation and access services at the center of the exchange of model initialization, boundary condition, and output data. The envisioned development of a Virtual Watershed Platform in which diverse tools can be integrated using standard web service models was intended as a complement to existing model integration systems, such as OpenMI (Moore and Tindall, 2005), and CSDMS (Peckham et al., 2013), and as a more generalized data management system than the version of CUAHSI's HydroServer [based upon the CUAHSI HIS architectural model (Horsburgh et al., 2009)] that was available at the time. The developed architectural approach is aligned with the component-based strategies described by Peckham et al. (2013) and Buahin and Horsburgh (2018) but extends those approaches to enable support for general purpose and standards-based data visualization and analysis systems that leverage data and visualization services published by the data management platform.
The Virtual Watershed Platform (VWP) as it is documented herein includes components based on diverse modeling systems and environments, data visualization and analysis tools, and a data management system that provides the connectivity between these components. The web services hosted by the data management system allow for the loose-coupling of these components through the exchange of data, complementing the model integration strategies and technologies employed for specific modeling needs, and allowing for the rapid integration of model data into customized data visualization and analysis environments.
The coupling of two or more preexisting models is a challenge across diverse aspects of hydrological science. In a brief review of highly cited papers (as reported by Web of Science), examples include coupling of land surface hydrology and atmosphere models (Chen and Dudhia, 2000; Walko et al., 2000; Ek et al., 2003; Kavvas et al., 2013), groundwater and atmosphere models (Maxwell and Miller, 2003), surface water and groundwater models (Panday and Huyakorn, 2004; Kollet and Maxwell, 2006; Ebel et al., 2009), social and hydrologic models (Elshafei et al., 2015; Troy et al., 2015), glacier and hydrology models (Flowers and Clarke, 2002; Hoffman and Price, 2014), vegetation and hydrology models (Gerten et al., 2004), crop and hydrology models (Li et al., 2014; McNider et al., 2015), and hydrologic and hydrodynamic models (Felder et al., 2017). In most cases cited here, this effort required recoding of the model logic for at least one of the existing models into a more compatible format, and often one model was subsumed piecemeal into the operating code of the other. The ability to couple models in a more automated way has been recognized as a means to speed research progress and empower outside innovators (Peckham et al., 2013), but pending further advances in this capability, researchers who are not intimately familiar with the code of both models of interest still struggle to couple them in an efficient or meaningful way.
Belete et al. (2017) defined the framework development process as five phases that included (1) pre-integration assessment, (2) technical model preparation, (3) model orchestration, (4) data interoperability, and (5) testing integration. The discussion herein focuses on phases 1–4, with the pre-integration assessment phase being a general conversation about software architecture and workflow between all scientists and software engineers. Within these phases there is likely to be a requirement to address issues with interoperability among programming languages, data exchange, plug and play modeling components, semantic mediation, service components, graphical user interface, and web-based applications necessities among 19 needs identified for integrated modeling frameworks (Whelan et al., 2014). The WC-WAVE approached the design of the VWP by incorporating many of the elements discussed within Whelan et al. (2014) and Belete et al. (2017). However, after the pre-integration assessment, the team was divided into three groups that focused on development of components of integrated hydrological modeling. The three teams had different priorities with the eventual goal of enabling broader component integration through use of a shared data management application programming interface (API) published by the VWP. In addition, each team approached component development from the perspective of a different research question.
Many scientists have recognized the need for integration of high performance computing resources and model coupling architecture into integrated modeling frameworks to better answer complex natural resource questions (Laniak et al., 2013). Loosely coupled models refer to output from one model being fed into a second model for simulation. Loose coupling of models can be limited by the capabilities of the orchestration architecture. For example, enabling linked models to run in a repetitive sequence or automating the adjustment of boundary conditions is not always easily completed. This is especially true in web-based application, such as USGS's National Hydrologic Model (Regan et al., 2019). The existing frameworks generally do not allow for the addition of scripts that would guide the modeling process in addition to the existing architecture. This is important because it allows for the evolution of natural processes without creation of new software to simulate complex processes.
Parallel computing is required when a modeling domain consists of high-resolution spatial and/or temporal input that are large enough to exceed the capabilities of an individual computer. To run simulations then, the model is often split spatially or spatiotemporally into smaller domains that run simultaneously while exchanging information along the boundaries between the smaller domains. High performance computing (HPC), also known as parallel computing is available through CSDMS and OpenMI. Other collaborative modeling frameworks generally rely on local parallel computing resources to run large models.
While the modeling community has come a great way, a framework in which modeling environmental processes using any open source spatially and temporally explicit model can be easily accomplished remains lacking. This is generally due to issues of compatibility and the limited resources of the framework staff. Generalization of the experimentation process specifically developed for parallel computing, data integration, and data management is critical in moving toward a more useful modeling platform.
Data management systems in support of environmental modeling, analysis, visualization, preservation, and sharing typically fall into at least one of a number of high-level categories:
• General-purpose, institutional, or disciplinary repositories that provide preservation and persistent discovery and access to data and other products.
• Active archives that provide value added services on top of stored data but don't necessarily implement digital preservation practices, such as fixity checks, replication, use of archival data formats, or provide long-term format migration.
• Agency managed data archives that provide long-term access to data generated/produced by those agencies or through projects that those agencies sponsor.
• Shared data storage systems that may or may not provide additional metadata or capabilities in conjunction with shared data storage.
In the first case, repositories as a class of data systems are numerous- re3data.org lists 2406 repositories2 in its registry—but these are highly variable in their characteristics. For example, 232 of these repositories have some sort of certification, such as CoreTrustSeal or World Data System (WDS). 998 of them provide a persistent identifier, such as a Digital Object Identifier (DOI) or handle (hdl). And, 1930 of them are characterized as disciplinary, 585 as institutional, and 280 as “other” types of repositories.
The re3data.org repository also provides some insight into the diversity of “active archives” (the second category listed above) through its list of “APIs” (Application Programming Interfaces) that have been linked to the registered repositories. The inclusion of OpenDAP (52 repositories), REST (392), SOAP (64), and SPARQL (33) APIs in the list highlights potential value added services that might be provided by these flagged repositories. These APIs can be used to provide automated methods for interaction with the contents of the archive, with OpenDAP3 and SPARQL4 services clearly providing data access services, and the REST and SOAP APIs potentially providing either data access or more general repository Create/Read/Update/Delete (CRUD) services used for managing repository content.
Many environmental modeling and analysis tools require access to data published by national or international Earth observation agencies, such as the U.S. agencies USGS, NASA, and NOAA. These organizations typically provide download services (e.g., those discoverable through NASA's Open Data Portal5 site, NOAA's National Centers for Environmental Information6, and the USGS Science Data Catalog7), enable discovery of their data collections through metadata registries, such as the US Data.gov catalog8, and in some cases publish data access services based upon Open Geospatial Consortium data and map services (Vretanos, 2005; de la Beaujardiere, 2006; Whiteside and Evans, 2006), OpenDAP9, or specialized web services such at USGS's Water Services collection10. The publication of these data through web services highlights the potential for broad adoption of web services as a standard method for interacting with data required for initialization or boundary conditions for modeling systems, both relative to these agency data providers but also more generally.
While web services are capable of providing access to vast collections of Earth observation data required for modeling and analysis, the potential for significant delays in access to large volumes of data through on-demand web services highlights a continuing need for high-capacity storage in close proximity to the computational processes that work upon those data. The use of storage middleware, such as the integrated Rule-Oriented Data System (iRODS)11 in conjunction with high-performance storage systems enables data intensive use, management, documentation, and workflow development around data. The availability of data management systems, such as iRODS provides a powerful local data management foundation upon which environmental modeling workflows can be built as a complement to web services provided by the additional data management systems highlighted above.
Interaction and visualization are two significant methods for hydrologists to find interesting features and trends buried within raw data. In this project, we have implemented a 2D web data visualization and interaction application and a 3D Unity application to simplify complex theories and make it easier for people from different research areas to cooperate. A modeler can customize inputs to create different scenarios and visualize model outputs with our visualization tools.
Overall, the combination of the data management technologies outlined above provide a suite of capabilities that have been shown to enable environmental modeling systems to use high-performance local data storage, lower-performance but potentially high-capacity remote data storage accessible through web services, and repositories of various types to meet the data management requirements of modeling systems throughout the entire data lifecycle—from project planning, through modeling and analysis to preservation, publication, and sharing. The loose-coupling of components through this combination of access methods provides a high-degree of flexibility and customizability for modelers while still supporting their needs as they relate to specific computation environments and data types. The VWP provides a web services based hub for enabling exchange between modeling, storage, visualization, analysis, and preservation systems—complementing and extending the capabilities of locally optimized modeling, analysis, and data management systems.
The project results reported in section 3 are based upon a number of existing technologies and environmental modeling systems. The provided usage scenario in section 4 describes a science scenario that is addressed using a workflow that demonstrates how the individual components of the system interact, ultimately demonstrating the potential of the model-data integration capabilities of the VWP. The system components upon which the project capabilities were built are described in this section.
The Virtual Watershed Platform data management hub used in support of this work is based upon the Geographic Storage, Transformation and Retrieval Engine (GSToRE12) that was developed by the Earth Data Analysis Center at the University of New Mexico. Development of GSToRE was initiated in early 2009 in support of the New Mexico Resource Geographic Information System13 geospatial data clearinghouse, and the New Mexico EPSCoR RII3: Climate Change Impacts on New Mexico's Mountain Sources of Water14 project. Development, enhancement and use of the platform continued through three additional NSF funded projects, including a second 5-years NSF New Mexico EPSCoR project entitled New Mexico EPSCoR RII4: Energize New Mexico15 that focused on research across multiple renewable energy topics; and two 3-years collaborative NSF EPSCoR Track 2 projects between New Mexico, Idaho, and Nevada [Collaborative Research: Cyberinfrastructure Development in the Western Consortium of Idaho, Nevada, and New Mexico16 and Collaborative research: The Western Consortium for Watershed Analysis, Visualization, and Exploration (WC-WAVE)17], the second of which is the focus of the work reported on in this paper. Figure 1 illustrates this sequence of projects and the major releases of the GSToRE platform.
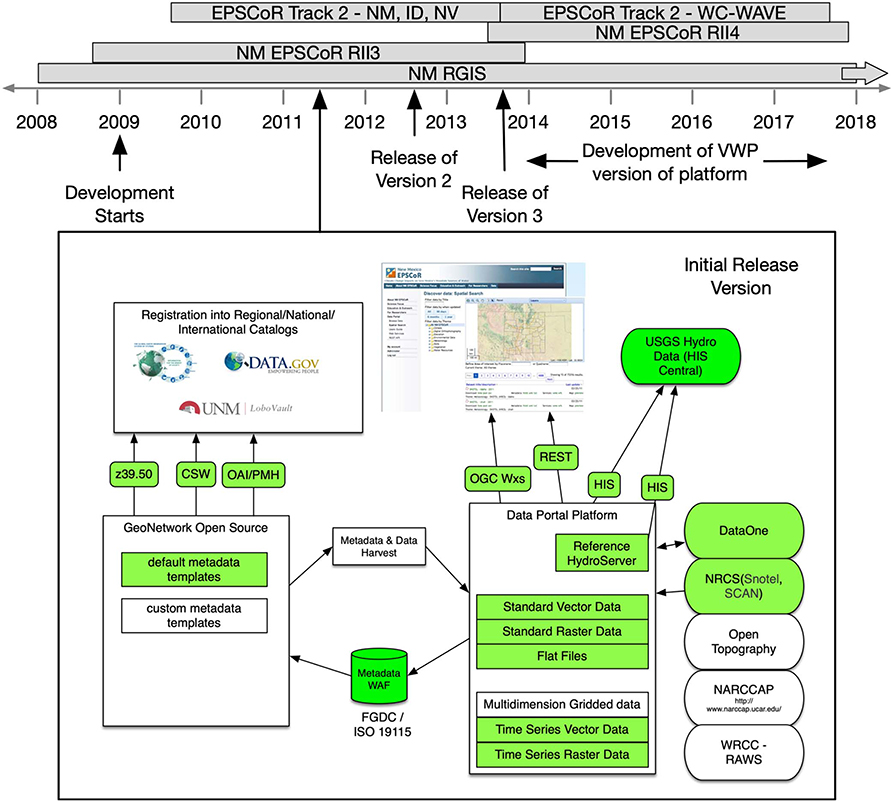
Figure 1. Illustration of the sequence of development of the GSToRE platform prior to adoption as the foundation for the Virtual Watershed Platform (VWP). The provided timeline highlights the five projects that substantially contributed to the development of the GSToRE and the derived VWP platforms—two National Science Foundation (NSF) funded Experimental (now Established) Program to Stimulate Competitive Research (EPSCoR) Research Infrastructure Improvement (RII) projects, two NSF EPSCoR Track 2 multi-jurisdiction (state) projects, and the New Mexico Resource Geographic Information System (NM RGIS) state geographic data clearinghouse. The component diagram labeled “Initial Release Version” illustrates the release of the GSToRE platform in 2011 and the integrated software components (CUAHSI HIS HydroServer, GeoNetwork Open Source), and custom python “glue” code that provides for data transfer between those components. The filled component boxes (green in the color version of the diagram) are the implemented components, the others were planned for future development. Version 3 of the GSToRE platform is separately illustrated in Figure 2 below.
The key drivers for the development of the GSToRE platform between 2009 and 2013 were derived from the diverse individual requirements of these multiple projects. The combined requirements of these projects continuously reinforced the need to develop the GSToRE platform as an alternative to sole adoption of existing solutions, such as the CUAHSI HIS HydroServer18 for point-time-series hydrologic observation data, GeoNetwork Open Source19 as geospatial data catalog system, MapServer20 or GeoServer21 for publishing geospatial map and data services, or simple data transfer protocols, such as FTP or SCP for providing low-level access to downloadable files. GSToRE was developed to provide a collection of data discovery, access, and management services, based upon open standards when appropriate, that went beyond the bounds of any of these single solutions. In particular, the following functional requirements both accumulated and drove the development of versions 1–3 of the GSToRE platform from 2009 to 2013:
• Support for diverse data types including geospatial (e.g., raster, vector—2D, 3D; geospatially enabled databases) and non-geospatial data (e.g., tabular data [spreadsheets, CSV files], other structured data [XML, JSON], documents and maps).
• Support for diverse data formats (e.g., ESRI Shapefiles and GeoDatabases, GeoTIFFS, Open Geospatial Consortium KML and GML files, Microsoft Word and Excel files, Adobe PDF files, and many others).
• Support for diverse documentation standards (e.g., the Federal Geospatial Data Committee Content Standard for Digital Geospatial Metadata22, ISO 19115 family of geospatial metadata standards23, Dublin Core24, and the combined data/metadata standard WaterML25).
• Capacity to publish data discovery and access services using a RESTful (Fielding, 2000) web services model, using both custom request-response exchange methods and standards-based exchange models. The required standards include those from the Open Geospatial Consortium26—including the Web Map (de la Beaujardiere, 2006), Web Feature (Vretanos, 2005), and Web Coverage Service standards (Whiteside and Evans, 2006); and the Open Archives Initiative Protocol for Metadata Harvesting27. In addition to these standards-based protocols support for the DataONE28 API29 was also required.
• Capacity to publish metadata for automated integration into other indexing and catalog system, such as the US Data.gov catalog30, and the GEOSS Platform31.
• Interoperability with Data Preservation Systems.
As illustrated in Figure 1 three versions of GSToRE were released between 2011 and 2013, with version 3 of the platform (released in 2013) providing the foundation for the data management hub enhanced in support of the model integration work reported on here. Version 1 of GSToRE (Figure 1) was primarily designed as a working prototype that combined the capabilities of existing platforms to provide discovery and access services for point-time-series hydrologic data through a reference installation of the CUAHSI HIS HydroServer, and geospatial data discovery and access through GeoNetwork Open Source. On-demand Open Geospatial Consortium Web Map, Web Feature, and Web Coverage services were provided through custom python code that automatically configured these services for delivery by the MapServer system. As experience with version 1 of the system was gained it was recognized that the system needed to be able to support non-geospatial data and metadata formats that were not associated with geospatial data. These provided the requirements for the development of Version 2 of the GSToRE platform.
Version 2 of the GSToRE Platform adopted a unified database model in Post-greSQL/Post-GIS for metadata and geospatial features (points, lines, and polygons and associated attributes) as a replacement for the loosely coupled Version 1 approach of using GeoNetwork and HydroServer and more limited custom code. The adoption of the unified database allowed for the implementation of an internal metadata model that provided flexible management of dataset metadata that is aligned with the characteristics of diverse data products. For example, the more limited Dublin Core metadata components could be captured and stored for documents and other non-geospatial datasets while the geospatial-specific FGDC or ISO 19115 family of metadata elements could be used for geospatial data. In all cases the metadata elements were stored in the database through a combination of core elements stored in database tables and additional elements stored as XML documents within the database using a custom XML schema. This combination of metadata elements was then accessed when the platform API provided formatted metadata aligned with these standards upon user request.
The version 2 feature store employed a single “tall table” for multiple geospatial vector datasets in which each record in the table represented a feature—including its point, line or polygon geometry; a single field (based on the Post-greSQL 9 hstore module/data type) that allowed for the storage (as key-value pairs) of the variable set of feature attributes associated with a specific geometry; and a standardized datetime field that would allow for uniform storage of datetime information about individual features to enable time-based query across stored datasets. Version 2 of the GSToRE API provided a unified set of RESTful service requests that had previously been supported by multiple platforms (GeoNetwork, HydroServer, custom python services). With the release of Version 2 of GSToRE in Fall of 2012 content was quickly added to the system, ultimately surfacing a limitation in the indexing capabilities of the Post-greSQL hstore that was limiting the performance of specific database queries as the number of features in the “tall table” grew toward 1 billion. Mitigating this limitation became the focus of the development of GSToRE version 3.
The development of GSToRE version 3 (Figure 2) was primarily focused on rebuilding the data management tier of the system to support increased scalability and performance for the growing collection of data managed within the system. This reconfiguration of the data management tier of the GSToRE architectural model consisted of splitting the single Post-greSQL/Post-GIS database in version 2 into a multiple-database model in version 3 with the following databases and functional roles:
• Post-greSQL/Post-GIS—Metadata and geometry (point, line and polygon) storage.
• MongoDB—Vector attribute data and tabular data storage.
• ElasticSearch/Lucine—JSON-based search engine based upon indexed JSON metadata documents derived from the content of the Post-greSQL/Post-GIS database.

Figure 2. Architectural diagram of the components of Version 3 of the GSToRE platform. This GSToRE version is the foundation of the Virtual Watershed Platform (VWP) described in this paper. In this release of the GSToRE platform the separate free-standing CUAHSI and GeoNetwork components of the initial GSToRE release (illustrated in Figure 1 above) had been replaced with a tiered architecture that includes a set of core database components and associated file-system storage elements in a base data management tier; a set of python scripts that provide a unified application programming interface (API) in a services tier; and a diverse set of client applications that interact with those services within the client tier.
This reconfiguration allowed the GSToRE system to achieve a significant benchmark in September of 201432 in which it hosted over 290,000 individually discoverable and accessible datasets comprising over 1.13 billion individually accessible data points. These data represented ~13 TB of data stored on disk and provide the capability to download over 1.63 million data products based on the multiple file formats that the platform provides for each dataset.
Version 3 of the GSToRE platform provided the starting point for the enhancements made to the system to support the model integration requirements reported here.
Four physically based, parameter distributed hydrologic and hydraulic models were selected to develop the module components of the VWP. They are Image SNOwcover and mass BALance (ISNOBAL), Precipitation-Runoff Modeling System (PRMS), D-Flow Flexible Mesh (DFLOW FM), and CaSiMiR-Vegetation. While each model shares the general trait of being spatially distributed, each model focuses on a unique aspect of the hydrological cycle.
The ISNOBAL model is used to predict seasonal snowmelt under varied meteorologic conditions (Marks and Dozier, 1992). When the WC-WAVE project started, a full ISNOBAL model of a small catchment in the Dry Creek Basin had already been developed (Kormos et al., 2014). ISNOBAL was designed to model the snow energy balance, accumulation, and melt of snowpacks and was developed as a module in the image processing workbench written in C (Marks et al., 1992, 1999). The ISNOBAL software was built following Anderson (Anderson, 1976) and simulates snow energy balance in multiple layers. ISNOBAL takes distributed meteorologic data as inputs, including temperature, precipitation, wind speed, relative humidity, and solar radiation. When it runs, ISNOBAL generates ASCII file outputs for each time step that contain the spatially distributed snowmelt, snow density, and snow water equivalent for each grid cell.
The PRMS model is an integrated hydrological model, designed by the USGS to model runoff from precipitation and snow-melt events (Markstrom et al., 2015) and is widely used for hydrologic process research (Huntington and Niswonger, 2012). The PRMS model couples both land surface and subsurface processes on physical basis with water and energy balance. It simulates the water traveling path from the form of precipitation, through canopy interception, snow pack/melt, evapotranspiration, to infiltration, overflow runoff, and subsurface flow. The model takes both spatial and temporal feature parameters and meteorologic input to simulate mechanistic water flows. Originally written in FORTRAN, the PRMS's ASCII format and specific data structure are required in both input and output files for model development (e.g., model construction, parameterization, calibration and validation), modification (e.g., any change in the processes of model development), and implementation (e.g., evaluation and prediction).
The DFLOW flexible mesh (DFLOW FM) model is an open-source, two-dimensional hydrodynamics model used to model depth-averaged, open-channel hydraulic conditions (Kernkamp et al., 2011). It requires a topographically-based mesh's input and allows for the development of mesh with quadrilateral elements in a river channel and triangular elements in the floodplain. With spatially distributed inlet and outlet boundary conditions, and roughness parameters, they describe it as being “very suitable for supercritical flows, bores and dam breaks,” as well as flooding computation (Hasselaar et al., 2013). The DFLOW FM also has the capacity to be run as a parallelized model in a high performance computing environment, where users can specify the number of partitions of the mesh to execute for the simulation at the same time in a tightly coupled manner. This allows DFLOW FM to run at a much faster speed.
The CaSiMiR-Vegetation model is a dynamic riparian vegetation model that implements the rule-based logic in Benjankar et al. (2010, 2011). CaSiMiR-Vegetation was coded in Microsoft.Net using C# and is a proprietary software. The model requires a static input of spatially explicit vegetation communities which are defined in terms of type and age range. The evolution of the vegetation community is developed based on the functional relationships between physical processes, hydrologic condition, and vegetation communities. CaSiMiR-Vegetation has been shown to accurately predict the succession of riparian vegetation communities in a variety of different hydro-climatological conditions (García-Arias et al., 2013). Because of the proprietary nature of CaSiMiR-Vegetation, the WC-WAVE team built a simplified, open-source version of CaSiMiR-Vegetation in Python called RipCAS (Turner et al., 2016) to loosely couple with DFLOW-FM.
Hydrologic research is interdisciplinary (Lele and Norgaard, 2005) and requires the involvement of experts from the hydrological sciences, software engineering, and cyberinfrastructure (CI). To meet the project's objective to enable integration of creative observation and analytical strategies using advanced modeling approaches and CI in a virtual watershed platform (WesternTri-StateConsortium, 2017), working groups were formed that included a mixture of hydrological scientists, software engineers, and CI developers.
The following sections outline targeted tools and technologies developed to address key challenges faced in the initial development of the VWP. The tools developed were focused on specific pieces of the modeling process and were applied to individual case studies to illustrate the required exchange of ideas and expertise between the watershed researchers, software engineers, and CI developers.
Section 3.1 begins with a discussion of the model integration framework in both a standalone model scenario with iSNOBAL and PRMS used as examples and continues with integrated models on HPC platforms as a second scenario. In both cases data exchange with the data management platform is also addressed. Section 3.2 describes the Data Management Platform and the changes that were made to GSToRE along with the data/model adapters that were created to transform data from NetCDF to the input files needed by the various models.
Section 3.3 describes the Data Visualization and Analysis provided by the platform and describes the web-based tools as well as the immersive virtual reality (VR) tools built for this platform.
The Modeling block of Figure 3 has several sub-blocks inside of it. The most commonly used ones are the stand alone models with HTTP Interfaces [referred to by (c) in the figure]. These models are covered in section 3.1.1. In that section the models that were used in this project are covered along with another tool to assist in the data input file creation [referred to by (d) in the figure]. These also had a web-based user interface built for them described below.
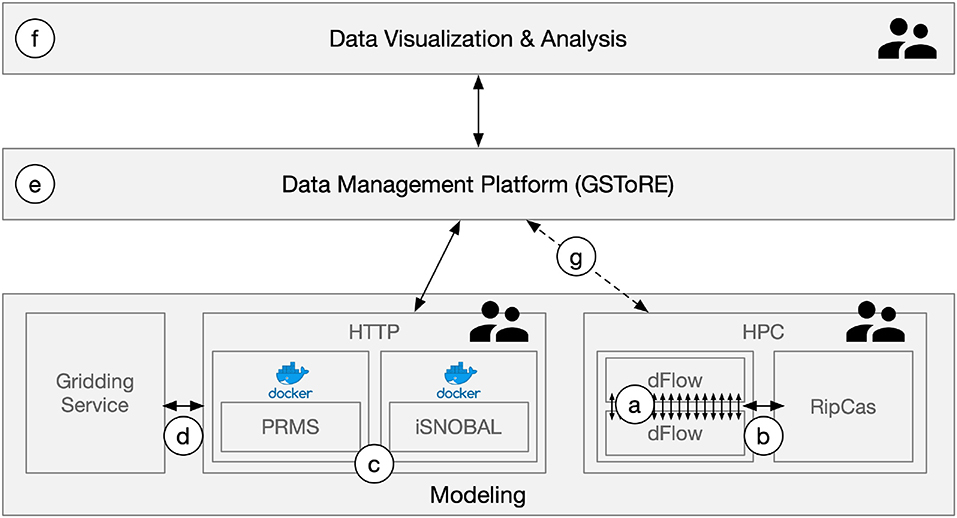
Figure 3. Virtual Watershed Platform (VWP) conceptual diagram illustrates the connectivity between key components described in the paper. These components include multiple modeling elements including (a) tightly integrated DFLOW model instances that pass results for each time step from one instance to the next, (b) a loosely coupled integration between the DFLOW modeling system and the RipCas model. Both the DFLOW and RipCas models operate within a high-performance computing (HPC) environment. The PRMS and iSNOBAL models represented by (c) are each encapsulated within Docker containers which in turn are coordinated through model configuration settings defined in a user-facing HTTP (web) interface. This web interface also provides connectivity (d) to a separate gridding service that generates gridded meteorological parameters based upon point-time-series data from multiple observation stations. The iSNOBAL and PRMS models within the HTTP interface connect to the GSToRE Data management platform (e) through the GSToRE REST application programming interface (API) for access to and storage of model initialization parameters and model outputs, respectively. While initial development work was completed, routine data exchange (g) between the HPC and GSToRE was not initiated. The developed data visualization and analysis component (f) connects to GSToRE through its REST API to access model-related and base map data for 2D and 3D data exploration and visualization. The user icons attached to the HPC, HTTP, and data visualization components indicate points in the system where there is direct user interaction with the system as a whole.
The second sub-block is labeled HPC. This sub-block is described in section 3.1.2. In this section the two models (DFLOW and RipCas) are described and how they were integrated both in a parallel implementation of DFLOW [referred to by (a) in the figure] as well as the integration with RipCas [referred to by (b) in the figure].
The model usage in our platform is not just another integration strategy but are really integration enablers. The fact that the gridding service allows us to take real time data from weather sites and create inputs for iSNOBAL and PRMS and attempt to conduct a range of hydrologic experiments on various processes, using different models to represent different processes, in the same basin is something that has not been easy in the past.
The system components written in Python language are following PEP 8 coding convention, which describes coding style and layout. RESTful APIs developed for component C in Figure 3 can be separated into two groups: called by a user and called by a system component. If a RESTful API is usually used by a user, such as login, the API will be designed as domain_name/function_description. If a RESTful API is often requested by a system component, such as starting a new docker worker to execute model, the API will follow this format domain_name/api/job_description.
To simplify the complex hydrologic simulation process and improve operational efficiency, HTTP interfaces are created in the VWP. The HTTP interfaces are created to support hydrologic models and facilitate a model integration with the VWP. To achieve this goal, we have implemented HTTP interfaces for hydrological modelers and developed a data visualization and analysis web application (introduced in section 3.3) to demonstrate the concept. For now, PRMS and ISNOBAL are supported. If a modeler follows the configuration file format and have an executable model program, a hydrologic model can be integrated into the VWP and the corresponding HTTP interfaces will be functional. Advanced technologies, such as docker containers, are used in the PRMS and iSNOBAL modeling component. This component handles the external programming and manual operations of pre-processing, post-processing, model modification, and data transfer to/from the data management platform which substantially improves simulation efficiency through streamlining model development, execution, and analyses.
To facilitate the model management and usage, containerization techniques using Docker are used in the system to wrap all required libraries and model execution files in an isolated capsule. Docker allows each system component to execute in a virtual environment (container) and each system component communicates with others through RESTful APIs (Fielding, 2000). Docker is similar to Virtual Machines through the provision of a linux-based execution environment, but requires fewer resources and is faster when starting up a new model execution container. This speed and resource reduction is because a Virtual Machine is executed with a full operating system and a docker container is executed with a shared lightweight docker engine in combination with a very lightweight OS layer on top of the engine. The Docker container approach removes the burden of model management by providing scientists with a consistent implementation of the contained model scenarios (Merkel, 2014).
The PRMS and iSNOBAL modeling component consists of two sub-components: Data Converter and Model Execution. The Data Converter converts data into different formats required by various models and repositories. The Model Execution sub-component handles model run requests.
A complicating factor of implementing this tool is that the PRMS model requires custom data formats and it was decided that the VWP would adopt an internal NetCDF storage model from which model specific representations could be extracted. To address this, a data format conversion component was implemented within the model component. This component converts data formats through RESTful APIs. NetCDF is widely used in climate data research, is machine-independent, and self-describing (Open Geospatial Consortium, 2014). This file format is not supported by all software and tools. Accordingly, the VWP possesses a data converter that writes data into a text format. It can translate a NetCDF file to a text file and vice-versa. The paper by Palathingal et al. explains this conversion process in more detail (Palathingal et al., 2016).
The Model Execution sub-component offers default input files for PRMS and iSNOBAL models. Each model run is independent and executes in parallel using Docker Workers. The number of Docker Workers can be predefined or automatically updated based upon user needs. More details on the scalability framework design and validation are introduced in our previous papers (Hossain et al., 2017; Wu et al., 2018). Scientists can also inspect and download previous model runs (input and output files) that are discoverable through the VWP interface.
The Data Converter and Model Execution components are wrapped within Docker containers. All PRMS and iSNOBAL modeling component containers can be updated and reused. New system modules can be added and integrated if the PRMS and iSNOBAL modeling component interface format is followed (i.e., using RESTful requests). This structure allows for extension of the VWP to new hydrologic models. More details about how to extend the VWP with a new model are introduced in Hossain et al. (2017).
Behind the PRMS and iSNOBAL modeling components are RESTful APIs (Fielding, 2000) with which the models can be easily accessed, modified, visualized, analyzed, and managed. This approach is beneficial not only for the model development process, but also for exploring scenarios with multiple model implementations, such as using a scenario-based approach (Menzel and Bürger, 2002; Bossa et al., 2014) to answer the question, “How do model outputs, like streamflow, change if the model inputs, like precipitation, change in response to human activities or climate change?” (Adams, 2009; Hofgaard et al., 2009).
Individual hydrologic models tend to be designed to model one hydrologic flux well. To extend understanding of hydrologic processes then, it makes sense that the interaction between two models, that specialize in producing reasonable estimates of distinct fluxes, may benefit the hydrologic sciences by providing greater insight into the interactions between the two fluxes. In many instances a single model can require enough computational resources that the model is ran in an HPC environment. In addition, HPC environments can be leveraged to make computations more efficient by splitting the spatial and/or temporal domain of a model. One of the goals of the WC-WAVE was to incorporate a generalized framework for addressing the modeling coupling process into the VWP. As it stands, the model coupling team developed a general framework for addressing the model coupling process in a standalone HPC environment.
The model coupling team focused on addressing the potential pitfalls associated with coupling two spatiotemporally distributed models. Two hypothetically selected models would be required to share partial spatial and temporal domains and must have some data dependence resulting from individual model simulation output. Given the vast number of hydrologic models and developers, very few models have the same input and output data structure. The workflow was developed to handle data transfer, data integration, and data management.
Each model required a wrapper and configuration file for set-up and file processing. The configuration file defines inputs for each model (assuming the modeling domain, input, and parameter files are provided), and the number of cycles of model simulation that are intended to occur as part of the experiment. Data handling is done through conversion of model output to NetCDF format data libraries which are then used to produce the data input to the next model run. In the instance that the model domain structures are different, interpolation tools have been implemented to estimate input data at specified points or grid cells. Special consideration needs to also be given to the alignment of temporal data and how one might go about limiting input of data from one model to the next assuming a large timestep in one model consists of a number of timesteps in the other. The modeler needs to understand whether the final timestep from a nested set of timesteps is sufficient to drive the next model or whether an algorithm needs to be implemented to determine a reasonable input for a variable.
The conceptual workflow described above was implemented by the model coupling team and was applied to the coupling of DFLOW FM and RipCAS to produce CoRD (Coupled RipCAS-DFLOW) (Turner et al., 2016). Model coupling, both tight and loose coupling, were originally planned to be carried out using the CSDMS modeling framework. However, due to issues of operating system and interface incompatibility the decision was made to use a different method. Challenges with CSDMS are discussed in section 5.2. To circumvent these challenges, the WC-WAVE model coupling team decided to proceed through the coupling process by leveraging the University of New Mexico's Center for Advanced Computing Research HPC resources, building a workflow and necessary architecture for coupled and spatially distributed hydrodynamic model simulations in the Python language.
The CoRD infrastructure has automated a number of steps required for set-up and post-processing of parallelized DFLOW FM runs as seen in Figure 4. We developed a wrapper with a configuration file that allowed us to define the number of iterations of the CoRD cycle and it also handled the data conversion between each module at each loosely coupled time step. For instance, a Manning's n value was derived for each grid cell vegetation type in RipCAS, and it was also necessary to convert RipCAS .asc files to NetCDF formatted files that were compatible with DFLOW FM. CoRD automates the directory set-up for each scenario, modifies input files as needed, adjusts boundary conditions for each discharge scenario, handles file conversion between DFLOW and RipCAS, and simplifies results by outputting only results from the last time step in DFLOW and RipCAS. This architecture allows modelers more time to focus on scientific questions, model development, and production of high quality science.
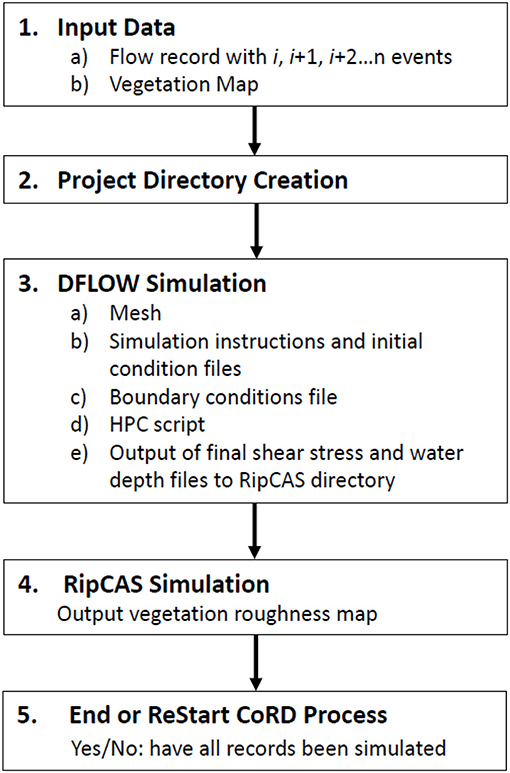
Figure 4. CoRD workflow diagram: when the inputs are ready and DFLOW is setup, CoRD keeps recording each flow record until all records are simulated.
Due to the computing requirements of DFLOW FM, the model was partitioned and simulations required tight coupling in a HPC environment. RipCAS and DFLOW FM were loosely coupled, having annual time steps and time steps that run under 1 min over a period of days, respectively. While RipCAS only requires one time step for simulation, it is not uncommon for DFLOW FM to produce hundreds or thousands of results that can be output at the users request. Results from DFLOW FM were only taken from the final time step and sub-domains of the mesh were stitched together before being converted to input for RipCAS.
Before initialization of a new coupled model simulation, users are required to develop the mesh for DFLOW FM and setup necessary boundary conditions in text files formatted to DFLOW FM standards. The automation of establishing initial boundary conditions, while possible, was not considered in this project. Watershed models can generally be developed through use of time series and spatial information input to a modeling framework (i.e., Zhu et al., 2019). However, the authors are not aware of any mesh development tools for 2D and 3D hydrodynamics models available through an open source integrated modeling framework. RipCAS only requires field-based identification of vegetation type in a gridded format and a library of Manning's n values associated with each vegetation type.
A significant challenge for gridded models (like ISNOBAL) is the creation of the input datasets for the model. In Kormos et al. (2014), input datasets were created by hand and took a long time to create and validate. Some elements can be interpolated, while others need different physics-based computations to calculate required inputs at each grid point.
To address this challenge, we created climate station interpolation tools (Delparte, 2019). These Python scripts were created to provide watershed scientists with an advanced set of tools to interpolate point-scale meteorologic station data into spatially-distributed gridded datasets. These interpolation models, listed in Table 1, take advantage of services, such as the Open Geospatial Consortium's (OGC) web processing services (WPS) and ESRI's geoprocessing services. Both services can be implemented in a desktop-based geographic information system (GIS) environment, or accessed through simple web interfaces and RESTful uniform resource locators (URLs), allowing for widespread accessibility.
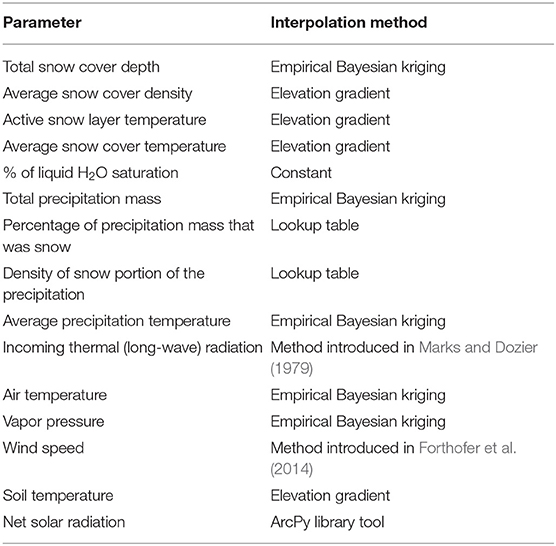
Table 1. Climate interpolation tools scripted using Python.
Automating part of the input data creation process simplifies the process of running ISNOBAL and other distributed hydrological models, such as PRMS (Leavesley et al., 1983) or HydroGeoSphere (Therrien et al., 2010).
At the Reynolds Creek watershed in southwest Idaho, the USDA Agricultural Research Service operates an experimental watershed and has collected data since 1962 from over 30 stations of varying operation, duration, and types. The concentration of recording stations in the Reynolds Creek watershed has made it ideal for evaluating the climate station interpolation tools. Cross validation of spatially distributed air temperature using this tool (see Figure 5), shows that the empirical Bayesian kriging interpolation method implemented in the interpolation toolkit provides accurate results for climate parameters for the Reynolds Creek South sub-watershed.
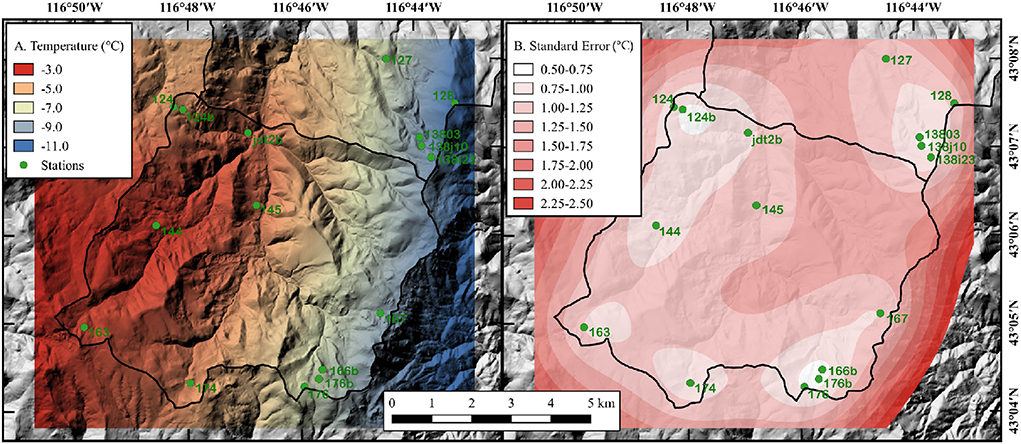
Figure 5. Reynolds Creek South sub-watershed on January 1, 2008 at 12:00–13:00 (A) air temperature EBK interpolated surface from 21 weather stations. (B) Standard error for the same time period and stations.
The enhancements to the data management platform33 in support of the developed model-visualization-data integration system are based upon the base GSToRE platform described in section 2.1 above. These enhancements were developed to meet three specific needs: (1) required support for encapsulated, self-documenting, array-based data formats for data exchange and storage within the data management system, (2) enhanced authentication capabilities that enable read/write access to the data management system through public-facing HTTP service calls, and (3) resilient data transfer support for large file transfers over HTTP connections. These specific development activities were embedded in the broader development effort to specifically expand the capabilities of the base GSToRE platform to better support model-related data content within the data management platform. The specific dataset-related capabilities within the VWP by the end of the project include (from the “Datasets” section of the VWP documentation34):
• Service description: Retrieve the dataset service description. This contains information regarding the type of dataset, the services available, and the download options (available in GSToRE V3).
• Dataset streaming: Stream text-based tabular or vector datasets (available in GSToRE V3).
• Download dataset: Download a specified dataset in a requested format (available in GSToRE V3).
• Dataset documentation: GSToRE includes support for FGDC-STD-001-1998 (file or vector) or FGDC-STD-012-2002 (raster), ISO-19115:2003, ISO-19119, and ISO-19110 standards. ISO-19119 is only available for those datasets with web services; ISO-19110 only for vector or tabular datasets. The dataset service description provides the complete listing of metadata options for a dataset (available in GSToRE V3).
• Previews: Deprecated—delivery of a simple HTML data preview client for a specific dataset. Available OGC services are recommended as an alternative to this capability.
• Dataset attributes: Retrieve the attribute definitions for vector or tabular data in the platform.
• Dataset upload: Allows uploading of model data to the Virtual Watershed file system.
• Data upload (Swift): Allows uploading of model data to the Virtual Watershed file system using swift client intermediary. See below for a more detailed description of the developed resilient data transfer based on Swift.
• Dataset information upload: Uploads Javascript Object Notation (JSON) formatted information about data that has been inserted in to the database.
• Update dataset information: Update previously uploaded dataset information.
• Attribute information upload: Upload attribute information for existing vector data within the system. This information supports the generation of ISO-19110 Feature Catalog documentation.
• Geometry information upload: Upload geometry and feature ID information for integration into an existing vector dataset in the VWP.
• Feature information upload: Uploads attribute feature information about an existing vector dataset. This information supports the generation of ISO-19110 Feature Catalog documentation.
• Create new model run: Creates a database record of the new model run and associated unique identifier with which uploaded data files must be associated.
• Verify existing model run: Verifies if a model run identifier (UUID) already exists.
While a running instance of the VWP data management platform is no longer available for public testing, the current version of the New Mexico Resource Geographic Information System's data discovery and access site35 is based upon a parallel version of the GSToRE platform, and many of the data discovery and access functions of the data management platform can be tested following the sample code in the GSToRE V3 online documentation36.
The Network Common Data Form (NetCDF37) format was adopted for the project as the shared data exchange and storage format for model-related data collections and associated structural metadata. This choice allowed for the encapsulation of all of the data related to a specific model instance (initialization, boundary conditions, run parameters) into a single package with associated metadata that document the content of the file package. As NetCDF is a file format broadly used in the environmental modeling community and has software libraries in a variety of programming languages it is a logical choice for maximum interoperability with both the specific models integrated in this project and future models that adopt a similar strategy. The implementation of NetCDF support in the data management system also extended the options for storing data that are provided full support by the data access and transform services provided by the platform. When completed, the implemented NetDCF support within the platform enabled the delivery of OGC Web Map and Web Coverage services based upon the content of the NetCDF files stored within the data management system's file system. These services were then available, along with access to the full NetCDF files, for use by the data visualization and analysis system and modeling tools.
The implementation of write access to the data management system from remote clients through the platform's web services required the development of an authentication capability in the system that had not previously been required. The authentication API was developed as part of the Swift data upload system (described below) and involves the secure provision of username and password credentials and the return of an authorization token that may then be used for subsequent data uploads to the system. The authentication process and sample python code for submission of authentication information and subsequent upload of data using the provided token is provided in the Swift Authentication Token section of the Virtual Watershed Platform documentation38. With this authentication model in place remote data and metadata upload services were publicly published, allowing for secure transmission of data and associated standards-based (i.e., FGDC and ISO 19115) metadata files. The upload process, including sample code and a sample FGDC metadata file template is documented in the Datasets Upload section of the Virtual Watershed Platform documentation39.
During development and testing of the interaction between the project's modeling systems and the data management platform limitations in the use of a standard HTTP file transfer model proved unstable for large files (e.g., over 2 GB in some cases). This instability was intermittent, but of sufficient frequency that a strategy to mitigate it was required. The OpenStack Swift40 object storage system was implemented to provide the robust file upload capabilities required by the project. Swift provides large object support41 that provides for segmentation of large files into smaller pieces that can then be uploaded sequentially or in parallel, and methods for ensuring that the individual segments will be resent if transfer is unsuccessful. Documentation and sample python code for the Swift large file upload support in the Virtual Watershed Platform data management system is available in the published documentation42.
To facilitate model modification and execution, a web-based visualization and interaction tool has been implemented and introduced in this section. PRMS models are used as examples to explain functions and design ideas. A modeler is able to research different scenarios by modifying input files and comparing model simulation results.
It is straightforward to create a user-defined simulation scenario with our web data visualization and interaction application. A modeler needs only to select an existing model simulation or prepare his/her model scenario inputs. By modifying different parameters of the model inputs, a modeler can easily create different scenarios. For example, if a modeler would like to study the importance of vegetation in deserts, the modeler can change the vegetation types from “bare ground” to “grass” in different parts of the study area. After this step, a modeler can specify Hydrologic Response Units (HRUs) of the study area which could be changed. Using this configuration information, the PRMS Scenario tool understands what to modify and where to modify it.
Two different methods of selecting HRUs are available in the system: parameter and manual selection. Parameter selection allows for HRUs to be selected based on parameter values. Manual selection allows for HRUs to be selected manually from a 2D grid map. Using either method, the HRUs can be modified and subsequently used to re-run PRMS scenarios. Figure 6 shows a screenshot of the model modification component of the data visualization and interaction tool. On this screen parameter selection or manual selection can be toggled with menu buttons on the left.
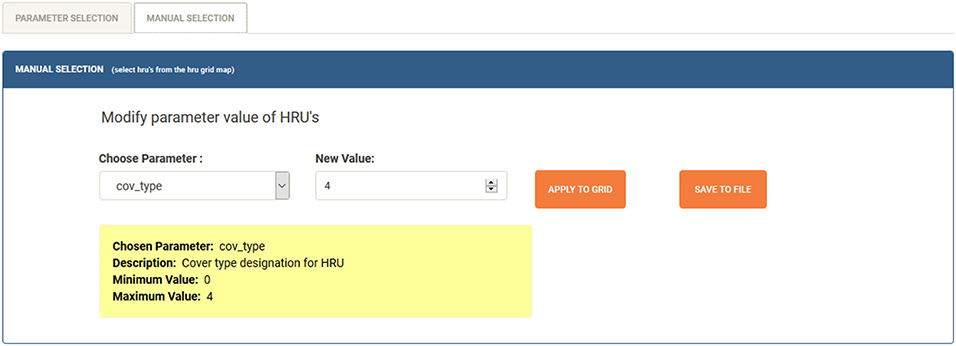
Figure 6. Screenshot of the model modification component for PRMS scenario creation.
The primary and most fundamental means of user interaction in the system is called manual selection. With this method, using a drag and drop operation, a user is able to select HRU cells directly on the 2D grid map. When a user wishes to select a single HRU, they need only to place the mouse cursor over their desired HRU cell and perform a left click. When selecting multiple HRUs at once, a user must left click on the HRU cell, drag along the desired direction, and then release the mouse button. HRU's selected in this fashion will be then highlighted with a clear yellow color. By clicking the “Apply to Grid” button, the HRU grid map will update values across all selected grid cells, showing new value for selected HRUs. By selecting “Save to File” current parameter values loaded in HRUs will be saved to the model input file from which this visualization is derived. Figure 7 shows an example of UI-based model modification with our manual selection interface. Specifically, in this example the user changes the vegetation type of selected HRUs between shrubs (Type 2), grass (Type 1), and trees (Type 3). Model modification via our dedicated component in the web application is intuitive and easy to use. This component allows for the modification of many different model parameters at the same time and mitigates unnecessary model re-runs. Our model modifier also gives clear feedback to the user in the form of alerts when modifying parameters. When selecting a given parameter, an alert box is generated showing details of the chosen parameter. The displayed details include the name, description, and minimum/maximum thresholds for the parameter. This alert mechanism warns the user when they input an incorrect value for the parameter. This feedback saves time of researchers performing scenario-based studies, by notifying them of possible problem with their model before a extraneous run occurs.
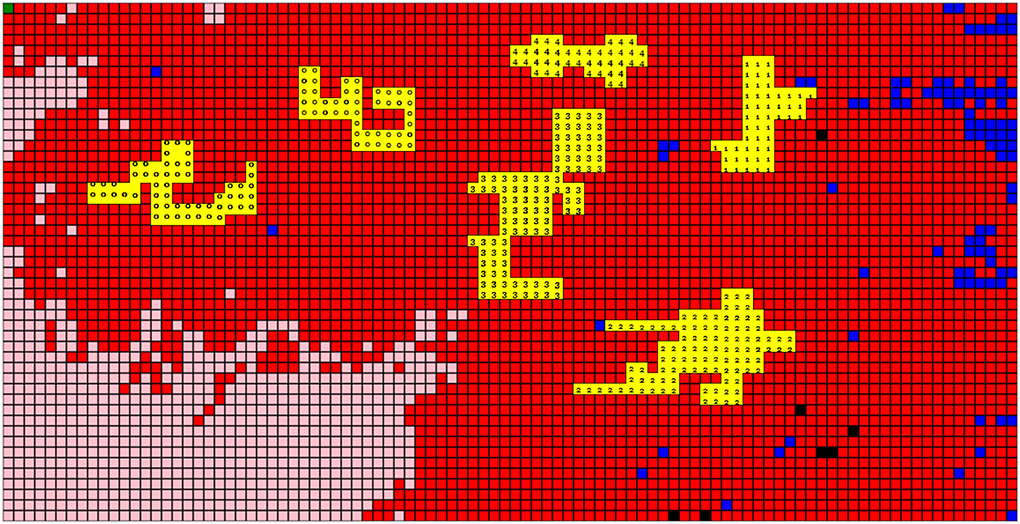
Figure 7. Model modification using manual selection. The vegetation type of various HRUs have been modified to bare soil (0), shrubs (2), grasses (1), trees (3), and coniferous (4).
Parameter selection allows the user to pick specific HRUs based on a set parameter constraint. For example, Figure 8 demonstrates the scenario where an user wants to change the vegetation type of cells with grass (Type 1) to trees (Type 3) for HRUs at an elevation between 2,000 and 4,000. In this example the “cov_type” is the vegetation type and “hru_elev” is the elevation. The user can add or remove multiple parameters by pressing the “Add” button or “remove” button to fine-tune the selection of HRU's even further. The user can select conditions for checking if a value greater, less than, or between two values. The “Submit” button enables the system to filter out HRUs that satisfy all parameter constraints and update those HRUs with the new given value.
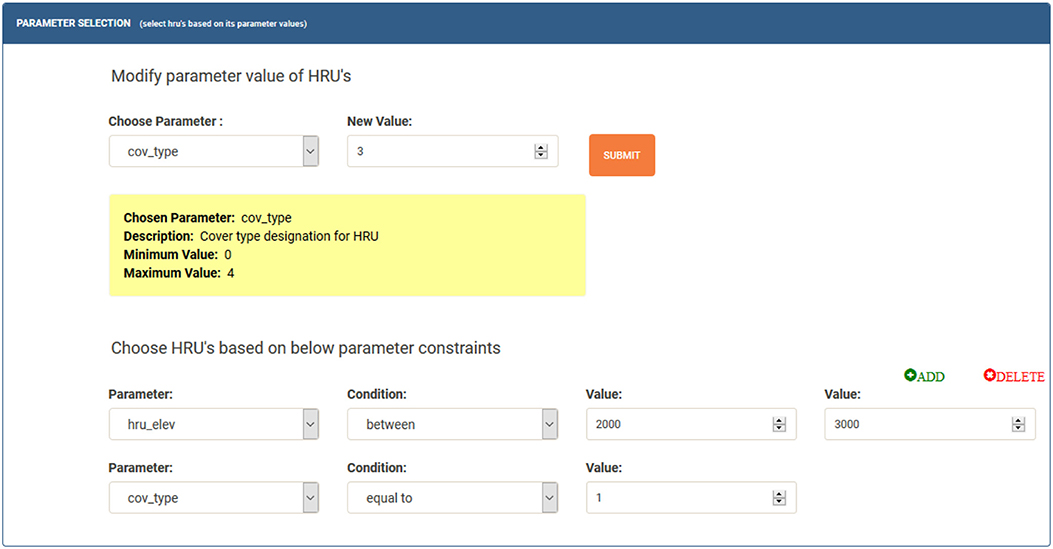
Figure 8. Model modification using parameter selection of the HRUs.
Modifications made to the model are visualized in real time on a 2D grid mapping all HRUs. The values of parameters are reflected on the map with different color intensities. High parameter values are rendered with darker colors, while low values are displayed with lighter hues. After parameter modifications are made, the HRU grid is applied to a Google map. This overlay of HRU grid on a geographic map provides users with contextual geospatial information that can be used to verify data. The user can toggle the map overlay and adjust transparency values by clicking the respective buttons in the sidebar. Figure 9 shows the HRU grid mapped to a real geographic area.
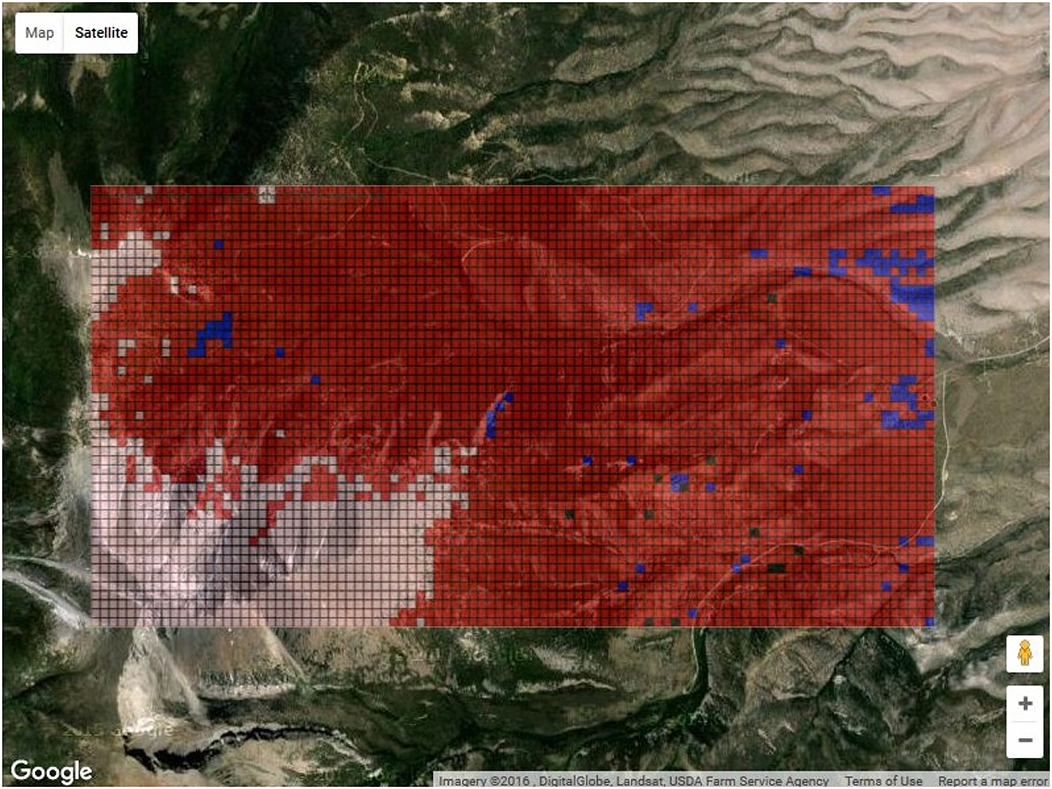
Figure 9. HRU grid Google overlay.
In addition to the 2D visualization in a web application, we have also implemented a Unity 3D43 watershed visualization tool (Carthen et al., 2015; Carthen et al., 2016). The main goal is to observe and analyze geospatial datasets and theoretical model data acquired from GSToRE. This client utilized a Model View Controller (MVC) architectural pattern for the user interface. The Model component receives OGC services data (terrain, rivers, streams, roads, imagery, etc.) which are then parsed by GDAL44 to make them usable by the visualization application. Besides the data interaction and visualization methods, our 3D Unity application can create terrain and render data in a realistic 3D environment, which is necessary for geospatial data, such as elevation. Figure 10 is an example displaying choropleths (thematic maps) in a 3D environment based on Dry Creek data. Terrain topology and vegetation data are also displayed. Besides a normal 3D mode, the application also has a VR mode, which supports HTC Vive45 VR devices. A user can walk or teleport in the virtual 3D study area and interact with the environment, such as checking data.
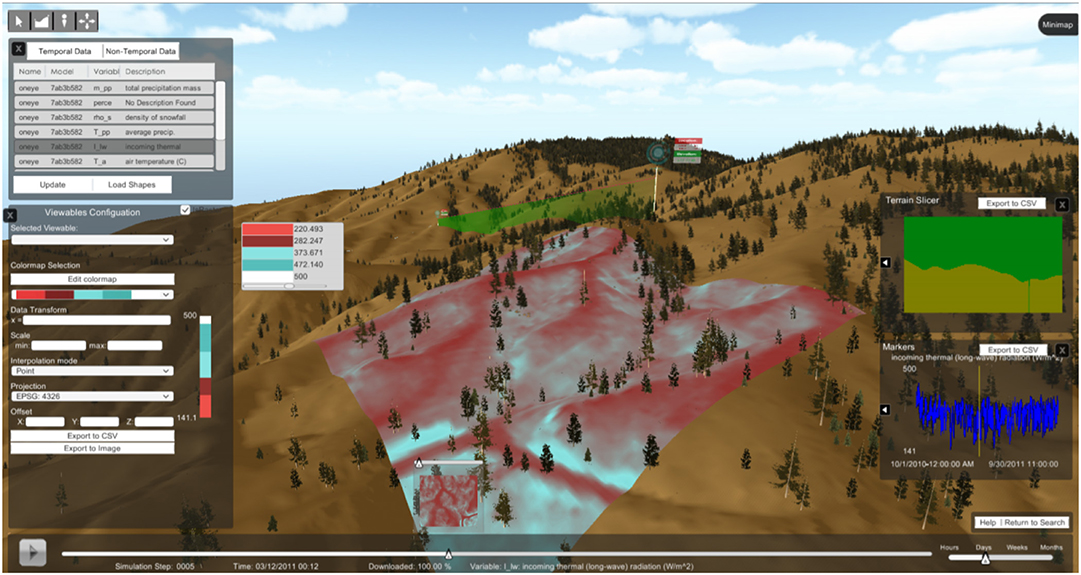
Figure 10. Dry creek sub-catchment with choropleth in 3D.
To illustrate how the components of our proposed platform work together, the following discussion provides an example of vegetation change effects on hydrologic processes modeled within the VWP-enabled system. A pre-developed PRMS executable is installed as a Docker container in the VWP as shown in component C of Figure 3. A user loads PRMS input files, namely, the parameter file, data file, and control file. The data converter introduced in section 3.1.1 extracts information from the input files and stores the PRMS model inputs within a NetCDF file, which is a machine-independent and self-describing file format. This NetCDF file, with associated metadata and model run information, is transferred to the Data Management Platform (component E of Figure 3) through a series of RESTful API calls employing a combination of JSON and XML data packages that (1) create a new model in the data management system to which all subsequent data uploads are linked, (2) upload data files that are linked to an existing model ID, (3) upload JSON and structured FGDC metadata for those data files, (4) upload additional structured metadata as JSON to support dataset specific attributes to enable support for multiple ISO and other documentation standards. The user can modify model input, both time-serious meteorologic variables and spatial-distributed hydrology-related parameters, such as vegetation types, vegetation cover density, and canopy interception storage capacity, through the PRMS web interface and evaluate the hydrologic responses by rerunning the model.
Screenshots of the user interface from the vegetation modification example are provided in Figures 6, 7. To perform the elevation-based vegetation change, a user can choose the parameter of vegetation type to be displayed on the gridded map, select an elevation range (in example, 1,000 and 1,200 m), and change the vegetation type to “bare soil” by inputting the 0 in the “change into” box, where the vegetation type “0” is defined as “bare soil” in PRMS model (this is shown in Figure 8). Similarly, parameters that are associated with vegetation cover (vegetation properties) are updated to reflect user modifications. By conditionally choosing the region elevated between 1,000 and 1,200 m, a user can change all vegetation-related parameters by selecting the parameters of interest, such as the vegetation cover density, and replace them with a value of 0, indicating no canopy existing in the selected region. The values of 0–4, represent the different vegetation types, are read from the input files of the pre-developed PRMS model and are discussed in the caption of Figure 7.
The results of this second model run can also be transferred to the data management system (through the same series of API interaction steps outlined above) for storage, discovery, and sharing with other models, analysis, and visualization tools.
An interactive data visualization interface is available, shown in components C and F of Figure 3, for a user to visualize and input parameters in a 2D and 3D visualization environments. Figure 9 is a screenshot of the vegetation parameter visualization overlain on a Google Map (Hossain et al., 2017), provided within the PRMS web interface. Figure 10 illustrates the visualization of model parameters combined with additional topographical data within the 3D Unity visualization environment. The data visualized in the 3D environment are accessed from the data management platform through the published OGC Web Map, Web Feature, and Web Coverage services published by the system for data held in the platform. A user can modify model spatially distributed parameters using 2D interfaces as shown in Figures 7, 8. Similar input parameter modification features will be implemented for 3D virtual environments in the future.
After the model parameters are modified based on specific research requirements, a user can execute the PRMS model and visualize simulation outputs using multiple visualization methods. Multiple PRMS simulations can be executed in parallel using the VWP to compare different scenarios and corresponding outputs. Such scenario-base simulation allows users to compare hydrologic responses with what-if questions performed on meteorologic forces or land cover/land use variations. Each model simulation run is executed in an isolated Docker container as introduced in section 3.1.1 and the output is stored in the Data Management Platform for later discovery, access and use in analysis, visualization and additional modeling systems.
Physical-based modeling is a preferable approach in the hydrology community because of its advancing capability of extrapolating to changing conditions (Sivapalan, 2003; Seibert and van Meerveld, 2016) and exploring mechanistic processes. Due to the complexity and heterogeneity inherent in the hydrologic cycle, the modeling of watershed processes has historically been characterized by a broad spectrum of disciplines including data management, visualization, statistical analyses. Today's modelers are daunted by the large volume of available data and rapidly advancing computer software and hardware technologies. Beyond solving water science questions, extra time and effort is required to process and integrate the modeling data, e.g., data structure documentation, format conversion, point-to-area interpolation, and comparative analysis across model runs. By providing seamless structured data communication and data visualization, the use of an integrated virtual modeling framework helps water modelers integrate modeling efforts, streamline data conversion and analysis, and ultimately focus more effort on answering scientific questions.
While cross-disciplinary research has been highlighted as critically important to promote better understanding and practice (Kelly et al., 2019), cross-disciplinary work is also emphasized in modeling realms where study boundaries, languages, techniques, and experience constrain the advancement of Earth science as an integrated system (Laniak et al., 2013). As mentioned in section 3.1.2, while the DFLOW and RipCAS models each have their own specific modeling realm of channel hydraulics and riparian evolution, the CoRD (the integrated form of these two models), allows direct data communication between two models, which lowers the disciplinary boundaries and barriers for high quality science.
While the use of the VWP does required researcher to have certain a level of knowledge regarding the individual models and associated data, it provides a consistent environment that synthesizes all of the model development efforts needed to conduct scenario-based modeling. Such cause-and-effect model simulation is a typical approach to understanding the influence of model components, which is a great help in modeling education. By lowering the technical requirements, students can have better access to hydrologic models and perform high quality water science, such as assessing the effects of external stresses, e.g., climate and land cover, on surface and groundwater interactions; exploring hydrologic mechanisms responsible for changes in groundwater levels, summer baseflows, spring flows, and soil moisture; and providing a unique opportunity to thoroughly explore complex interactions.
As originally envisioned, the WC-WAVE project was going to implement tightly-coupled model integration through the CSDMS platform when possible, and employ alternative coupling techniques when needed. The planned CSDMS model components would be linked within CSDMS to data access components also developed within CSDMS that would enable bi-directional data and metadata exchange with the planned data management platform and visualization tools. Ultimately, during the period of active model integration for the project, the use of CSDMS was not going to be feasible due to unmet CSDMS source code and operating system requirements for three of the models planned for use in the project: the proprietary CaSiMiR vegetation model (Benjankar et al., 2011) for which source code was not available and the required Windows operating system was not available within CSDMS; the proprietary HydroGeoSphere model (Therrien and Sudicky, 1996; Therrien et al., 2010) for which source code was not available; and the SRH-2D (Lai, 2008) two-dimensional (2D) hydraulic, sediment, temperature, and vegetation model for river systems for which source code could not be obtained. These limitations resulted in the alternative model integration approaches that are described in this paper. That having been said, the originally planned CSDMS integration strategy with the developed data management system remains a viable option as described below.
The model/data/visualization integration strategies developed, demonstrated, and described in this paper are more broadly generalizable in the following ways:
• The development of data connectivity and conversion components within the CSDMS using the Basic Model Interface (BMI)46 that support bi-directional communication with external GSToRE-based data management systems and the models registered with CSDMS that are either Web Modeling Tool47 or Python Modeling Tool48 enabled.
• The development of additional model-data adapters that support the bi-directional exchange with GSToRE-based data management systems.
• Containerization, with data adapters, of additional models that can then be exposed through the model configuration and control capabilities developed as part of the HTTP model interface.
• The visualization of diverse 2D and 3D spatial data beyond those generated by the models described here through integration and publication through the data management platform.
• The development of automated workflows within storage systems, such as iRODS that automate the exchange of model data and associated documentation with a shared data management system like that developed by the WC-WAVE project.
These are just some examples of the opportunities that are created when web-service based loosely-coupled data management and exchange capabilities like those implemented in the developed data management platform are combined with tightly- and loosely-coupled model integration tools and data visualization and analysis tools that are also enabled for data access through standards-based and custom web services.
The Software developed for the VWP is available through open source licenses. Most of it is under the MIT license49, some is under the BSD 3-clause license50 and some is under the Apache License Version 2.051. Documentation and source code can be found on the VWP code landing page https://virtualwatershed.github.io/vwp-project-info/. This page has detailed discussion about each module as well as links to the GitHub repositories for each component. The rest of this section itemizes the components and provides GitHub links, the programming language used as well as the license for that component.
As described in sections 2 and 3 and illustrated in Figure 3, GSToRE forms the basis for the data management platform for the VWP. This data management platform was developed to enable research data management, discovery, and access for both spatial and non-spatial data. It uses a service-oriented architecture that is based on a combination of multiple database platforms and a Python-based services.
• Project Link: http://doi.org/10.5281/zenodo.831213.
• Operating system: Linux.
• Programming language: Python integration and service code linking components in a variety of languages.
• License(s): Apache License Version 2.0.
• Documentation Location: The API documentation for the VWP is included in the above cited project link. It is accessible as a set of HTML documentation pages at: resources/docs/architecture.html within the referenced repository.
The VWP Web Tool has code for two components of Figure 3. The first is the user interface in the Modeling/HTTP box and the second is the Web-based visualization tool in the Data Visualization and Analysis Component. This code allows users to create model runs, generate scenarios, visualize model files, and share data via the GSToRE platform all via a web interface. The user-friendly interface enables a user to define and execute complicated modeling jobs by clicking buttons, a much easier procedure than the traditional workflow that an environmental scientist needs to manually execute to change model inputs. It is also able to visualize and compare results. Different hydrological models can be integrated into this tool. The execution part of Docker Worker can be updated and other system components can be reused.
• Project Link: http://doi.org/10.5281/zenodo.831226.
• Operating system: Ubuntu.
• Programming language: Python.
• License(s): MIT.
Once the Web interface was finished, users asked for a 3D high-resolution visualization of the watersheds and the output of the models. A Unity Visualization Tool was developed to visualize geographic data in a 3D world and display the model run data. A user can travel in the 3D world, access local and remote VWP data, and display results. In addition to the traditional visualization method, such as line chart and table, the tool can also render data on a 3D terrain and update data based on timestamp. This code fits under the Data Visualization and Analysis Component of Figure 3.
• Project Link: https://github.com/HPC-Vis/Virtual-Watershed-Client.
• Operating system: Windows, Unity.
• Programming language: C#.
• License(s): MIT.
The models in the VWP all accept data in a wide variety of formats. This significantly complicated the process of integrating different models and their associated data into their simulations. The team developed Model Data Adapters to automatically translate the date to and from our base data storage format (NetCDF).
We started with the adaptors for PRMS. For this model the adapters allow the creation and manipulation of PRMS (input, parameter, and output) files and for running PRMS itself. The adapters facilitate the use of NetCDF for PRMS, enabling anyone who knows how to use NetCDF to use PRMS. Without these adapters, one would have to learn the PRMS-specific file format, and convert their data to match that format. We also have adapters for other models including iSNOBAL, and hooks for other models, such as dFlow and RipCas.
• Project Link: https://doi.org/10.5281/zenodo.831222.
• Operating system: Ubuntu.
• Programming language: Python.
• License(s): MIT.
The Data converter tool was designed to convert between file formats. It was implemented as a web based application that calls the Model Data Adapters described previously. This tool is important because the NetCDF file format was adopted by the VWP as the data interchange format and is directly used in some models but some hydrologic models only accept and generate text files. This tool enables the data connection and transfer among different model components of the VWP, and it also provides a graphical user interface to assist with the conversion.
• Project Link: http://doi.org/10.5281/zenodo.831219.
• Operating system: Ubuntu.
• Programming language: Python.
• License(s): MIT.
The Coupled RipCAS-DFLOW model has two distinct contributions in one repository. First, we developed RipCAS, the Riparian Community Alteration and Succession model, in Python to model vegetation succession in a floodplain. While there was an existing Windows version of RipCAS, it was not available under an open source license, and did not have an API to complement its Windows interface. Second, we built infrastructure to couple RipCAS to DFLOW. This infrastructure includes data converters, a boundary-condition solver, and logic to automatically submit a new DFLOW job to the cluster for each year of the simulation (which may span many decades).
• Project Link: https://doi.org/10.5281/zenodo.831215
• Operating system: Linux.
• Programming language: Python.
• License(s): BSD-3-Clause.
The WC-WAVE Climate Station Interpolation Toolkit (CSIT) (Chapman et al., 2017) is a set of tools for creating spatially interpolated grid surfaces from climate station data by time-step. Included is a cross validation toolkit that produces several uncertainty surfaces for each interpolation time step and records the processing time required to calculate each grid surface.
• Project Link: http://geoviz.geology.isu.edu/delparte_labs/VWCSIT/.
• Operating system: Linux.
• Programming language: Python.
• License(s): MIT.
All datasets generated for this study are included in the article/supplementary material.
AG: played a critical role in the development of CoRD, and was the primary author of the journal article submission. CC: played a critical role in the development of PRMS modules in the VWP and contributed in the writing of this document. RW: contributed innumerable skills to the development of the visualization tools and wrote a significant amount of the submitted journal article. SM: played a role in the development of CoRD and review of this paper. SA: PRMS modeling, writing, and review. JA, SD, and DD: cyberinfrastructure development. HB and JS: cyberinfrastructure development and writing. KB: GStore, data management visionary, writing, and review. DC: CoRD development, writing, and review. LF: writing. SG and JM: iSNOBAL development, writing, and review. FH: cyberinfrastructure, writing, review, and led first three authors in process. LS: cyberinfrastructure development and review. MS: CoRD support and review. MT: CoRD python programming and review. ST was involved in the development of the manuscript and throughout the VWP project.
This material was based upon work supported by the National Science Foundation's Established Program to Stimulate Competitive Research (EPSCoR) under grant numbers IIA-1329469, IIA-1329513, IIA-1301346, 0814449, 0918635, and IIA-1329470. Additional support for the development of the GSToRE platform upon which the VWP is based has been provided by the New Mexico Resource Geographic Information System (NM RGIS—http://rgis.unm.edu) program and NASA's ACCESS program (award NNX12AF52A). Any opinions, findings, and conclusions or recommendations expressed in this material are those of the authors and do not necessarily reflect the views of the National Science Foundation, NM RGIS, or NASA.
The authors declare that the research was conducted in the absence of any commercial or financial relationships that could be construed as a potential conflict of interest.
1. ^NSF Award no. 1329470.
2. ^https://www.re3data.org/, based on a review of listed repositories on 2019-10-07.
4. ^https://www.w3.org/TR/rdf-sparql-query/
5. ^https://data.nasa.gov/browse
6. ^https://www.ncdc.noaa.gov/
7. ^https://data.usgs.gov/datacatalog/
8. ^https://catalog.data.gov/dataset
10. ^https://waterservices.usgs.gov/
14. ^https://www.nsf.gov/awardsearch/simpleSearchResult?queryText=0814449
15. ^https://www.nsf.gov/awardsearch/showAward?AWD_ID=1301346&HistoricalAwards=false
16. ^https://www.nsf.gov/awardsearch/showAward?AWD_ID=0918635&HistoricalAwards=false
17. ^https://www.nsf.gov/awardsearch/showAward?AWD_ID=1329470&HistoricalAwards=false
18. ^CUAHSI HIS—http://his.cuahsi.org/index.html
19. ^GeoNetwork Open Source—https://geonetwork-opensource.org
20. ^MapServer—https://mapserver.org
21. ^GeoServer—http://geoserver.org
22. ^http://www.iso.org/cms/render/live/en/sites/isoorg/contents/data/standard/05/37/53798.html
23. ^http://www.iso.org/cms/render/live/en/sites/isoorg/contents/data/standard/05/37/53798.html
24. ^https://www.dublincore.org/specifications/dublin-core/
25. ^http://portal.opengeospatial.org/files/?artifact_id=21743
26. ^https://www.opengeospatial.org
27. ^http://www.openarchives.org/OAI/openarchivesprotocol.html
29. ^https://www.dataone.org/developer-resources
30. ^https://catalog.data.gov/dataset
31. ^http://www.earthobservations.org/gci.php
32. ^https://www.idahoepscor.org/index.php/highlights/data-mgmt-platform-breaks-1-billion-observation-threshold-2014-wc-wave
33. ^https://virtualwatershed.github.io/vwp-gstore/gstore_v3/resources/docs/index.html
34. ^https://virtualwatershed.github.io/vwp-gstore/gstore_v3/resources/docs/stable/datasets.html
35. ^http://rgis.unm.edu/rgis6/
37. ^https://www.unidata.ucar.edu/software/netcdf/
38. ^https://virtualwatershed.github.io/vwp-gstore/gstore_v3/resources/docs/stable/services.html#gettoken
39. ^https://virtualwatershed.github.io/vwp-gstore/gstore_v3/resources/docs/stable/datasets.html#upload
40. ^https://wiki.openstack.org/wiki/Swift
41. ^https://docs.openstack.org/swift/latest/overview_large_objects.html
42. ^https://virtualwatershed.github.io/vwp-gstore/gstore_v3/resources/docs/stable/datasets.html#swiftupload
46. ^https://bmi-spec.readthedocs.io/en/latest/
47. ^https://csdms.colorado.edu/wmt/
48. ^https://csdms.colorado.edu/wiki/PyMT
49. ^https://opensource.org/licenses/MIT
Adams, J. (2009). Vegetation-Climate Interaction: How Plants Make the Global Environment. Chichester: Springer Science & Business Media.
Anderson, E. A. (1976). A Point Energy and Mass Balance Model of a Snow Cover. Technical Report NWS 19, Office of Hydrology, NOAA, Silver Spring, MD.
Belete, G. F., Voinov, A., and Laniak, G. F. (2017). An overview of the model integration process: from pre-integration assessment to testing. Environ. Modell. Softw. 87, 49–63. doi: 10.1016/j.envsoft.2016.10.013
Benjankar, R., Egger, G., Jorde, K., Goodwin, P., and Glenn, N. F. (2011). Dynamic floodplain vegetation model development for the kootenai river, usa. J. Environ. Manag. 92, 3058–3070. doi: 10.1016/j.jenvman.2011.07.017
Benjankar, R., Glenn, N. F., Egger, G., Jorde, K., and Goodwin, P. (2010). Comparison of field-observed and simulated map output from a dynamic floodplain vegetation model using remote sensing and gis techniques. GISci. Rem. Sens. 47, 480–497. doi: 10.2747/1548-1603.47.4.480
Bossa, A. Y., Diekkrüge, B., and Agbossou, E. K. (2014). Scenario-based impacts of land use and climate change on land and water degradation from the meso to regional scale. Water 6, 3152–3181. doi: 10.3390/w6103152
Buahin, C. A., and Horsburgh, J. S. (2018). Advancing the open modeling interface (OpenMI) for integrated water resources modeling. Environ. Modell. Softw. 108, 133–153. doi: 10.1016/j.envsoft.2018.07.015
Carthen, C., Rushton, T. J., Burfield, N. P., Johnson, C. M., Hesson, A., Nielson, D., et al. (2016). Virtual watershed visualization for the WC-WAVE project. Int. J. Comput. Appl. 23, 1–13.
Carthen, C. D., Rushton, T. J., Johnson, C. M., Hesson, A., Nielson, D., Worrell, B., et al. (2015). “Design of a virtual watershed client for the WC-WAVE project,” in 2015 International Conference on Collaboration Technologies and Systems (CTS) (Atlanta, GA), 90–96.
Chapman, T., Johansen, W. J., Delparte, D. M., and Turner, M. (2017). Delparte/WCWAVE: Climate Station Interpolation Toolkit. Pocatello, ID: Zenodo.
Chen, F., and Dudhia, J. (2000). Coupling an advanced land surface hydrology model with the penn state/ncar mm5 modeling system, part 1: model description and implementation. Mon. Weather Rev. 129, 57–604. doi: 10.1175/1520-0493(2001)129<0587:CAALSH>2.0.CO;2
de la Beaujardiere, J. (2006). OpenGIS Web Map Server Implementation Specification, Version 1.3.0, Volume OGC® 06-042. Wayland, MA: Open Geospatial Consortium.
Delparte, D. (2019). Delparte Labs—VWCSIT. Available online at: http://geoviz.geology.isu.edu/delparte_labs/VWCSIT/
Ebel, B. A., Mirus, B. B., Heppner, C. S., VanderKwaak, J. E., and Loague, K. (2009). First-order exchange coefficient coupling for simulating surface water—groundwater interactions: parameter sensitivity and consistency with a physics-based approach. Hydrol. Process. 23, 1949–1959. doi: 10.1002/hyp.7279
Ek, M. B., Mitchell, K. E., Lin, Y., Rogers, E., Grunmann, P., Koren, V., et al. (2003). Implementation of Noah land surface model advances in the national centers for environmental prediction operational mesoscale ETA model. J. Geophys. Res. 108:8851. doi: 10.1029/2002JD003296
Elshafei, Y., Coletti, J. Z., Sivapalan, M., and Hipsey, M. R. (2015). A model of the socio-hydrologic dynamics in a semiarid catchment: isolating feedbacks in the coupled human-hydrology system. Water Resour. Res. 51, 6442–6471. doi: 10.1002/2015WR017048
Felder, G., Zischg, A., and Weingartner, R. (2017). The effect of coupling hydrologic and hydrodynamic models on probable maximum flood estimation. J. Hydrol. 550, 157–165. doi: 10.1016/j.jhydrol.2017.04.052
Fielding, R. T. (2000). Architectural styles and the design of network-based software architectures (Ph.D. thesis), University of California, Irvine, Irvine, CA, United States.
Flowers, G. E., and Clarke, G. K. C. (2002). A multicomponent coupled model of glacier hydrology 1. Theory and synthetic examples. J. Geophys. Res. 107, ECV 9-1–ECV 9-17. doi: 10.1029/2001JB001122
Forthofer, J. M., Butler, B. W., and Wagenbrenner, N. S. (2014). A comparison of three approaches for simulating fine-scale surface winds in support of wildland fire management. Part I. Model formulation and comparison against measurements. Int. J. Wildl. Fire 23, 969–981. doi: 10.1071/WF12089
García-Arias, A., Francés, F., Ferreira, T., Egger, G., Martínez-Capel, F., Garófano-Gómez, V., et al. (2013). Implementing a dynamic riparian vegetation model in three European river systems. Ecohydrology 6, 635–651. doi: 10.1002/eco.1331
Gerten, D., Schaphoff, S., Haberlandt, U., Lucht, W., and Sitch, S. (2004). Terrestrial vegetation and water balance—hydrological evaluation of a dynamic global vegetation model. J. Hydrol. 286, 249–270. doi: 10.1016/j.jhydrol.2003.09.029
Hasselaar, R., de Boer, W., and Luijendijk, A. (2013). “Optimizing harbour maintenance strategies using Delft3D and D-flow flexible mesh,” in Coasts and Ports 2013: 21st Australasian Coastal and Ocean Engineering Conference and the 14th Australasian Port and Harbour Conference (Sydney, NSW: Engineers Australia), 364.
Hoffman, M., and Price, S. (2014). Feedbacks between coupled subglacial hydrology and glacier dynamics. JGR Earth Surf. 119, 414–436. doi: 10.1002/2013JF002943
Hofgaard, A., Dalen, L., and Hytteborn, H. (2009). Tree recruitment above the treeline and potential for climate-driven treeline change. J. Veg. Sci. 20, 1133–1144. doi: 10.1111/j.1654-1103.2009.01114.x
Horsburgh, J. S., Tarboton, D. G., Piasecki, M., Maidment, D. R., Zaslavsky, I., Valentine, D., et al. (2009). An integrated system for publishing environmental observations data. Environ. Modell. Softw. 24, 879–888. doi: 10.1016/j.envsoft.2009.01.002
Hossain, M. M., Wu, R., Painumkal, J. T., Kettouch, M., Luca, C., Dascalu, S. M., et al. (2017). “Web-service framework for environmental models,” in 2017 Internet Technologies and Applications (ITA) (Wrexham), 104–109.
Huntington, J. L., and Niswonger, R. G. (2012). Role of surface-water and groundwater interactions on projected summertime streamflow in snow dominated regions: an integrated modeling approach. Water Resour. Res. 48, 1–20. doi: 10.1029/2012WR012319
Kavvas, M. L., Kure, S., Chen, Z. Q., Ohara, N., and Jang, S. (2013). WEHY-HCM for modeling interactive atmospheric-hydrologic processes at watershed scale. I: model description. J. Hydrol. Eng. 18, 1262–1271. doi: 10.1061/(ASCE)HE.1943-5584.0000724
Kelly, R., Mackay, M., Nash, K. L., Cvitanovic, C., Allison, E. H., Armitage, D., et al. (2019). Ten tips for developing interdisciplinary socio-ecological researchers. Socio Ecol. Pract. Res. 1, 149–161. doi: 10.1007/s42532-019-00018-2
Kernkamp, H. W., Van Dam, A., Stelling, G. S., and de Goede, E. D. (2011). Efficient scheme for the shallow water equations on unstructured grids with application to the continental shelf. Ocean Dyn. 61, 1175–1188. doi: 10.1007/s10236-011-0423-6
Kollet, S. J., and Maxwell, R. M. (2006). Integrated surface—groundwater flow modeling: a free-surface overland flow boundary condition in a parallel groundwater flow model. Adv. Water Resour. 29, 945–958. doi: 10.1016/j.advwatres.2005.08.006
Kormos, P. R., Marks, D., McNamara, J. P., Marshall, H. P., Winstral, A., and Flores, A. N. (2014). Snow distribution, melt and surface water inputs to the soil in the mountain rain—snow transition zone. J. Hydrol. 519, 190–204. doi: 10.1016/j.jhydrol.2014.06.051
Lai, Y. G. (2008). Manual-SRSRH-2D Version 2: Theory and User's Manual. Sedimentation and River Hydraulics—Two-Dimensional River Flow Modeling. Denver, CO: U.S. Department of the Interior, Bureau of Reclamation, Technical Services Center.
Laniak, G. F., Olchin, G., Goodall, J., Voinov, A., Hill, M., Glynn, P., et al. (2013). Integrated environmental modeling: a vision and roadmap for the future. Themat. Issue Fut. Integr. Model. Sci. Technol. 39, 3–23. doi: 10.1016/j.envsoft.2012.09.006
Leavesley, G. H., Lichty, R., Thoutman, B., and Saindon, L. (1983). Precipitation-Runoff Modeling System: User's Manual. Washington, DC: USGS.
Lele, S., and Norgaard, R. B. (2005). Practicing interdisciplinarity. Bioscience 55, 967–975. doi: 10.1641/0006-3568(2005)055[0967:PI]2.0.CO;2
Li, Y., Zhou, Q., Zhou, J., Zhang, G., Chen, C., and Wang, J. (2014). Assimilating remote sensing information into a coupled hydrology-crop growth model to estimate regional maize yield in arid regions. Ecol. Modell. 291, 15–27. doi: 10.1016/j.ecolmodel.2014.07.013
Marks, D., Domingo, J., Susong, D., Link, T., and Garen, D. (1999). A spatially distributed energy balance snowmelt model for application in mountain basins. Hydrol. Process. 13, 1935–1959.
Marks, D., and Dozier, J. (1979). A clear-sky longwave radiation model for remote alpine areas. Theor. Appl. Climatol. 27, 159–187.
Marks, D., and Dozier, J. (1992). Climate and energy exchange at the snow surface in the Alpine region of the Sierra Nevada: 2. Snow cover energy balance. Water Resour. Res. 28, 3043–3054.
Marks, D., Dozier, J., and Davis, R. E. (1992). Climate and energy exchange at the snow surface in the Alpine region of the Sierra Nevada: 1. Meteorological measurements and monitoring. Water Resour. Res. 28, 3029–3042.
Markstrom, S. L., Regan, R. S., Hay, L. E., Viger, R. J., Webb, R. M., Payn, R. A., et al. (2015). PRMS-IV, The Precipitation-Runoff Modeling System, Version 4. Technical report, US Geological Survey. Available online at: https://pubs.usgs.gov/tm/6b7/
Maxwell, R. M., and Miller, N. L. (2003). “On the development of a coupled land surface and ground water model for use in watershed management,” in EGS—AGU—EUG Joint Assembly (Nice), 7830.
McNider, R., Handyside, C., Doty, K., Ellenburg, W., Cruise, J., Christy, J., et al. (2015). An integrated crop and hydrologic modeling system to estimate hydrologic impacts of crop irrigation demands. Environ. Modell. Softw. 72, 341–355. doi: 10.1016/j.envsoft.2014.10.009
Menzel, L., and Bürger, G. (2002). Climate change scenarios and runoff response in the mulde catchment (Southern Elbe, Germany). J. Hydrol. 267, 53–64. doi: 10.1016/S0022-1694(02)00139-7
Merkel, D. (2014). Docker: lightweight linux containers for consistent development and deployment. Linux J. 2014:2.
Moore, R. V., and Tindall, C. I. (2005). An overview of the open modelling interface and environment (the openmi). Environ. Sci. Policy 8, 279–286. doi: 10.1016/j.envsci.2005.03.009
National Research Council (2012). Challenges and Opportunities in the Hydrologic Sciences–Task Force on Grand Challenges. Technical report, The National Academies Press, Washington, DC.
Open Geospatial Consortium (2014). OGC Network Common Data Form (netCDF) Standards Suite. Available online at: https://www.opengeospatial.org/standards/netcdf (accessed September 25, 2019).
Palathingal, L., Wu, R., Belkhatir, R., Dascalu, S. M., and Harris, F. C. Jr. (2016). “Data processing toolset for the virtual watershed,” in 2016 International Conference on Collaboration Technologies and Systems (CTS) (Orlando, FL: IEEE), 281–287.
Panday, S., and Huyakorn, P. S. (2004). A fully coupled physically-based spatially-distributed model for evaluating surface/subsurface flow. Adv. Water Resour. 27, 361–382. doi: 10.1016/j.advwatres.2004.02.016
Peckham, S. D., Hutton, E. W., and Norris, B. (2013). A component-based approach to integrated modeling in the geosciences: the design of CSDMS. Comput. Geosci. 53, 3–12. doi: 10.1016/j.cageo.2012.04.002
Regan, R., Juracek, K., Hay, L., Markstrom, S., Viger, R., Driscoll, J., et al. (2019). The U.S. Geological Survey National Hydrologic Model infrastructure: rationale, description, and application of a watershed-scale model for the conterminous United States. Environ. Modell. Softw. 111, 192–203. doi: 10.1016/j.envsoft.2018.09.023
Running, S. W. (2006). Is global warming causing more, larger wildfires? Science 313:927. doi: 10.1126/science.1130370
Seibert, J., and van Meerveld, H. (2016). Hydrological change modeling: challenges and opportunities. Hydrol. Process. 30, 4966–4971. doi: 10.1002/hyp.10999
Sivapalan, M. (2003). Process complexity at hillslope scale, process simplicity at the watershed scale: is there a connection? Hydrol. Process. 17, 1037–1041. doi: 10.1002/hyp.5109
Therrien, R., McLaren, R. G., Sudicky, E. A., and Panday, S. M. (2010). HydroGeoSphere: A Three-Dimensional Numerical Model Describing Fully-Integrated Subsurface and Surface Flow and Solute Transport. Technical report, Groundwater Simulations Group, University of Waterloo, Waterloo, ON.
Therrien, R., and Sudicky, E. (1996). Three-dimensional analysis of variably-saturated flow and solute transport in discretely-fractured porous media. J. Contam. Hydrol. 23, 1–44.
Troy, T. J., Pavao-Zuckerman, M., and Evans, T. P. (2015). Debates—perspectives on socio-hydrology: Socio-hydrologic modeling: Tradeoffs, hypothesis testing, and validation. Water Resour. Res. 51, 4806–4814. doi: 10.1002/2015WR017046
Turner, M. A., Miller, S., Gregory, A., Cadol, D. D., Stone, M. C., and Sheneman, L. (2016). Coupled RipCAS-DFLOW (CoRD) Software and Data Management System for Reproducible Floodplain Vegetation Succession Modeling. AGU Fall Meeting Abstracts. Available online at: https://ui.adsabs.harvard.edu/abs/2016AGUFMIN43A1684T
Vretanos, P. A. (2005). Web Feature Service Implementation Specification, Version 1.1.0, Volume OGC 04-094. Wayland, MA: Open Geospatial Consortium.
Walko, R. L., Band, L. E., Baron, J., Kittel, T. G. F., Lammers, R., Lee, T. J., et al. (2000). Coupled atmosphere—biophysics—hydrology models for environmental modeling. J. Appl. Metereol. 39, 931–944. doi: 10.1175/1520-0450(2000)039<0931:CABHMF>2.0.CO;2
Westerling, A. L., Hidalgo, H. G., Cayan, D. R., and Swetnam, T. W. (2006). Warming and earlier spring increase western U.S. Forest Wildfire Activity. Science 313:940. doi: 10.1126/science.1128834
WesternTri-StateConsortium (2017). Western Tri-State Consortium—History. Available online at: http://westernconsortium.org/DrawOnePage.aspx?PageID=209 (accessed October 23, 2017).
Whelan, G., Kim, K., Pelton, M. A., Castleton, K. J., Laniak, G. F., Wolfe, K., et al. (2014). Design of a component-based integrated environmental modeling framework. Environ. Modell. Softw. 55, 1–24. doi: 10.1016/j.envsoft.2014.01.016
Whiteside, A., and Evans, J. D. (2006). Web Coverage Service (WCS) Implementation Specification, Version 1.1.0, Volume 06-083r8. Wayland, MA: Open Geospatial Consortium.
Wu, R., Scully-Allison, C., Hossain Rifat, M., Painumkal, J., Dascalu, S. M., and Harris, F. C. Jr. (2018). Virtual watershed system: a web-service-based software package for environmental modeling. Adv. Sci. Technol. Eng. Syst. J. 3, 382–393. doi: 10.25046/aj030544
Keywords: data management, model integration, hydrologic modeling, watershed, web services, model coupling, data visualization
Citation: Gregory A, Chen C, Wu R, Miller S, Ahmad S, Anderson JW, Barrett H, Benedict K, Cadol D, Dascalu SM, Delparte D, Fenstermaker L, Godsey S, Harris FC Jr, McNamara JP, Tyler SW, Savickas J, Sheneman L, Stone M and Turner MA (2020) Efficient Model-Data Integration for Flexible Modeling, Parameter Analysis and Visualization, and Data Management. Front. Water 2:2. doi: 10.3389/frwa.2020.00002
Received: 23 October 2019; Accepted: 17 February 2020;
Published: 17 March 2020.
Edited by:
Harrie-Jan Hendricks Franssen, Julich Research Centre, GermanyReviewed by:
Xuesong Zhang, Pacific Northwest National Laboratory (DOE), United StatesCopyright © 2020 Gregory, Chen, Wu, Miller, Ahmad, Anderson, Barrett, Benedict, Cadol, Dascalu, Delparte, Fenstermaker, Godsey, Harris, McNamara, Tyler, Savickas, Sheneman, Stone and Turner. This is an open-access article distributed under the terms of the Creative Commons Attribution License (CC BY). The use, distribution or reproduction in other forums is permitted, provided the original author(s) and the copyright owner(s) are credited and that the original publication in this journal is cited, in accordance with accepted academic practice. No use, distribution or reproduction is permitted which does not comply with these terms.
*Correspondence: Karl Benedict, a2JlbmVAdW5tLmVkdQ==
Disclaimer: All claims expressed in this article are solely those of the authors and do not necessarily represent those of their affiliated organizations, or those of the publisher, the editors and the reviewers. Any product that may be evaluated in this article or claim that may be made by its manufacturer is not guaranteed or endorsed by the publisher.
Research integrity at Frontiers
Learn more about the work of our research integrity team to safeguard the quality of each article we publish.