- School of Psychology, University of Waikato, Hamilton, New Zealand
In recent years the number of cars on the road with manufacturer installed in-vehicle information systems (IVIS) has increased dramatically, and with smartphones connecting directly to these systems drivers can access a wide range of applications on the move. Some IVIS features are designed to improve safety (e.g., speed and collision warnings) but access via an IVIS to all apps on a smartphone has the potential to distract drivers and increase crash risk. We undertook this study to find out what IVIS features and apps drivers use and to ask about their effects on driving. An online survey completed by 1,017 drivers (50% female, 16–85 years) revealed the most common activity drivers engaged in was listening to music, followed by listening to directions. Fewer than half of the drivers reported conversing on a hands-free phone and 25% reported texting/sending emails or using social media. Frequency of engagement in secondary tasks decreased with age. Using hand-held mobiles was rated as having the greatest negative impact on driving, with drivers attempting to mitigate the risk by carrying out the activity in slow moving traffic or at traffic lights. Females rated the risk of most of the secondary tasks as greater than males. Almost half of the sample had access to speed warnings systems but only a small proportion had experience of lane departure, dangerous curve or intersection warning systems. Of those with access to driver safety systems, 50–70% never used them despite rating the system as useful and as having safety benefits. As the number of vehicles with manufacturer installed IVIS continues to increase on the road, drivers' engagement with them while driving is also likely to increase. To address this, there is a need for a multi-agency approach to educate drivers on the safe use of these systems and apps in their vehicles. Incentives for drivers to use the safety-related features may also be worth considering.
Introduction
In-vehicle information systems (IVIS), whether supplied with a vehicle by the manufacturer, or added later by drivers by means of apps on their smart phones, have become relatively commonplace in the vehicles on our roads. The reason for this is because these IVIS offer a large number of benefits for drivers. For example, navigation systems allow drivers to easily find locations in unfamiliar cities, and the provision of real-time traffic information allows drivers to take alternate routes to minimize journey times. Other IVIS, such as those that provide speed warnings, or lane departure warnings have even more direct safety benefits. Speed is a key factor in the severity and risk of crashes (Aarts and Van Schagen, 2006; Elvik, 2013), and apps designed to warn drivers when they exceed the speed limit have the potential to provide significant safety benefits (Várhelyi, 2002; Carsten, 2012; Starkey and Charlton, 2020). Some speed-related IVIS [known as intelligent speed assist (ISA) systems] can directly intervene to reduce the speed the vehicle is traveling by increasing the resistance in the accelerator, or capping the maximum speed depending on the posted speed limit (Várhelyi, 2002; Carsten, 2012). Eco-driving system operate in a similar way, and provide information to drivers about their speed and rate of acceleration to reduce the amount of fuel used (Barkenbus, 2010; Kircher et al., 2014). ISAs offering real-time visual and auditory speeding alerts may be particularly beneficial for roads with temporary speed reductions (e.g., during roadworks; Whitmire et al., 2011). Despite the potential safety benefits, reports suggest that drivers only engage ISAs for half of the journey time (Jamson, 2006), and those who enjoy speeding were least likely to use them (Lai et al., 2010).
Whilst IVIS have the potential to improve driver safety, they also have the potential to distract the driver and encourage them to engage in secondary tasks, increasing the probability of a crash. Distraction or inattention has been identified as a factor in at least 12% of crashes worldwide (Beanland et al., 2012; Ministry of Transport, 2016; Sagberg and Sundfør, 2016). In Norway from 2011 to 2015 mobile phone use was identified as a causative factor in 7–14% of all inattention-related fatal crashes; using an ICT system (including GPS, laptop, tablet video camera, backing camera) was linked to 4% of crashes, interaction with passengers 1–3%, adjusting the radio 3%, and eating and/or drinking were linked to 2%. Overall, in-vehicle distractions excluding mobile phones were linked to 8% of fatal crashes suggesting that further exploration of in-vehicle distraction is warranted (Sundfør et al., 2019). In terms of IVIS specifically, findings from the 100-car naturalistic study revealed that interaction with IVIS increased crash risk 4.6-fold (Dingus et al., 2016), and a recent meta-analysis (based on research prior to 2012) found IVIS to be linked to 1.66% of all crashes (Ziakopoulos et al., 2019).
Engagement in secondary tasks whilst driving is relatively common. Data from naturalistic and observational studies report that drivers are engaged in secondary tasks between 14 and 38% of the time (Metz et al., 2014; Huemer et al., 2018; Sagberg et al., 2019). The most commonly observed secondary task was using a mobile phone (1–10% of drivers). However, findings from surveys and interviews suggest the rates are much higher with 30–50% of drivers reporting using a mobile phone (talking messaging, navigation etc.). Over 30% reported adjusting the radio, selecting music, eating or drinking and almost 10% reported adjusting in-vehicle equipment (Jamson, 2013; Sagberg and Sundfør, 2016; Sagberg et al., 2019). Women reported significantly less frequent engagement in secondary activities compared to men, and engagement in all four types of distraction (inattention and traffic-related distraction, common secondary tasks, telephone calls, risky secondary tasks) decreased with age (Sagberg and Sundfør, 2016). A recent systematic review of observational studies of secondary task engagement whilst driving reported that 98% of studies found that age was linked to cell phone use. In 56% of the studies, the younger drivers had the highest prevalence of cell phone use (greater than the middle-aged or older drivers), and in 51% of studies, the oldest drivers showed the least cell phone use (Huemer et al., 2018). In contrast, a survey of nomadic device use across 27 EU states found that middle-aged drivers were more likely to using a phone when driving compared with older drivers (Jamson, 2013). Drivers appeared to recognize there is risk associated with mobile phone use; drivers rated sending and receiving messages as having the greatest risk, and talking on the phone the least. Only a small proportion of drivers (5%) reported any incident of dangerous driving due to using their phone, but 25% reported that they had observed dangerous driving by others as a result of mobile phone use. Overall, female respondents reported the risk of secondary activities as being greater than did the males (Sagberg and Sundfør, 2016).
In terms of manufacturer installed IVIS, interviews with Australian drivers revealed that the most commonly used features were GPS (75%), playing music (via Bluetooth or inbuilt apps) (25%), and making and taking calls (15%) (Oviedo-Trespalacios et al., 2019). Few participants used the IVIS for texting due to difficulties with the voice recognition software (a task that has been shown to be cognitively demanding, particularly for older drivers) (Strayer et al., 2016). In terms of the risks associated with IVIS, participants reported that the IVIS often malfunctioned leading drivers to interact with their phone to fix the problem. Over 50% of the participants acknowledged that the IVIS might be distracting and increase risk, but the majority thought it was easy to use the system safely.
Together these studies highlight that carrying out other activities and using various devices while driving is relatively common. As noted earlier, there has been a large increase in recent years in the number and types of apps that are now available for use on a smart phone while driving, and an increasing number of cars have manufacturer installed IVIS. Importantly, an increasing number of these apps/systems have been designed to improve driver safety (e.g., collision warning and speed advisory systems) rather than distract the driver, but we have very limited information about drivers' use of these types of apps or IVIS features. Our study was designed to address this gap, and aimed to find out the types of in-car information systems and entertainment systems that people use whilst driving, including their experience with safety-related apps and features. We were also interested in exploring drivers' perceptions of the risks associated with the secondary tasks and the strategies they used to minimize any negative effects.
Specifically, the current study surveyed drivers to identify: (1) the range of in-vehicle applications and information systems drivers currently use, by age and gender, (2) the prevalence and frequency of their use, (3) drivers' attitudes regarding the safety of IVIS use, (4) any negative effects of using them on their own or others driving, and (5) any strategies or techniques drivers used to minimize negative effects.
Methods
Participants
Our aim was to recruit a stratified convenience sample of ~1,000 participants comprised of similar numbers of males and females across four age groups (16–24, 25–44, 45–64, and 65 years and over) to ensure the findings included the views of a wide range of drivers in New Zealand. Data collection ceased once the target sample size was reached. A digital data collection company (Research Now) was contracted to recruit participants from across New Zealand to complete the online survey during April and May 2017. A series of mass email invitations to complete the online questionnaire were sent to 22,992 Research Now panel members. Of these, 1,784 followed the link to read the introductory information about the survey, 1,610 consented to take part, and 1,506 met the four eligibility criteria (21 were excluded as they were not permanent New Zealand residents, 2 did not have a good understanding of English, 2 were under16 years of age and 79 had not driven a car in the last month) and began the survey. Incomplete responses were removed leaving a final sample of 1,017 (sampling error = ±3.07% at 95% CI).
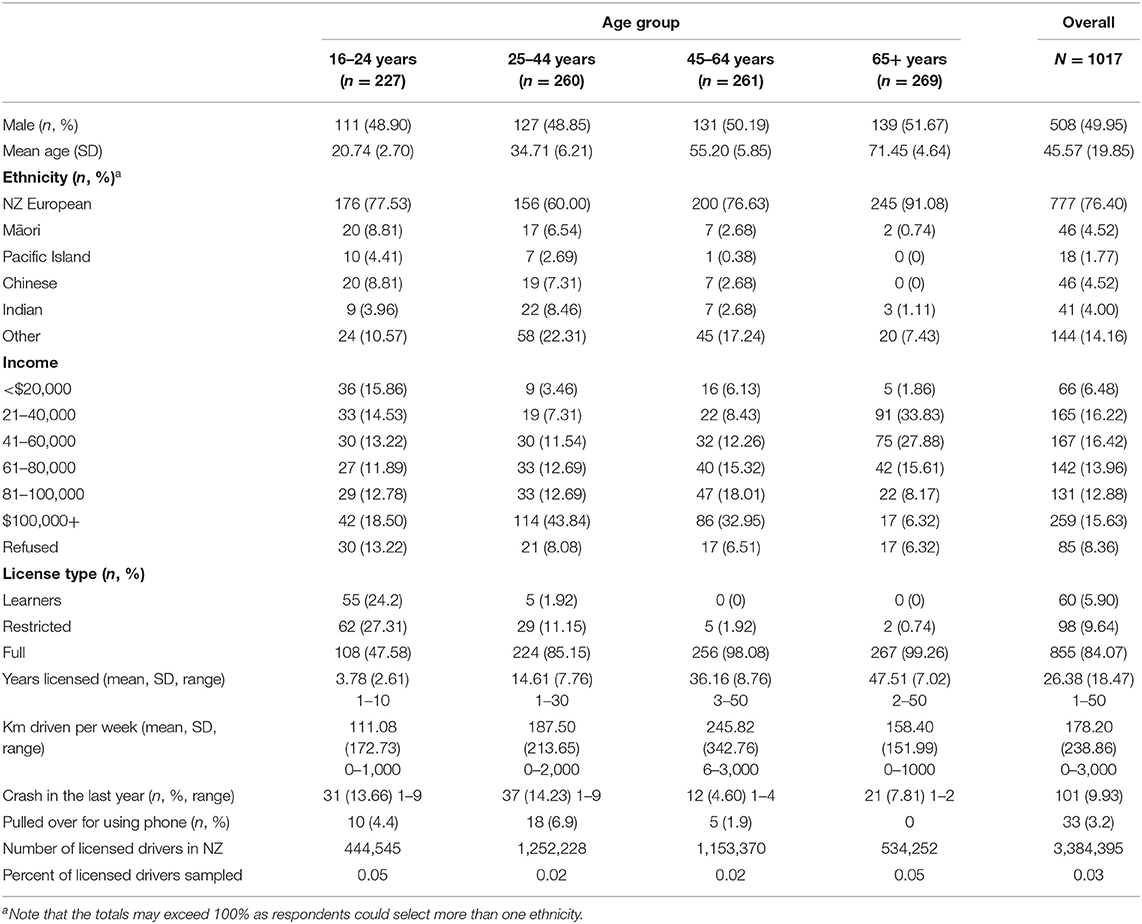
Table 1 summarizes the demographic characteristics of the sample. As can be seen in the table, respondents' ages ranged from 16 to 85 years, and the majority of respondents identified as being New Zealand European. Those in the younger age groups identified with a more diverse range of ethnic groups compared with the oldest group of respondents. In terms of driving experience, most respondents held a full license and as expected, the older groups had been licensed drivers for longer than the younger age groups. The distance driven by respondents in a typical week varied greatly, with the youngest and oldest drivers reporting driving the shortest distances. The greatest proportion of drivers involved in a crash were aged 25–44 years, closely followed by those aged 16–24 years. The fewest crashes were reported by those in the 45–64 years aged group. Those aged 25–44 were most likely to have been pulled over by the police for using a mobile phone, followed by those in the youngest age group. The percentage of licensed drivers in NZ who completed the questionnaire ranged from 0.02 to 0.05% depending on the age group.
Procedure and Questionnaire Design
The study received approval (#17:25) from the School of Psychology Research and Ethics Committee at the University of Waikato. As described above, a digital data collection company, Research Now, notified their panel members by email of the opportunity to participate in the survey. The email contained a web link which potential respondents could use to access the survey. Upon activating the web link the potential respondents were provided with a short overview of the purpose of the research, followed by a request to provide consent and complete the eligibility questions. Eligible respondents were directed to the remaining questions in the survey, while ineligible respondents received a message that explained they were not eligible for the current study, and thanked them for their interest. On completion of the survey respondents were given the opportunity to provide their email address if they wanted to receive a summary of the research findings, and they were thanked for taking part.
The questionnaire was designed to investigate drivers' use of IVIS applications such as navigation devices and advisory systems. A set of 14 behaviors and events (Table 2) linked to the use of IVIS and related systems was developed based on existing literature (e.g., Jamson, 2013), and supplemented by advice from the broader research team and the project steering group. We also developed a list of possible effects that the behavior or event could produce (e.g., speed up or slow down unintentionally) and countermeasures that could be used by drivers to minimize these effects (e.g., I pull over and stop; Table 2).
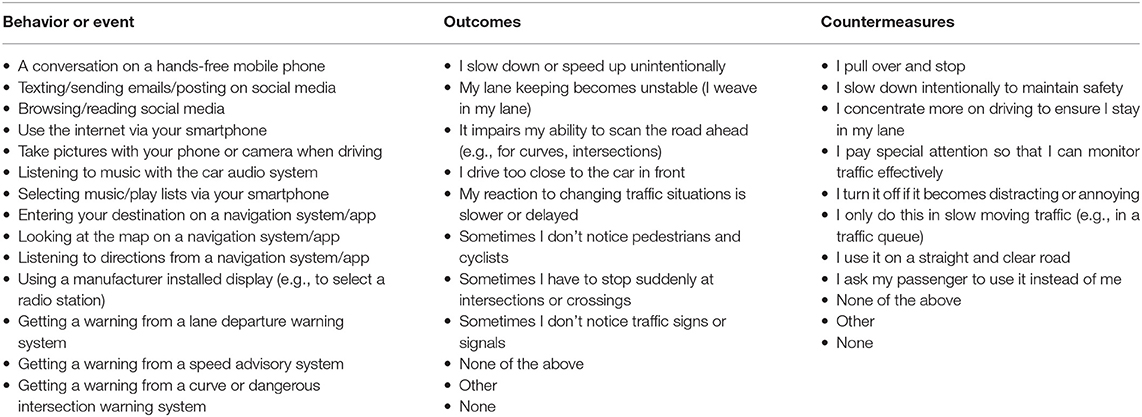
Table 2. The behaviors and events, possible outcomes, and countermeasures used in the online questionnaire.
After providing consent, and completing the eligibility questions, respondents were asked to rate how each of the 14 IVIS behaviors and events would affect an average person's driving (from −3 very impaired to +3 very improved). Following that, they were asked how frequently they personally engaged in each of the 14 IVIS behaviors (or how often each event occurred) while they were driving (not applicable, never, seldom, sometimes, often, or usually). For responses other than not applicable or never, the respondents were asked what effects this had on their driving from the list of outcomes (Table 2), selecting as many as applied to them. The outcomes question was followed by a question asking what, if anything, they did to minimize the effects, again by selecting as many as applied from the list of countermeasures (Table 2). In each case, respondents had the option to provide details of “other” effects the behavior or event had on their driving and “other” ways they minimized these effects. They were then asked to rate how much each behavior or event altered their ability to drive safely, from −3 (very impaired) to +3 (very improved).
Respondents were then asked whether they had ever used a speed advisory system, and if so which type (a system that informs them of the speed limit, a system that warns them if they go over the speed limit or the limit they have set manually, or one that limits the speed of their vehicle). They were also asked to rate the likely safety benefits (from 1 definitely not safer, to 7 definitely safer) of four speed-related systems (from Warner et al., 2010); (1) an information system that shows the current speed limit, (2) an advisory system that shows the current speed limit and warns the driver with a flashing light and sound if the speed limit is exceeded, (3) a supportive system that shows the current speed limit and exerts a counter-force on the accelerator at speeds over the speed limit (it is harder to push the accelerator if you are going over the speed limit), and (4) an intervening system that shows the current speed limit and interacts with the vehicle to prevent you exceeding the speed limit. After rating the likely safety benefits they were asked to indicate whether they would like each system installed in their car (from 1 definitely not, to 7 definitely). The final section of the questionnaire asked for demographic and driving history information, including length of licensure, distance driven each week, crash history, mobile phone offenses, age, and ethnicity.
Analyses
To provide an overall indication of IVIS prevalence, respondents' responses to the questions about the frequency of each behavior/event while driving were recoded to indicate whether or not the event occurred. We also calculated the total number of activities that each respondent engaged in and the frequency of engagement in each behavior/event. All subsequent analyses focused on the drivers who reported engaging in or experiencing each event (therefore the sample sizes for each behavior or event differ). Where the variables were categorical, and the data were frequency counts, we used the Chi square test of independence for the analyses. For continuous variables (e.g., safety ratings) we used either between groups or repeated measures analysis of variance (Anova) as appropriate (Field, 2018).
The next part of the analysis examined the drivers' perceptions of the effects of engaging in the target activity. More detailed analyses were conducted to examine the characteristics of the respondents (i.e., age and gender) reporting that each activity/experience had no effect on their driving. After this, we explored the techniques drivers used to minimize any negative effects of engaging in each behavior or event, and explored the characteristics (age and gender) of the drivers who reported making no changes to their driving.
To assess the overall effect of each behavior or event on driving safety, a series of 2 × 4 Anovas were conducted to determine the influence of age and gender on the ratings. A series of repeated-measures Anovas were then conducted to compare the ratings of how much an average driver's safety would be affected by engaging in each behavior/event to the ratings of how much the driver's own safety would be affected. The final section of the analyses focuses on the respondents' ratings of the likely safety benefits and likelihood of installation of the four speed information systems.
Results
Prevalence
The percentage of drivers who reported carrying out each activity or experiencing the event while driving is shown in Figure 1. As shown, almost all drivers (96%) listened to music with the car audio system. The next most common was listening to directions from a navigation system (64%), followed by using a manufacturer installed display (56%) and looking at a map on a navigation system (54%). Fewer than half of the respondents reported talking on a hands-free phone (47%), approximately a third (31%) entered a destination on a navigation system, and fewer than a quarter of the respondents reported sending texts, emails, or using social media. Few respondents read social media (8%), used the internet via their phone when driving (15%) or experienced lane departure (10%) or curve warnings (9%). The rates for men and women were similar for the majority of the activities/events; however, there was a significant association between gender and reporting having received warnings from speed [X2(1) = 4.65, p = 0.031] and curve advisories (X2 = 2.17, p = 0.023) with men more likely to have received warnings than women. The total number of IVIS behaviors and events reported were similar for men (M = 4.86, SD = 2.78, range = 0–14) and women (M = 4.81, SD = 0.11, range = 0–14). An independent samples t-test confirmed this difference was not statistically significant, t(1, 015) = 0.31, p = 0.76.
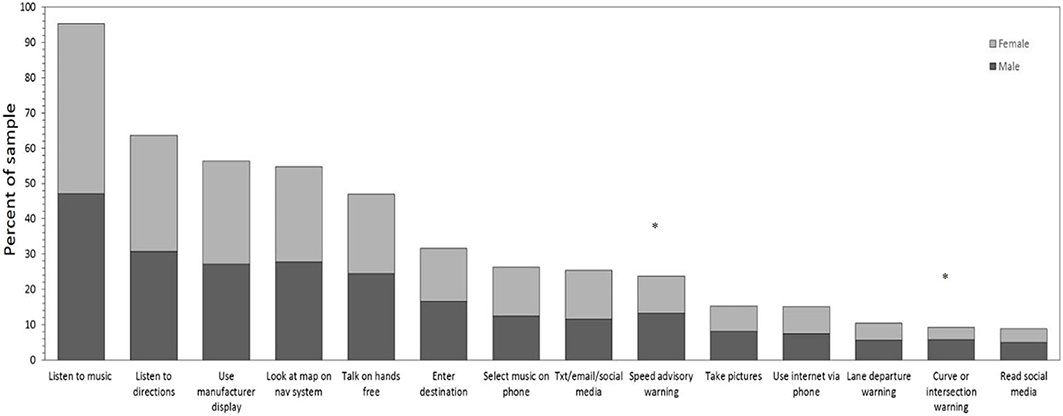
Figure 1. The percentage of male and female drivers reporting engaging in each activity or experiencing each event while driving (*indicates significant difference) (p < 0.05) between males and females.
Table 3 shows the prevalence of each IVIS behavior or event across the four age groups. There were statistically significant associations between age group and the prevalence of each behavior or event for almost all items (apart from lane departure warnings and curve/intersection warnings). The prevalence of listening to music using the in-vehicle audio, listening to directions, using the manufacturer installed display and experiencing speed advisory warnings increased with age. In contrast, selecting playlists on a phone, texting, emailing or using social media, taking pictures on a phone, using the internet on a phone, and reading social media tended to decrease with age. For the remaining behaviors (looking at a map on a navigation device, talking hands free on the phone, and entering a destination on a navigation system), prevalence was lowest in the youngest (16–24 years) and oldest age groups (>65 years). The total activities reported by age group showed a decrease with age (16–24 years M = 5.30, SD = 2.97; 25–44 years M = 5.66, SD = 2.95; 45–64 years M = 4.61, SD = 1.98; >65 years M = 3.87, SD = 1.97). A one-way Anova confirmed this difference was statistically significant [F(3, 1, 013) = 25.40, p < 0.001 = 0.07]. Bonferroni corrected post-hoc tests indicated that the youngest group (16–24 years) and the 25–44 years group carried out significantly more activities compared with those over 45 years (all p's < 0.05). The oldest group (>65 years) carried out significantly fewer activities compared with all other age groups (all p's < 0.01).
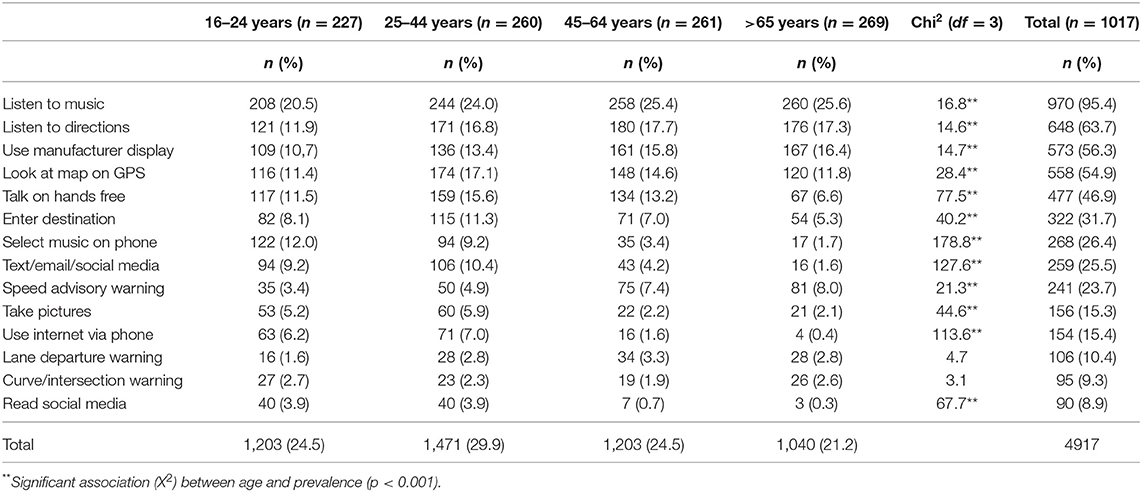
Table 3. The number and percentage of the total sample engaging in each IVIS behavior or event while driving for each age group.
Frequency of Engagement in Each IVIS Behavior/Event
Listening to music via the in-vehicle audio system was the most common activity, carried out often or usually for 75% of respondents with an in-vehicle audio system (see Table 4). The mean rating for frequency of use (never = 0 to often = 4), was also the highest for listening to music. Listening to directions, using the manufacturer-installed display, looking at maps on a navigation system, and talking on a hands-free phone, were reported as occurring seldom, or sometimes, although fewer than 40% of drivers reported never engaging in these activities. For almost all the other IVIS activities (apart from receiving speed advisory warnings) at least 60% of the drivers reported never having engaged in the behavior or experiencing the event even though they had the opportunity to do so (shown in the lower portion of Table 4). For those that did engage in these IVIS activities, the majority of drivers indicated that they seldom did so.
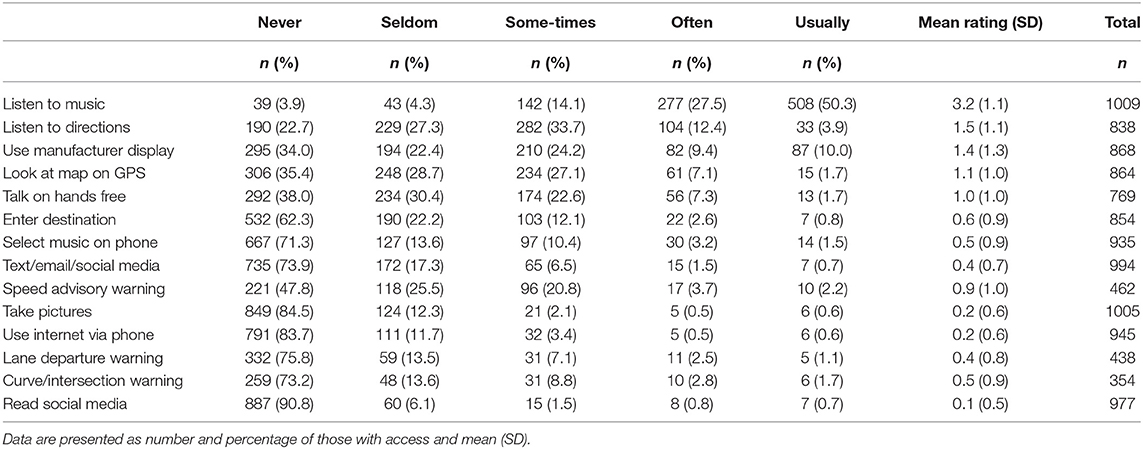
Table 4. The frequency of engagement in each IVIS behavior or event (for those with access to the device/equipment) and the mean rating for frequency of use.
The list of IVIS behaviors and events included those that are legal (e.g., talking on a hands-free phone), those that are illegal in NZ (e.g., texting), and those that are designed to improve driver safety, many of which are only available in new vehicles (e.g., lane departure warnings). The majority of respondents reported having access to a smart phone, but fewer than half of the drivers in the sample reported having access to technology to improve driver safety such as speed advisory systems, lane departure warnings and curve or intersection warnings. Of those with access, over half (52%) had received speed advisory warnings (most commonly seldom or sometimes), and only a quarter had received warnings from lane departure or curve and intersection warning systems. In contrast, over 60% of drivers reporting talking on a hands-free phone while driving. A much smaller proportion of drivers reported sending texts (26%), using the internet (16%), or accessing social media (9%) when driving (albeit this amount of drivers is high given their potential implications for safety).
The Effects of Engaging in IVIS Behaviors and Events
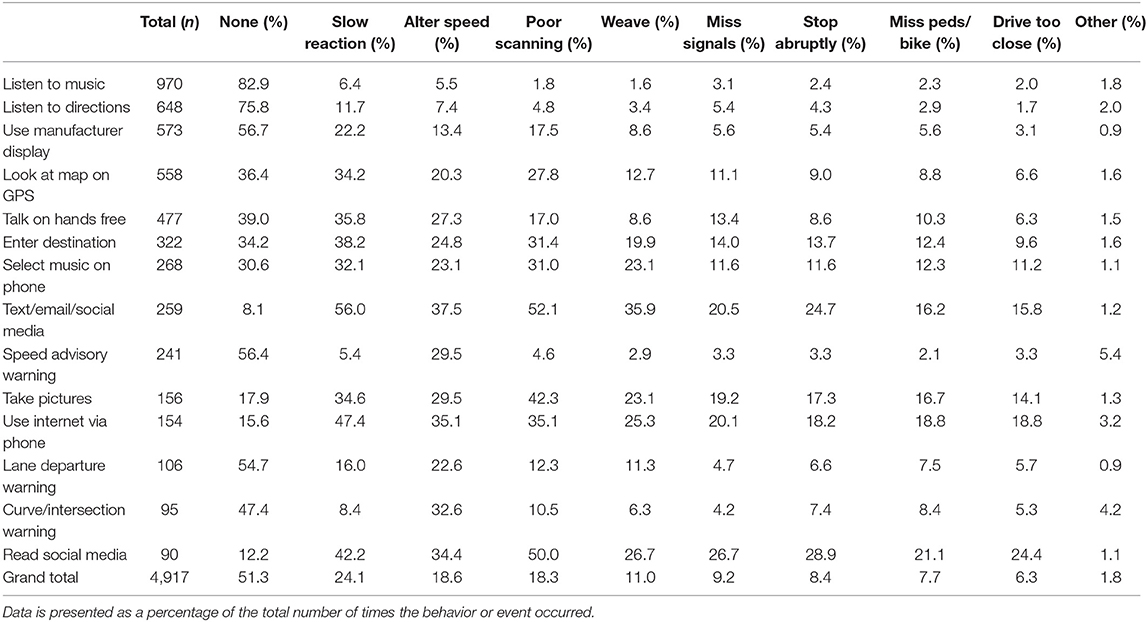
Drivers who reported engaging in each behavior (or experiencing each event) were asked to indicate how it affected their driving from a range of 10 options, by selecting as many options as applied to them. Table 5 summarizes the participants' responses by each behavior/event and overall (bottom line of Table 5). Overall, over 50% of the reported instances of various in vehicle activities were judged by respondents to have no effect on their driving. The next most frequently reported effects of IVIS activities (~20% of the reports) were slowed reactions to changing traffic situations, slowing down or speeding up unintentionally, and impairments in scanning the road ahead, while fewer than 10% of the effects were reported to adversely affect lane keeping, ability to notice traffic signals and signs leading to sudden stops at intersections or crossings, impaired ability to notice pedestrians and cyclists, and driving too close to the car in front.
Looking at each activity individually, the majority of respondents indicated that listening to music and listening to navigation directions had no effect on their driving. A small proportion of respondents indicated that listening might slow their reaction to changing traffic situations and lead to unintentional changes in speed. Activities rated as having the greatest effect on driving involved the use of a hand-held mobile phone (texting/sending emails, reading social media, using the internet, and taking pictures). Slowed reaction to changing traffic was the most commonly identified effect, but respondents identified hand-held phone use as affecting driving behavior in nearly every possible way (from the list provided). In contrast, having a conversation on a hands-free mobile was rated as having no effect by 40% of users, the remaining respondents most frequently indicated it would lead to slowed reactions to changing traffic, unintentional alterations in speed, impaired ability to scan the road ahead and failure to notice traffic signs of signals. Approximately a third of respondents using IVIS systems for navigation rated entering a destination and looking at a map on a navigation system or app, as having no effect on driving. The most frequently identified effects were slowed reactions to other traffic, unintentionally altering speed and poor scanning of the road ahead. Receiving warnings regarding speed, curves or lane position were reported to have no effect by approximately half of the respondents who used these types of systems. Around a third of users indicated that receiving a warning would lead them to alter their speed.
Given the possible negative consequences of driver distraction on safety, follow-up analyses were conducted to examine the characteristics (age and gender) of the drivers reporting that each behavior or event had no effect on their driving to determine if this was related to driver experience. The proportion of drivers in each age group (Table 6) reporting that they believed the activity had no effect was significantly different for listening to music via the car audio, the three activities relating to navigation, taking pictures and having a conversation on a hands-free phone. The proportion of those reporting no effect from listening to music, listening to directions, looking at a map, and taking pictures increased with age (i.e., the youngest drivers were more likely to report that the behavior or experience affected their driving). In contrast, the middle age groups had the highest proportion of users reporting no effects of a conversation on a hands-free phone (around 40%) and the lowest proportion of those rating entering a destination into a navigation system as having no effect.
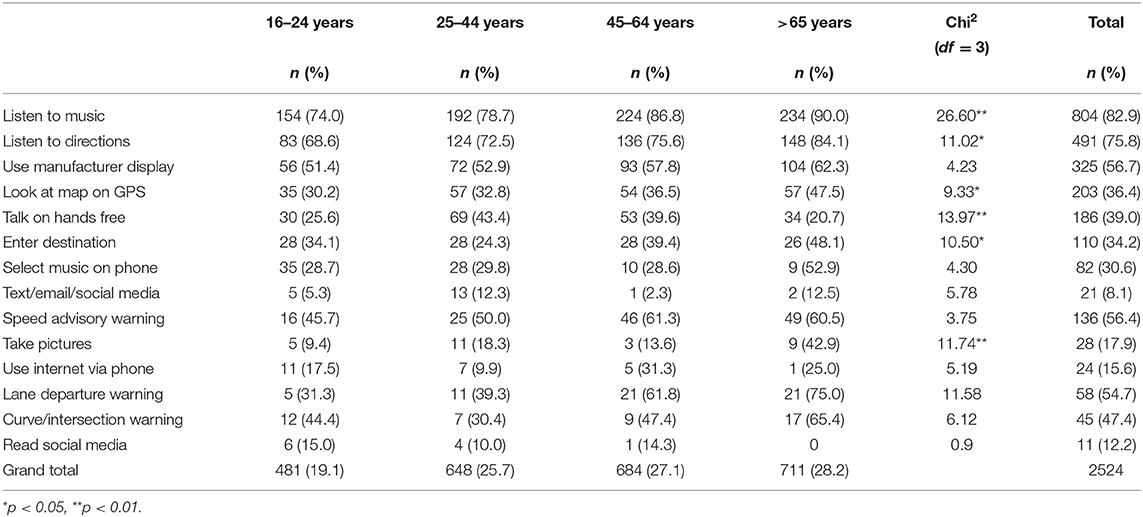
Table 6. The number and percentage of respondents in each age group engaging in each IVIS behavior or event reporting that it had no effect on their driving.
We also compared the proportion of males and females rating each of the activities or experiences as having no effect. There were no significant associations between gender and ratings of no effect for all except one of the items. The proportion of men rating looking at a map on a navigation system as having no effect was significantly higher than the proportion of females providing the same rating (males 45.0%, females = 27.5%; X2(1) = 18.46, p < 0.001).
Strategies to Minimize the Effects of IVIS Use
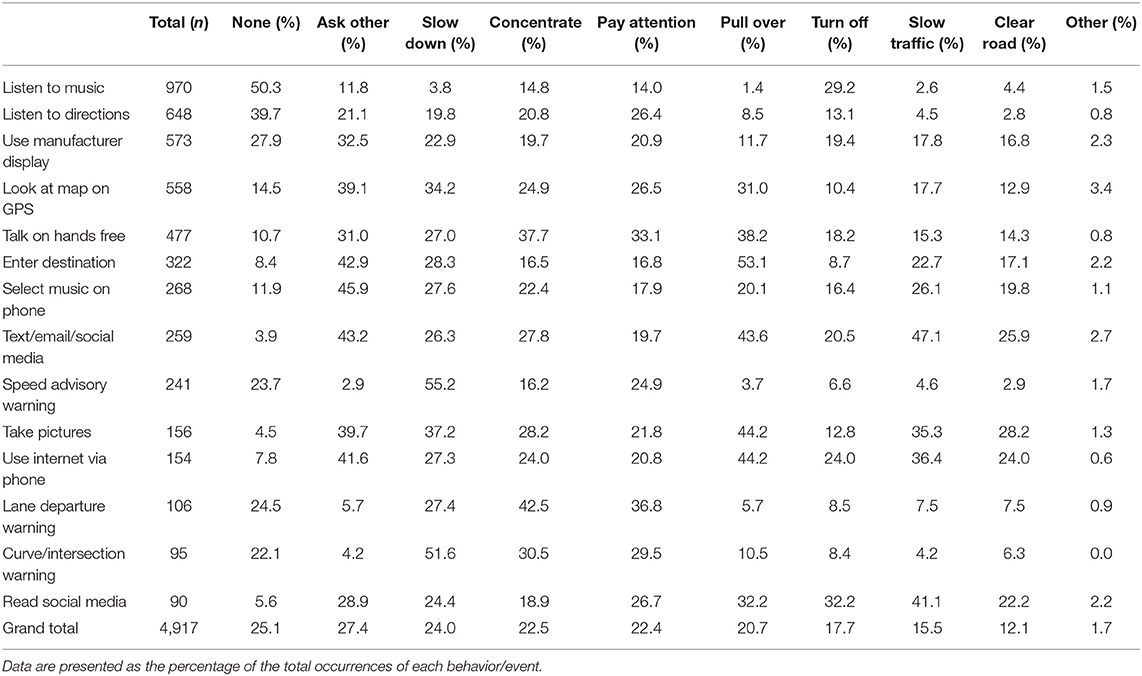
Drivers were also asked to indicate how they mitigated any effects of the behaviors they engaged in or the events they experienced. Table 7 presents the countermeasures reported by each behavior/event and overall. The most frequently reported countermeasures were to ask the passenger to carry out the activity (exceeding the use of no countermeasures). Other commonly reported strategies (>20%) were to slow down intentionally, concentrate more on driving to maintain lane position, pay special attention to monitor traffic effectively, and pull over and stop.
Unsurprisingly, listening to music was associated with the fewest reported countermeasures, and was most commonly dealt with by turning the music off. For activities involving a hand-held mobile, or interacting with a navigation device, the most commonly endorsed countermeasures were to ask the passenger to carry out the activity or use the device, to pull over and stop, or to use in slow traffic. Drivers indicated that they used a range of different countermeasures when having a conversation on a hands-free phone including asking their passenger to take the call, concentrating more, paying special attention to traffic and pulling over, suggesting they were aware of the possible negative effects on their driving.
Additional analyses to examine the use of countermeasures by gender and age, revealed significant associations between age group and use of no countermeasures for listening to music, listening to directions and looking at a map on a navigation device (Table 8). The middle age groups (25–44 and 45–64 years) reported proportionally less use of countermeasures when listening to music compared with the youngest and oldest age groups. Those aged 25–44 years were also less likely than the other age groups to take action to minimize the effects of listening to directions from a navigation device or when looking at a map on a navigation device.
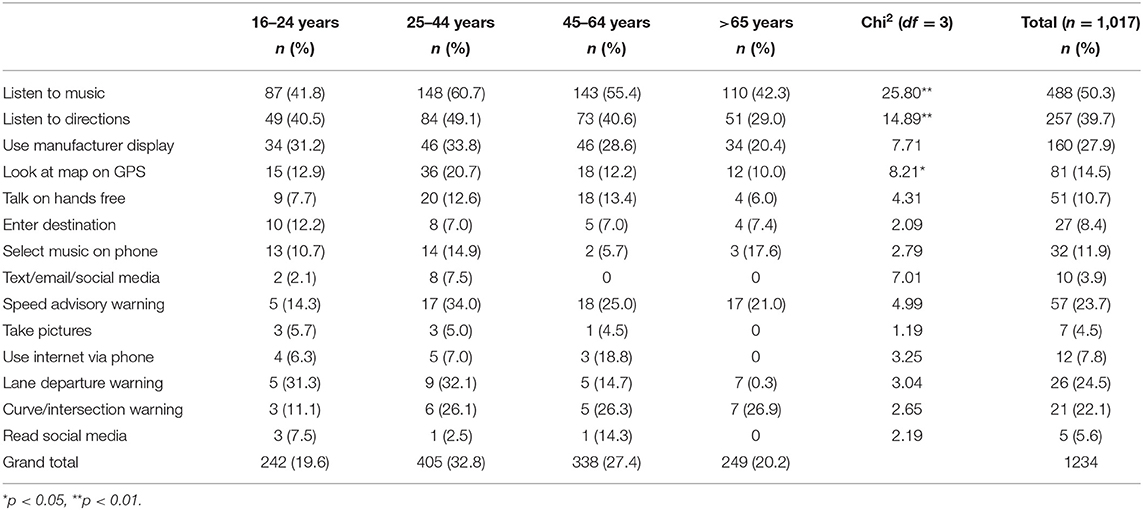
Table 8. The number and percentage of respondents in each age group engaging in each IVIS behavior or event reporting that they used no countermeasures.
In terms of gender differences, a greater proportion of males than females used no countermeasures when listening to music via the in-vehicle audio [males = 56.2%, females = 46.5%; X2(1) = 5.66, p < 0.05], when selecting a playlist on their phone [males = 16.7%, females = 7.7%; X2(1) = 5.05, p < 0.05], and when looking at a map on a navigation system [males = 19.5%, females = 9.4%; X2(1) = 11.43, p < 0.01].
Ratings of Impairment for Each Behavior or Event
Respondents were asked to rate how much they thought their own driving overall would be affected by engaging in the IVIS activities (from −3 very impaired to +3 very improved), as well as rating how much an average person's driving would be affected by each activity. A summary of the effects of each IVIS behavior/event on the respondents' own driving safety by age group is provided in Table 9. As shown in the “total” column in Table 9, texting/sending emails/posting on social media were rated as producing the greatest impairment, followed by selecting music or a playlist on your phone, entering a destination and looking at a map on a navigation system. Activities or events most likely to improve safety included getting a warning from a curve or dangerous intersection warning system, a speed advisory system or a lane departure warning. Activities which were most often identified as being the least safe (texting/sending emails/posting on social media) were the ones most often associated with respondents taking countermeasures (Table 7). Conversely, the activities rated as being quite safe (e.g., listening to music or directions) were least likely to be associated with countermeasures.
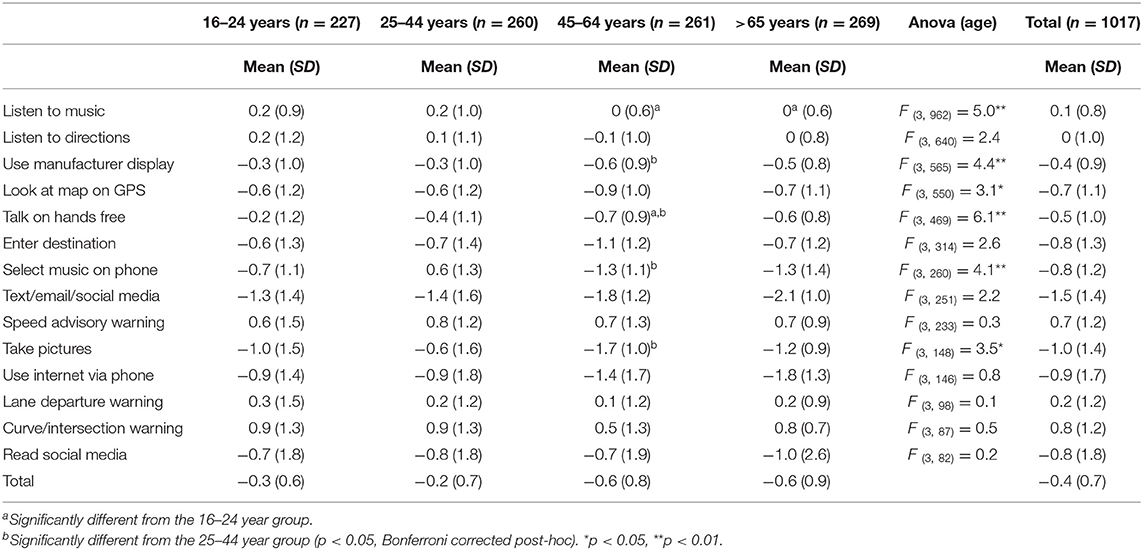
Table 9. The mean and standard deviation of the driving safety ratings by age group for the respondents engaging in each IVIS behavior or event (ratings were from −3 very impaired to +3 very improved).
We conducted a series of 2 × 4 Anovas to determine if there were significant differences in driving safety ratings by age and gender. There were no statistically significant interactions between age and gender for any of the behaviors or events. Table 9 shows the ratings by age group for each item, as well as Anova statistics associated with the main effect of age. As can be seen in the table there were significant differences across the age groups for listening to music via the car audio system, using the manufacturer installed display, looking at a map on a navigation system, having a conversation on a hands-free phone, selecting a playlist on a phone and taking pictures. Bonferroni corrected post-hoc tests revealed that the two oldest age groups rated listening to music as having a more negative effect on their driving safety compared with those aged 16–24 years. For using an in-vehicle display, having a conversation on a hands-free phone, selecting a playlist and taking pictures, those aged 45–64 years thought their driving was significantly more negatively affected compared with those aged 25–44 years who carried out the same activity. The 45–64 years group also rated having a conversation on a hands-free phone as having a greater negative effect on their driving safety compared with the youngest respondents (16–24 years).
There were also significant differences between men and women's ratings of the effects of listening to directions from a navigation system, using a manufacturer installed display, looking at a map on a navigation system, entering a destination on a navigation system, selecting a playlist on a phone, and texting/email/ posting on social media (Table 10). In each case, women rated the activity as having a significantly more negative effect on their driving safety compared with men.
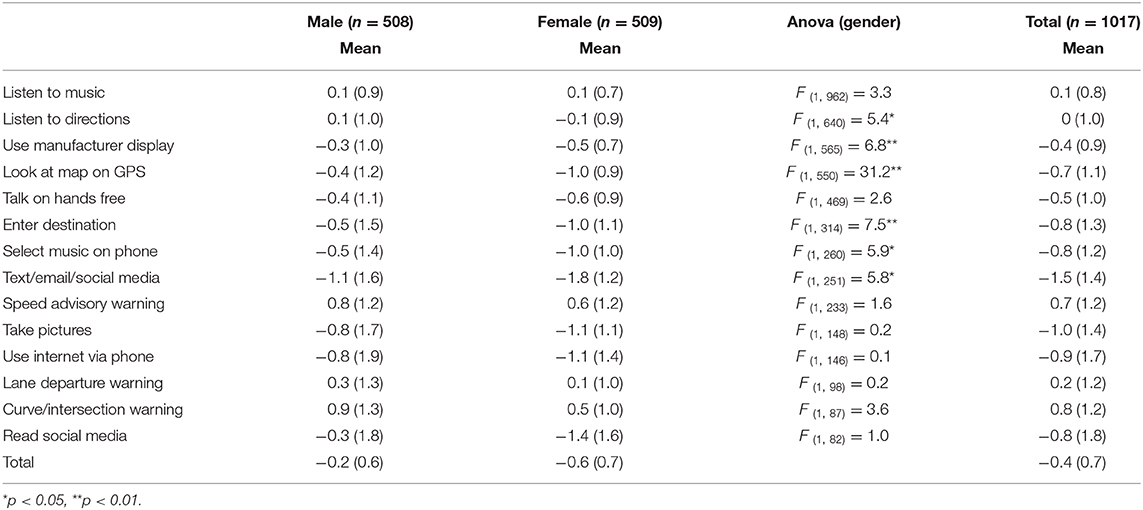
Table 10. The mean and standard deviation of the driving safety ratings by gender for the respondents engaging in each IVIS behavior or event (ratings were from −3 very impaired to +3 very improved).
In the next set of analyses we compared the respondents' ratings of how much an average person's driving would be affected by engaging in each IVIS behavior or event, to the ratings of how much their own driving would be affected (from −3 very impaired to +3 very improved). These data are presented in Figure 2. As can be seen in the figure, listening to directions, listening to music via the in-vehicle audio, receiving warnings from lane departure, speed advisory, and curve/dangerous intersection systems were rated as improving driving safety overall (the mean ratings were above zero). All other behaviors and experiences (nine of the 14 activities) were rated as leading to driving impairment rather than improvement, with texting/sending emails and posting on social media receiving the lowest ratings (i.e., leading to the greatest impairment). With regard to ratings of their own and others' driving safety, respondents generally rated each behavior or experience as having a more negative effect on the average driver compared with the effects on their own driving, with only one exception. Receiving a warning from a lane departure warning system was rated as leading to a greater improvement in the driving safety of the average driver compared with themselves. To determine if the ratings of the effects of the activities differed from zero we conducted a series of one-sided t-tests for the self and other ratings. For the ratings of other drivers, all ratings were significantly different to zero (all ps < 0.001) apart from listening to music with the car audio system (p = 1.00). For the ratings of their own driving, all ratings were significantly different from zero (all ps < 0.001) apart from listening to directions (p = 0.27) and receiving a lane departure warning (p = 0.08).

Figure 2. Overall ratings of the effects of each activity on driving safety for the respondents (self) and other drivers (data is presented as the mean rating for all drivers engaging in each activity) (**p < 0.01, *p < 0.05 other vs. self-rating).
To determine if differences in the driving safety ratings between themselves and other drivers were statistically significant a series of repeated measures Anovas were undertaken (note: the sample size for each analysis differed because we only included drivers who engaged in each of the behaviors/experiences themselves). Analyses revealed that respondents rated other drivers as significantly more impaired than themselves when texting/ emailing/posting on social media [F(1, 258) = 79.9, p < 0.001, = 0.24], taking pictures with a phone or camera [F(1, 155) = 18.8, p < 0.001, = 0.10], using the internet via a smartphone [F(1, 153) = 61.2, p < 0.001, = 0.30], selecting music or playlist on a phone [F(1, 321) = 27.5, p < 0.001, = 0.08], browsing social media [F(1, 89) = 10.0, p = 0.002, = 0.10], entering a destination [F(1, 321) = 27.5, p < 0.001, = 0.08], and looking at a map on a navigation device [F(1, 557) = 60.5, p < 0.001, = 0.10], having a conversation on a hands-free phone [F(1, 476) = 9.5, p =.002, = 0.02], using a manufacturer installed display [F(1, 572) = 67.1, p < 0.001, = 0.10] and listening to music via the in-vehicle audio [F(1, 969) = 9.8, p = 0.002, = 0.01]. They also rated lane departure warnings as improving driver safety to a significantly greater extent for other drivers compared with themselves [F(1, 105) = 4.1, p = 0.04. = 0.04]. There were no statistically significant differences between self and other ratings for listening to directions [F(1, 647) = 1.4, p = 0.20, < 0.01], or receiving warnings from a speed advisory [F(1, 240) = 0.3, p = 0.60, < 0.01], or curve and dangerous intersection warning system [F(1, 94) = 0.1, p = 0.70, < 0.01].
Safety Benefits of Speed Advisory Systems
Finally respondents were asked to rate the likely safety benefits (from 1 definitely not safer to 7 definitely safer) of four speed information systems (an information system, advisory system, supportive system, and intervening system) and to indicate if they would like them installed in their car (from 1 definitely not to 7 definitely). As shown in Figure 3 respondents rated the information and advisory systems as most likely to improve safety and they were generally willing to have these types of systems installed in their cars. In contrast, although the respondents thought the supportive and intervening systems would improve safety, they were unlikely to have them installed in their cars. A series of bivariate correlations revealed that the perceived safety benefit showed significant strong positive correlations for each of the four systems (information system r = 0.58; advisory system r = 0.70; supportive system r = 0.68, intervening system r = 0.70, all ps < 0.001, N = 1016).
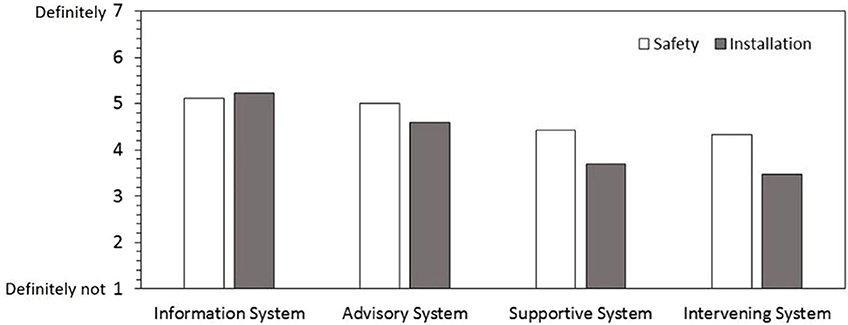
Figure 3. Ratings of the safety benefits and likelihood of installation (from 1 = definitely not, to 7 = definitely) of four speed information systems.
Discussion
The survey was conducted to identify the range of in-vehicle applications and information systems currently used by drivers, the prevalence and frequency of their use, the effects of their use on driving and to explore any strategies or techniques drivers use to minimize any negative consequences. Our study clearly demonstrates the wide variety of secondary tasks drivers engage in. As reported in previous studies, the most common were listening to music, using navigation systems, and conversing on a hands-free phone. Only a small proportion of the sample had experience with a lane departure warning system or dangerous curve and intersection warning systems. Overall, the prevalence for each activity was similar for men and women, but varied by age, with a general decrease in engagement in each activity/behavior with age, as reported in previous research (e.g., Jamson, 2013; Sagberg and Sundfør, 2016). Interestingly though, rates of texting, talking on a hands-free phone, and using a navigation device was highest in the 25–44 years group, possibly because of employment and family-related demands. The two middle age groups reported using fewer countermeasures compared to the youngest and oldest drivers, but the two oldest age-groups rated the activities as having the greatest overall negative impact on driving safety. Whilst using a hand-held mobile was rated as most likely to have negative effects, a small but significant proportion of drivers still engaged with a hand-held phone, despite legislation banning their use for over 10 years in NZ. Generally males rated the activities as having less of an impact on their driving compared with the female drivers, as in previous research (Sagberg and Sundfør, 2016). Interestingly, drivers rated almost all the activities or events as having a more negative impact on an average driver compared to their own driving, similar to Jamson (2013) and Sagberg and Sundfør (2016). This effect, known as the self-enhancement bias is a well-documented effect where drivers rate their own safety and skill better than that of other drivers and their crash risk as lower (e.g., Delhomme, 1991; Walton and Bathurst, 1998; Harré and Sibley, 2007).
These findings raise some interesting and contradictory issues. Although drivers acknowledge that interacting with IVIS systems are likely to negatively impact driving safety, they are still willing to engage in these activities. This may be partly because whilst they are aware of the negative impacts of driving whilst distracted from education campaigns and, in the case of hand-held mobile phones legislation, they have carried out these tasks or activities many times without any adverse consequences. This combined with the self-enhancement bias described previously may go some way to explaining drivers' willingness to continue to engage in distracting activities.
There is, however, evidence that drivers have access to, and some are willing to engage with driver safety related apps. Whilst only a small proportion of drivers in the current study had experience of curve advisory or lane departure warnings, almost half of the sample had access to an ISA, with around half of those (approximately one quarter of the total sample) reporting they had received speed-related warnings. The relatively high proportion of drivers with access to an ISA is encouraging, although the greatest challenge will be encouraging drivers to use them. Overall the results show that relatively few drivers use safety-oriented IVIS, and even when they have access to the systems 50–70% of drivers never use them. In fact the number of drivers reporting using a speed advisory system is the same as that reporting texting/email/social media while driving.
In interpreting the findings from this study, it should be borne in mind that that the participants recruited for this study were a convenience sample stratified across gender and age groups which places some limits on how far one can generalize the findings. In addition, the study used self-report data, and there is the possibility that respondents were not completely honest with their answers or that may have interpreted the response options differently. The strength of the study include a relatively large sample size from a wide age range.
In conclusion, use of safety orientated IVIS is low, and without incentives or education it is likely to remain low despite drivers beliefs that they have safety benefits. Given the range of secondary activities drivers engage in, despite some of them being illegal, it is even more important that we encourage drivers to use safety related apps when available. The rapid pace of technological change may mean that many drivers do not know how to use the manufacturer installed systems safely so a multi-agency approach is warranted to educate drivers. This could include car manufacturers, car rental companies, businesses with company cars, and we all as government agencies. Incentives for drivers to use the safety related features may also be worth considering.
Data Availability Statement
The datasets presented in this article are not readily available because the participants did not provide consent for the data to be shared. Requests to access the datasets should be directed to bnN0YXJrZXkmI3gwMDA0MDt3YWlrYXRvLmFjLm56.
Ethics Statement
The studies involving human participants were reviewed and approved by School of Psychology Ethics Committee, University of Waikato, Hamilton, New Zealand. The patients/participants provided their written informed consent to participate in this study.
Author Contributions
NS and SC contributed to the study design, data collection, data analysis, drafting and revision of the manuscript, and approved the final version of the manuscript for publication. All authors who meet authorship criteria are listed, and certify that they have participated sufficiently to take public responsibility for the content in the submitted work, including participation in the concept, design, analysis, writing, or revision of the manuscript.
Funding
This research was funded by the New Zealand Transport Agency (TAR16_18).
Conflict of Interest
The authors declare that the research was conducted in the absence of any commercial or financial relationships that could be construed as a potential conflict of interest.
Acknowledgments
The authors would like to thank all those who took part in this study, our research assistants who provided invaluable help with data collection and data entry, members of the steering group (Dr. Fergus Tate, Shelley Easton, Ian McGlinchy, Shannon van Lier, and Nils van Lamoen), and research consultants (Professor David Crundall and Professor Samantha Jamson).
References
Aarts, L., and Van Schagen, I. (2006) Driving speed and the risk of road crashes: a review. Accid. Anal. Prev. 38, 215–224. doi: 10.1016/j.aap.2005.07.004
Barkenbus, J. N. (2010). Eco-driving: an overlooked climate change initiative. Energy Policy 38, 762–769. doi: 10.1016/j.enpol.2009.10.021
Beanland, V., Fitzharris, F., Young, K. L., and Lenné, M. G. (2012). Driver inattention and diver distraction in serious casualty crashes: data from the Australian National Crash In-depth Study. Accid. Anal. Prev. 54, 99–107. doi: 10.1016/j.aap.2012.12.043
Carsten, O. (2012). Is intelligent speed adaptation ready for deployment? Accid. Anal. Prev. 43, 1–3. doi: 10.1016/j.aap.2012.05.012
Delhomme, P. (1991). Comparing one's driving with others': assessment of abilities and frequency of offences. Evidence for a superior conformity or self bias? Accid. Anal. Prev. 23, 493–508 doi: 10.1016/0001-4575(91)90015-W
Dingus, T. A., Guo, F., Lee, S., Antin, J. F., Perez, M., Buchanan-King, M., et al. (2016). Driver crash risk factors and prevalence evaluation using naturalistic driving data. Proc. Nat. Acad. Sci. 113, 2636–2641. doi: 10.1073/pnas.1513271113
Elvik, R. (2013). A re-parameterisation of the power model of the relationship between the speed of traffic and the number of accident victims. Accid. Anal. Prev. 50, 854–860. doi: 10.1016/j.aap.2012.07.012
Field, A. (2018). Discovering Statistics Using IBM SPSS Statistics, 5th Edn. London: Sage Publications.
Harré, N., and Sibley, C. (2007). Explicit and implicit self-enhancement biases in drivers and their relationship to driving violations and crash-risk optimism. Accid. Anal. Prev. 39, 1155–1161. doi: 10.1016/j.aap.2007.03.001
Huemer, A. K., Schumacher, M., Mennecke, M., and Vollrath, M. (2018). Systematic review of observational studies on secondary task engagement while driving. Accid. Anal. Prev. 119, 225–236. doi: 10.1016/j.aap.2018.07.017
Jamson, S. (2006). Would those who need ISA, use it? Investigating the relationship between drivers' speed choice and their use of a voluntary ISA system. Transp. Res. Part F 9, 195–206. doi: 10.1016/j.trf.2005.11.002
Jamson, S. L. (2013). What impact does legislation have on drivers' in-vehicle use of nomadic devices? Transp. Res. Part F 16, 138–150. doi: 10.1016/j.trf.2012.08.014
Kircher, K., Fors, C., and Ahlstrom, C. (2014). Continuous vs. intermittent presentation of visual eco-driving advice. Transp. Res. Part F 24, 27–38. doi: 10.1016/j.trf.2014.02.007
Lai, F., Hjälmdahl, M., Chorlton, K., and Wiklund, M. (2010). The long-term effect of intelligent speed adaptation on driver behaviour. Appl. Ergon. 41, 179–186. doi: 10.1016/j.apergo.2009.03.003
Metz, B., Landau, A., and Just, M. (2014) Frequency of secondary tasks in driving—results from naturalistic driving data. Saf. Sci. 68, 195–203. doi: 10.1016/j.ssci.2014.04.002
Ministry of Transport (2016). Diverted Attention 2016. Wellington: New Zealand Ministry of Transport.
Oviedo-Trespalacios, O., Nandavar, S., and Haworth, N. (2019). How do perceptions of risk and other psychological factors influence the use of in-vehicle information systems (IVIS)? Transp. Res. Part F 67, 113–122. doi: 10.1016/j.trf.2019.10.011
Sagberg, F., Johansson, O. J., and Sundfør, H. (2019). Combining roadside interviews and on-road observation for assessing prevalence of driver inattention. Transp. Res. Part F 62, 305–315. doi: 10.1016/j.trf.2019.01.004
Sagberg, F., and Sundfør, H. (2016). Inattention at the Wheel: Prevalence, Consequences, and Countermeasures. (Norwegian Language, with Summary in English). TOI Report 1481. Oslo: Institute of Transport economics.
Starkey, N. J., and Charlton, S. G. C. (2020). Drivers' response to speed warnings provided by a smart phone app. Transp. Res. Part C 110, 209–221. doi: 10.1016/j.trc.2019.11.020
Strayer, D. L., Cooper, J. M., Turrill, J., Coleman, J. R., and Hopman, R. J. (2016). Talking to your car can drive you to distraction. Cognit. Res. Princ. Implic. 1, 1–17. doi: 10.1186/s41235-016-0018-3
Sundfør, H. B., Sagberg, F., and Høye, A. (2019). Inattention and distraction in fatal road crashes—results from in-depth crash investigations in Norway. Accid. Anal. Prev. 125, 152–157. doi: 10.1016/j.aap.2019.02.004
Várhelyi, A. (2002). Speed management via in-car devices: effects, implications, perspectives. Transportation 29, 237–252. doi: 10.1023/A:1015643001103
Walton, D., and Bathurst, J. (1998). An exploration of the perceptions of the average driver's speed compared to perceived driver safety and driving skill. Accid. Anal. Prev. 30, 821–830. doi: 10.1016/S0001-4575(98)00035-9
Warner, H. W., Ozkan, T., and Lajunen, T. (2010). Drivers' propensity to have different types of intelligent speed adaptation installed in their cars. Transportation Res. Part F: Traffic Psychol. Behav. 13, 206–214. doi: 10.1016/j.trf.2010.04.005
Whitmire, J., Morgan, J. F., Oron-Gilad, T., and Hancock, P. A. (2011). The effect of in-vehicle warning systems on speed compliance in work zones. Transp. Res. Part F 14, 331–340. doi: 10.1016/j.trf.2011.04.001
Keywords: distraction, app, driver safety, mobile phone, secondary task, speed advisory
Citation: Starkey NJ and Charlton SG (2020) Drivers Use of In-Vehicle Information Systems and Perceptions of Their Effects on Driving. Front. Sustain. Cities 2:39. doi: 10.3389/frsc.2020.00039
Received: 21 April 2020; Accepted: 29 June 2020;
Published: 07 August 2020.
Edited by:
Krzysztof Goniewicz, Military University of Aviation, PolandReviewed by:
Abdulbari Bener, Istanbul University Cerrahpasa Faculty of Medicine, TurkeyRichard Tay, RMIT University, Australia
Copyright © 2020 Starkey and Charlton. This is an open-access article distributed under the terms of the Creative Commons Attribution License (CC BY). The use, distribution or reproduction in other forums is permitted, provided the original author(s) and the copyright owner(s) are credited and that the original publication in this journal is cited, in accordance with accepted academic practice. No use, distribution or reproduction is permitted which does not comply with these terms.
*Correspondence: Nicola Jayne Starkey, bmljb2xhLnN0YXJrZXkmI3gwMDA0MDt3YWlrYXRvLmFjLm56
 Nicola Jayne Starkey
 Samuel George Charlton