 Tor-Olav Nævestad
 Alexandra Laiou
 George Yannis
- 1Department of Security, Safety and Behaviour, Institute of Transport Economics, Oslo, Norway
- 2Department of Transportation Planning and Engineering, National Technical University of Athens, Athens, Greece
The aims of the study are to (1) compare the road safety behaviors among car drivers and motorcyclists in five different regions in Norway and Greece, (2) examine the factors influencing the road safety behaviors in these groups, and (3) examine the relationship between road safety behaviors and accident involvement. The study is based on survey answers from car drivers and motorcycle riders in two Greek and three Norwegian regions (N = 1,212). Road safety culture (RSC) is defined as shared patterns of behavior and shared expectations to other road users. The results indicate shared national RSC among Norwegian riders and drivers in the three Norwegian regions. The results from the Greek sample indicate the importance of the regional level for RSC and a unique RSC on the studied Greek island. The data do not indicate that transport mode is important for road safety behaviors or RSC. Our analyses indicate that RSC is important as it is closely related to road safety behaviors, which in turn is related to accident involvement. This suggests that accidents may be reduced by influencing the RSC. To contribute to such efforts, we discuss how and where RSC is created and how it influences road safety behavior, based on our results.
Introduction
Background
Road safety remains a health issue of international interest as it is still ranked among the 10 leading causes of deaths worldwide (WHO, 2018). The number of annual road traffic deaths has reached 1.35 million, while between 20 and 50 million people are non-fatally injured (WHO, 2018). The numbers of people killed or severely injured in road crashes have gradually been reduced in recent years as a result of traditional safety strategies focusing on safety behaviors, technology, and infrastructure (Elvik et al., 2009). It has been argued that additional reductions are contingent on developing new approaches to prevention, e.g., the safety culture approach (Ward et al., 2010; Nævestad and Bjørnskau, 2012; Edwards et al., 2014).
High-quality studies of safety culture interventions in organizations employing drivers at work, with pre- and post-measurements, and test and control groups have indicated up to 60% decrease in crash risk in the road sector (e.g., Gregersen et al., 1996). These studies focus, however, on the more established concept of organizational safety culture, which refers to the shared and safety relevant ways of thinking and acting that are recreated in social interaction within organizations (Nævestad, 2010). Previous studies also indicate that road safety culture (RSC) in sociocultural contexts that are not work organizations (nations, regions, communities, peer-groups), is important, as it influences road safety behaviors, which in turn influence drivers' accident involvement (cf. Nævestad et al., 2019a). Thus, by influencing RSC, we may be able to reduce road fatalities and injuries. We define RSC as shared patterns of behavior, shared norms prescribing certain road safety behaviors and thus, shared expectations regarding the behaviors of others (Nævestad et al., 2019a).
At the current stage, little is, however, known about how RSC comes about in the sociocultural contexts that are not work organizations. Non-professional road users are not culturally bonded through organizational units, e.g., with managers, policies, and systems aiming to facilitate safe behaviors (Nævestad and Bjørnskau, 2012; Edwards et al., 2014). It is important to examine the influence of different sociocultural contexts (e.g., country, community, and peer groups) on different road safety behaviors, as this knowledge may indicate both the socio-cultural mechanisms through which RSC influences the behaviors of non-professional road users, and thus at which analytical-level preventive measures should be directed.
One important way of developing such knowledge is to examine sociocultural groups with presumably different road safety behaviors and discuss influencing factors. To examine this, the present study compares road safety behaviors and RSC at three different levels: (1) country (Norway and Greece), (2) transport mode (car drivers and motorcycle riders), and (3) region/community (three regions in Norway and two in Greece).
The two countries were chosen for comparison as they have distinctly different road safety records. Norway had the lowest road mortality rate in Europe, with 20 road deaths per million inhabitants in 2018, while the corresponding mortality rate in Greece in 2017 was 64 (European Transport Safety Council, 2019). Several factors that could influence road safety culture are national (e.g., traffic rules, the police enforcing the rules, road user interaction, and infrastructure). Thus, it is not unreasonable to assume the existence of different national RSCs influencing road safety behaviors in these countries, shared by both car drivers and motorcycle riders across regions. In accordance with this, several shared aspects of national RSC among car drivers, bus drivers, and heavy goods vehicle (HGV) drivers in Norway and Greece were found in a previous study (cf. Nævestad et al., 2019a).
We compare two different groups of road users with distinctly different risk of accidents: car drivers and motorcycle riders. Research from Norway indicates that riders of heavy motorcycles have approximately six times higher risk of personal injury accidents than car drivers and that the risk is even higher for riders of light motorcycles (Bjørnskau, 2015). Existing research also indicates a higher risk among riders than drivers in Greece (up to 3.5 times depending on the driver's age) (Yannis et al., 2017). The higher risk has been attributed to riskier behaviors, like overspeeding (DaCoTA, 2012). As previous research has found such common behaviors across countries (DaCoTA, 2012), it is not unreasonable to expect the existence of common motorcycle behaviors and RSC, extending across countries and geographical communities, based on the unique experiences of motorcycle riders compared to, e.g., car drivers (e.g., higher physical vulnerability, higher accident risk, and the possible existence of a common motorcycle rider identity) (cf. Tunnicliff et al., 2011).
We also compare the importance of region/community for road safety behaviors and RSC (cf. Luria et al., 2014). Previous research indicates that road user interaction is a key process in which RSC is created, as road users continuously (re)create norms for behavior by behaving in certain ways, sanctioning unwanted behaviors, etc. (Özkan et al., 2006; Bjørnskau, 2017). Given the limited mobility patterns of most road users, we may expect these interaction processes to be relatively local, indicating the importance of community or region as an influence of road user behavior and RSC. Drivers and riders were therefore sampled from five regions. The drivers and riders in Greece were sampled from the capital Athens and a Greek island. The sampling was based on an assumption that the behaviors and RSC on an island could be different from that in the capital as an island is a geographically enclosed area and has many tourist drivers. It is a relatively big island with an extended road network. The drivers and the riders in Norway were sampled from the capital Oslo and two additional Norwegian counties, which were selected based on differences in accident risk and attitudes, as indicated in previous studies (Storesund Hesjevoll and Fyhri, 2017). The sampling in Norway was based on an assumption that the behaviors and RSC in these counties would be less safe than that in the capital, based on results from this previous research (Storesund Hesjevoll and Fyhri, 2017). Analogous results from USA, indicating differences between rural and urban RSC, have been reported by Rakauskas et al. (2009).
Aims
The aims of this study are to (1) compare road safety behaviors among car drivers and motorcyclists in five different regions in Norway and Greece, (2) examine the factors influencing the road safety behaviors in these groups, and (3) examine the relationship between road safety behaviors and accident involvement.
Previous Research
Road Safety Behaviors in Norway and Greece
The present study compares two types of road safety behaviors.
Overspeeding is included as it is a crucial behavior influencing accident involvement and severity (Elvik et al., 2009). Previous studies indicate that motorcycles have a higher accident risk than cars and that this, to some extent, is related to a higher prevalence of risk taking behaviors like overspeeding (Bjørnskau et al., 2012; DaCoTA, 2012). This indicates that this behavior is more prevalent among motorcycle riders than car drivers. Overspeeding also differs among car drivers from southern and northern European countries. Previous research comparing car drivers in northern and southern European countries find more self-reported overspeeding in Northern European countries than in Southern European countries (Özkan et al., 2006; Warner et al., 2011).
Aggressive violations are included as previous research indicates higher levels of aggressive driving in Southern European countries compared with Northern European countries. Warner et al. (2011) found a higher prevalence of aggressive violations (e.g., become angered and indicate hostility, sound the horn to indicate annoyance) in Greece and Turkey than in Sweden and Finland. Comparing the road safety behaviors in northern European and southern countries, Özkan et al. (2006) found that Greek drivers committed more aggressive violations than other nationalities, especially behaviors indicating their annoyance and hostility to other road users. Comparing the levels of aggressive behavior among motorcyclists and car drivers, Rowden et al. (2016) found, however, lower levels of aggression among motorcyclists, presumably as the relative lack of protection offered by motorcycles may cause riders to feel more vulnerable and therefore to be less aggressive when they are riding compared to when they are driving cars.
Factors Influencing Road Safety Behaviors
Demographic Variables
Previous research has indicated that violations (which seem to be the behavior most strongly related to accidents) seem to be more prevalent among young drivers and male drivers (Parker et al., 1998). Similar results have been found in studies of motorcycle riders (Bjørnskau et al., 2012; DaCoTA, 2012). The above-mentioned studies of driver behavior also indicate the importance of nationality for behavior (Özkan et al., 2006; Warner et al., 2011). The car drivers' education has also been found to influence road user behavior. Sucha et al. (2014) report of lower levels of “dangerous violations” and “dangerous errors” with increasing levels of education.
Road Safety Culture
There are no commonly accepted definitions of road safety culture (Edwards et al., 2014). As noted, we define RSC as shared patterns of behavior, shared norms prescribing certain road safety behaviors, and thus shared expectations regarding the behaviors of others (Nævestad et al., 2019a). In the present study, shared norms prescribing certain road safety behaviors are operationalized as descriptive norms, which refer to individuals' perceptions of what other people (in the relevant reference group) actually do (Cialdini et al., 1991). Descriptive norms may influence behavior by providing information about what is normal in certain groups (Cialdini et al., 1991). Based on Cialdini et al. (1991), we may hypothesize that the mechanism explaining the relationship between RSC and road safety behaviors is a subtle social pressure to behave in accordance with “what is normal” in your primary reference group (cf. Nævestad et al., 2019a). Finally, it is also important to note that descriptive norms can also influence behavior through the false consensus bias, in which individuals overestimate the prevalence of risky behavior among their peers in order to justify their own behavior (Berkowitz, 2005).
In the present study, we examine three sources of RSC based on the unique factors influencing culture at three different analytical levels: (1) country, (2) transport mode, and (3) region/community.
RSC at the national level
Several factors may generate RSC at the national level. First, previous research indicates that road user interaction seems to be an important RSC as road users continuously (re)create norms for behavior by behaving in certain ways, sanctioning unwanted behaviors, etc. (Özkan et al., 2006; Bjørnskau, 2017). In this manner, norms for commonly accepted behaviors may be created. Second, the interaction of road users and road user behaviors can be influenced by infrastructure, e.g., road markings, the design of junctions, and road capacity (Özkan et al., 2006). Third, certain road safety behaviors and thus expectations to other road users can, to some extent, be “normalized” in formal driver training (Nævestad et al., 2019a). Finally, the perceived level of enforcement in a country is also a relevant factor (Özkan et al., 2006). Based on these four factors, we may expect different national RSCs among riders and drivers in Norway and Greece. The importance of safety culture at the national level has been indicated in a few previous studies from the road sector and also in studies from other sectors (cf. Luria et al., 2014).
RSC at the regional level
In the present study, we also examine the importance of region or community for RSC. As noted, we hypothesize that the interaction between road users is a crucial factor influencing RSC (cf. Özkan et al., 2006). Provided that most non-professional drivers usually drive within relatively limited regions on a daily basis, it is not unreasonable to expect that local community or regional RSC may form in some areas based on the interaction of road users in the area. This may especially apply on islands, which are relatively geographically enclosed areas. Regional RSC may also be influenced by other local or regional factors, e.g., the local authorities' focus on traffic safety, the level of enforcement in the region, and the type and the composition of road users in a region (e.g., a high proportion of old drivers and tourists). In accordance with these assumptions, Luria et al. (2014) identify a shared community safety climate based on geography. Rakauskas et al. (2009) find that rural drivers engage in riskier behavior, such as not wearing seatbelts, because they perceive the risks associated with such behaviors to be lower.
RSC related to transport mode
Finally, it is not unreasonable to expect the existence of common road safety behaviors and a common motorcycle RSC extending across countries. Motorcycles generally have a higher risk than cars, and this is often attributed to riskier behaviors, e.g., overspeeding (DaCoTA, 2012). This is also because cars and motorcycles are different in several respects: physical vulnerability (Rowden et al., 2016), accident risk (Bjørnskau, 2015; Yannis et al., 2017), and behaviors (Bjørnskau et al., 2012; DaCoTA, 2012). Moreover, previous research also indicates that motorcycle riding more often than car driving is related to identity and that those in the group with which one rides represent an important source of social influence (Tunnicliff et al., 2011).
Factors Influencing Accident Involvement
Car Drivers vs. Motorcycle Riders
Data from Norway indicate that heavy motorcycle (>500 ccm) riders have approximately six times higher risk of personal injury accidents than car drivers, while the risk of light motorcycles was even higher (Bjørnskau, 2015). The fatal accident risk of riders is also higher for riders than for drivers in Greece (Yannis et al., 2017).
Road Safety Behavior
In a meta-study examining the relationship between car drivers' road safety behaviors and self-reported accidents, De Winter and Dodou (2010) found especially violations, but also errors, to be related to accidents. Warner et al. (2011) found a relationship between aggressive violations and accident involvement. Moreover, speeding appears to be a bigger problem for powered two-wheeler (PTW) crashes, compared to other modes (Strandroth and Person, 2005; DaCoTA, 2012). Strandroth and Person (2005) found that 40% of riders involved in fatal accidents had an excessive speed. Excessive speed was also related to road-racing replica motorcycles (sport motorcycles). This was also reported in Bjørnskau et al. (2012).
Demographic Variables
Nationality is a crucial demographic variable influencing the accident risk of both car drivers and motorcycle riders. As noted, the road mortality rate in Greece was 3.2 times higher than that in Norway (European Transport Safety Council, 2019). Moreover, age is also an important variable influencing the accident risk for both riders and drivers (Bjørnskau et al., 2012; Yannis et al., 2017). The same applies to gender: male drivers have a higher risk of being involved in accidents than female drivers and riders (Bjørnskau et al., 2012; Yannis et al., 2017).
Mileage
The number of kilometers driven each year is an important risk factor influencing the risk of being involved in an accident (Elvik et al., 2009). In this respect, it is important to remember that motorcycle riding largely is a seasonal activity in Norway, probably generating fewer kilometers per year than in Greece.
Hypotheses Based on Previous Research
First, we expect road safety behaviors to vary according to nationality, indicating the influence of national factors on road safety behaviors (hypothesis 1). Based on this, we expect higher levels of overspeeding among Norwegian respondents and more aggressive violations among Greek respondents. Second, we expect the road safety behaviors to vary according to transport mode, indicating the influence of mode on road safety behaviors (hypothesis 2). This involved more overspeeding among riders and less aggressive violations among riders across countries. Third, we expect region/community to influence the road safety behaviors, especially on the Greek island, which in some respects is a geographically enclosed community (hypothesis 3). Finally, we expect that the drivers' and the riders' accident involvement will be related to their road safety behaviors (hypothesis 4).
Method
The Safe Culture Project
The study was conducted within the research project “Safety culture in private and professional transport: examining its influence on behaviors and implications for interventions,” undertaken by the Institute of Transport Economics of Norway in cooperation with the National Technical University of Athens (NTUA). The results from this project focusing only on bus drivers in Norway and Greece have been presented in Nævestad et al. (2019b), and the results from both professional and private drivers in Norway and Greece have been presented in Nævestad et al. (2019a). The present study builds on and takes further a previous conference paper focusing only on riders and drivers in Greece (Nævestad et al., 2019c).
Recruitment of Respondents
The study is based on survey answers from car drivers and motorcycle riders in Norway and Greece (cf. Table 1). The Norwegian car drivers were recruited through the Preference Database of the Norwegian Postal Service. In September 2017, e-mails with web-links to the survey were sent to people in three Norwegian counties, including the capital, Oslo. Counties were selected based on differences in accident risk and attitudes. Of the 45,452 people who received the e-mail, 6,727 people (14.8%) opened the e-mail and 645 (9.6%) completed the survey. The Norwegian motorcycle riders were recruited with the help of the Norwegian motorcycle union, which distributed the survey link to its members in Oslo and the two counties. To increase the response rates, the Norwegian respondents were informed that they could participate in a draw for a present card of 2,000 NOK, if they wanted to.
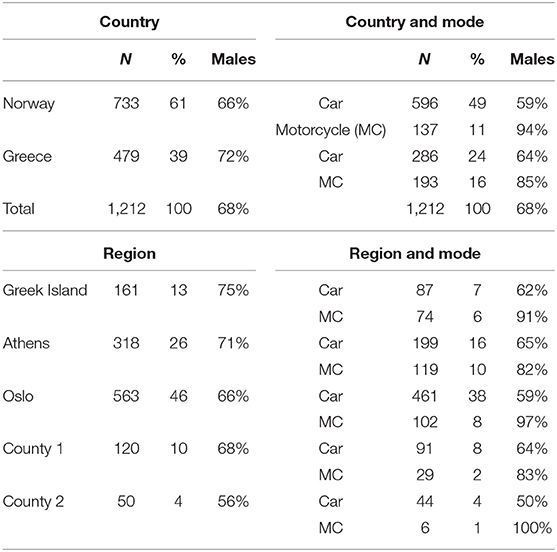
Table 1. Distribution of drivers/riders in the five regions in Norway and Greece, including the proportion of males.
The Greek car drivers and motorcycle riders were recruited through a marketing research company in Greece, which was under the scientific supervision of researchers from the NTUA. The recruitment of drivers in Greece was also difficult; therefore, it was decided to approach candidates in person and further explain the scope of the survey. This helped eliminate their doubts and fears about confidentiality and the use of the information they would provide.
When comparing the motorcycle riders in Norway and Greece, it is important to note that PTWs, i.e., mopeds and motorcycles, are common in southern European countries. In comparison, motorcycle riding is generally a seasonal (summer) activity in Norway, which often is related to leisure (e.g., Bjørnskau et al., 2012). Based on this, we may expect that the purpose of the motorcycle trips in Norway and Greece often may be different (e.g., leisure vs. practical daily transport), that the average rider characteristics (e.g., age and gender) are different, and that the types of motorcycles are different (e.g., larger and more expensive motorcycles in Norway). To make the motorcycle rider samples as comparable as possible, we have only included motorcycle riders from both countries, not riders of PTWs in general (i.e., mopeds are not included).
Survey Themes
Background Variables
Both surveys among car drivers and motorcycle riders included questions on background variables like age, experience as a driver, gender, kilometers driven with a car or motorcycle in the last 2 years, how often the respondents drive/ride, and what kind of car or motorcycle they drive/ride, and the respondents' highest level of education.
In the present study, we use two elements to operationalize RSC related to country, region, or mode: (1) road safety behaviors and (2) descriptive norms. When these two elements vary according to country, the results are attributed to national RSC; when they vary according to region, it is attributed to regional RSC; and when they vary according to mode, it is attributed to a shared car or motorcycle RSC.
Road Safety
Road safety behaviors are measured by means of six items taken from the Driver Behavior Questionnaire (DBQ). The DBQ answer alternatives have been changed from relative to absolute alternatives (e.g., question: “for every ten trips, how often do you …?,” alternative answers: “never,” “once or twice,” “three or four times,” “five or six times,” “seven or eight times,” “more than eight times but not always,” and “always”). Two questions measure overspeeding: “disregard the speed limit on a residential road” and “Disregard the speed limit on a motorway road.” These were combined into an index (Cronbach's Alpha: 0.498). Four questions measure aggressive violations: “sound your horn to indicate your annoyance to another road user,” “become angered by a certain type of driver and indicate your hostility by whatever means you can,” “become angered by another driver and give chase with the intention of giving him/her a piece of your mind,” and “overtake a slow driver on the inside.” These were combined into an aggressive violations index (Cronbach's Alpha: 0.804).
Descriptive Norms
We measure the descriptive norms by means of seven questions. The respondents were asked: “when driving in my country, I expect the following behavior from other drivers:” (1) “that they sound their horn to indicate their annoyance to another road user,” (2) “that they become angered by a certain type of driver and indicate their hostility by whatever means they can,” (3) “that they overtake a slow driver on the inside,” (4) “that they drive when they suspect they might be over the legal blood alcohol limit,” (5) “that they drive without using a seatbelt,” (6) “that they disregard the speed limit on a motorway road,” and (7) “that they disregard the speed limit on a residential road.” Five answer alternatives ranged between 1 (none–very few) and 5 (almost all/all). The seven items were combined into a descriptive norms index (Cronbach's Alpha: 0.897).
The descriptive norms index focuses on the national level, asking the respondents about expectations to other drivers when driving in their respective countries. We can, however, generally expect that the riders and the drivers primarily assess this based on their experiences with the drivers on their local roads in the regions where usually drive. Thus, we may assume that this index may capture regional differences in RSC. The scope of the respondents' daily geographical driving environment limits their experiences. This means, for instance, that the expectations of the riders/drivers on the island to “other road users in their country” largely are based on their experiences with local drivers from their island. The same applies to riders/drivers in the three Norwegian counties; two of them are 220 km apart in the south of Norway, and the third is in the north of Norway, at least 2,400 km away from the two other regions. However, if the scores on the descriptive index are common across national regions, we attribute it to national RSC. Furthermore, we also assume that the descriptive norms index may capture RSC related to mode as we use it to assess whether the motorcycle riders' expectations to car drivers are common across their respective regions or countries, because of their unique experiences as riders, or whether they share expectations with other car drivers in their region or nation (indicating that region or nations are more important sources of RSC).
Safety Outcomes
We report the results for one question on the respondents' crash involvement while driving in the last 2 years, with four answer alternatives: (1) no, (2) yes, involving property damage, (3) yes, involving personal injuries, and (4) yes, involving fatal injuries.
Analysis
When comparing the mean scores of the different groups, one-way ANOVA tests, which compare whether the mean scores are equal (the null hypothesis) or (significantly) different, are used. Tukey post-hoc tests are conducted. Two regression analyses have been conducted. In the first analysis, the factors predicting the respondents' answers on the dependent variable aggressive violations are analyzed. Hierarchical linear regression analyses are used, where independent variables are included in successive steps. In the second regression analysis, the factors predicting the respondents' answers on a dependent variable (accident involvement) measuring accident involvement are analyzed. Logistic regression analysis is used in this analysis as the dependent variable has two values (no = 1 and yes = 2). The B values are presented, and they indicate whether the risk of accident involvement is reduced (negative B values) or increased (positive B values), when the independent variables increase with one value. Of course, it is impossible to conclude about causality as this is a cross-sectional and correlational study. The term “predict” is nevertheless used when the regression analyses are described.
Results
Description of the Sample
Table 1 provides details on the distribution of drivers/riders in the five regions in Norway and Greece, including the proportion of males.
Table 1 indicates that nearly half of the sample is comprised of car drivers from Norway, while 39% of the sample is comprised of riders and drivers from Greece. The share of males is higher for motorcycle riders in both countries, but especially in Norway. Looking at the five regions included in the study, the share of males was highest on the Greek island (75%) and lowest in one of the Norwegian counties (County 2) (56%). Comparing modes, we see that the share of males generally is higher in the motorcycle samples.
Table 2 provides details on the distribution of age groups among the drivers/riders in the five regions in Norway and Greece.
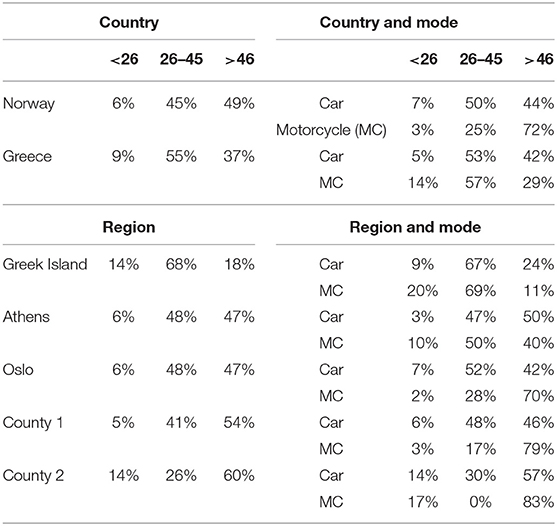
Table 2. Distribution of age groups among the drivers/riders in the five regions in Norway and Greece.
Table 2 indicates that the respondents from Norway generally are older than the respondents from Greece. The differences between the age groups in Greece and Norway are statistically significant at the 1% level (P = 0.001). Looking at the five regions included in the study, the share of respondents over 46 years old was lowest on the Greek island (18%) and highest in Norwegian county 2 (60%). Comparing modes, we see that the age of Norwegian motorcycle riders generally is higher than the Greek riders. The share of Norwegian riders over 46 years old is over twice as high as in the Greek rider sample. The age of the Norwegian motorcycle riders is also higher than the car drivers in both countries.
The differences in the riders'/drivers' experience are in accordance with the age differences. Over half of the riders and the drivers in Norway had over 20 years of experience, while the corresponding shares in the Greek sample were 25 and 37%.
The three most prevalent motorcycle types in Norway were touring (44%), classic (18%), and other (18%). The three most prevalent motorcycle types in Greece were scooter (55%), classic (21%), and other (8%). The riders were also asked about the engine capacity of their motorcycles, and 98% of the Norwegian respondents answered over 500 ccm, while 77% of the Greek riders answered up to 500 ccm. The three most prevalent car types in the Norwegian sample were passenger car (50%), station wagon (29%), and suburban vehicle (SUV; 15%), while 90% of the drivers in the Greek sample drove passenger cars. The results on the respondents' highest level of education indicate that the share of respondents with at least 3–4 years of university/college education was 76% among the Norwegian drivers, 61% among the Norwegian riders, 54% among the Greek drivers, and 48% among the Greek riders.
Questions were also included about the drivers'/riders' accident involvement (property damage, personal injury, and fatal) in the course of the last 2 years. A proportion of 14% had been involved in an accident (at least property damage). This applies to 10% of the car drivers and 14% of the motorcyclists in Norway and 17% of the car drivers and 23% of the motorcyclists in Greece. A chi-square test indicate that the differences were statistically significant at the 1% level (P = 0.001).
Road Safety Behaviors
The first aim of the study was to compare the road safety behaviors in the studied groups. Shared patterns of road safety behaviors is the first element in our definition of RSC. One-way ANOVAs were conducted to examine the effects of the key variables on road safety behaviors. We also conducted post-hoc tests (Tukey) to examine whether the differences between the groups' mean behavior scores were significantly different. This was done first, based on a variable with five values (i.e., region). We conducted a similar post-hoc test (Tukey) based on a variable with 10 values [five regions × car/motorcycle (MC)] to examine whether the means of drivers and riders within each region were similar (i.e., not significantly different). Similarly, we conducted post-hoc tests based on a variable with four values to examine the means of riders and drivers within countries (two countries × car/MC). Finally, two-way ANOVAs were conducted to examine the interaction effects of country and mode on behaviors. Table 3 shows the mean scores for overspeeding.
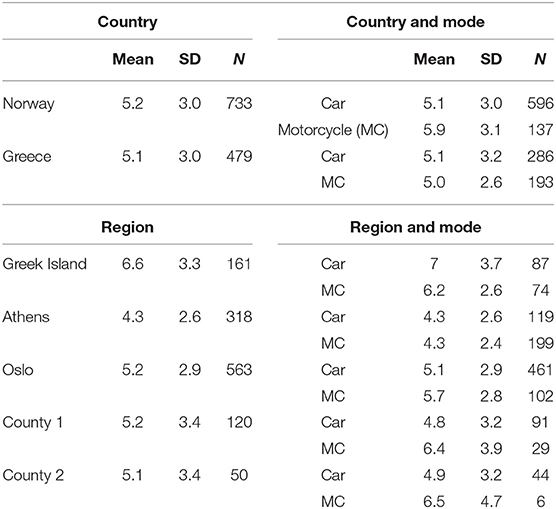
Table 3. Mean scores for overspeeding (minimum: 2, maximum: 14) in the five regions and the two countries.
Table 3 indicates relatively similar scores for Norwegian and Greek respondents on the overspeeding index. A one-way ANOVA was conducted to examine the effect of country on overspeeding. An analysis of variance showed that the effect of country on overspeeding was not significant [F(1, 1, 210) = 0.604, p = 0.437].
A one-way ANOVA was conducted to examine the effect of transport mode on overspeeding. An analysis of variance showed that the effect of transport mode on overspeeding was not significant [F(1, 1, 210) = 2.361, p = 0.125]. The mean score of drivers was 5.1 (SD: 3.1), while it was 5.4 for riders (SD: 2.9). A two-way ANOVA that examined the effect of country and mode on overspeeding was conducted (cf. hypothesis 1 and hypothesis 2). There was a statistically significant interaction between the effects of country and mode on overspeeding [F(1, 1, 208) = 5.011, p = 0.028].
The variable country and mode was made to compare the scores for the modes within countries. In accordance with the observed interaction effect, a one-way ANOVA showed that the effect of country and mode on overspeeding was significant [F(3, 1, 208) = 2.865, p = 0.036]. The Tukey post-hoc tests indicate that the mean score of riders in Norway (5.9 points) was significantly higher than that of drivers in Norway (5.1 points) at the 5% level (P = 0.026).
A one-way ANOVA was conducted to examine the effect of the variable region on overspeeding. The results indicate that the effect was significant [F(4, 1, 207) = 16.903, p = 0.001]. The scores of the three Norwegian regions are relatively similar on the overspeeding index, while the score of Athens is the lowest among the regions and the score of the Greek Island is the highest. A Tukey post-hoc test, comparing the scores of the five regions, indicates that the score of the Greek island is significantly higher than those of the other four regions (P = 0.001), while the score of Athens is significantly lower than the scores of all other regions (P = 0.001), except county 2 (because of a low N in this group).
The variable region and mode, with 10 values (riders vs. drivers × five regions), was made to the compare scores for the modes within regions. A one-way ANOVA was conducted to examine the effect of this variable on overspeeding, indicating that the effect was significant [F(9, 1, 202) = 9.100, p = 0.001]. A Tukey post-hoc test indicates that the scores of riders and drivers within each region were not significantly different.
To conclude, we see regional differences in the Greek data (Athens vs. Greek island), indicating the importance of region as an influencing factor, and similar scores among the three Norwegian regions, indicating the importance of country. Finally, overspeeding is not significantly correlated with accident involvement and weakly correlated with descriptive norms (Pearson's R: 0.189) (P = 0.001).
Table 4 shows the mean scores for aggressive violations in the five regions and in the two countries.
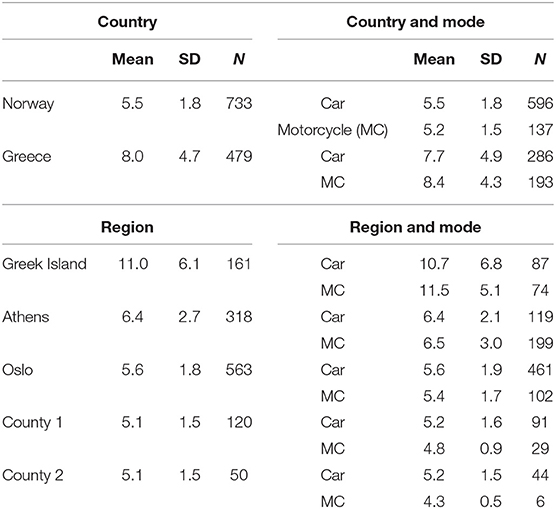
Table 4. Mean scores for aggressive violations (minimum: 4, maximum: 28) in the five regions and the two countries.
Table 4 indicates higher scores among the Greek respondents on the aggressive violations index. A one-way ANOVA was conducted to examine the effect of country on aggressive violations, indicating a significant effect [F(1, 1, 210) = 170.492, p = 0.001].
A one-way ANOVA was conducted to examine the effect of transport mode on aggressive violations, indicating a significant effect [F(1, 1, 210) = 13.910, p = 0.001]. The mean score of car drivers was 6.2 (SD: 3.3), while it was 7.1 (SD: 3.8) for motorcyclists. A two-way ANOVA that examined the interaction effect of country and mode on aggressive violations (cf. hypothesis 1 and hypothesis 2) was conducted, indicating a significant interaction effect [F(1, 1, 208) = 5.011, p = 0.025].
The variable country and mode was made to compare the scores for the modes within countries. A one-way ANOVA was conducted to examine the effect of the variable country and mode on aggressive violations, indicating a significant effect [F(3, 1, 208) = 58.944, p = 0.001]. A Tukey post-hoc comparison indicates that the scores of riders and drivers within each country are similar (i.e., differences are not statistically significant).
A one-way ANOVA was conducted to examine the effect of the variable region on aggressive violations. The results indicate that the effect was significant [F(4, 1, 207) = 117.249, p = 0.001]. The Tukey post-hoc tests, comparing the scores of the five regions, indicate that the score of the Greek island is significantly higher than those of the other four regions (P = 0.001), while the score of Athens is significantly different than those of the other regions at the 1% level (P = 0.001), except county 2 which is significantly different at the 5% level (P = 0.030). The scores of the three Norwegian regions are not significantly different from each other.
The variable region and mode, with 10 values (riders vs. drivers × five regions), was made to compare the scores for the modes within regions. A one-way ANOVA was conducted to examine the effect of this variable on aggressive violations, indicating that the effect was significant [F(9, 1, 202) = 52.563, p = 0.001. The Tukey post-hoc tests indicate that the scores of riders and drivers within each region were not significantly different.
To conclude, we see internal differences in the Greek data (Athens vs. Greek island), indicating the importance of region as an influencing factor, and similar scores among the regions in the Norwegian data, indicating the importance of country. Finally, aggressive violations are weakly correlated with accident involvement (Pearson's R: 0.104) (P = 0.001) and moderately correlated with national norms (Pearson's R: 0.387) (P = 0.001).
Descriptive Norms
In addition to drawing inferences about RSC based on shared patterns of behavior, we also measure RSC by means of a sum score index comprised of seven questions measuring national descriptive norms (Cronbach's Alpha: 0.897) (min 7, max 49). Descriptive norms is the second element in our definition of RSC.
Table 5 shows the results on the descriptive norms index for the different groups.
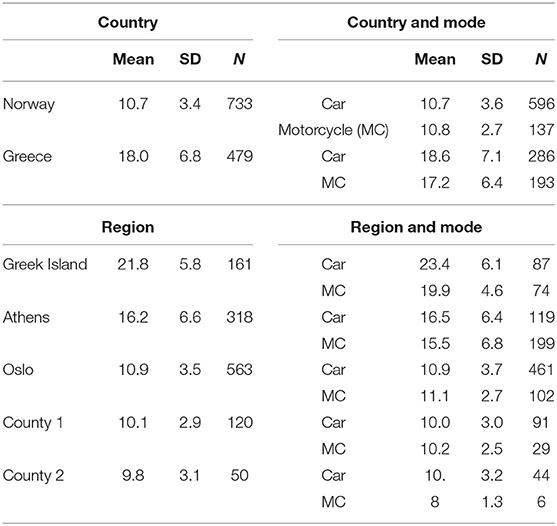
Table 5. Descriptive norms index (minimum: 7, maximum: 49).
Table 5 indicates generally higher scores on the descriptive norms index among drivers and riders in Greece. A one-way ANOVA was conducted to examine the effect of country on descriptive norms, indicating a significant effect [F(1, 1, 210) = 607.184, p = 0.001]. This indicates that the Greek respondents generally expect more aggression and violations from other road users in their country than the Norwegian respondents.
A one-way ANOVA was conducted to examine the effect of transport mode on descriptive norms, indicating a significant effect [F(1, 1, 210) = 9.827, p = 0.002]. The mean score of drivers was 13.3 (SD: 6.2), while it was 14.5 for riders (SD: 6.1). This result is, however, small compared to the national differences.
The variable country and mode was made to compare the scores for the modes within countries. A one-way ANOVA was conducted to examine the effect of this variable on descriptive norms, indicating a significant effect [F(3, 1, 208) = 206.629, p = 0.001]. The Tukey post-hoc tests did not indicate significant differences between car drivers and motorcycle riders in Norway on the descriptive norms index, indicating that they expect the same level of aggression and violations from other drivers in their country (i.e., common descriptive norms). Comparing riders and drivers in Greece, we found that the score of the Greek drivers were somewhat higher than the riders. The difference was statistically significant at the 5% level (P = 0.014).
A one-way ANOVA was conducted to examine the effect of the variable region on descriptive norms. The results indicate that the effect was significant [F(4, 1, 207) = 209.499, p = 0.001]. The score of the Greek island is about six points higher than that of Athens, while the scores of the three Norwegian regions are lower and fairly similar. A Tukey post-hoc test, comparing the scores of the five regions, indicates that the score of the Greek island is significantly higher than those of the other four regions (P = 0.001). This score of Athens on the descriptive norms index is also significantly different from those of the other four regions (P = 0.001). The mean score of Oslo is not significantly different from those of the two other Norwegian regions, indicating a shared national RCS among these regions.
The variable region and mode, with 10 values (riders vs. drivers × five regions), was made to compare the scores for the modes within regions. A one-way ANOVA was conducted to examine the effect of this variable on descriptive norms, indicating that the effect was significant [F(9, 1, 202) = 97.778, p = 0.001]. The Tukey post-hoc tests indicate that the scores of riders and drivers within each region were not significantly different, with one exception. The score of car drivers on the Greek island (23.4) is significantly higher than that of motorcycle riders (19.9) at the 1% level (P = 0.001). This explains the significant difference between Greek riders and drivers at the national level.
To sum up, the results seem to indicate shared descriptive norms among the Norwegian respondents, while the descriptive norms in Greece seem to vary according to the regional level, as indicated by the higher scores among the respondents on the Greek island.
Factors Influencing Road Safety Behaviors
In this section, we conduct regression analyses to examine the variables that predict road safety behaviors, in accordance with the second aim of the study. We only examine aggressive violations as this behavior was significantly related to accident involvement. Table 6 shows the results of nine regression models with “aggressive violations” as the dependent variable.
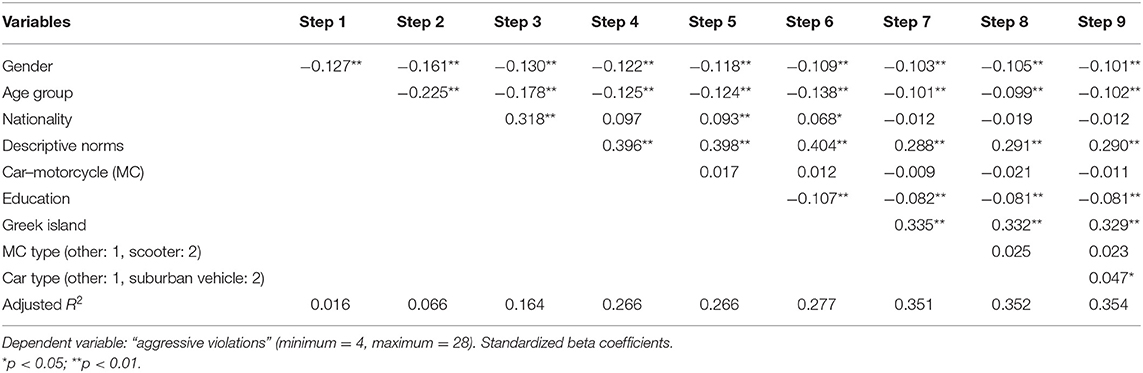
Table 6. Linear regression.
Table 6 indicates five main results. The first main result is that the Greek island is the variable with the strongest contribution to aggressive violations in the model. This indicates a higher prevalence of aggressive violations among drivers and riders on the island, also when we control for demographic variables. The contribution of age and education is reduced somewhat when island is included, indicating a correlation with these and the somewhat younger respondents with lower levels of education on the island. The contribution of island in the model indicates an “island effect,” or an influence at the regional level in the data, in addition to the national differences. We dichotomized the region variable into Greek island (2) and other (1) based on the comparisons of means in Table 4, which showed higher levels of aggressive violations on the Greek island. Thus, the value “other” is comprised of the other four regions.
The second main result is that descriptive norms is the second most important variable that predicts the drivers' and the riders' tendency to commit aggressive violations. This means that the respondents who expect a higher level of aggressive behavior and violations among other drivers in their own country are more likely to be involved in aggressive violations themselves. As expected, this variable is strongly correlated with nationality, which ceases to contribute significantly when we include descriptive norms in step 4. Thus, it seems that the contribution of nationality is mediated through descriptive norms.
The third main result is that demographic background variables, like the respondents' gender, age, and education, also contribute significantly and negatively. Older drivers, female drivers, and drivers with higher levels of education commit lower levels of aggressive violations.
Fourth, motorcycle type does not contribute significantly in the model, but car type does. Motorcycle type was dichotomized into scooter (2) and other (1), based on comparisons of means indicating higher levels of aggressive violations among scooter riders. Car type was similarly dichotomized into SUV and pick-up (2) and other (1), based on comparisons of means. Table 6 indicates that SUV and pick-up drivers seem to commit slightly more aggressive violations, controlling for the other variables.
Finally, the adjusted R value is 0.354 in step 9, indicating that the model explains 35% of the variation in the dependent variable.
Factors Influencing Accident Involvement
In this section, we examine the factors influencing accident involvement, in accordance with the third aim of the study. Table 7 presents the exposure for the different groups, accident involvement, and accident risk, measured as accidents with at least property damage, per million kilometers driven. The numbers are based on self-reported data. As expected, the table indicates higher numbers of kilometers driven for drivers than for riders in both countries and more kilometers driven in for riders in Greece than in Norway, as motorcycle riding is more of a seasonal activity in Norway.
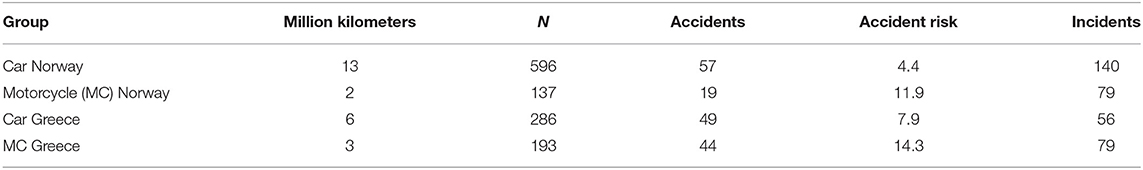
Table 7. Estimated million kilometers (km) driven in the last 2 years with car or motorcycle, including the share of respondents who answered that they had experienced an accident (minimum property damage) or incident in the last 2 years, and estimated risk of accidents with property damage based on self-reported numbers of kilometers and accidents.
As expected, we see a higher risk for motorcycle riders and generally a higher risk for riders and drivers in Greece than in Norway. The accident risk on the island was 14.9 accidents per million kilometers for riders and 8.4 for drivers.
The table also includes incidents in the last 2 years. This refers to “near misses” in the last 2 years for riders, which is defined as situations where the riders or others have had to brake and/or turn heavily to avoid a collision. For drivers, this refers to situations where they have dented or scratched their car or touched an object (e.g., a post, a wall, or another car while parking) in the last 2 years. A share of 24% of Norwegian car drivers and 58% of the Norwegian motorcycle riders had been involved in incidents, while 20% of the Greek drivers and 41% of the Greek riders had been involved in incidents.
A logistic regression analysis was conducted with accident involvement as the dependent variable. In this analysis, the accident involvement variable, which originally had four answer alternatives, was dichotomized (0 = accident and 1 = accident). The B values are presented and they indicate whether the risk of accident involvement is reduced (negative B values) or increased (positive B values), when the independent variables increase with one value. We include different independent variables step-wise in the analyses to be able to examine the isolated effect of the independent variables, i.e., when the other variables are held constant. Table 8 shows the results of nine logistic regression models with accident involvement as the dependent variable.
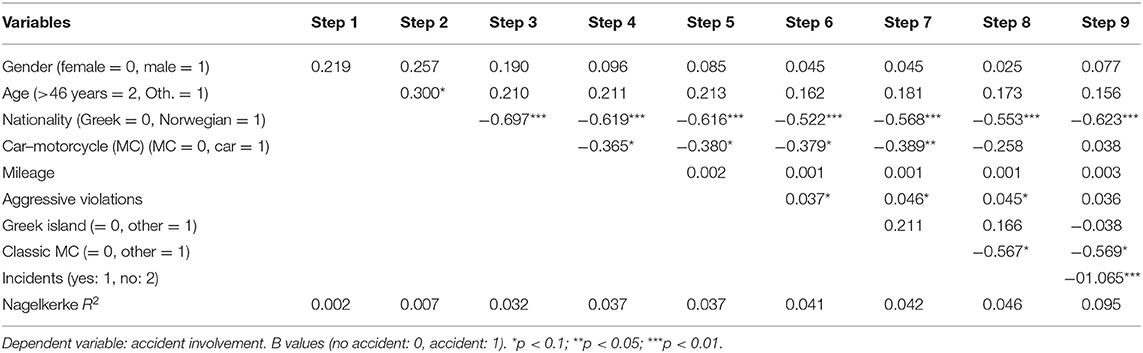
Table 8. Logistic regression.
Table 8 indicates five main results. The first main result is that previous incidents is the variable with the strongest contribution to the riders' and the drivers' accident involvement. The contribution is negative as the experience of incidents (“yes”) is coded as 0, while “no incidents” is coded as 1. Thus, we see a relationship between accidents and near-accidents in the data, which also is related to behaviors (i.e., aggressive violations). We discuss that further below.
The second main result is that nationality is the variable with the second strongest contribution to accident involvement, controlling for the other variables in the analysis. The value is negative, indicating that being Norwegian involves a lower risk of being involved in an accident, controlling for the other variables in the analyses.
Third, the analysis also indicates that motorcycle type is related to accident involvement. Classic MC contributes significantly and negatively, indicating a relationship with accident involvement, controlling for the other variables in the analyses.
Fourth, aggressive violations contribute significantly to the drivers' and the riders' accident involvement. This means that the more involved riders and drivers are involved in this type of behavior, the more likely they are to be involved in accidents. Aggressive violations cease, however, to contribute significantly to accident involvement in step 9, indicating a close relationship between aggressive violations and incident involvement, which also is strongly related to accident involvement.
Fifth, the analysis also indicates the importance of the car vs. MC dimension for accident involvement (in addition to the national dimension). This variable contributed significantly in steps 4–7, until classic MC was included in the analysis. Thus, the contribution of classic MC in steps 8 and 9 represents a higher accident risk of motorcycle riders.
The Nagelkerke R2 indicates the amount of variance in the dependent variable that is explained by the independent variables in the models. In step 9, the Nagelkerke R2 is 0.095, which indicates that the independent variables explain 10% of the variance in the respondents' accident involvement.
Concluding Discussion
Road Safety Behaviors Among Riders and Drivers
The first aim of the study was to compare the road safety behaviors among car drivers and motorcyclists in Norway and Greece. This was done to identify the shared patterns of behaviors in the studied groups (country, mode, and region), which make up the first element in our operationalization of RSC.
First, we expected the road safety behaviors to vary according to nationality (hypothesis 1), involving more overspeeding among the Norwegian respondents than among the Greeks and more aggressive violations among the Greek respondents than among the Norwegians (Özkan et al., 2006; Warner et al., 2011). The results only partly supported this hypothesis when it comes to overspeeding: the results only indicated significantly more overspeeding among riders in the Norwegian sample. Thus, our result is not in accordance with previous research, which indicates higher speed levels among car drivers in northern countries (Özkan et al., 2006; Warner et al., 2011).
The results supported hypothesis 1 concerning the importance of nationality when it comes to aggressive violations. In line with previous research (Özkan et al., 2006; Warner et al., 2011), we found higher levels of aggressive violations among both Greek drivers and riders compared with the Norwegians, and the scores were relatively similar for riders and drivers within countries.
Second, we expected the road safety behaviors to vary according to transport mode, indicating the influence of mode on road safety behaviors (hypothesis 2). Based on previous research, we expected higher levels of overspeeding among riders (Bjørnskau et al., 2012; DaCoTA, 2012). Our results only partly supported this hypothesis when it comes to overspeeding as we found significantly higher levels of overspeeding among the Norwegian riders, but not among the Greek riders. Based on Rowden et al. (2016), we expected lower levels of aggressive violations among motorcyclists, presumably as the relative lack of protection offered to motorcycles may cause the riders to feel more vulnerable and, therefore, to be less aggressive. Our results are not in accordance with this. We found similar levels of aggressive violations among both riders and drivers.
Third, we expected region/community to influence road safety behaviors, especially on the Greek island, which in some respects is a geographically enclosed community (hypothesis 3). Our results support this hypothesis when it comes to the Greek island, but not when it comes to the Norwegian regions. The results indicate that the riders and the drivers on the Greek island had the highest scores on the overspeeding index, also indicating the importance of region for overspeeding. They also had the highest scores on the aggressive violations index, indicating a higher prevalence of such behaviors among riders and drivers on the Greek island. These results indicate the importance of region for road safety behaviors, in accordance with hypothesis 3 and previous research (cf. Luria et al., 2014; Rakauskas et al., 2009).
Factors Influencing Road Safety Behaviors
The second aim of the study was to examine the factors influencing the road safety behaviors in the different groups. We conducted regression analyses to examine this, focusing on the behaviors that were significantly correlated with accident involvement (aggressive violations).
The Mediating Effect of Descriptive Norms
In accordance with results for the comparisons of means (and hypothesis 1), the regression analysis indicates the influence of nationality on aggressive violations. Nationality was an important predictor of aggressive violations until descriptive norms was included in the analysis. Comparing the means on the descriptive norms index, we found significantly higher scores among the Greek respondents than the Norwegian respondents and relatively similar scores among riders and drivers within countries. In Norway, we saw similar scores for both drivers and riders in the three Norwegian regions, indicating common descriptive norms among Norwegian respondents.
Descriptive norms refer to the individuals' perceptions of what other drivers in their country do (cf. Cialdini et al., 1991). In the regression analyses with aggressive violations as the dependent variable, the effect of nationality was mediated by descriptive norms as the contribution of nationality was removed when descriptive norms were included in the analysis (cf. steps 3 and 4, Table 6). Descriptive norms was the second most important variable influencing aggressive violations. Thus, our analyses indicate that descriptive norms is an essential variable in the analyses, providing an important explanation to the relationship between nationality and road safety behaviors. This is in accordance with previous research indicating that descriptive norms may influence behavior by providing information about what is normal and expected in certain groups (Cialdini et al., 1991).
The Influence of Region in the Greek Sample
The regression analyses indicate that region (i.e., Greek island) was the most important predictor of aggressive violations. These results are in accordance with hypothesis 3, and previous research indicates the importance of the regional level or the community level as a source of RSC (Rakauskas et al., 2009; Luria et al., 2014). Our results seem to indicate an “island effect,” with significantly different patterns of road safety behaviors and descriptive norms on the island. In the case of the Greek island, the data seem to indicate a unique regional RSC. The results indicate that riders and drivers from the Greek island stand out in several respects: they report of a higher prevalence of overspeeding and aggressive violations, and their scores on the descriptive norms index were significantly higher than those of the other studied groups. The latter indicate that they attribute higher levels of aggression and violations to other drivers on the island.
The descriptive norms index focuses on the national level, asking the respondents about their expectations to other drivers when driving in their respective countries. As noted, we can, however, generally expect that riders and drivers primarily assess this based on their experiences with the drivers on their local roads and in the regions where they usually drive, and that the scope of the respondents' daily geographical driving environment limits their experiences. This means, for instance, that the expectations of riders/drivers on the island to “other road users in their country” largely are based on their experiences with local drivers from their island. Thus, it seems that we can also use this index to measure differences in regional RSCs. The correlation between the Greek island and the descriptive norms index is indicated by the reduction in the contribution of the latter variable (steps 6 and 7 in the linear regression analyses in Table 6), when the former variable is included. This is caused by the fact that the respondents on the Greek island expect more aggressive violations from other drivers (cf. Table 5).
The Influence of the Car vs. the Motorcycle Dimension
Contrary to hypothesis 2, our results do not indicate that transport mode (car vs. motorcycle) is an important influence on road safety behaviors, even though cars and motorcycles are different in several respects: physical vulnerability and accident risk. This is contrary to previous research indicating lower levels of aggressive violations among riders (Rowden et al., 2016) and higher levels of overspeeding (Bjørnskau et al., 2012; DaCoTA, 2012). It should, however, be mentioned that we found higher levels of overspeeding among Norwegian riders. The little importance of mode in the material could also be due to the relatively different types of riders in the two countries, as noted in the section Recruitment of respondents. While motorcycle riding generally is a seasonal (summer) activity in Norway, which often is related to leisure (e.g., Bjørnskau et al., 2012), Greece has a higher ownership rate, and motorcycles and mopeds are used more for everyday transport. To make the samples more comparable, we only included motorcycles from both countries. We see, however, that almost all the Norwegian motorcycles (98%) had an engine capacity of over 500 ccm, while this only applied to 23% of the Greek respondents. We have also seen that the most prevalent motorcycle types differ in the two countries, with touring (44%) being the most prevalent in Norway, while it was scooter (55%) in Greece.
The Influence of Demographic Variables
The regression analyses indicate that aggressive violations were influenced by demographic variables. In accordance with previous research (cf. Parker et al., 1998; Bjørnskau et al., 2012; DaCoTA, 2012), we found that female drivers and riders and older drivers and riders are less likely to be involved in unsafe behaviors. Finally, in accordance with previous research (Sucha et al., 2014), we also found lower levels of aggresive violations with increasing levels of education.
Factors Influencing Accident Involvement
The third aim of the study was to examine the relationship between road safety behaviors and accident involvement. We examined the bivariate relationships between the studied road safety behaviors and accident involvement. Contrary to previous research, these analyses do not indicate a relationship between the riders' and the drivers' overspeeding and accident involvement (e.g., Bjørnskau et al., 2012; DaCoTA, 2012). Only aggressive violations were correlated with accident involvement. Based on results from the bivariate analyses, aggressive violations were included in the logistic regression analyses of variables that predict accident involvement. One of the main results of this analysis was that aggressive violations were related to the drivers' and the riders' accident involvement, in accordance with the results of Warner et al. (2011), who found this behavior to predict accident involvement in the Greek sample of car drivers. The results also indicate that this behavior was related to involvement in “traffic incidents,” as aggressive violations ceased to contribute significantly when we included “traffic incidents.” In accordance with previous research, the results also indicated a higher risk for motorcycle riders (Bjørnskau et al., 2012; Yannis et al., 2017) and Greek respondents (European Transport Safety Council, 2019).
Questions for Future Research
In the introduction, we stressed that little is known about how RSC comes about in the sociocultural contexts that are not work organizations and that it is important to examine the influence of different sociocultural contexts on the different road safety behaviors. The purpose of this was to illuminate (1) the socio-cultural mechanisms through which RSC influences the behaviors of non-professional road users, (2) the analytical levels which preventive measures should be directed, and (3) the processes through which RSC are created.
How RSC Influences Road Safety Behaviors
When it comes to the issue of how RSC influences the behaviors of non-professional road users, we hypothesize that it influences through descriptive norms, by providing information about what is normal and expected among other drivers in the country or the regions of the respondents (Cialdini et al., 1991). Thus, the mechanism explaining the relationship between descriptive norms and road safety behaviors is subtle social pressure to behave in accordance with “what is normal” among other drivers in these groups (cf. Nævestad et al., 2019a). Ward et al. (2010) assert that research on road safety culture often seems to lack an explanation of the theoretical link between safety culture and safety behaviors. Future research should examine further the importance and the potential of such subtle social pressure. Our research indicates that memberships in sociocultural groups constitutes an important influence on behaviors, which also is related to accident involvement. Thus, influencing the power of sociocultural ties could lead to reductions in accidents. We expand further on this below.
The Analytical Levels Which Preventive Measures Should Be Directed
Second, when it comes to the analytical levels which preventive measures should be directed, we have examined the importance of three different levels that influence road safety behaviors in the present study: (1) country, (2) region, and (3) transport mode. Our analyses by and large indicate that, when it comes to facilitating RSC, nation and region are far more important than transport mode, e.g., car vs. motorcycle. We have argued that the results indicate a Norwegian RSC shared by both riders and drivers across three regions. Additionally, the results indicate a unique regional RSC on the Greek island. Thus, our data indicate that measures to influence road safety behaviors and RSC should focus on geographical units (country and regions) rather than on specific groups of road users (e.g., car vs. motorcycle). The significance of geography for RSC was also indicated by Luria et al. (2014). These results require a discussion of the factors that influence national and regional RSC.
The Processes Through Which RSC Are Created
First, previous research indicates that road user interaction seems to be an important source of RSC as road users continuously (re)create norms for behavior by behaving in certain ways, sanctioning unwanted behaviors, etc. (Özkan et al., 2006; Bjørnskau, 2017). In this manner, norms for commonly accepted behaviors may be created. We have, however, not examined interaction specifically, indicating the need for future research (cf. Bjørnskau, 2017). Second, the interaction of road users and road user behaviors can be influenced by infrastructure, e.g., road markings, the design of junctions, and road capacity (Özkan et al., 2006). We have not examined this in the present paper, and this should be an important issue for future research. Third, certain road safety behaviors and thus expectations to other road users can, to some extent, be “normalized” in formal driver training (Nævestad et al., 2019a). We have, however, not examined this specifically. Finally, the perceived level of enforcement in a country is also a relevant factor (Özkan et al., 2006). This should also be examined in future research.
The importance of region in the Greek data indicates the importance of local interaction processes in the daily (re)creation of RSC. This is also indicated by the similarities between riders and drivers within the studied regions. The most important thing that these groups have in common seem to be the roads that they share, where they continuously create and recreate RSC. When it comes to the Greek island, it should also be noted that regional RSC also may be influenced by the type and the composition of road users in a region (e.g., a high proportion of old drivers and tourists) (Nævestad et al., 2019a). These are important issues for future research that we have been unable to examine. Moreover, the perceived level of enforcement on the island may also influence behaviors and RSC (Özkan et al., 2006). The same applies to the local authorities' focus on traffic safety. These factors may be different on an island compared to the rest of the country. The same applies to infrastructure, e.g., road markings, the design of junctions, and road capacity (Özkan et al., 2006).
In the Norwegian sample, we found relatively similar descriptive norms and road safety behaviors across modes in the three studied regions. This could also be due to interaction, but in this context, it is important to note that county 2 is about 2,600 km apart from county 1 and 2,400 km apart from Oslo. Based on this, we should perhaps not expect the interaction between the road users from the different regions to be an important explanation of their common RSC and common road safety behaviors. Given the physical distance and the geographical limitations to direct road user interaction, we should perhaps expect other factors to be important when it comes to communicating national norms for “normal” behaviors in traffic. Such factors could, for instance, be formal and standardized driver training, police enforcement, media, and of course also by traveling to other parts of the country and interacting in the traffic there. The significance of all these factors should be examined in future research. This especially applies to the social processes that may induce changes in norms and road safety behaviors. Moreover, Luria et al. (2014) also discuss the possibilities of using safety culture interventions that have proven to be effective in organizations at the community level to improve community RSC. This is an important issue for future research. As noted, the safety culture intervention studied by Gregersen et al. (1996), which involved group discussions, involved a 60% reduction in the accident risk.
Methodological Limitations
Different Recruitment of Respondents in the Two Countries
The recruitment of respondents, motivational measures, and administration of the surveys were different in the two countries (cf. section Recruitment of Respondents). This is a potential methodological weakness of the study which is important to bear in mind when interpreting the results. The car drivers in Norway were recruited through the database of the postal service, they got survey links per e-mail, and they answered the survey online using their computers, tablets, etc. The motorcycle riders in Norway were recruited through the motorcycle union, and they answered online. The car drivers and motorcycle riders in Greece, on the other hand, were recruited through a marketing research company in Greece, which was under the scientific supervision of researchers from the NTUA. They answered the survey orally, in direct contact with the interviewers from the marketing research company. This approach was chosen to motivate the Greek respondents to participate. As the recruitment of drivers and riders in Greece was difficult, it was decided to approach candidates in person and explain the scope of the survey. This helped eliminate their doubts and fears about confidentiality and the use of the information they would provide. Similarly, as the recruitment of drivers and riders in Norway also was challenging, they were informed that they could participate in a draw for a present card of 2,000 NOK. The different ways of recruitment reflect different national opportunities for racing car driver and motorcycle rider respondents in different regions in the two countries. The different ways of administering the surveys and motivating the respondents were implemented to get as many as possible to participate. It is important to remember the different national answering contexts when interpreting the results. The respondents may, for instance, be more inhibited when answering surveys face to face than alone on their computer. This could potentially mean that the respondents who answer face to face under-report their own risk taking behavior. In the present study, we have, however, seen the opposite: the Greek respondents, especially those from the island, report of more aggressive violations and also the highest levels of overspeeding (on the Greek island). Thus, it does not seem that this potential bias has had a significant influence on the answers. Moreover, in a recent Norwegian study of safety culture, which employed different answering techniques (web form and orally), we did not find significant differences between respondents answering the survey in different ways (Nævestad et al., 2018).
The Representativity of the Samples
When interpreting the results by drawing inferences about differences in national and regional RSC in the countries, it is also important to remember that the national samples are relatively small and that the respondents may not be representative of the respective national populations of car drivers and motorcycle riders.
First, our comparisons of the respondents on key variables (Tables 1, 2) indicate that the age and the sex compositions are slightly different in the national samples, with somewhat more women and more respondents in the oldest age category in the Norwegian sample. Although the potential confounding effects of these variables are tested in the regression analyses, that does not negate the fact that the samples are not “equal” with respect to demographic representation. Thus, we should take care when making conclusions about the different national RSCs based on the present study. Moreover, the response rate is low in the Norwegian samples of car drivers (about 10%), which also requires a check of the representativity of the national samples. Because of the recruitment technique employed for the Greek respondents, we are unfortunately unable to calculate the response rate in these samples. The challenges related to recruiting respondents in the two countries and the low response rate among the Norwegian car drivers warrant a discussion of whether the sample of respondents that chose to respond in the two countries is unbiased. With such a low response rate, there is a danger of systematic “self-recruitment” and “self-exclusion,” meaning that only some groups chose to participate. This requires a comparison of our samples with official statistics to validate the sample data. We therefore obtained aggregated official data on car license and motorcycle license holders in Norway and Greece (cf. Table 9).
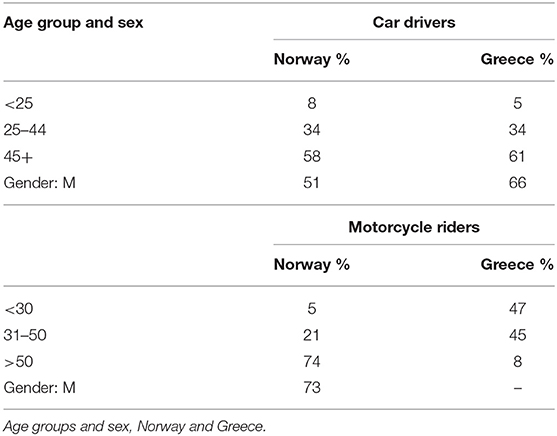
Table 9. Aggregated data on private car license holders and motorcycle license holders in Norway and Greece.
The data in Table 9 show that there is a share of 51% males among Norwegian car license holders as compared to 59% in the survey (cf. Table 1). The corresponding share for car drivers in Greece was 66% as compared to 64% in the survey (cf. Table 1). This indicates that women are somewhat under-represented in the Norwegian car driver sample. The aggregated data for age groups in the two countries (cf. Table 2) are not totally comparable to the age groups applied in Table 9, but they indicate that the proportions of car drivers of 45 years and older are under-represented in the samples from both countries, but especially in the Greek sample. Drivers between 25 and 44 years are over-represented in both national samples. The data in Table 9 indicate that the age groups in the Norwegian motorcycle driver sample is relatively comparable to the population of license holders, although the compared age categories are not entirely similar. When we compare the distribution of males and females in the Norwegian motorcycle rider sample (Table 1) and in the population (Table 8) of Norwegian motorcycle license holders, we see, however, that women are under-represented in our sample. There were no data on the education level of the car drivers or motorcycle license holders in the two countries. Unfortunately, the Greek motorcycle license data only refer to licenses issued between 2008 and 2017, that is why the percentage for older drivers is so low. It is unfortunately difficult to assess the representativity based on these data. Shares for sex are also missing in the Greek motorcycle license data.
Second, it should also be mentioned that the regions outside the capitals in both countries are strategically sampled based on the hypothesis about regional RSCs that might differ from those in the capital. This hypothesis was supported in the case of Greece, but not in the case of Norway. However, an argument indicating that our national samples nevertheless seem to reflect differences in national RSCs, shared by both motorcycle riders and car drivers in the two countries, is that the observed national differences are also in accordance with previous research, which reports more aggressive violations in southern countries (Özkan et al., 2006; Warner et al., 2011). These arguments indicate the validity of our conclusions about national RSC. Additionally, our main results about RSC are also in line with our other studies, which also includes professional drivers, e.g., bus drivers (Nævestad et al., 2019b), and HGV drivers in Norway and Greece (Nævestad et al., 2019a). Thus, our observations of national RSC in Norway and Greece are based on relatively similar reports from car drivers, motorcycle riders, bus drivers, and HGV drivers in Norway and Greece. These groups attribute fairly similar behaviors to other drivers in their respective countries. This indicates that we may draw conlcusions about different national RSC based on our study.
Finally, we also draw conclusions about the significance of regional RSC based on our data, and we have seen that the respondents on the Greek island differed from the other groups in several demographic respects. The share of respondents over 46 years old was, for instance, lowest on the Greek island (18%), while it was three times higher in the Norwegian county 2 (60%). We unfortunately lack data on the rider and the driver populations in the five regions, and we are therefore unable to evaluate the representativeness of the sampled riders and drivers in the regions. We control, however, for demographic characteristics (e.g., age, sex, and education) in the regression analyses, and these indicate an effect of Greek island, controlling for these variables. That indicates that our results concerning region is not caused by bias from demographic variables. Additionally, we see relatively similar reports from both riders and drivers from the island. Finally, we can also compare the scores for comparable groups by controlling for gender, age, and education. Table 10 shows the mean scores for men aged between 26 and 45 years, with high school or 3–4 years of university education in the five regions.
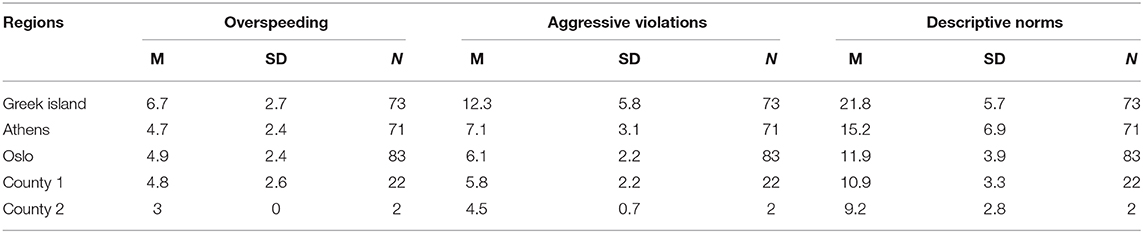
Table 10. Scores for behavior and descriptive norms for men aged between 26 and 45 years, with high school or 3–4 years of university education in the five regions.
The comparisons in Table 10 indicate that the differences between the regions are maintained and relatively similar to those observed in Tables 3–5. Thus, the observed regional differences do not seem to be due to differences in the demographic compositions of the regional samples. This comparison is not the same as making an assessment of representativeness as we may assume that the populations of riders/drivers in the different regions may be different, and in several cases, this can be one of the explanations for different regional RSCs.
To conclude, the issue of representativeness is, however, always crucial, and as the present study has some deficiencies in this regard, more studies are required to arrive at robust conclusions. Thus, to further develop our knowledge about RSC and to obtain even more accurate results, we suggest that future research on this subject should cover larger samples of road users.
False Consensus?
RSC is partly measured as descriptive norms. A potential critique that can be raised against the identification of the descriptive norms mechanism is that it also may influence behavior through the false consensus bias, which means that people overestimate the prevalence of risky behavior among others to justify their own behavior (Cialdini et al., 1991). However, the fact that we find that both car drivers and motorcycle riders independently of each other attribute approximately the same level of violations to other road users in their respective countries (and within the five studied regions) indicates that our results, to some extent, reflect differences in national (and regional) RSCs. Moreover, the descriptive norms scores do not follow directly the road safety behavior scores, e.g., for riders and drivers on the Greek island.
Conclusion
The present study indicates that road users' memberships in different sociocultural groups is important for road safety as it influences the road safety behaviors of both drivers and riders, which in turn is related to accident involvement. We have found that geographical variables like country and region seem to be important for RSC, presumably as interaction between road users is a key process in which RSC is (re)created. Membership in such sociocultural groups seem to influence road safety behaviors through the road users' perceptions about the behaviors that are “normal” and expected in their country and on their local roads. Future research should examine how these important social impacts on behavior can be influenced in manners that lead to increased road safety.
Data Availability Statement
The raw data supporting the conclusions of this article will be made available by the authors, without undue reservation, to any qualified researcher.
Ethics Statement
The studies involving human participants were reviewed and approved by NSD. Written informed consent for participation was not required for this study in accordance with the national legislation and the institutional requirements.
Author Contributions
T-ON, AL, and GY have cooperated on the planning and design of the study, data collection in Norway and Greece, conceptual development, and interpretation of results. T-ON has conducted most of the analyses and writing of the draft, with substantial contributions from AL and GY. T-ON, AL, and GY are accountable for all aspects of the work. All authors contributed to the article and approved the submitted version.
Funding
This research was funded by the Norwegian Research Council's Transport 2025 program, grant number 250298.
Conflict of Interest
The authors declare that the research was conducted in the absence of any commercial or financial relationships that could be construed as a potential conflict of interest.
References
Berkowitz, A. D. (2005). “An overview of the social norms approach,” in Changing the Culture of College Drinking: A Socially Situated Health Communication Campaign, eds L. Lederman, L. Stewart (Creskill, NJ: Hampton Press, 193–214.
Bjørnskau, T. (2017). The zebra crossing game–using game theory to explain a discrepancy between road user behaviour and traffic rules. Saf. Sci. 92, 298–301. doi: 10.1016/j.ssci.2015.10.007
Bjørnskau, T., Nævestad, T.-O., and Akhtar, M. J. (2012). Traffic safety among motorcyclists in norway: a study of subgroups and risk factors. Accid. Anal. Prev. 49, 50–57. doi: 10.1016/j.aap.2011.09.051
Bjørnskau, T.. (2015). Road Traffic Risk in Norway 2013/14 TØI Report 1448/2015. Oslo: Institute of Transport Economics.
Cialdini, R. B., Reno, R. R., and Kallgren, C. A. (1991). A focus theory of normative conduct: recycling the concept of norms to reduce littering in public places. J. Pers. Soc. Psychol. 58, 1015–26. doi: 10.1037/0022-3514.58.6.1015
DaCoTA (2012). Powered Two Wheelers. Deliverable 4.8n of the EC FP7 project DaCoTA. Available online at: http://safetyknowsys.swov.nl/Safety_issues/pdf/PWT.pdf (accessed April 24, 2020).
De Winter, J. C., and Dodou, D. (2010). The driver behaviour questionnaire as a predictor of accidents: a meta-analysis. J. Saf. Res. 41, 463–470. doi: 10.1016/j.jsr.2010.10.007
Edwards, J., Freeman, J., Soole, D., and Watson, B. (2014). A framework for conceptualizing traffic safety culture. Trans. Res. F Traffic Psychol. Behav. 26, 293–302. doi: 10.1016/j.trf.2014.03.002
Elvik, R., Vaa, T., Erke, A., and Sørensen, M. (2009). The Handbook of Road Safety Measures. Bingley: Emerald Group Publishing. doi: 10.1108/9781848552517
European Transport Safety Council (2019). RANKING EU PROGRESS ON ROAD SAFETY, 13th Road Safety Performance Index Report. Available online at: https://etsc.eu/wp-content/uploads/AR_2019-Final.pdf (accessed June 20, 2019).
Gregersen, N. P., Brehmer, B., and Morén, B. (1996). Road safety improvement in large companies. An experimental comparison of different measures. Accid. Anal. Prev. 28, 297–306. doi: 10.1016/0001-4575(95)00060-7
Luria, G., Boehm, A., and Mazor, T. (2014). Conceptualizing and measuring community road-safety climate. Saf. Sci. 70, 288–294. doi: 10.1016/j.ssci.2014.07.003
Nævestad, T.-O. (2010). Cultures, crises and campaigns: examining the role of safety culture in the management of hazards in a high risk industry (Ph.D. dissertation), Centre for Technology, Innovation and Culture, Faculty of Social Sciences, University of Oslo, Oslo, Norway.
Nævestad, T.-O., and Bjørnskau, T. (2012). How can the safety culture perspective be applied to road traffic? Transp. Rev. 32, 139–154. doi: 10.1080/01441647.2011.628131
Nævestad, T.-O., Bjørnskau, T., Laiou, A., and Yannis, G. (2019c). “Road safety culture among car drivers and motorcycle riders in Greece: examining influencing factors,” in 9th International Congress on Transportation Research, October 24th−25th 2019 (Athens).
Nævestad, T.-O., Blom, J., and Phillips, R. O. (2018). Sikkerhetskultur, sikkerhetsledelse og risiko i godstransportbedrifter på veg, TøI rapport 1659/2018. Oslo: Transportøkonomisk institutt.
Nævestad, T.-O., Laiou, A., Phillips, R. O., Bjørnskau, T., and Yannis, G. (2019a). Safety culture among private and professional drivers in Norway and Greece: examining the in?uence of national road safety culture. Safety 5:20. doi: 10.3390/safety5020020
Nævestad, T.-O., Phillips, R. O., Laiou, A., Bjørnskau, T., and Yannis, G. (2019b). Safety culture among bus drivers in Norway and Greece. Transp. Res. F 64, 323–341. doi: 10.1016/j.trf.2019.05.006
Özkan, T., Lajunen, Chliaoutakis, J., Parker, D., and Summala, H. (2006). Cross-cultural differences in driving behaviours: a comparison of six countries. Transp. Res. F 9, 227–242. doi: 10.1016/j.trf.2006.01.002
Parker, D., Lajunen, T., and Stradling, S. (1998). Attitudinal predictors of aggressive driving violations. Transp. Res. F 1998, 11–24. doi: 10.1016/S1369-8478(98)00002-3
Rakauskas, M., Ward, N., and Gerberich, S. (2009). Identification of differences between rural and urban safety cultures. Accid. Anal. Prev. 41, 931–937. doi: 10.1016/j.aap.2009.05.008
Rowden, P., Watson, B., Haworth, N., Lennon, A., Shaw, L., Blackman, R., et al. (2016). Motorcycle riders' self-reported aggression when riding compared with car driving. Transp. Res. F Traffic Psychol. Behav. 36, 92–103. doi: 10.1016/j.trf.2015.11.006
Storesund Hesjevoll, I., and Fyhri, A. (2017). Trafikksikkerhetstilstanden 2016 Befolkningens Kunnskaper, Atferd og Holdninger, TØI Rapport 1573/2017. Oslo: Transportøkonomisk Institutt.
Strandroth, J., and Person, J. (2005). Motorcykelulyckor med Dödlig Utgång: Analys av Vägverkets Djupstudie Material 2000–2003. Borlänge: Vägverket.
Sucha, M., Sramkova, L., and Risser, R. (2014) The manchester driver behaviour questionnaire: self-reports of aberrant behaviour among czech drivers. Eur. Transp. Res. Rev. 6, 493–502. doi: 10.1007/s12544-014-0147-z
Tunnicliff, D., Watson, B., White, K. M., Lewis, I., and Wishart, D. (2011). The socialans context of motorcycle riding and the key determinants influencing rider behaviour: a qualitative investigation. Traffic Injury Prev. 12, 363–376. doi: 10.1080/15389588.2011.577653
Ward, N. J., Linkenbach, J., Keller, S. N., and Otto, J. (2010). White Paper on Traffic Safety Culture. 2010: White Papers for “Toward Zero Deaths: A National Strategy for Highway Safety” Series–White Paper No. 2. Bozeman, MT: Montana State University.
Warner, H. W., Özkan, T., Lajunen, T., and Tzamalouka, G. (2011). Cross-cultural comparison of drivers' tendency to commit different aberrant driving behaviours. Transp. Res. F 14, 390–399. doi: 10.1016/j.trf.2011.04.006
WHO (2018). Available online at: https://www.who.int/news-room/fact-sheets/detail/road-traffic-injuries (accessed April 22, 2020)
Keywords: road safety culture, motorcycle riders, car drivers, Norway, Greece
Citation: Nævestad T-O, Laiou A and Yannis G (2020) Safety Culture Among Car Drivers and Motorcycle Riders in Norway and Greece: Examining the Influence of Nationality, Region, and Transport Mode. Front. Sustain. Cities 2:23. doi: 10.3389/frsc.2020.00023
Received: 06 March 2020; Accepted: 05 May 2020;
Published: 08 July 2020.
Edited by:
Krzysztof Goniewicz, Military University of Aviation, PolandReviewed by:
James Damsere-Derry, Council for Scientific and Industrial Research, GhanaBjörn Lidestam, Linköping University, Sweden
Copyright © 2020 Nævestad, Laiou and Yannis. This is an open-access article distributed under the terms of the Creative Commons Attribution License (CC BY). The use, distribution or reproduction in other forums is permitted, provided the original author(s) and the copyright owner(s) are credited and that the original publication in this journal is cited, in accordance with accepted academic practice. No use, distribution or reproduction is permitted which does not comply with these terms.
*Correspondence: Tor-Olav Nævestad, dG9uJiN4MDAwNDA7dG9pLm5v