
94% of researchers rate our articles as excellent or good
Learn more about the work of our research integrity team to safeguard the quality of each article we publish.
Find out more
ORIGINAL RESEARCH article
Front. Psychiatry , 12 May 2020
Sec. Public Mental Health
Volume 11 - 2020 | https://doi.org/10.3389/fpsyt.2020.00422
This article is part of the Research Topic Digital Phenotyping/Digital Biomarkers to Monitor Psychiatric Disorders View all 15 articles
 Yicheng Long1,2
 Zhening Liu1,2Calais Kin Yuen Chan3Guowei Wu1,2
 Zhimin Xue1,2
 Yunzhi Pan2Xudong Chen1,2Xiaojun Huang1,2Dan Li4*
 Weidan Pu5*
Schizophrenia and bipolar disorder share some common clinical features and are both characterized by aberrant resting-state functional connectivity (FC). However, little is known about the common and specific aberrant features of the dynamic FC patterns in these two disorders. In this study, we explored the differences in dynamic FC among schizophrenia patients (n = 66), type I bipolar disorder patients (n = 53), and healthy controls (n = 66), by comparing temporal variabilities of FC patterns involved in specific brain regions and large-scale brain networks. Compared with healthy controls, both patient groups showed significantly increased regional FC variabilities in subcortical areas including the thalamus and basal ganglia, as well as increased inter-network FC variability between the thalamus and sensorimotor areas. Specifically, more widespread changes were found in the schizophrenia group, involving increased FC variabilities in sensorimotor, visual, attention, limbic and subcortical areas at both regional and network levels, as well as decreased regional FC variabilities in the default-mode areas. The observed alterations shared by schizophrenia and bipolar disorder may help to explain their overlapped clinical features; meanwhile, the schizophrenia-specific abnormalities in a wider range may support that schizophrenia is associated with more severe functional brain deficits than bipolar disorder. Together, these findings highlight the potentials of using dynamic FC as an objective biomarker for the monitoring and diagnosis of either schizophrenia or bipolar disorder.
Schizophrenia and bipolar disorder are two of the most disabling psychiatric disorders worldwide, which are often misdiagnosed in clinical practice because of their overlap in clinical features. These common features entail both cognitive deficits and psychotic symptoms including hallucinations, delusions, and disorganized thinking (1–3). Over the years, neuroimaging studies using resting-state functional magnetic resonance imaging (rs-fMRI) have provided evidence for both shared and distinct disturbances in brain functions, as characterized by aberrant resting-state functional connectivity (FC), in the schizophrenia and bipolar disorder (4–7). For instance, when compared with healthy subjects, over-connectivity between the thalamus and sensorimotor cortices was commonly found in both schizophrenia and bipolar disorder patients (4, 8). On the other hand, other unique abnormalities such as hypo-connectivity within frontal–parietal areas were shown only in schizophrenia but not bipolar disorder patients (7). Appreciably, these findings have significantly advanced our understanding of the complex relationship between these severe disorders.
Most previous rs-fMRI studies were performed under the assumption that patterns of brain FC are stationary during the entire scanning period. Yet, it has been newly proven that the brain FC fluctuates over time even during the resting-sate, implying that conventional static FC methodology may be unable to fully depict the functional architecture of brain (9, 10). Therefore, the “dynamic FC” has become a hot-spot in rs-fMRI studies to capture the temporal fluctuations of brain FC patterns during the scan (11). Notably, the dynamic features of FC have been associated with a wide range of cognitive and affective processes such as learning (12), executive cognition (13), psychological resilience (14), and emotion (15), as well as multiple common psychiatric and neurological disorders such as autism (16), Alzheimer’s disease (17), and major depressive disorder (18, 19). These findings thus highlight the importance of studying dynamic FC for further improving our understanding of both brain functions and dysfunctions.
Despite the accumulating knowledge on dynamic FC, it remains little known about if there are common and/or specific changes in dynamic features of FC in schizophrenia and bipolar disorder. To our knowledge, there have been only a limited number of efforts to date to differentiate schizophrenia and bipolar disorder by features of dynamic FC (20–22). Furthermore, all these studies mainly focus on the dynamic “connectivity state” changes based on the whole-brain FC profiles; therefore, although features of such global connectivity states have been reported to provide a high predictive accuracy in classifying schizophrenia and bipolar disorder (20–22), how these two disorders differ from each other in terms of dynamic connectivity profiles within particular brain regions or systems remains poorly understood, and needs to be further investigated.
The above concerns can be addressed by a novel approach, as proposed in some latest works (23, 24), to investigate dynamic FC by defining and comparing the temporal variability of FC patterns involved in specific brain regions or large-scale brain networks. This approach allows localization of those brain regions or networks showing significant group differences in FC variability, thus being helpful to identify aberrant dynamic FC patterns from the perspectives of both local and large-scale brain functional dynamics (24). In fact, using such an approach, the patients with schizophrenia have been recently found to show increased FC variabilities in sensory and perceptual systems (e.g. the sensorimotor network and thalamus) and decreased FC variabilities in high-order networks (e.g. the default-mode network) than healthy subjects at both regional and network levels (23). But to our knowledge, it remains unclear and needs to be tested whether these dynamic changes would be specific to schizophrenia, or shared with bipolar disorder.
Therefore, in this study, we aimed to explore the common and specific dynamic features of both local and large-scale resting-state FC, in terms of temporal variability, the schizophrenia and bipolar disorder. To reach this goal, groups of schizophrenia patients, bipolar disorder patients and healthy controls were recruited and scanned using rs-fMRI; applying a recently proposed novel methodological approach (23, 24), temporal variabilities of FC patterns were then compared among the groups at all the regional, intra-network, and inter-network levels. It was anticipated that our results would provide important complementary information to prior studies that mainly focused on the global dynamic FC states (20–22), and further improve our understanding about the relationship between schizophrenia and bipolar disorder from a dynamic brain functional perspective.
According to the Diagnostic and Statistical Manual of Mental Disorders-IV (DSM-IV) criteria, 78 patients with schizophrenia and 60 patients with type I bipolar disorder were recruited from the Second Xiangya Hospital of Central South University, Changsha, China; 69 age-, sex-, and education-matched healthy controls without any family history of psychiatric disorders were also recruited from the Changsha city. All participants were right-handed, Han Chinese adults with at least 9 years of education. All participants had no history of any substance abuse, any other neurological disorder, any contraindication to fMRI scanning or any history of electroconvulsive therapy. Because of excessive head motion (see Data Acquisition and Preprocessing), 12 schizophrenia patients, 7 bipolar disorder patients, and 3 healthy controls were excluded, and the final analyzed sample consisted of 66 schizophrenia patients, 53 bipolar disorder patients, and 66 healthy controls.
For the schizophrenia patients, severity of the current clinical symptoms was assessed using the Scale for Assessment of Positive Symptoms (SAPS) and the Scale for Assessment of Negative Symptoms (SANS) (25). For the patients with bipolar disorder, severity of the current mood and mania symptoms was assessed using the 17-item Hamilton Rating Scale for Depression (HAMD) (26) and the Young Mania Rating Scale (YMRS) (27), respectively. Dosages of antipsychotics in all patients were converted to chlorpromazine equivalence (28). In addition, all participants completed the Information (WAIS-I) and Digit Symbol (WAIS-DS) subtests of the Wechsler Adult Intelligence Scale (29), which measure two important domains of cognitive functions, verbal comprehension and processing speed, respectively (30, 31).
The study was approved by the Ethics Committee of the Second Xiangya Hospital of Central South University, and written informed consent was obtained from all participants.
The details about brain imaging data acquisition and preprocessing can be found in one of our recently published studies (14). Briefly, rs-fMRI and T1-weighted structural images were scanned for each participant on a 3.0 T Philips MRI scanner (repetition time = 2,000 ms, echo time = 30 ms, slice number = 36, field of view = 240 × 240 mm2, acquisition matrix = 144 × 144, flip angle = 90°, and number of time points = 250 for rs-fMRI images; repetition time = 7.5 ms, echo time = 3.7 ms, slice number = 180, field of view = 240 × 240 mm2, acquisition matrix = 256 × 200, and flip angle = 8° for T1-weighted images). Data preprocessing was performed using the standard pipeline of the DPARSF software (32, 33), including discarding the first 10 volumes, slice timing, head motion realignment, brain segmentation, spatial normalization, temporal filtering (0.01–0.10 Hz), and regressing out nuisance factors including the Friston-24 head motion parameters (34) as well as white matter and cerebrospinal fluid signals. Global signal regression (GSR) was not performed as it is still a controversial preprocessing option in rs-fMRI studies (35). Subjects with excessive head motion were excluded from the analysis, as determined by a mean framewise-displacement (FD) (36) > 0.2 mm.
After preprocessing, the mean time series were extracted from each of the 116 regions of interest (ROIs) in the Automated Anatomical Labeling (AAL) atlas (37), which was validated (38, 39) and widely used in functional neuroimaging studies (40, 41). The names of all the 116 ROIs were listed in Supplementary Table S1.
As shown in Figure 1, to characterize the temporal variability of FC, all the time series were segmented into n nonoverlapping time windows with a length of l. Within each time window, a 116 × 116 pairwise Pearson correlation matrix was calculated to represent the FC between each pair of ROIs within that window. The temporal variability of regional FC architecture in each ROI could then be estimated by computing the mean values of its dissimilarities among different windows. Briefly, temporal variability of the regional FC architecture in ROI k is defined by Equation (1):
where num is the number of time windows, and F(i, k) is the vector characterizing the FC architecture between ROI k and the whole brain within the ith time window (Figure 1) (19, 42, 43).
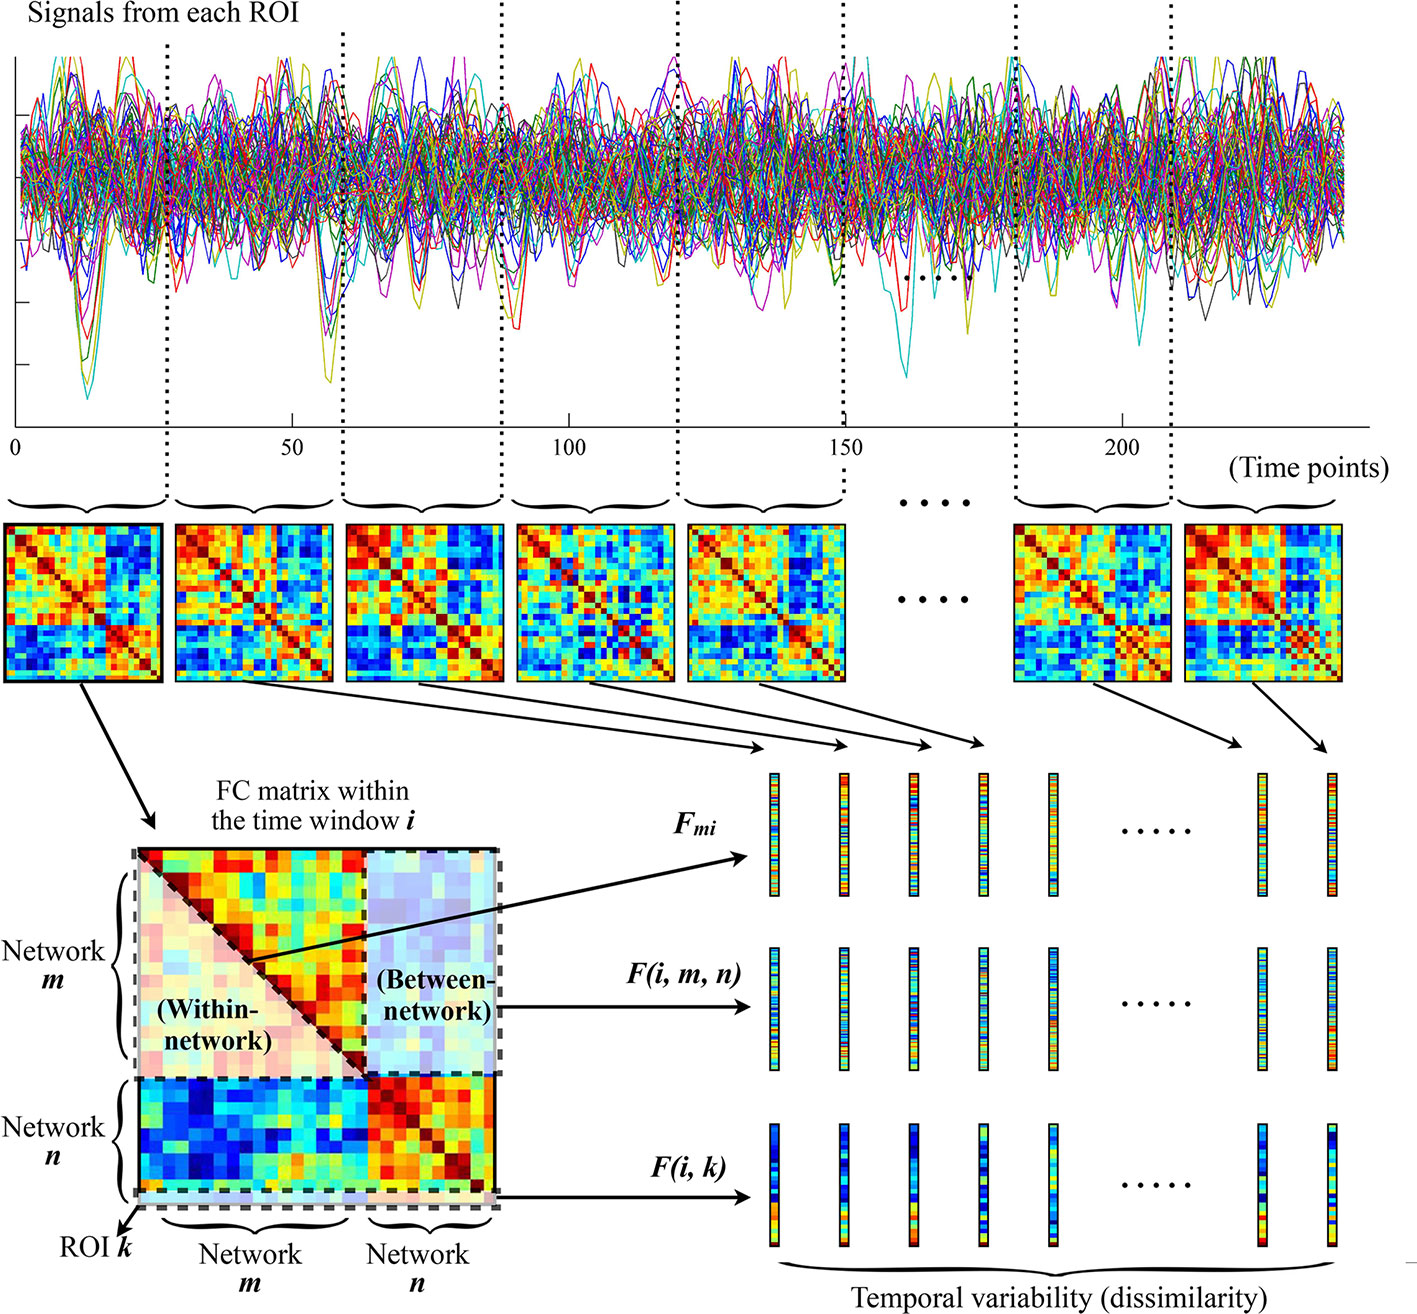
Figure 1 The procedures for computing temporal variabilities of FC patterns. Refer to the section Temporal Variability of FC for details. FC, functional connectivity; ROI, region of interest.
The temporal variability of FC was further estimated at the network level following recently published procedures (23, 24, 44). First, all brain ROIs were assigned into 11 prior networks as defined in previous studies (45, 46), including the sensorimotor network, visual network, auditory network, default-mode network, frontoparietal network, cingulo-opercular network, salience network, attention network, subcortical network, thalamus, and cerebellum (see Supplementary Table S1 for details about the network assignments). Note that the thalamus and cerebellum were treated as two independent networks here, given that they were poorly defined into different networks as well as their special roles in the pathophysiologic mechanisms of psychotic disorders (23, 47, 48). The temporal variabilities of intra-network and inter-network FC architectures were then calculated among the above 11 networks. Similar with the regional FC variability for each ROI, the intra-network FC variability for a network m is defined by Equation (2):
where num is the number of time windows, and Fmi is the vector characterizing the FC architecture between all ROIs belonging to the network m within the ith time window (Figure 1); the inter-network variability of FC between two networks m and n is defined by Equation (3):
where num is the number of time windows, and F(i, m, n) is the vector characterizing the FC architecture between the networks m and n within the ith time window (Figure 1) (23, 24, 44).
To reduce the influences from window length and segmentation scheme, all the above temporal variabilities were calculated with a set of different window lengths (l = 21, 22, …, 30 volumes, equal to 42, 44, …, 60 seconds); moreover, a total of l – 1 times segmentations were performed for a given window length l, and each time the segmentation was started from the sth time point (s = 1, 2, …, l – 1) (42). The final values of temporal variabilities were obtained by averaging all of these values. Note that such a selection of window lengths has been used in previous studies, and was suggested to be optimal for producing robust results (49, 50). As the result, in each subject, we finally obtained the temporal variabilities of regional FC for each of the 116 ROIs, intra-network FC for each of the 11 networks, and inter-network FCs for each possible pair of networks. All these values of temporal variabilities range from 0 to 2, and a higher value suggests a higher variability.
The demographic and clinical characteristics as well as mean FD were compared between groups using the two-sample t-test, Chi-square test or analysis of variance. Differences were considered significant at p < 0.05.
The temporal variabilities of FC patterns were compared between groups at all the regional, intra-network, and inter-network levels. The group differences were determined the by following statistic steps (49): 1) the analysis of covariance (ANCOVA) covarying for age, sex, education, and head motion (mean FD) was firstly applied to detect the significant main effect, with no multiple comparison corrections performed here for numbers of ROIs/networks considering the relatively small sample size; 2) post-hoc pairwise comparisons were adopted between all possible pairs of groups when the main effect was significant (p < 0.05); 3) the Bonferroni correction was applied to control the false-positive rate for multiple tests within the ANCOVA, and the groups differences were considered significant at corrected-p < 0.05.
For all the detected significant between-group differences, we further explored their possible relationships with the clinical and cognitive variables using Spearman’s rank correlation coefficient. Here, they were correlated with the illness duration, chlorpromazine equivalence, SAPS scores, SANS scores, HAMD scores, YMRS scores, WAIS-I scores, and WAIS-DS scores in both the entire sample and each group separately. The correlations were considered significant at p < 0.05.
A number of supplementary analyses were performed to validate our findings. First, we repeated the whole analyses without the GSR, to see if the results would change without such a controversial preprocessing step. Second, to evaluate whether the results were affected by unmatched clinical characteristics between groups, the whole analyses were repeated within a subset of 48 schizophrenia patients, 30 bipolar disorder patients, and 56 healthy controls, where the illness duration and antipsychotic dosage were matched between the schizophrenia and bipolar disorder groups (see Supplementary Table S4 for demographic and clinical characteristics of each group in the subset).
As shown in Table 1, there were no significant differences among the three groups in age, sex, and education (all p > 0.05). Shorter illness durations but higher antipsychotic doses (both p < 0.001) were observed in the schizophrenia patients compared with the bipolar disorder patients. Both the schizophrenia and bipolar disorder groups showed significantly lower WAIS-I and WAIS-DS scores (all p < 0.05, LSD post-hoc comparisons) compared with healthy controls, while there was no significant difference between the schizophrenia and bipolar disorder patients in WAIS-I and WAIS-DS scores. There was no significant difference among the three groups in head motion as measured by mean FD (F = 2.066, p = 0.130).
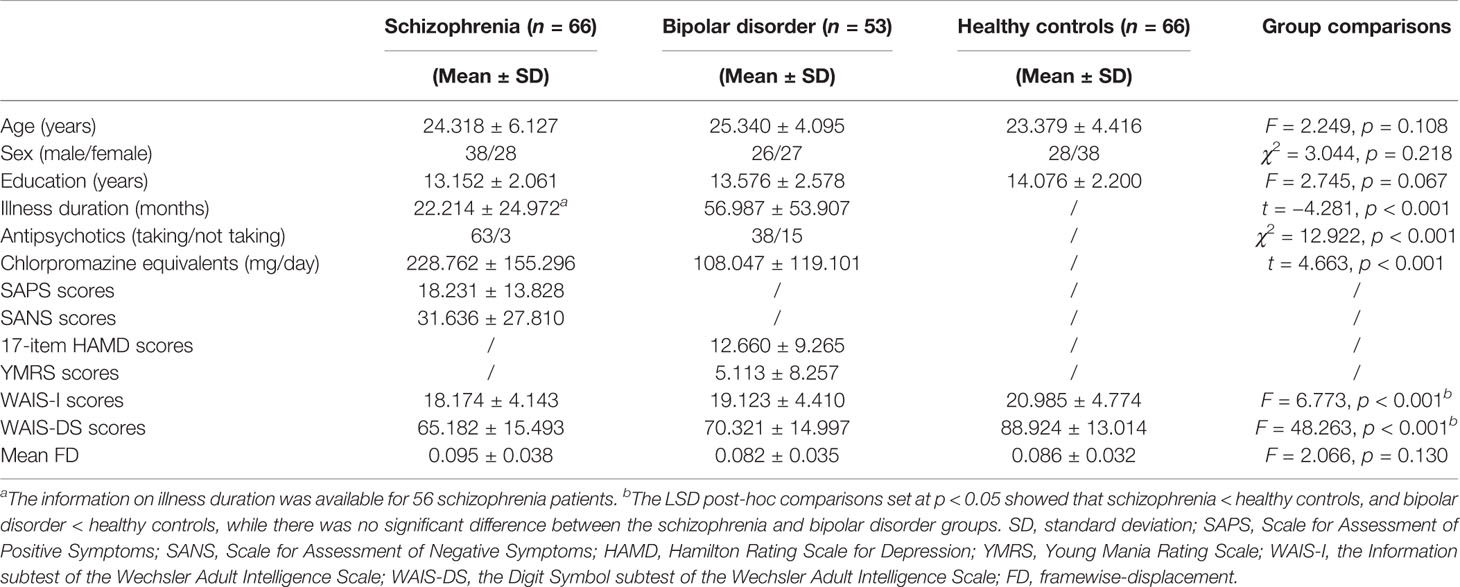
Table 1 Demographic, clinical, and head motion characteristics of the three groups.
As shown in Supplementary Table S2 and Figure 2, for temporal variability of the regional FC, both the schizophrenia and bipolar disorder patients showed significantly higher variabilities in a number of subcortical ROIs, including the left thalamus and regions of the basal ganglia (putamen/pallidum) compared with healthy controls; the schizophrenia patients additionally showed significantly higher variabilities for a number of ROIs located in the sensorimotor (precentral gyrus and postcentral gyrus), attention (inferior parietal lobule), and limbic (hippocampus and amygdala) areas than healthy controls, as well as a significantly lower variability in the superior frontal gyrus (medial orbital) than healthy controls and a significantly lower variability in the posterior cingulate gyrus than bipolar disorder patients (all corrected-p < 0.05).
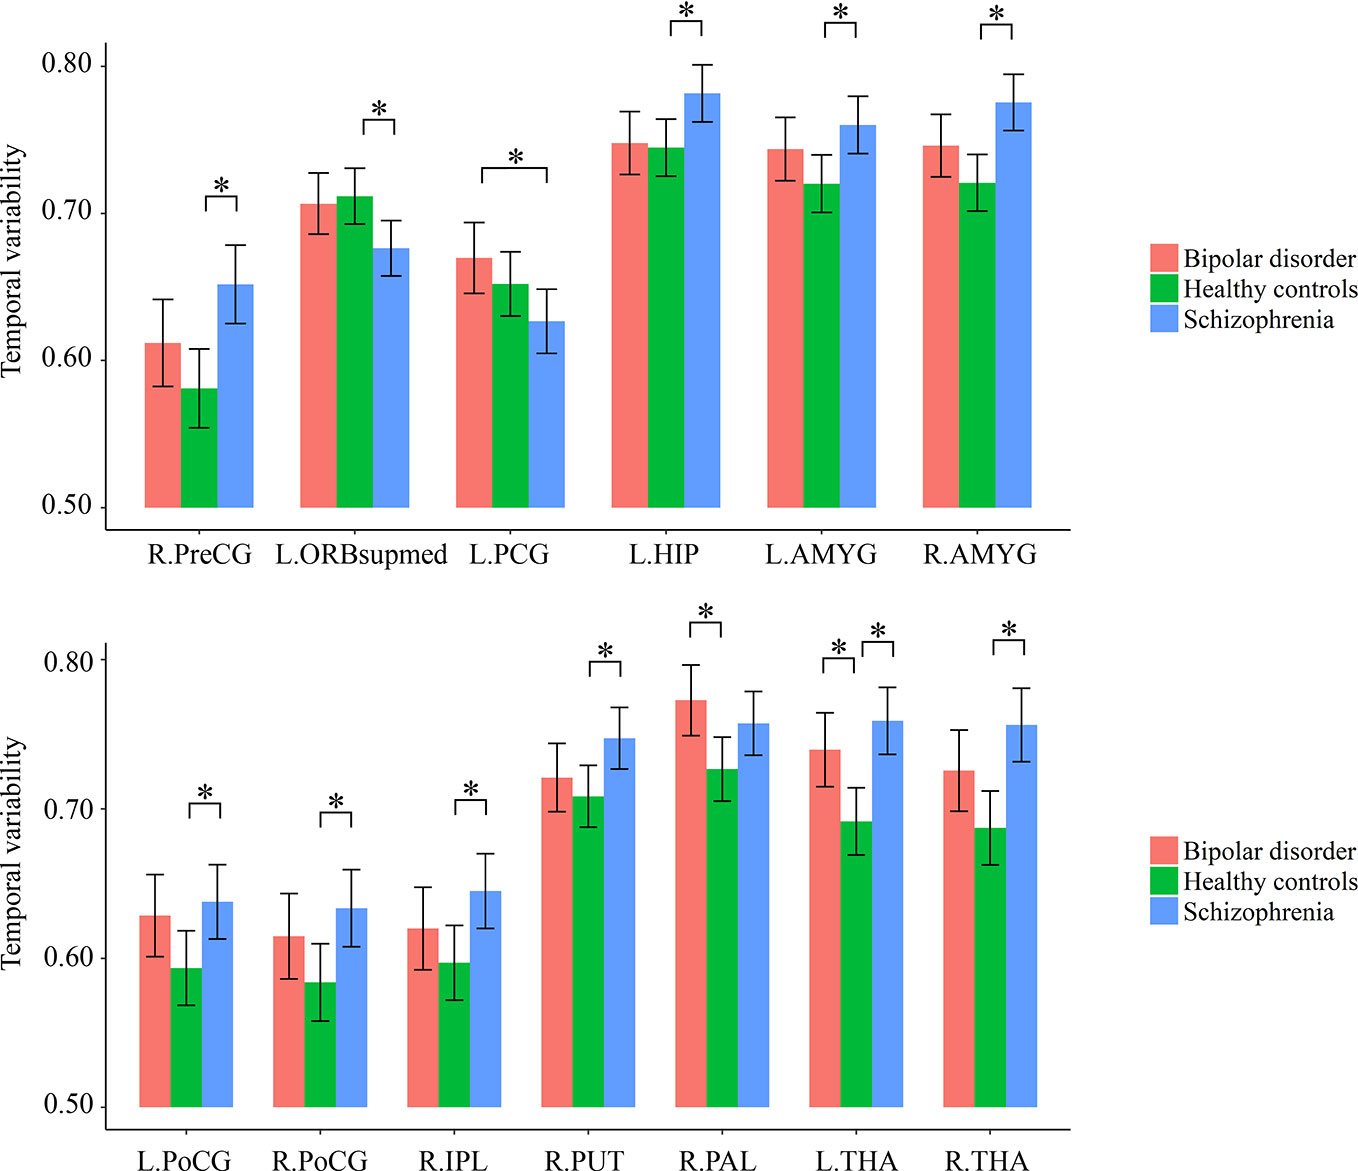
Figure 2 Group differences in the temporal variabilities of regional FC patterns. The error bars present the 95% confidence intervals, and the marks “*” indicate significant between-group differences with corrected p < 0.05. AMYG, amygdala; FC, functional connectivity; HIP, hippocampus; IPL, inferior parietal lobule; L, left hemisphere; ORBsupmed, superior frontal gyrus (medial orbital); PAL, pallidum; PCG, posterior cingulate gyrus; PoCG, postcentral gyrus; PreCG, precentral gyrus; PUT, putamen; R, right hemisphere; THA, thalamus.
As shown in Supplementary Table S3 and Figure 3, for temporal variabilities of the intra-network FC within particular networks and inter-network FC between particular pairs of networks, both the schizophrenia and bipolar disorder patients showed a significantly higher variability for inter-network FC between the sensorimotor network and thalamus compared with healthy controls; the schizophrenia patients additionally showed significantly higher variabilities of both intra-network and inter-network FC than healthy controls for several networks and pairs of networks, which mainly involved the sensorimotor, visual, and subcortical (including the thalamus) networks (all corrected p < 0.05).
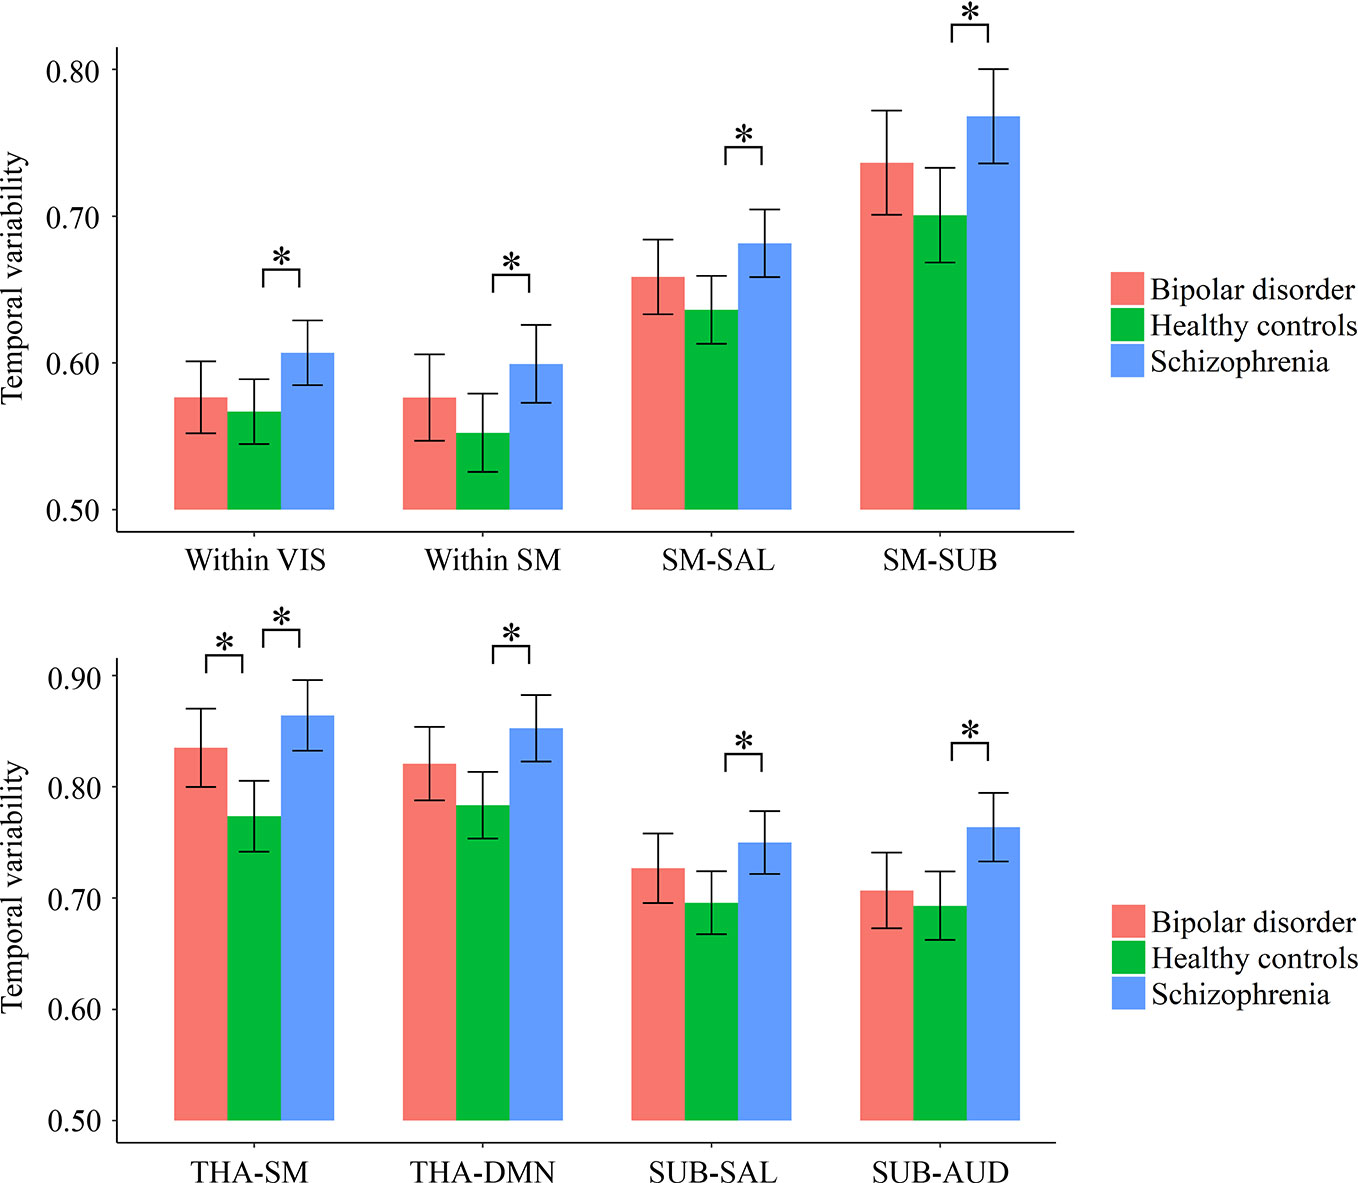
Figure 3 Group differences in the temporal variabilities of intra-network and inter-network FC patterns. The error bars present the 95% confidence intervals, and the marks “*” indicate significant between-group differences with corrected p < 0.05. AUD, auditory network; DMN, default mode network; FC, functional connectivity; SAL, salience network; SM, sensorimotor network; SUB, subcortical network; THA, thalamus; VIS, visual network.
As shown in Figure 4, in the entire sample, a significant negative correlation was found between temporal variability of inter-network FC between subcortical and auditory networks and the WAIS-DS scores (Spearman’s rho = −0.173, p = 0.019, uncorrected). Moreover, as shown in Figure 5, in the group of schizophrenia patients, significant correlations were found between temporal variability of regional FC for left hippocampus and the SANS scores (Spearman’s rho = 0.330, p = 0.007, uncorrected for multiple tests), as well as between temporal variability of the inter-network FC between subcortical and auditory networks and the WAIS-I scores (Spearman’s rho = −0.286, p = 0.020, uncorrected for multiple tests). No significant correlations were found in the groups of healthy controls and bipolar disorder patients (p > 0.05).
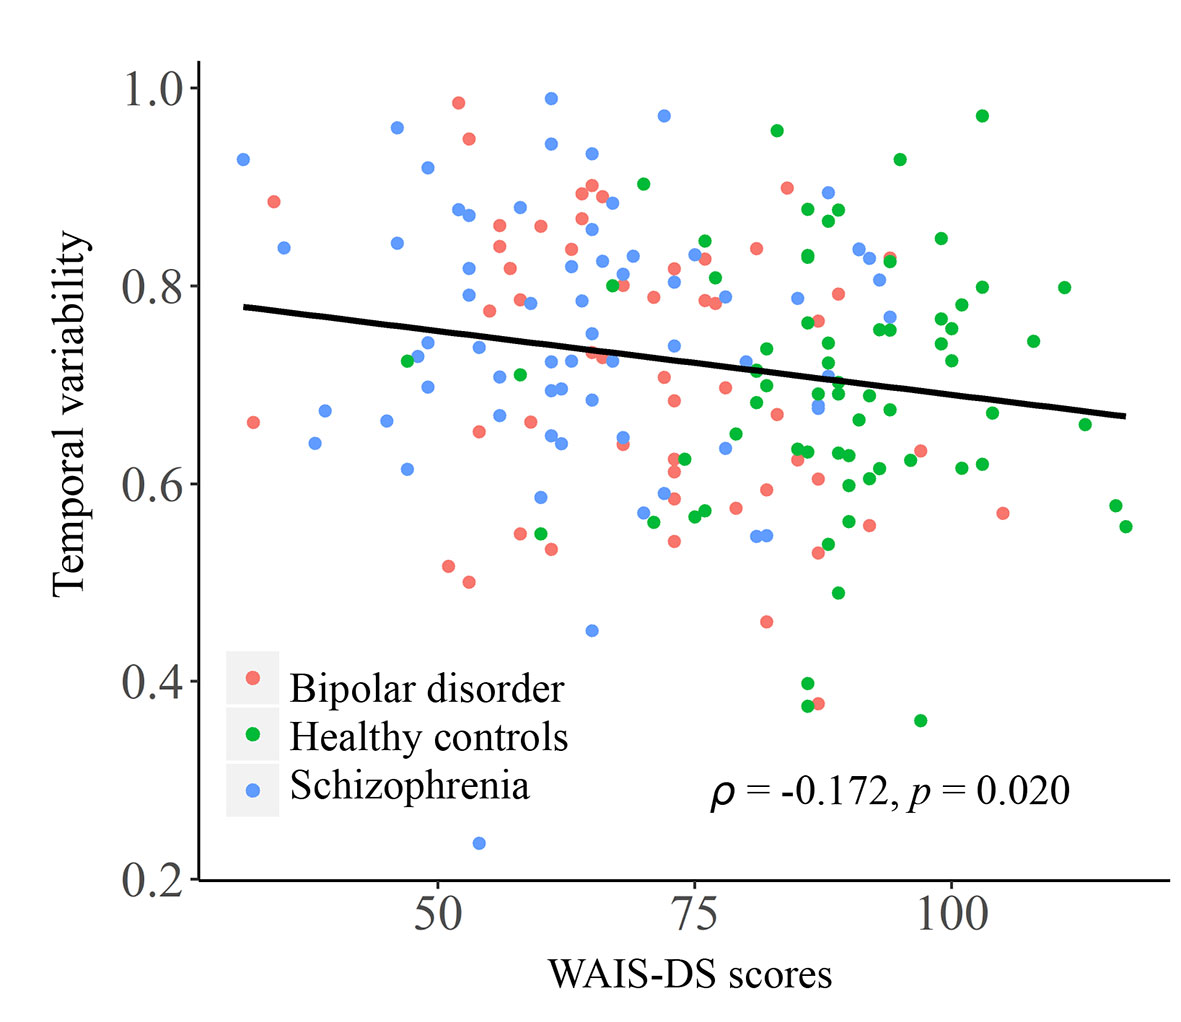
Figure 4 Correlation between the temporal variability of inter-network FC between subcortical and auditory networks and the WAIS-DS scores in the entire sample. The Spearman’s correlation coefficients (ρ) and p values are presented on figures. FC, functional connectivity; WAIS-DS, Digit Symbol Subtest of the Wechsler Adult Intelligence Scale.
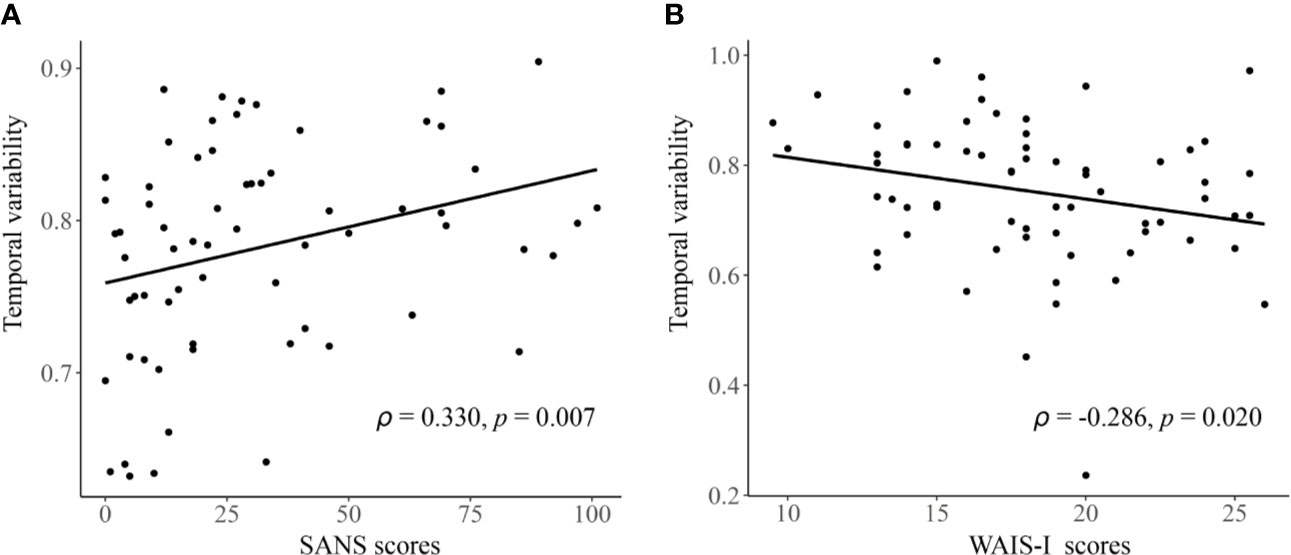
Figure 5 The detected significant correlations in schizophrenia patients. (A) Correlation between the temporal variability of regional FC for left hippocampus and the SANS scores. (B) Correlation between the temporal variability of inter-network FC between subcortical and auditory networks and the WAIS-I scores. The Spearman’s correlation coefficients (ρ) and p values are presented on figures. FC, functional connectivity; SANS, Scale for Assessment of Negative Symptoms; WAIS-I, Information Subtest of the Wechsler Adult Intelligence Scale.
As shown in Supplementary Tables S5–S7, similar results were obtained when repeating the whole analyses with GSR, and repeating the whole analyses within a subset where the illness duration and antipsychotic dosage were matched between two patient groups: both the schizophrenia and bipolar disorder patients still showed significantly increased regional FC variabilities in subcortical areas, as well as increased inter-network FC variability between the sensorimotor cortices and thalamus; moreover, some specific significant changes were found to present only in the schizophrenia group (although within the subset, changes in the schizophrenia group were found in a smaller range compared to those found in the entire sample).
In this study, we explored the common and specific changes in dynamic local and large-scale resting-state FC, as characterized by altered temporal variabilities, across the schizophrenia and bipolar disorder. Our results provide some innovative findings on the dynamic functional architecture of the brain for these two severe mental disorders: firstly, we found that both the schizophrenia and bipolar disorder patients showed increased regional FC variabilities in a number of subcortical areas involving the thalamus and regions of basal ganglia, as well as increased inter-network FC variability between the sensorimotor cortices and thalamus; secondly, some specific abnormalities were found to present only in the schizophrenia group, at both regional and network levels in a wider range. These findings provide valuable information for improving our insight into the neuropathology of these disorders from a dynamic brain functional perspective.
Our first important finding is that both the schizophrenia and bipolar disorder patients exhibited similar increased temporal variabilities of local FC in the thalamus (Figure 2), as well as of inter-network FC between the thalamus and sensorimotor cortices (Figure 3). It is noteworthy that shared neural disturbances in thalamo-cortical communications across schizophrenia and bipolar disorder, as characterized by similar over-connectivity between the thalamus and sensorimotor regions, have been repeatedly reported in several previous conventional static rs-fMRI studies (3, 4). Our results, therefore, may extend such findings to the context of dynamic resting-state FC for the first time to our knowledge. The thalamus is known as a “relay station” for almost all motor and sensory information flow from and to the cortex, where the information is further processed for high-order brain functions (3, 51). Specifically, aberrant communications between the thalamus and sensorimotor network were presumed to reflect a sensory gating deficit which leads to abnormal sensory information flow through the thalamus to the cortex (4, 48, 52). The observed increased temporal variability of thalamo-sensorimotor connectivity could thus point to such a sensory gating deficit, as abnormally increased temporal variability of FC was suggested to reflect excessive fluctuations in brain activities and inappropriate processing of information (23). As notably reported in both the schizophrenia and bipolar disorder patients (53–55), the sensory gating deficit has been suggested to partly underlie the cognitive and perceptual symptoms in the disorders (3, 56). Therefore, our dynamic FC findings may further support the hypothesis that thalamo-sensorimotor connectivity disturbances and sensory gating deficits are common neurobiological features shared by schizophrenia and bipolar disorder (4, 53).
In the present study, we also found that both the schizophrenia and bipolar disorder patients showed increased local FC variability in regions of the basal ganglia (putamen and pallidum) (Figure 2). The basal ganglia is a group of subcortical nuclei (putamen, pallidum, caudate nucleus, substantia nigra, and subthalamic nucleus) that involves a variety of brain functions such as motor control, learning, and execution (57). The functional and structural abnormalities of basal ganglia have been widely reported to be associated with psychotic symptoms such as delusions in schizophrenia patients (58–60), and also present in psychotic bipolar disorder patients (61). Therefore, our findings of such shared alterations in the basal ganglia may be reflective of common functional deficits in both the schizophrenia and bipolar disorder. These findings, together with the observed shared alterations in the thalamo-sensorimotor circuit, may partly help to explain the overlap clinical features in these two disorders.
Besides the above shared alterations in both patient groups, some specific alterations in a much wider range were found to present in only the schizophrenia patients. These include widespread increased FC variabilities at both regional and network levels, involving the sensorimotor, visual, attention, limbic, and subcortical areas, as well as decreased regional FC variability in a number of areas comprising the default-mode network such as posterior cingulate gyrus and superior frontal gyrus (medial orbital part) (Figures 2 and 3). Generally, these results are highly consistent with the findings from another recent study (23), which reported that schizophrenia patients had significantly increased FC variabilities in sensory and perceptual systems (including the sensorimotor network, visual network, attention network, and thalamus) and decreased FC variabilities in high-order networks (including the default-mode and frontal–parietal networks) than healthy subjects at both regional and network levels. Moreover, these alterations were found to be related to patients’ clinical symptoms and cognitive deficits (or relations found in the entire sample) both in the present study (Figures 4 and 5) and prior research (23). Therefore, our results further support the recent opinion that such widespread aberrant dynamic brain network reconfigurations may constitute a potential reliable biomarker for schizophrenia, suggestive of impaired abilities in processing inputs in sensory/perceptual systems and integrating information in high-order networks, which may underlie the perceptual and cognitive deficits in schizophrenia (23, 62). As for the bipolar disorder patients in the present study, FC variabilities in these regions and networks did not differ significantly from either of the other groups, which fell in the intermediate range between those of healthy controls and schizophrenia patients (Figures 2 and 3). Thus, we propose that our findings may offer support for the hypothesis of a psychosis continuum between schizophrenia and bipolar disorder, with more severe brain deficits and disabling symptoms in schizophrenia compared to bipolar disorder (63, 64); moreover, changes in dynamic FC may serve as objective biomarkers for such differences in neuropathology between these two disorders. However, future investigation with a larger sample size and a higher statistical power is required to confirm if these changes would be significant in patients with bipolar disorder, as compared to healthy controls and schizophrenia patients.
There are several issues for the present study and future research directions which should be noted. First, as mentioned before, our sample size is relatively small and the results should be further verified in future work with a larger sample to increase the reliability and statistical power (65). Second, the illness duration and doses of antipsychotics were not matched between the schizophrenia and bipolar disorder groups; moreover, the records of illness episode and age of onset were unavailable for patients. For better excluding the confounding effects of clinical distinctions on our findings, we have repeated the analyses in a subset of our sample in which the illness duration and antipsychotic dosage were matched between two patient groups and found similar results, suggesting that the observed group differences are unlikely to be mainly driven by medications or long-term hospitalizations. Despite this, however, further studies using first-episode, drug-naïve samples are warranted to exclude possible effects of all these clinical factors. Third, a number of previous studies have pointed out that the psychotic bipolar disorder may be a special phenotype from non-psychotic bipolar disorder (66, 67). In the current sample, the records of psychotic symptom histories are unavailable for most bipolar disorder patients. Future studies are necessary to replicate our results and to compare between psychotic and non-psychotic bipolar disorder patients. Fourth, although it has been proven to be reliable for analyzing the intra- and inter-network dynamic FC (39), the AAL atlas only provides a relatively coarse parcellation. However, some key brain structures such as the thalamus could be subdivided into more precise subregions with different FC patterns (47, 68). Thus, future studies to investigate the temporal variability of dynamic FC with finer parcellation schemes would further improve our understanding of its important role in differentiating schizophrenia and bipolar disorder.
In conclusion, we explored the common and specific changes in dynamic features of FC, as characterized by temporal variabilities of FC patterns involved in specific brain regions or large-scale brain networks, in schizophrenia and bipolar disorder patients. We found that both the schizophrenia and bipolar disorder patients showed significantly increased regional FC variabilities in subcortical areas including the thalamus and basal ganglia, as well as increased inter-network FC variability between the sensorimotor cortices and thalamus. More widespread significant alterations were found to present in only the schizophrenia group, including increased FC variabilities in the sensorimotor, visual, attention, limbic, and subcortical areas at both regional and network levels, as well as decreased regional FC variability in the default-mode areas. The observed alterations shared by schizophrenia and bipolar disorder may help to explain their overlap clinical features; meanwhile, the schizophrenia-specific abnormalities in a wider range could potentially support the hypothesis of a psychosis continuum between schizophrenia and bipolar disorder, that schizophrenia is associated with more severe functional brain deficits compared to bipolar disorder. Together, these findings highlight the potentials of using dynamic FC as an objective biomarker for the monitoring and diagnosis of either schizophrenia or bipolar disorder.
The datasets generated for this study are available on request to the corresponding authors.
The studies involving human participants were reviewed and approved by the Ethics Committee of the Second Xiangya Hospital, Central South University. The patients/participants provided their written informed consent to participate in this study.
Authors YL and WP designed the study and carried out the analysis. YL, ZL, GW, ZX, YP, XC, XH, and WP contributed to the data collection. YL wrote the first draft of manuscript. ZL, CC, DL, and WP contributed to the final manuscript. All authors have read and agreed to the published version of the manuscript.
This research was funded by the China Precision Medicine Initiative (grant number 2016YFC0906300) and the National Natural Science Foundation of China (grant numbers 81561168021, 81671335, 81701325).
The authors declare that the research was conducted in the absence of any commercial or financial relationships that could be construed as a potential conflict of interest.
We thank Zhong He (Department of Radiology of Second Xiangya Hospital, Central South University) for his assistance in rs-fMRI data acquisition. This manuscript has been released as a pre-print at bioRxiv (69).
The Supplementary Material for this article can be found online at: https://www.frontiersin.org/articles/10.3389/fpsyt.2020.00422/full#supplementary-material
1. Meyer F, Meyer TD. The misdiagnosis of bipolar disorder as a psychotic disorder: Some of its causes and their influence on therapy. J Affect Disord (2009) 112:174–83. doi: 10.1016/j.jad.2008.04.022
2. Dezhina Z, Ranlund S, Kyriakopoulos M, Williams SCR, Dima D. A systematic review of associations between functional MRI activity and polygenic risk for schizophrenia and bipolar disorder. Brain Imaging Behav (2019) 13:862–77. doi: 10.1007/s11682-018-9879-z
3. Skåtun KC, Kaufmann T, Brandt CL, Doan NT, Alnæs D, Tønnesen S, et al. Thalamo-cortical functional connectivity in schizophrenia and bipolar disorder. Brain Imaging Behav (2018) 12:640–52. doi: 10.1007/s11682-017-9714-y
4. Anticevic A, Cole MW, Repovs G, Murray JD, Brumbaugh MS, Winkler AM, et al. Characterizing thalamo-cortical disturbances in Schizophrenia and bipolar illness. Cereb Cortex (2014) 24:3116–30. doi: 10.1093/cercor/bht165
5. Meda SA, Gill A, Stevens MC, Lorenzoni RP, Glahn DC, Calhoun VD, et al. Differences in resting-state functional magnetic resonance imaging functional network connectivity between schizophrenia and psychotic bipolar probands and their unaffected first-degree relatives. Biol Psychiatry (2012) 71:881–9. doi: 10.1016/j.biopsych.2012.01.025
6. Birur B, Kraguljac NV, Shelton RC, Lahti AC. Brain structure, function, and neurochemistry in schizophrenia and bipolar disorder- A systematic review of the magnetic resonance neuroimaging literature. NPJ Schizophr (2017) 3:1–15. doi: 10.1038/s41537-017-0013-9
7. Mamah D, Barch DM, Repovš G. Resting state functional connectivity of five neural networks in bipolar disorder and schizophrenia. J Affect Disord (2013) 150:601–9. doi: 10.1016/j.jad.2013.01.051
8. Cheng W, Palaniyappan L, Li M, Kendrick KM, Zhang J, Luo Q, et al. Voxel-based, brain-wide association study of aberrant functional connectivity in schizophrenia implicates thalamocortical circuitry. NPJ Schizophr (2015) 1:15016. doi: 10.1038/npjschz.2015.16
9. Chang C, Glover GH. Time-frequency dynamics of resting-state brain connectivity measured with fMRI. Neuroimage (2010) 50:81–98. doi: 10.1016/j.neuroimage.2009.12.011
10. Hutchison RM, Womelsdorf T, Gati JS, Everling S, Menon RS. Resting-state networks show dynamic functional connectivity in awake humans and anesthetized macaques. Hum Brain Mapp (2013) 34:2154–77. doi: 10.1002/hbm.22058
11. Preti MG, Bolton TA, Van De Ville D. The dynamic functional connectome: State-of-the-art and perspectives. Neuroimage (2017) 160:41–54. doi: 10.1016/j.neuroimage.2016.12.061
12. Bassett DS, Wymbs NF, Porter MA, Mucha PJ, Carlson JM, Grafton ST. Dynamic reconfiguration of human brain networks during learning. Proc Natl Acad Sci U S A (2011) 108:7641–6. doi: 10.1073/pnas.1018985108
13. Braun U, Schäfer A, Walter H, Erk S, Romanczuk-Seiferth N, Haddad L, et al. Dynamic reconfiguration of frontal brain networks during executive cognition in humans. Proc Natl Acad Sci U S A (2015) 112:11678–83. doi: 10.1073/pnas.1422487112
14. Long Y, Chen C, Deng M, Huang X, Tan W, Zhang L, et al. Psychological resilience negatively correlates with resting-state brain network flexibility in young healthy adults: a dynamic functional magnetic resonance imaging study. Ann Transl Med (2019) 7:809–9. doi: 10.21037/atm.2019.12.45
15. Betzel RF, Satterthwaite TD, Gold JI, Bassett DS. Positive affect, surprise, and fatigue are correlates of network flexibility. Sci Rep (2017) 7:1–10. doi: 10.1038/s41598-017-00425-z
16. Harlalka V, Bapi RS, Vinod PK, Roy D. Atypical flexibility in dynamic functional connectivity quantifies the severity in autism spectrum disorder. Front Hum Neurosci (2019) 13:6. doi: 10.3389/fnhum.2019.00006
17. Schumacher J, Peraza LR, Firbank M, Thomas AJ, Kaiser M, Gallagher P, et al. Dynamic functional connectivity changes in dementia with Lewy bodies and Alzheimer’s disease. NeuroImage Clin (2019) 22:101812. doi: 10.1016/j.nicl.2019.101812
18. Wise T, Marwood L, Perkins AM, Herane-Vives A, Joules R, Lythgoe DJ, et al. Instability of default mode network connectivity in major depression: A two-sample confirmation study. Transl Psychiatry (2017) 7:e1105. doi: 10.1038/tp.2017.40
19. Long Y, Cao H, Yan C, Chen X, Li L, Castellanos FX, et al. Altered resting-state dynamic functional brain networks in major depressive disorder: Findings from the REST-meta-MDD consortium. NeuroImage Clin (2020). doi: 10.1016/j.nicl.2020.102163
20. Rashid B, Arbabshirani MR, Damaraju E, Cetin MS, Miller R, Pearlson GD, et al. Classification of schizophrenia and bipolar patients using static and dynamic resting-state fMRI brain connectivity. Neuroimage (2016) 134:645–57. doi: 10.1016/j.neuroimage.2016.04.051
21. Rashid B, Damaraju E, Pearlson GD, Calhoun VD. Dynamic connectivity states estimated from resting fMRI Identify differences among Schizophrenia, bipolar disorder, and healthy control subjects. Front Hum Neurosci (2014) 8:897. doi: 10.3389/fnhum.2014.00897
22. Du Y, Pearlson GD, Lin D, Sui J, Chen J, Salman M, et al. Identifying dynamic functional connectivity biomarkers using GIG-ICA: Application to schizophrenia, schizoaffective disorder, and psychotic bipolar disorder. Hum Brain Mapp (2017) 38:2683–708. doi: 10.1002/hbm.23553
23. Dong D, Duan M, Wang Y, Zhang X, Jia X, Li Y, et al. Reconfiguration of Dynamic Functional Connectivity in Sensory and Perceptual System in Schizophrenia. Cereb Cortex (2019) 29:3577–89. doi: 10.1093/cercor/bhy232
24. Zhu H, Huang J, Deng L, He N, Cheng L, Shu P, et al. Abnormal dynamic functional connectivity associated with subcortical networks in Parkinson’s disease: A temporal variability perspective. Front Neurosci (2019) 13:80. doi: 10.3389/fnins.2019.00080
25. Andreasen NC. Methods for assessing positive and negative symptoms. Mod Probl Pharmacopsychiatry (1990) 24:73–88. doi: 10.1159/000418013
26. Williams JBW. A Structured Interview Guide for the Hamilton Depression Rating Scale. Arch Gen Psychiatry (1988) 45:742–7. doi: 10.1001/archpsyc.1988.01800320058007
27. Young RC, Biggs JT, Ziegler VE, Meyer DA. A rating scale for mania: Reliability, validity and sensitivity. Br J Psychiatry (1978) 133:429–35. doi: 10.1192/bjp.133.5.429
28. Andreasen NC, Pressler M, Nopoulos P, Miller D, Ho BC. Antipsychotic Dose Equivalents and Dose-Years: A Standardized Method for Comparing Exposure to Different Drugs. Biol Psychiatry (2010) 67:255–62. doi: 10.1016/j.biopsych.2009.08.040
29. Yao-xian G. Revision of Wechsler’s Adult Intelligence Scale in China. Acta Psychol Sin (1983) 15:121–9. Available at: http://118.145.16.229:81/Jweb_xlxb.
30. Long Y, Ouyang X, Liu Z, Chen X, Hu X, Lee E, et al. Associations among suicidal ideation, white matter integrity and cognitive deficit in first-episode schizophrenia. Front Psychiatry (2018) 9:391. doi: 10.3389/fpsyt.2018.00391
31. Deng M, Pan Y, Zhou L, Chen X, Liu C, Huang X, et al. Resilience and Cognitive Function in Patients With Schizophrenia and Bipolar Disorder, and Healthy Controls. Front Psychiatry (2018) 9:279. doi: 10.3389/fpsyt.2018.00279
32. Chao-Gan Y, Yu-Feng Z. DPARSF: A MATLAB toolbox for “pipeline” data analysis of resting-state fMRI. Front Syst Neurosci (2010) 4:13. doi: 10.3389/fnsys.2010.00013
33. Yan CG, Wang XD, Zuo XN, Zang YF. DPABI: Data Processing & Analysis for (Resting-State) Brain Imaging. Neuroinformatics (2016) 14:339–51. doi: 10.1007/s12021-016-9299-4
34. Friston KJ, Williams S, Howard R, Frackowiak RSJ, Turner R. Movement-related effects in fMRI time-series. Magn Reson Med (1996) 35:346–55. doi: 10.1002/mrm.1910350312
35. Murphy K, Fox MD. Towards a consensus regarding global signal regression for resting state functional connectivity MRI. Neuroimage (2017) 154:169–73. doi: 10.1016/j.neuroimage.2016.11.052
36. Jenkinson M, Bannister P, Brady M, Smith S. Improved optimization for the robust and accurate linear registration and motion correction of brain images. Neuroimage (2002) 17:825–41. doi: 10.1016/S1053-8119(02)91132-8
37. Tzourio-Mazoyer N, Landeau B, Papathanassiou D, Crivello F, Etard O, Delcroix N, et al. Automated anatomical labeling of activations in SPM using a macroscopic anatomical parcellation of the MNI MRI single-subject brain. Neuroimage (2002) 15:273–89. doi: 10.1006/nimg.2001.0978
38. Termenon M, Jaillard A, Delon-Martin C, Achard S. Reliability of graph analysis of resting state fMRI using test-retest dataset from the Human Connectome Project. Neuroimage (2016) 142:172–87. doi: 10.1016/j.neuroimage.2016.05.062
39. Zhang C, Baum SA, Adduru VR, Biswal BB, Michael AM. Test-retest reliability of dynamic functional connectivity in resting state fMRI. Neuroimage (2018) 183:907–18. doi: 10.1016/j.neuroimage.2018.08.021
40. Cao H, Bertolino A, Walter H, Schneider M, Schafer A, Taurisano P, et al. Altered functional subnetwork during emotional face processing a potential intermediate phenotype for schizophrenia. JAMA Psychiatry (2016) 73:598–605. doi: 10.1001/jamapsychiatry.2016.0161
41. Piel JH, Lett TA, Wackerhagen C, Plichta MM, Mohnke S, Grimm O, et al. The effect of 5-HTTLPR and a serotonergic multi-marker score on amygdala, prefrontal and anterior cingulate cortex reactivity and habituation in a large, healthy fMRI cohort. Eur Neuropsychopharmacol (2018) 28:415–27. doi: 10.1016/j.euroneuro.2017.12.014
42. Zhang J, Cheng W, Liu Z, Zhang K, Lei X, Yao Y, et al. Neural, electrophysiological and anatomical basis of brain-network variability and its characteristic changes in mental disorders. Brain (2016) 139:2307–21. doi: 10.1093/brain/aww143
43. Mueller S, Wang D, Fox MD, Yeo BTT, Sepulcre J, Sabuncu MR, et al. Individual Variability in Functional Connectivity Architecture of the Human Brain. Neuron (2013) 77:586–95. doi: 10.1016/j.neuron.2012.12.028
44. Sun J, Liu Z, Rolls ET, Chen Q, Yao Y, Yang W, et al. Verbal creativity correlates with the temporal variability of brain networks during the resting state. Cereb Cortex (2019) 29:1047–58. doi: 10.1093/cercor/bhy010
45. Cao H, Chung Y, McEwen SC, Bearden CE, Addington J, Goodyear B, et al. Progressive reconfiguration of resting-state brain networks as psychosis develops: Preliminary results from the North American Prodrome Longitudinal Study (NAPLS) consortium. Schizophr Res (2019). doi: 10.1016/j.schres.2019.01.017
46. Power JD, Cohen AL, Nelson SM, Wig GS, Barnes KA, Church JA, et al. Functional Network Organization of the Human Brain. Neuron (2011) 72:665–78. doi: 10.1016/j.neuron.2011.09.006
47. Ji JL, Spronk M, Kulkarni K, Repovš G, Anticevic A, Cole MW. Mapping the human brain’s cortical-subcortical functional network organization. Neuroimage (2019) 185:35–57. doi: 10.1016/j.neuroimage.2018.10.006
48. Cao H, Chén OY, Chung Y, Forsyth JK, McEwen SC, Gee DG, et al. Cerebello-thalamo-cortical hyperconnectivity as a state-independent functional neural signature for psychosis prediction and characterization. Nat Commun (2018) 9:1–9. doi: 10.1038/s41467-018-06350-7
49. Hou Z, Kong Y, He X, Yin Y, Zhang Y, Yuan Y. Increased temporal variability of striatum region facilitating the early antidepressant response in patients with major depressive disorder. Prog Neuropsychopharmacol Biol Psychiatry (2018) 85:39–45. doi: 10.1016/j.pnpbp.2018.03.026
50. Shirer WR, Ryali S, Rykhlevskaia E, Menon V, Greicius MD. Decoding subject-driven cognitive states with whole-brain connectivity patterns. Cereb Cortex (2012) 22:158–65. doi: 10.1093/cercor/bhr099
51. Sherman SM, Guillery RW. The role of the thalamus in the flow of information to the cortex. Philos Trans R Soc B: Biol Sci (2002) 357:1695–708. doi: 10.1098/rstb.2002.1161
52. Çetin MS, Christensen F, Abbott CC, Stephen JM, Mayer AR, Cañive JM, et al. Thalamus and posterior temporal lobe show greater inter-network connectivity at rest and across sensory paradigms in schizophrenia. Neuroimage (2014) 97:117–26. doi: 10.1016/j.neuroimage.2014.04.009
53. Sánchez-Morla EM, García-Jiménez MA, Barabash A, Martínez-Vizcaíno V, Mena J, Cabranes-Díaz JA, et al. P50 sensory gating deficit is a common marker of vulnerability to bipolar disorder and schizophrenia. Acta Psychiatr Scand (2008) 117:313–8. doi: 10.1111/j.1600-0447.2007.01141.x
54. Cheng CH, Chan PYS, Liu CY, Hsu SC. Auditory sensory gating in patients with bipolar disorders: A meta-analysis. J Affect Disord (2016) 203:199–203. doi: 10.1016/j.jad.2016.06.010
55. Hazlett EA, Rothstein EG, Ferreira R, Silverman JM, Siever LJ, Olincy A. Sensory gating disturbances in the spectrum: Similarities and differences in schizotypal personality disorder and schizophrenia. Schizophr Res (2015) 161:283–90. doi: 10.1016/j.schres.2014.11.020
56. Cromwell HC, Mears RP, Wan L, Boutros NN. Sensory gating: A translational effort from basic to clinical science. Clin EEG Neurosci (2008) 39:69–72. doi: 10.1177/155005940803900209
57. Haber SN. The primate basal ganglia: Parallel and integrative networks. J Chem Neuroanat (2003) 26:317–30. doi: 10.1016/j.jchemneu.2003.10.003
58. Huang X, Pu W, Li X, Greenshaw AJ, Dursun SM, Xue Z, et al. Decreased left putamen and thalamus volume correlates with delusions in first-episode schizophrenia patients. Front Psychiatry (2017) 8:245. doi: 10.3389/fpsyt.2017.00245
59. Raij TT, Mäntylä T, Kieseppä T, Suvisaari J. Aberrant functioning of the putamen links delusions, antipsychotic drug dose, and compromised connectivity in first episode psychosis-Preliminary fMRI findings. Psychiatry Res - Neuroimaging (2015) 233:201–11. doi: 10.1016/j.pscychresns.2015.06.008
60. Tao H, Wong GHY, Zhang H, Zhou Y, Xue Z, Shan B, et al. Grey matter morphological anomalies in the caudate head in first-episode psychosis patients with delusions of reference. Psychiatry Res - Neuroimaging (2015) 233:57–63. doi: 10.1016/j.pscychresns.2015.04.011
61. Karcher NR, Rogers BP, Woodward ND. Functional Connectivity of the Striatum in Schizophrenia and Psychotic Bipolar Disorder. Biol Psychiatry Cognit Neurosci Neuroimaging (2019) 4:956–65. doi: 10.1016/j.bpsc.2019.05.017
62. Zhang Y, Guo G, Tian Y. Increased temporal dynamics of intrinsic brain activity in sensory and perceptual network of schizophrenia. Front Psychiatry (2019) 10:484. doi: 10.3389/fpsyt.2019.00484
63. Pearlson GD. Etiologic, Phenomenologic, and Endophenotypic Overlap of Schizophrenia and Bipolar Disorder. Annu Rev Clin Psychol (2015) 11:251–81. doi: 10.1146/annurev-clinpsy-032814-112915
64. Sorella S, Lapomarda G, Messina I, Frederickson JJ, Siugzdaite R, Job R, et al. Testing the expanded continuum hypothesis of schizophrenia and bipolar disorder. Neural and psychological evidence for shared and distinct mechanisms. NeuroImage Clin (2019) 23:101854. doi: 10.1016/j.nicl.2019.101854
65. Cao H, McEwen SC, Forsyth JK, Gee DG, Bearden CE, Addington J, et al. Toward leveraging human connectomic data in large consortia: Generalizability of fmri-based brain graphs across sites, sessions, and paradigms. Cereb Cortex (2019) 29:1263–79. doi: 10.1093/cercor/bhy032
66. Glahn DC, Bearden CE, Barguil M, Barrett J, Reichenberg A, Bowden CL, et al. The Neurocognitive Signature of Psychotic Bipolar Disorder. Biol Psychiatry (2007) 62:910–6. doi: 10.1016/j.biopsych.2007.02.001
67. Mazzarini L, Colom F, Pacchiarotti I, Nivoli AMA, Murru A, Bonnin CM, et al. Psychotic versus non-psychotic bipolar II disorder. J Affect Disord (2010) 126:55–60. doi: 10.1016/j.jad.2010.03.028
68. Hua J, Blair NIS, Paez A, Choe A, Barber AD, Brandt A, et al. Altered functional connectivity between sub-regions in the thalamus and cortex in schizophrenia patients measured by resting state BOLD fMRI at 7T. Schizophr Res (2019) 206:370–7. doi: 10.1016/j.schres.2018.10.016
Keywords: dynamic functional connectivity, schizophrenia, bipolar disorder, thalamus, sensorimotor, basal ganglia
Citation: Long Y, Liu Z, Chan CKY, Wu G, Xue Z, Pan Y, Chen X, Huang X, Li D and Pu W (2020) Altered Temporal Variability of Local and Large-Scale Resting-State Brain Functional Connectivity Patterns in Schizophrenia and Bipolar Disorder. Front. Psychiatry 11:422. doi: 10.3389/fpsyt.2020.00422
Received: 08 February 2020; Accepted: 24 April 2020;
Published: 12 May 2020.
Edited by:
Qiang Luo, Fudan University, ChinaReviewed by:
Mingrui Xia, Beijing Normal University, ChinaCopyright © 2020 Long, Liu, Chan, Wu, Xue, Pan, Chen, Huang, Li and Pu. This is an open-access article distributed under the terms of the Creative Commons Attribution License (CC BY). The use, distribution or reproduction in other forums is permitted, provided the original author(s) and the copyright owner(s) are credited and that the original publication in this journal is cited, in accordance with accepted academic practice. No use, distribution or reproduction is permitted which does not comply with these terms.
*Correspondence: Dan Li, bGlkYW54eUBjc3UuZWR1LmNu; Weidan Pu, d2VpZGFucHVAY3N1LmVkdS5jbg==
Disclaimer: All claims expressed in this article are solely those of the authors and do not necessarily represent those of their affiliated organizations, or those of the publisher, the editors and the reviewers. Any product that may be evaluated in this article or claim that may be made by its manufacturer is not guaranteed or endorsed by the publisher.
Research integrity at Frontiers
Learn more about the work of our research integrity team to safeguard the quality of each article we publish.