 Baiming Yang
 Guoli Zhang
 Fengping Guo
 Manqi Wang
 Huaying Wang
 Hongxing Xiao
- 1Key Laboratory of Molecular Epigenetics of Ministry of Education, Northeast Normal University, Changchun, China
- 2Changchun Guoxin Modern Agricultural Technology Development Co., Ltd., Changchun, China
- 3Biology Group, No. 30 Middle School of Shenyang, Shenyang, China
Understanding the processes of divergence and speciation is an important task for evolutionary research, and climate oscillations play a pivotal role. We estimated the genetic structure and demographic history of two closely related species of Rhododendron, R. dauricum, and R. mucronulatum, distributed in northeastern China using 664,406 single nucleotide polymorphic loci of specific-locus amplified fragment sequencing (SLAF-seq) and 4 chloroplast DNA (cpDNA) fragments, sampling 376 individuals from 39 populations of these two species across their geographic distributions. The geographical distribution of cpDNA haplotypes revealed that R. dauricum and R. mucronulatum have different spatial genetic structures and haplotype diversity. Analysis of molecular variance (AMOVA) results showed that these two species have significant genetic differentiation and that the phylogeny demonstrates that these two species clustered a monophyletic group based on SLAF data, respectively, but not in cpDNA data. The evidence of significant gene flow was also detected from R. mucronulatum to R. dauricum. A deep divergence between the two species was observed and occurred during the early Oligocene. The niche models showed that the two species have different demographic histories. Thus, our results imply that geography and climate changes played important roles in the evolutionary process of R. dauricum and R. mucronulatum, and although there was an interspecific gene flow, the divergence was maintained by natural selection.
Introduction
Past climate oscillations and historical tectonism had a huge impact on the genetic structure and demographic histories of many species, even triggering divergence and speciation (Milne, 2006). Understanding the factors that promote species divergence is of major interest in ecological and evolutionary research (Papadopulos et al., 2011; Butlin et al., 2012). Species divergences are frequently driven by geographic isolation, environmental heterogeneity (ecological speciation) or a combination of both (Orr and Smith, 1998; Schluter, 2001; Nosil, 2012). Geographic isolation is generally considered an allopatric speciation, where gene flow among splitting populations is disrupted by physical barriers, and genetic divergence occurs between taxa by local adaptation, mutation, and genetic drift (Coyne and Orr, 2004). In contrast, under ecological speciation, divergence is driven by divergent natural selection between environments, giving rise to reproductive isolation between subsets of a single population by adaptation to different environments or ecological niches. (Schluter, 2000; Schluter, 2001; Rundle and Nosil, 2005).
Gene flow played an important role in the evolution of species, having both positive and negative effects on adaptation (Palme et al., 2004). Itis expected due to secondary contact when physical barriers disappear (under allopatric speciation) or range expansions and contractions in response to climatic fluctuation, which is generally regarded as a force counteracting population divergence (Runemark et al., 2012). When the rate of gene flow between species exceeds that among populations within the species, hybridization might occur. These phenomena have been demonstrated not only in animals (Taylor et al., 2005; Seehausen, 2006; Webb et al., 2011), but also in plants (Marczewski et al., 2015; Ma et al., 2016). Interspecies gene flow after speciation can reduce genetic differentiation among species and even achieve homogenization (Vonlanthen et al., 2012; Bhat et al., 2014). However, when the homogenization of interspecific gene flow is weaker than the disproportionation of natural selection, species genetic differentiation may still be maintained (Rundell and Prince, 2009; Ribera et al., 2011).
Rhododendron (Ericaceae L.) is a taxonomically complex genus with approximately 1,000 species (Chamberlain et al., 1996) distributed in Himalayan flora. It is one of the major genera of China and includes approximately 571 species, of which 402 species are endemic to China (Wu et al., 2003; Fang et al., 2005). Northeast Asia is an area with complex topographic and climatic gradients (Lopez-Pujol et al., 2011), and recent research supports a northeastern Asian origin of Rhododendron (Shrestha et al., 2018). Among Rhododendron species, Rhododendron subgen. Rhodorastrum, including four taxa, R. ledebourii, R. dauricum, R. mucronulatum, and R. sichotense, are distributed in this area. The four species exhibit similar phenotypic characteristics, such as leaf, petiole and flower shapes, thus making taxonomy difficult. R. ledebourii, R. mucronulatum, and R. sichotense were regarded as populations, varieties or subspecies of R. dauricum in previous studies (Voroshilov, 1982; Mazurenko and Hohryakov, 1991; Koropachinskii and Vstovskaya, 2002). In contrast, phylogenetic analysis supports the species status of these four species-based cpDNA regions (Tikhonova et al., 2012; Polezhaeva et al., 2018). Additionally, two well-distinguished groups were determined for these four species, including R. ledebourii and R. dauricum as the Siberian group and R. sichotense and R. mucronulatum as the Far Eastern group (Polezhaeva et al., 2018), demonstrating good agreement with the geographical positions of the species collected. However, a main haplotype of R. mucronulatum was clustered with the haplotypes of R. sichotense, and the two species were joined together based on SAMOVA, Furthermore, samples were only from Russia and located in Northeast China (NEC) were lacking. In addition, phylogenetic reconstruction of the genus Rhododendron based on the ITS region showed that R. dauricum and R. mucronulatum were sister species (Kutsev and Karakulov, 2010; Baranova et al., 2014).
These four species have different geographical distribution, covering Mongolia, Northeast China, Japan, Korean Peninsula, and Russian (including the southern part of western Siberia, eastern Siberia, and the Russian Far East), and Northeast China (NEC) is in the center of these areas (Figure 1C), among which R. dauricum is widely distributed. R. dauricum and R. mucronulatum have different geographical distribution in NEC, although they both occur along mountain slopes. R. dauricum is distributed along the Great Khingan Mountains (GKM), Lesser Khingan Mountains (LKM) and Changbai Mountain (CBM), while R. mucronulatum is found in the south of the Changbai Mountain and other locations in North China.
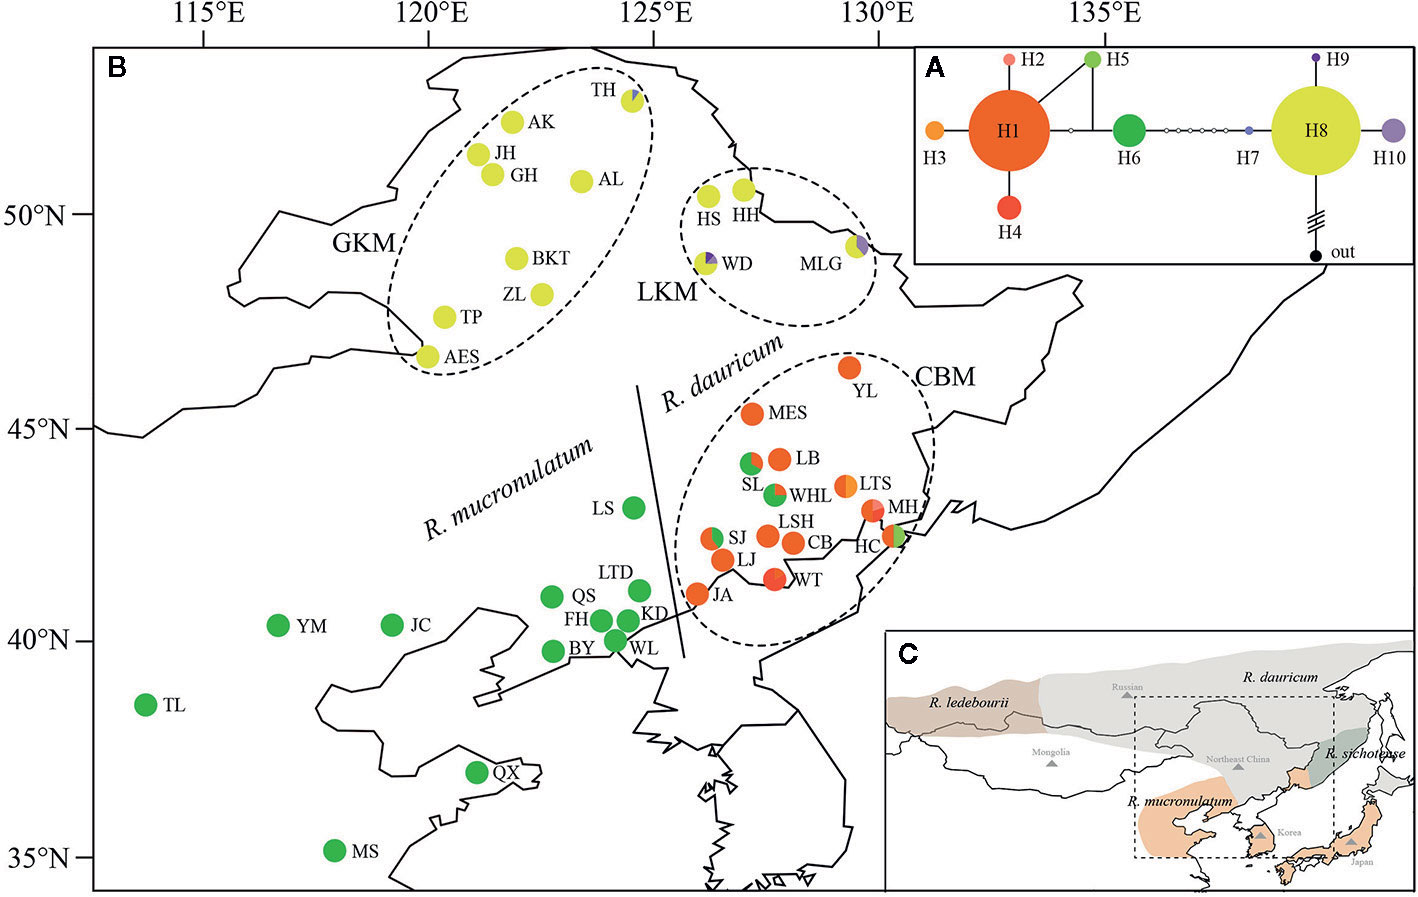
Figure 1 (A) The Network of haplotypes in R. dauricum. The size of haplotype circle represents relative frequency. (B) Geographical distribution of haplotypes within R. dauricum and R. mucronulatum. The regions of GKM, LKM, and CBM were indicated by dotted ellipses. The populations of R. dauricum and R. mucronulatum were distinguished by solid line. (C) The distribution of four species in subgen. Rhodorastrum. It was drawn based on Polezhaeva (2018) and the sites information collected in ecological niche model simulation. Each color represents a species.
Therefore, in this study, to test the genetic divergence and demographic history of R. dauricum and R. mucronulatum driven by possible roles of geological or climate events, we first combined specific-locus amplified fragment sequencing (SLAF-seq) and cpDNA markers. We assessed the genetic diversity, phylogeny, and genetic structures of the two species. The divergence time and ecological niche modeling were also tested to infer the possible population demographic history in light of past climate changes. In addition, gene flow between the species was also detected to further elucidate the role of either climate oscillations or geological processes in shaping nucleotide variation and triggering divergence. Together, these analyses not only provide insights into the evolutionary history of two closely related species but also contribute to understanding biodiversity in northern and northeastern China.
Materials and Methods
Plant Materials and Sequencing
On the basis of 23 populations in Jiang et al. (2016), we have newly collected some populations and individuals of R. dauricum. After removing and merging some populations that were close to each other or for which the haplotypes were completely consistent, we newly added 127 R. dauricum individuals in this study. Of these, 88 individuals were from newly added 9 populations and 39 were extensions to the existing populations. Finally, there were a total of 247 R. dauricum individuals in 27 populations (Table 1). Moreover, we newly collected 12 populations of 129 individuals with R. mucronulatum across all the current relevant regions in China. 5 to 23 individuals for each population, only one individual for LB. We distinguished these two species mainly based on geographical distribution and morphological characteristics. Firstly, R. dauricum is mainly distributed in Inner Mongolia, Heilongjiang and Jilin Provinces of China, and R. mucronulatum is mainly distributed in Liaoning Province, Hebei Province, Beijing, Shandong Province, and northern Jiangsu Province. Secondly, the main differences in morphology between the two are the characteristic of scales on the leaves abaxial surface and whether there are hairs on the branchlets. The leaves abaxial surface of R. dauricum densely covered with scales, imbricate or adjacent to each other, spacing 1/2 or 1.5 times their diameter, and branchlets pilose; the spacing of the scales in R. mucronulatum was two to four times its diameter and branchlets glabrous. Sampled individuals were located at least 50 m apart. Additionally, samples of R. micranthum and R. schlippenbachii were also collected to serve as outgroups for cpDNA phylogenetic analyses. All fresh leaf materials were desiccated in silica gel, and voucher specimens were stored in the Northeast Normal University Herbarium (NENU).
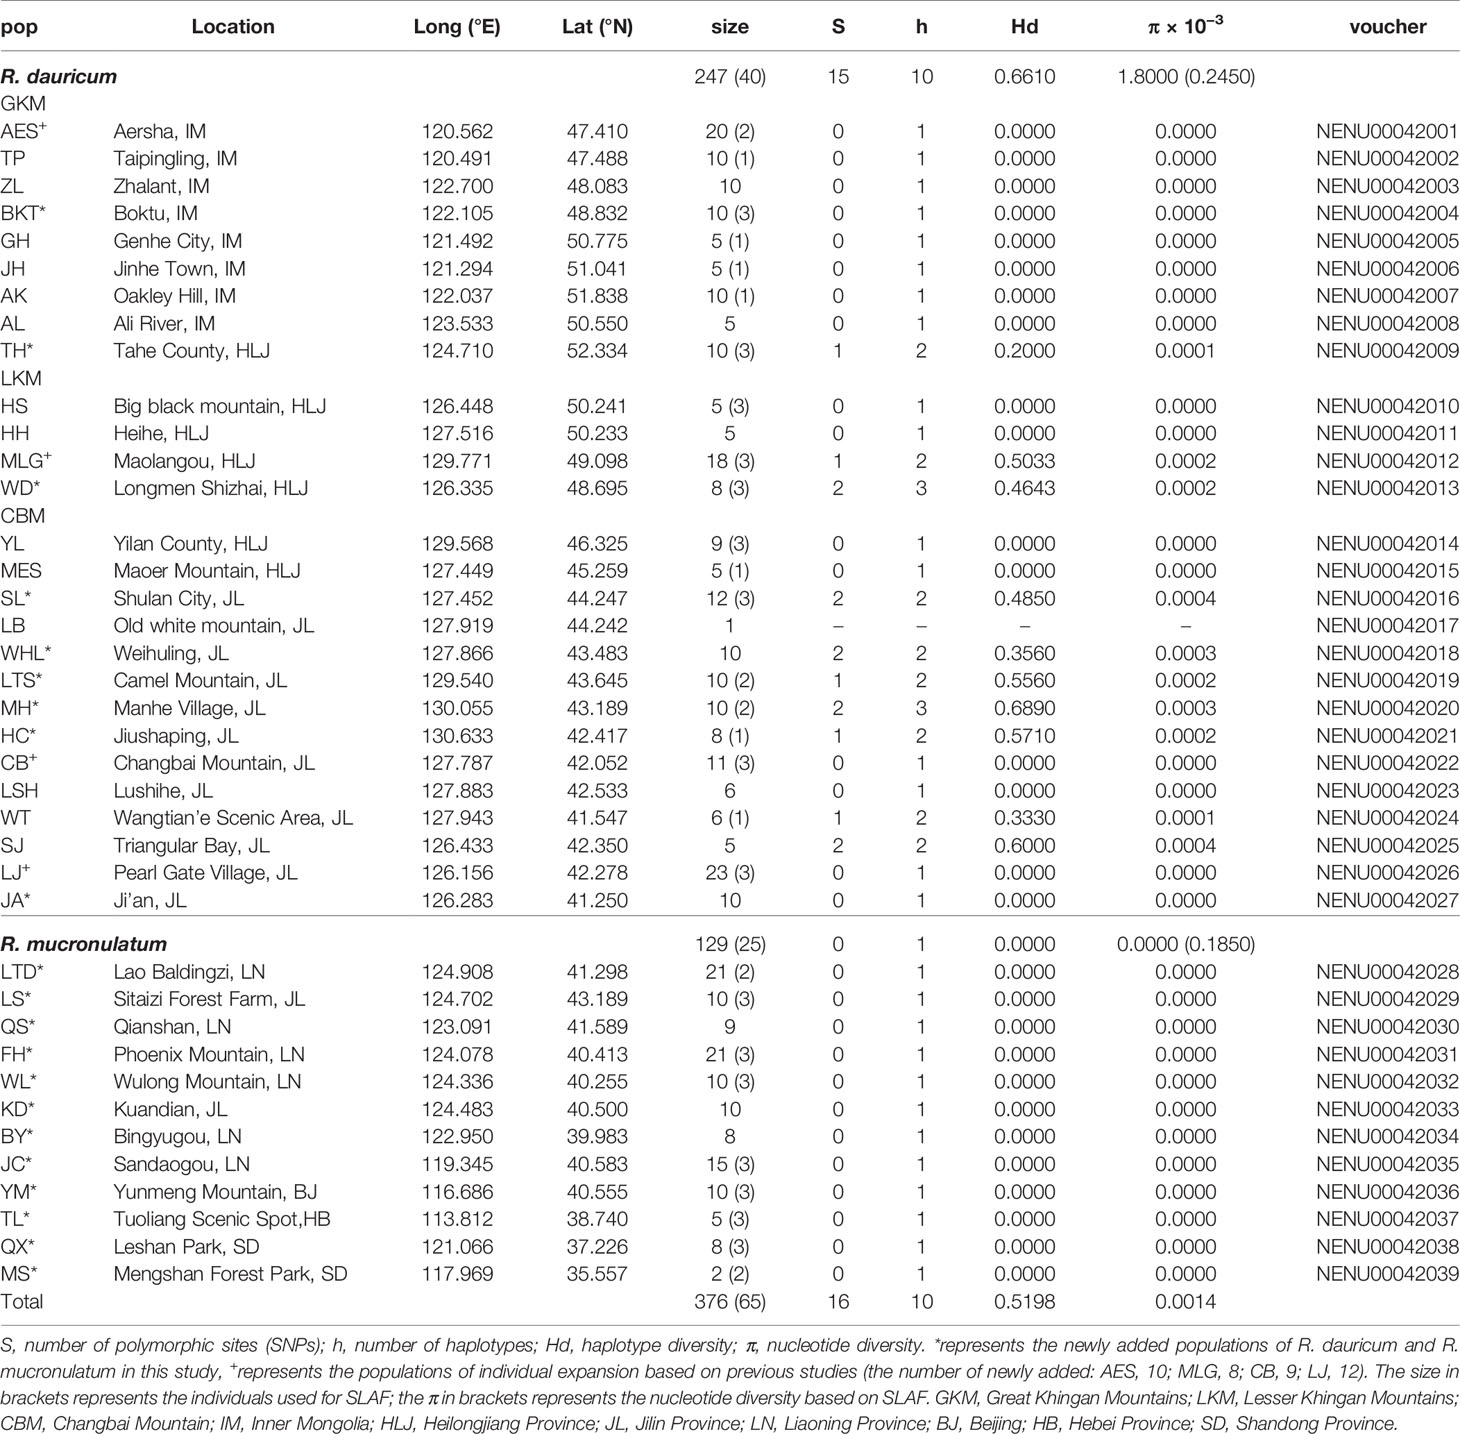
Table 1 Sampling information and genetic diversity for SLAF data and cpDNA of R. dauricum and R. mucronulatum.
Total genomic DNA was extracted using a modified 4 × CTAB procedure (Doyle and Doyle, 1987). The concentration and quality of genomic DNA were tested by agarose gel electrophoresis (1%) and an ND-1000 spectrophotometer (Thermo Fisher Scientific, USA). Qualified DNA samples were stored at −20°C for polymerase chain reaction (PCR) amplification and high-throughput sequencing.
To obtain the orthologous regions of R. dauricum individuals from R. mucronulatum samples, we selected four pairs of primers (trnS-trnG, trnS-trnfM, TabE-ndhJ, trnK-matK) used in a previous study (Jiang et al., 2016), which were most informative for R. dauricum populations. The reagent concentrations, polymerase chain reaction (PCR) process, and sequencing followed Jiang et al. (2016).
Analyses of cpDNA Sequences
DNA sequence alignment was performed using ClustalX 2.0 (Larkin et al., 2007), and alignments were edited manually in BioEdit 7.0.1 (Hall, 1999) before being concatenated. The number of polymorphic sites (S), nucleotide diversity (π), number of haplotypes (h), and haplotype diversity (Hd) were calculated by DnaSP v5 (Librado and Rozas, 2009). We also calculated Tajimas’ D (Tajima, 1989), Fu and Li’ s D and F (Fu and Li, 1993) separately for the two species using this software to test how well the data conformed to the neutral model of evolution. The population differentiation statistic (FST) (Wright, 1984) was calculated by AMOVA in ARLEQUIN 3.5 (Excoffier et al., 2005). Furthermore, the cpDNA haplotype, representing unique DNA sequences or alleles separated by mutational steps, was constructed by TCS v1.2.1 (Clement et al., 2000) with genetic distance and statistical parsimony methods. We chose ‘Gaps = missing’ and set the Fix Connection Limit to 50 steps to ensure that all haplotypes were connected to each other. In order to compare with the phylogenetic tree constructed by SLAF data, we chose the same individuals as SLAF to construct the phylogenetic tree based on cpDNA. A maximum likelihood (ML) tree was constructed in RAxML 8.2.9 software (Stamatakis et al., 2008) under GTRGAMMA selected by jModeltest 2.0 (Darriba et al., 2012) based on Akaike information criterion (AIC) values and bootstrap supports for clades calculated using 1000 bootstrap replicates.
SLAF Sequencing, Read Alignment and SNP Calling
To obtain all haplotypes of cpDNA and represent the distribution of the two species as evenly as possible, we selected 65 individuals (including 40 R. dauricum samples and 25 R. mucronulatum samples) for subsequent SLAF sequencing (Table 1). Samples of R. redowskianum and R. delavayi were used as outgroup. The genome of R. delavayi (ftp://parrot.genomics.cn/gigadb/pub/10.5524/100001_101000/100331/) was selected as the reference genome for enzyme cutting site prediction. After strict filtering, HaeIII and Hpy166II restriction enzymes were finally used to digest the qualified DNA of the sampled individuals according to the results of prerestriction enzyme digestion. To evaluate the accuracy of the enzyme digestion experiment, Oryza sativa subsp. indica was used as a control to ensure the effectiveness of the enzyme-cutting scheme. The obtained SLAF tags with an A-tail added to the 3′ ends were ligated with Dual-index sequencing adaptors, amplified by PCR, screened, and then used to construct the SLAF library (for detailed processes of the SLAF library construction, refer to the methods of Sun et al. (2016). The selected tags were then subjected to pair-end sequencing using an Illumina Hiseq™ 2500 at Biomarker Technologies Corporation in Beijing. Sequencing insert size was 314 to 414 bp and paired-end reads were 126 bp in length.
Clear reads were aligned against the reference genome using Burrows-Wheeler Aligner (BWA) (Li and Durbin, 2009) with parameters defined as missed match = 3; opening gap = 11 and gap extension = 4. False alignment was always detected near Indels; therefore, local alignment was performed. The Genome Analysis Toolkit (GATK) (DePristo et al., 2011) and Sequence Alignment/Map tools (SAMtools) (Li et al., 2009) were used for variant calling under the default setting. Raw SNPs were filtered with a minimum depth (DP) of 3 and minimum mapping quality (MQ) of 30 by our custom Perl scripts, and then PLINK 2 (Purcell et al., 2007) was used to further filter with the minor allele frequency (MAF) of 0.04 and maximum missing rate of 0.5, and SNPs that were out of Hardy-Weinberg equilibrium (HWE) were removed with a p-value threshold < 0.01. Later, considering the linkage disequilibrium (LD) between SNPs, we used the -r2 function in PLINK to quantify pairwise LD between all pairs of SNPs located within 1000 kb of each other, and the results showed that the LD of both species decayed rapidly (Supplementary Figure S1). Thus, we did not further filter SNPs according to LD. All non-biallelic SNPs, which may be caused by sequencing, were filtered using our custom Perl scripts. The final screened SNPs were subjected to subsequent data analyses.
Genetic Diversity, Phylogeny, and Population Structure Analyses
The genetic diversity parameter π and the neutral test of Tajima’s D, Fu and Li’ s D and F values were calculated by PopGenome in R (Bastian et al., 2014) based on SNPs. FST was also calculated by AMOVA in ARLEQUIN 3.5. The ML tree was constructed in the same way as above. The population structure analyses were performed using ADMIXTURE software (Alexander et al., 2009). The number of subgroups (K value) was set as 1 to 10 in advance for clustering, and the clustering results were cross-verified to determine the optimal number of subgroups according to the valley value of the cross-validation error rate. We further performed principal component analysis (PCA) to determine the clustering status of samples using EIGENSOFT (Price et al., 2006).
Divergence Time and Gene Flow
A Bayesian relaxed molecular clock approach was used to estimate species divergence time by MCMCTREE in PAML (Yang, 2007). When using previously published calibration times, the split of Oryza sativa (https://phytozome.jgi.doe.gov/pz//portal.html#!info?alias=Org_Osativa) and Arabidopsis thaliana (https://phytozome.jgi.doe.gov/pz/portal.html#!info?alias=Org_Athaliana_er) was fixed as 130~200 Mya, and the split of R. delavayi and Actinidia chinensis (http://bioinfo.bti.cornell.edu/cgi-bin/kiwi/download.cgi) was estimated to be in the range of 56.1~120.8 Mya (Zhang et al., 2017). The 150 bp sequences before and after the SNPs were used for BLASTN (Altschul et al., 1990) against the reference genomes with an E-value threshold of 1e-3, and then obtained the sequence with a total length of 12,936,348 bp as an input file. R. dauricum and R. mucronulatum individuals were selected from populations TP and MS, respectively, based on the cpDNA haplotype. The data set was modeled under a correlated rates clock, and the HKY85 nucleotide substitution model was determined by ModelFinder (Kalyaanamoorthy et al., 2017). The first 2000 iterations were discarded as burn-in, and every 10 iterations were sampled until 20000 samples were obtained. Furthermore, to account for gene flow among the groups, we used TREEMIX 1.12 (Pickrell and Pritchard, 2012), which infers patterns of population splitting and mixing accessing the covariance structure of allele frequencies between populations and performing a Gaussian approximation for genetic drift.
Ecological Niche Modeling
MaxEnt software (Phillips et al., 2006) was used to predict the distribution models for R. dauricum and R. mucronulatum in the last interglacial (LIG) (0.14–0.12 Mya), the last maximum glacial (LGM) (0.02–0.018 Mya) and current time based on modern distribution records and bioclimatic variables. The occurrence data of species were mainly collected from the following three sources: Chinese Virtual Herbarium (CVH) (http://www.cvh.ac.cn/) and relevant literature; Global Biodiversity Information Facility (GBIF) (http://www.gbif.org); and sampling point information obtained from our field survey. 316 sites of R. dauricum and 214 sites of R. mucronulatum worldwide were obtained. Then, the distribution data obtained in these three ways were manually checked and proofread, and duplicate records within each 2.5-arc-minute cell and artificially planted species distribution points were removed. Finally, 238sites of R. dauricum and 214 sites of R. mucronulatum worldwide were obtained.
The 19 bioclimatic environmental variables were downloaded from the world climate data website (http://www.worldclim.org) with a 30 arc-second resolution for the present and LIG and 2.5 arc-minute for LGM. Then, ArcGIS software (Johnston et al., 2001) was used to perform pairwise correlations among the 19 variables. If r > 0.8, only one of the variables was selected based on the relative contribution to the model to minimize biased fitting of niche models. Accordingly, seven environmental variables were used to simulate species distribution areas for R. dauricum and R. mucronulatum. Model evaluation statistics were produced from 15 replicate runs with 60% of the data used for training and 40% for model testing. Finally, the accuracy of the predicted distribution results was tested by the ROC curve analysis method, and the AUC value (the area under the ROC curve) was obtained. The closer the AUC value is to 1, the farther it is from a random distribution, the greater the correlation between environmental variables and the predicted geographical distribution of species, and the more accurate the model prediction results will be.
Results
Genetic Diversity and Neutrality Test
The concatenated cpDNA sequences (including indels) had an aligned length of 2,711 bp, in which 15 SNPs and 10 haplotypes were identified (Table 1). Excluding the 5 haplotypes published by Jiang et al. (2016), the new 5 haplotypes sequences were deposited in the GenBank database (MT603719–MT603738). In 376 individuals from 39 populations, the haplotype diversity (Hd) and nucleotide diversity (π) ranged from 0 to 0.5198 and from 0 to 0.0014, respectively. Independently, 15 SNPs and 10 haplotypes were identified in R. dauricum populations, and the Hd was 0.6610 and π was 0.0018. The results of the neutrality test showed no significant positive or negative value (Tajima’s D = 1.3348, Fu and Li’s D = −0.1766, Fu and Li’s F = 0.3798; P > 0.1). In contrast, only one haplotype (H6) was detected in R. mucronulatum populations and shared with R. dauricum; that is, there was no variation. The pairwise FST values (0.3541) showed significant genetic differentiation between R. dauricum and R. mucronulatum.
After SLAF library construction and high-throughput sequencing, a total of 735,337 SLAF tags was developed, and the average depth was 16.33x, which generated 328.74 Mb reads, with a mean Q30 of 92.02% and a GC content of approximately 41.53%. The numbers of SLAF markers in each individual ranged from 95,609 to 282,183. Among the SLAFs that were detected in total, 79,696 SLAFs were mapped to the R. delavayi genome and were distributed equally on each chromosome (Supplementary Figure S2A). Then, a total of 6,514,510 SNPs across the 65 accessions were identified by both GATK and SAMtools, which were considered to be reliable and equally well spread across all chromosomes (Supplementary Figure S2B). After various filtering, 664,406 SNPs were finally selected for downstream analyses. The SLAF data have been submitted to the Sequence Read Archive (SRA) database in the NCBI and the accession number was PRJNA589346. The average nucleotide diversity of R. dauricum was 0.2450 × 10⁻³, which was lower than that of the cpDNA (Table 2). In contrast, the average nucleotide diversity of R. mucronulatum (0.1850 × 10⁻³) was higher than that of cpDNA. The results of the neutrality test showed a significant positive value (Tajima’s D = 0.8196, Fu and Li’ s D = 1.5824, Fu and Li’ s F = 1.5494 in R. dauricum; Tajima’s D = 0.6661, Fu and Li’ s D = 0.9743, Fu and Li’ s F = 0.9989 in R. mucronulatum; P < 0.1), which might indicate that these species experienced a bottleneck in their evolutionary history or balancing selection of these loci.
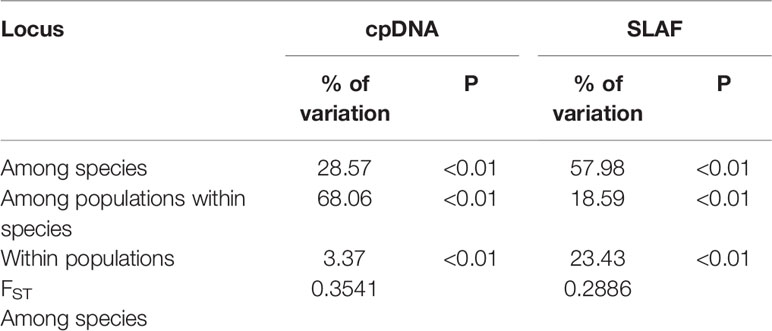
Table 2 Summary results of AMOVA and FST.
Population Structure
The topology obtained from TCS based on cpDNA was used to infer relationships among the 10 cpDNA haplotypes (Figure 1A), of which H1, H6, H8 were the most frequent haplotypes and were located in the center of the haplotype network. However, these three major haplotypes are geographically segregated: H1 from the Changbai Mountains populations of R. dauricum, H6 from R. mucronulatum populations and H8 exclusive to the Great/Lesser Khingan Mountains populations of R. dauricum. Eight mutational steps differentiate H6 from H8, while only two steps separate haplotype H1 from H6 (Figure 1A). In addition, some low-frequency haplotypes were found in a few populations of R. dauricum.
To further understand the evolutionary history of the two species, we used a Bayesian clustering algorithm to estimate the population genetic structure. The results of ADMIXTURE showed that K=2 was the optimal value when the cross-validation (CV) errors were applied(Supplementary Figure S3). When K=2, R. dauricum and R. mucronulatum clustered into distinct groups and showed majority populations collected from the Changbai Mountains (MES, SL, LTS, MH, HC, LJ, CB, WT) of R. dauricum with some admixture from R. mucronulatum (Figure 2A). When K=3, the admixture R. dauricum samples were separate. PCA results also showed that samples from R. dauricum and R. mucronulatum clustered into different groups by PC1, while the samples of R. dauricum from Great/Lesser Khingan Mountains and Changbai Mountains were clustered into distinct groups by PC2 (Figure 2B), consistent with the result of the ADMIXTURE analysis.
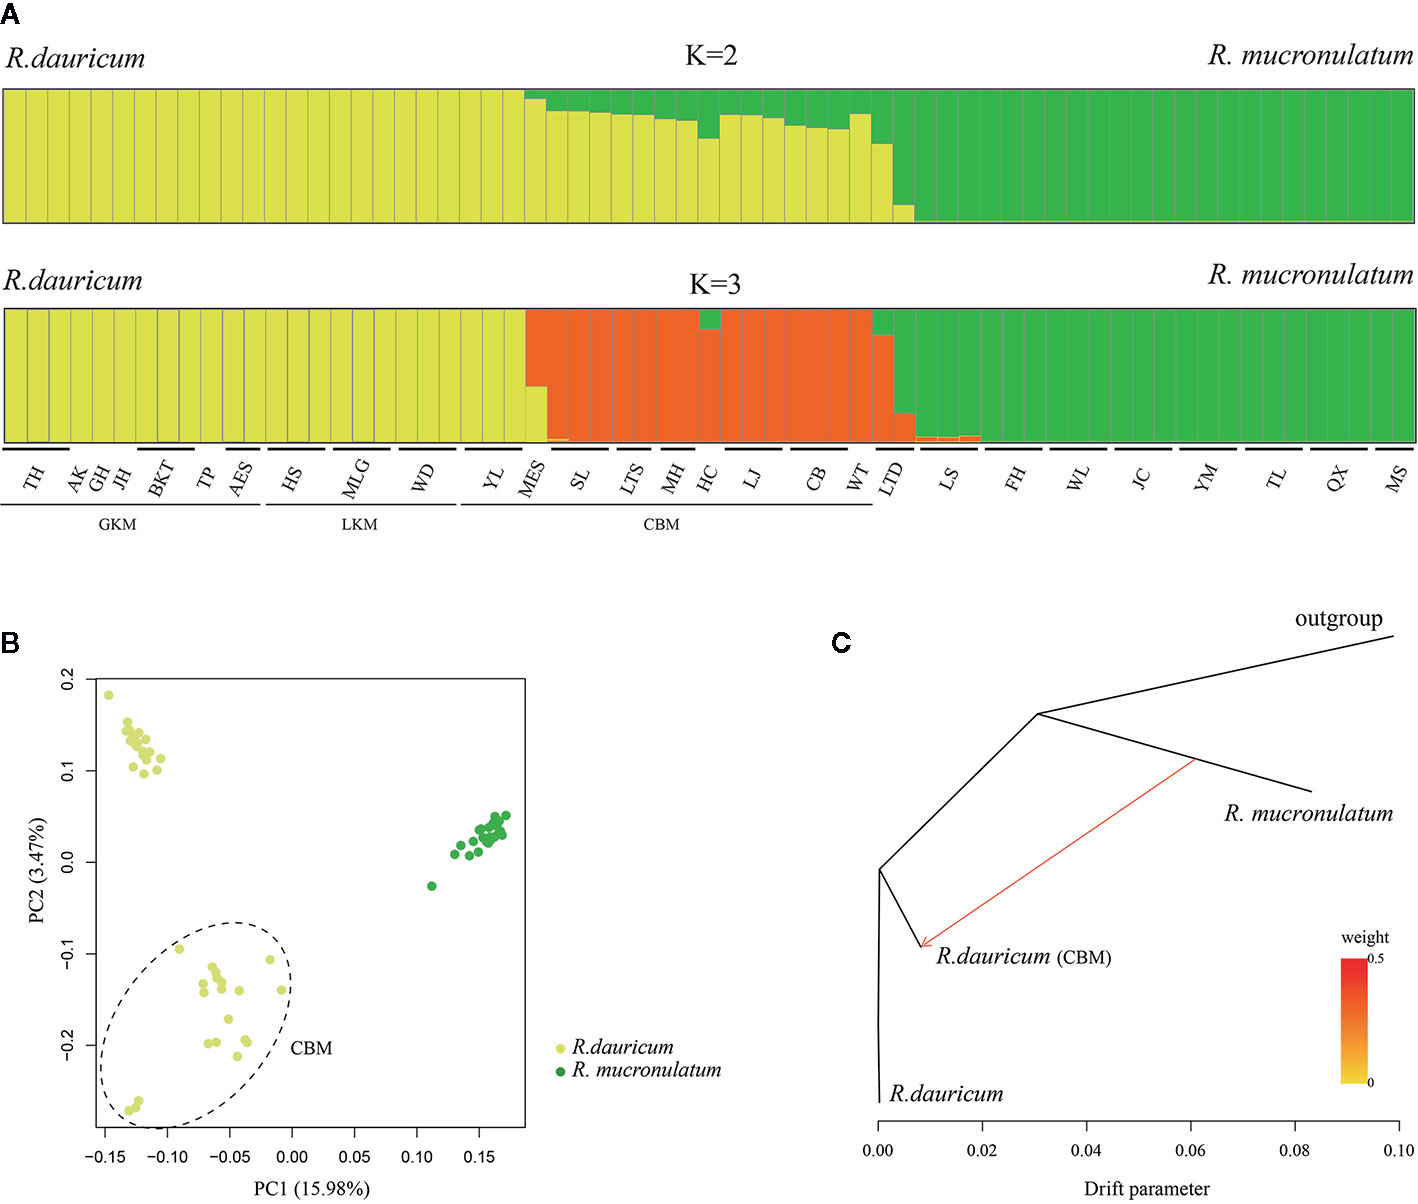
Figure 2 (A) Bayesian clustering of all R. dauricum and R. mucronulatum individuals. Each rectangle represents an individual. The population and region codes were placed at the bottom. (B) Plot of principle component analysis (PCA). The dotted ellipse represents the individuals of R. dauricum from the Changbai Mountains. (C) TREEMIX analysis of population splitting and migration events. Colored arrows represent migration events from R. mucronulatum to R. dauricum (CBM) with color ramp indicating the magnitude of gene flow.
Phylogeny and Divergence Time
The maximum-likelihood (ML) phylogenetic tree of all samples based on the 664,406 SNPs showed that R. dauricum and R. mucronulatum formed a well-supported clade, respectively. (Figure 3A). In the R. dauricum clade, the individuals from Changbai Mountain formed a subclade, and others formed another clade, with a high support value (bootstrap values > 90%). However, the ML tree based on cpDNA (Figure 3B, note that it represents a bootstrap consensus tree and therefore does not show all individual cpDNA haplotypes) presented multiple incongruences with the phylogenetic tree based on SLAF data. The cpDNA phylogeny identified three main lineages: R. mucronulatum, R. dauricum from Changbai Mountain and R. dauricum from elsewhere. R. dauricum did not constitute a monophyletic group.
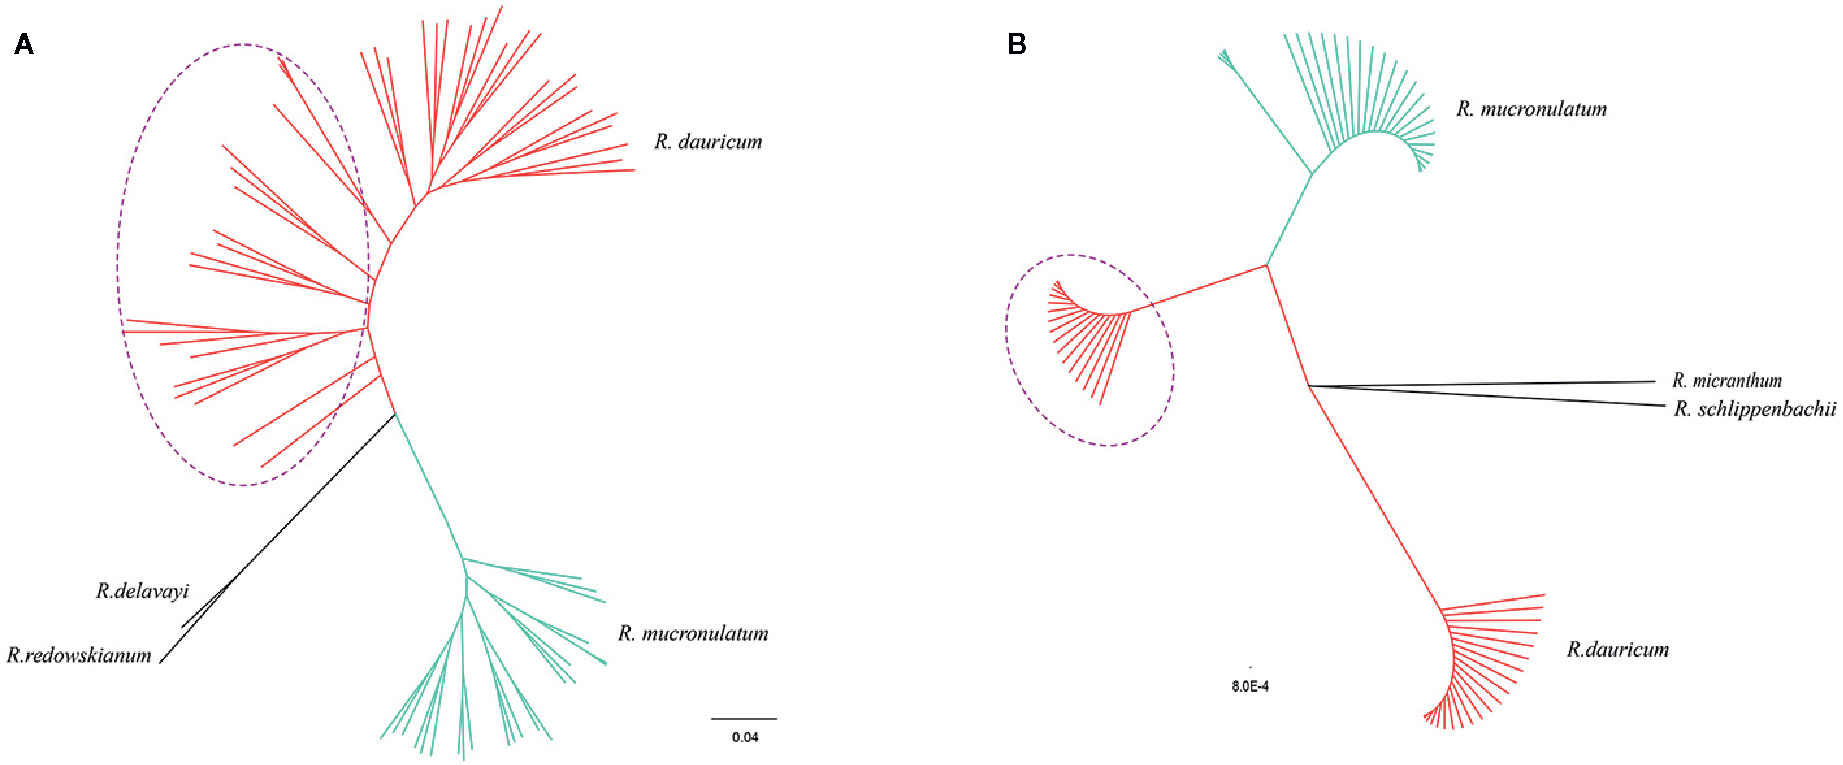
Figure 3 (A) Phylogenetic trees using the maximum-likelihood (ML) method on the basis of 664,406 SNPs. (B) The maximum-likelihood (ML) tree based on 4 cpDNA (the same individuals as SLAF). Bootstrap support values all >90%. The red represents the individuals of R. dauricum; the green represents the individuals of R. mucronulatum. The purple dotted ellipse represents the individuals from the Changbai Mountains.
Based on the two previously published calibration time points, the divergence time was calculated based on the maximum-likelihood (ML) tree using MCMCTREE (Figure 4), which pointed toward the divergence time of outgroup R. redowskianum from the most recent common ancestor of R. dauricum, and R. mucronulatum was dated to have occurred 68.65 Mya (95% HPD interval: 71.42–120.48 Mya), while the divergence time of R. dauricum and R. mucronulatum was estimated at 32.41 Mya (95% HPD interval: 17.54–53.11 Mya) during the early Oligocene. This was in effect also the divergence time between the Siberian and the Far Eastern clades of subgen. Rhodorastrum.
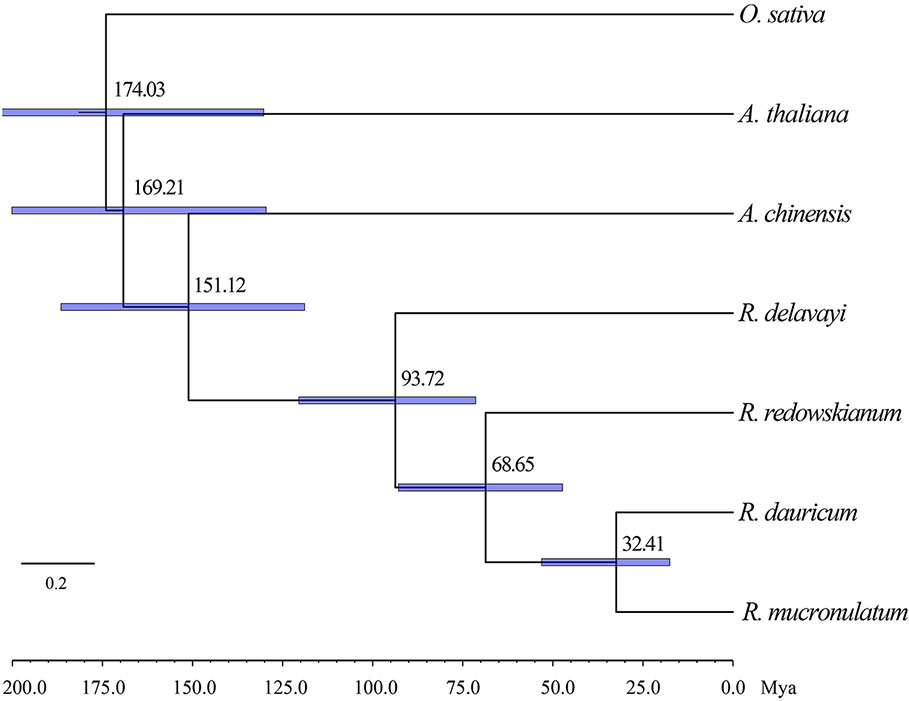
Figure 4 Phylogenetic tree showing result from divergence time analysis using MCMCTREE. Numbers at nodes are divergence age, timescale is in million years ago (Mya). A geological time scale is shown below the tree. Node bars indicate the intervals of 95% HPD.
Genetic Differentiation and Gene Flow
Our hierarchical AMOVA showed that the percentage of variation among species was 28.57% and was significant in terms of cpDNA (P < 0.01) (Table 2). In general, the variations among species in SLAF were 57.98% higher than cpDNA and were the main source of variation, while the main source of variation in cpDNA was found among populations within species (68.06%). The pairwise FST values between R. dauricum and R. mucronulatum showed significant genetic differentiation among species (FST = 0.3541 in cpDNA; FST = 0.2886 in SLAF). The results of TREEMIX suggested a higher proportion of gene flow in populations of R. dauricum and R. mucronulatum from Changbai Mountain (Figure 2C), which may be a major reason for the lack of complete species divergence and the shared haplotype (H6) between R. dauricum (SJ, SL, and WHL) and R. mucronulatum (Figure 1B).
Distribution Model Analysis
Based on the model fitting of the R. mucronulatum and R. dauricum distribution areas by MaxEnt software, the high ROC values (R. dauricum: 0.896, 0.881, 0.881, 0.909; R. mucronulatum: 0.910, 0.945, 0.959, 0.948) indicate the good accuracy of our model predictions. R. mucronulatum in China is mainly distributed in Liaoning, Beijing, Hebei, and Shandong, and the simulated result of the current potential distribution areas is basically consistent with the current distribution areas (Figure 5H), although some areas of southern China were also predicted to be suitable. Based on the paleoclimate information simulation, this species had a relatively large distribution range in the LIG period (Figure 5E), while in the subsequent LGM period (Figures 5F, G), both the CCSM and MIROC models showed that the distribution areas shrank and migrated to the southeast. From LGM until now (Figures 5F–H), the distribution range had neither obvious shrinkage or expansion. In contrast, R. dauricum populations showed the opposite trend, with a relatively small distribution range in the LIG (Figure 5A) and expansion during the LGM (Figures 5B, C), with subsequent shrinkage when the climate was warm (Figure 5D). This is probably related to the fact that R. dauricum is a cold-tolerant plant.
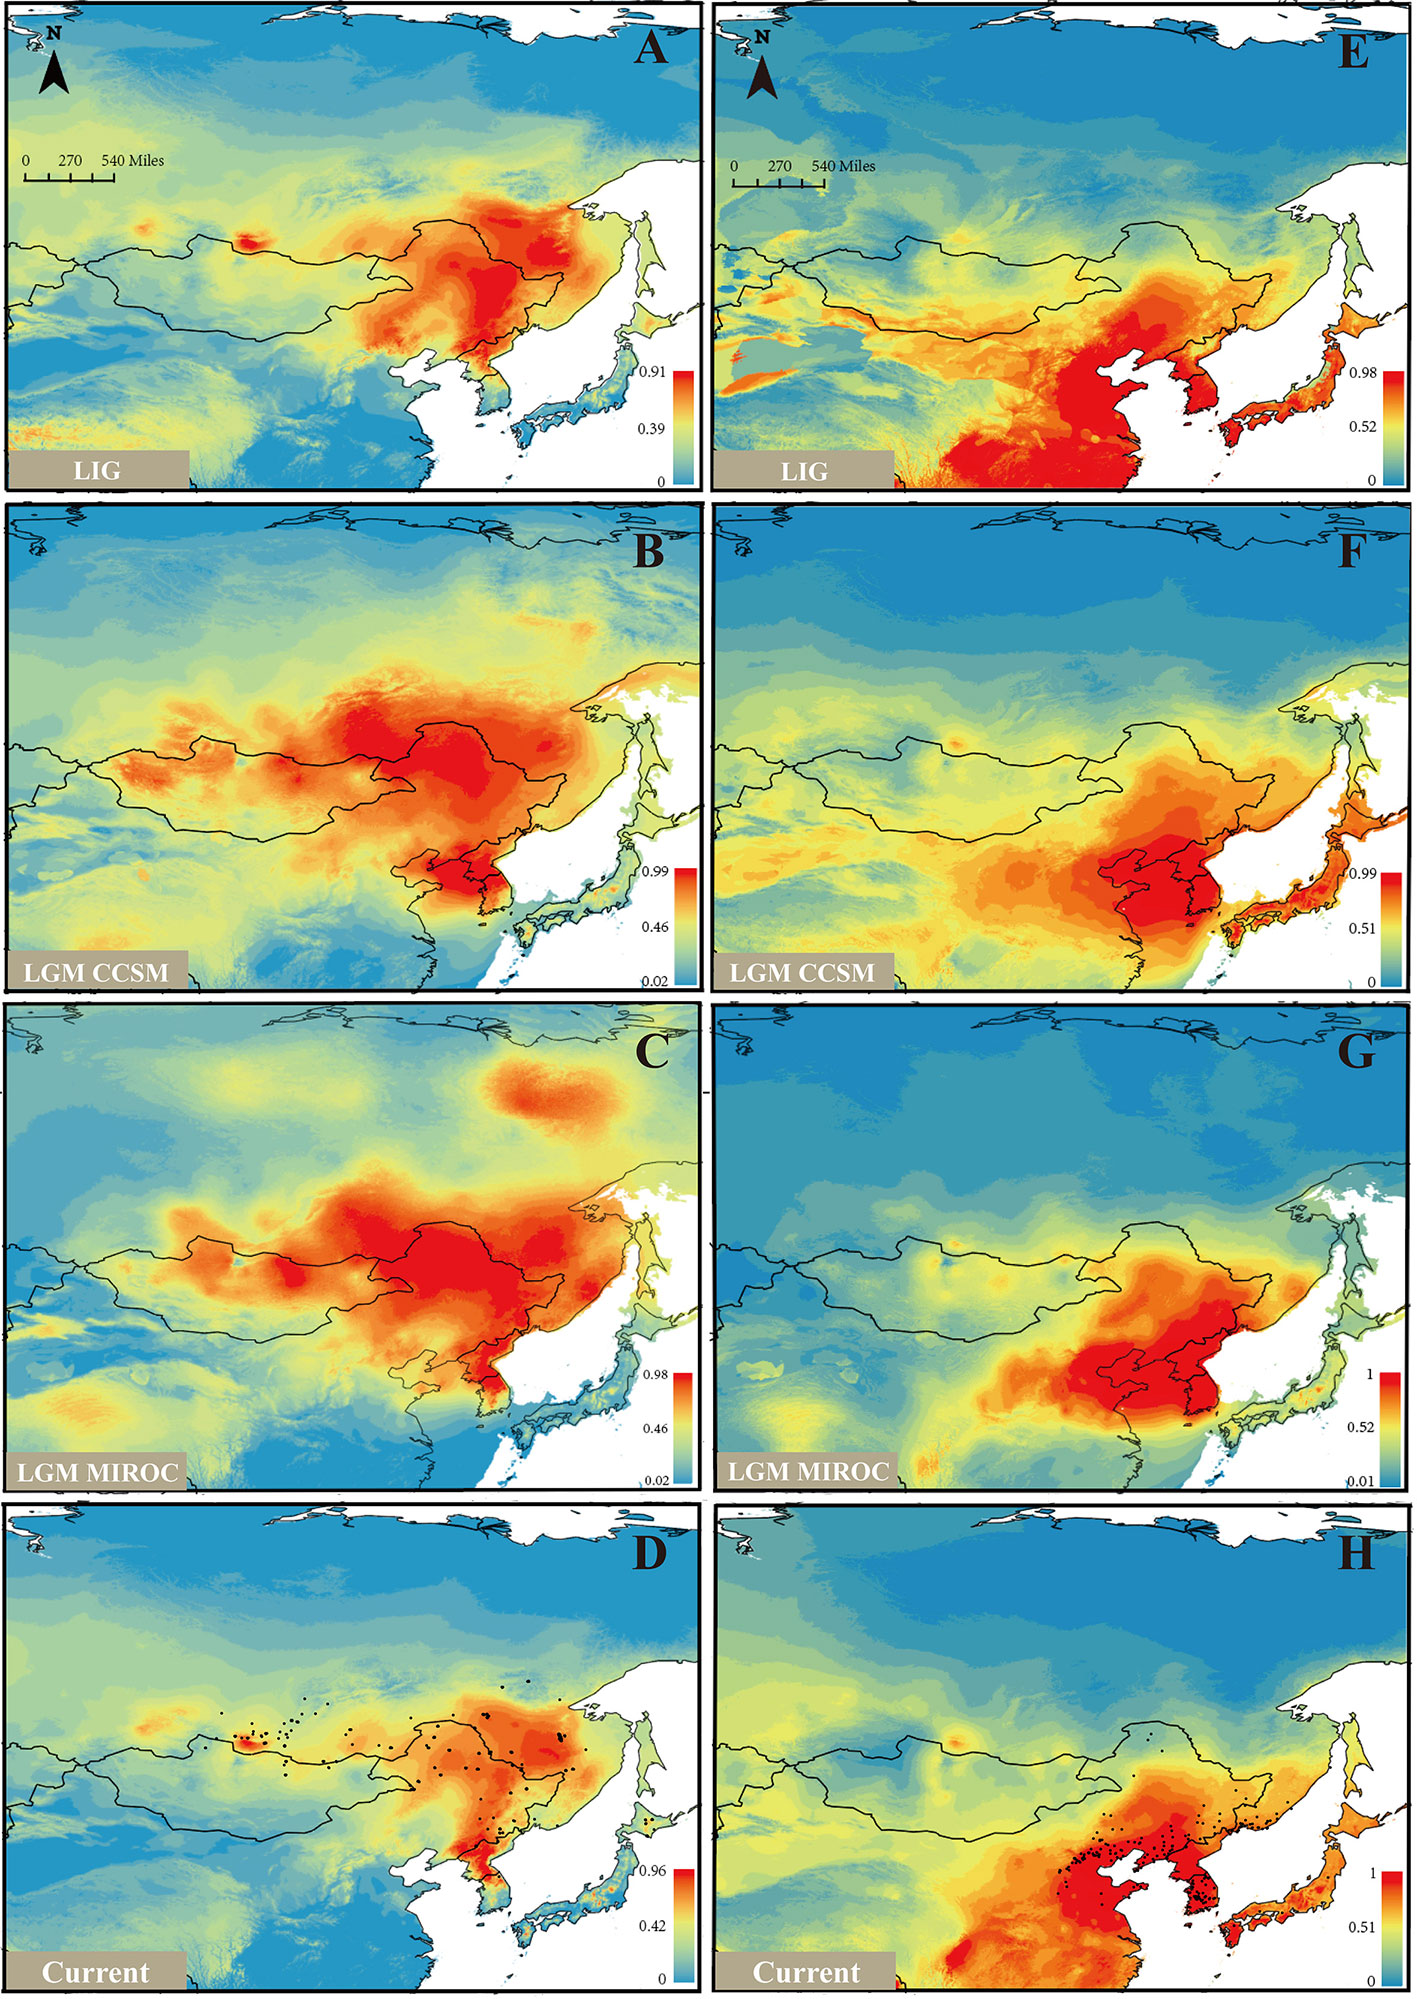
Figure 5 Ecological niche models (ENMs) for R. dauricum and R. mucronulatum. (A–D) represents the distribution of R. dauricum; (E–H) represents the distribution of R. mucronulatum. The black dots in D and H represent the sites of R. dauricum and R. mucronulatum used for simulation.
Discussion
Differences in Genetic Diversity Between R. dauricum and R. mucronulatum
Based on the genetic diversity values obtained in the present study, the total nucleotide diversity (π = 0.0014, Table 1) is relatively high at the subgen. Rhodorastrum level, and the haplotype diversity (Hd = 0.5198) is at a medium level. These two species showed different levels of nucleotide diversity based on SLAF and cpDNA data. The analysis results of SLAF data showed that R. dauricum and R. mucronulatum have similar nucleotide diversity, but a higher level of species-wide nucleotide diversity was found in R. dauricum, consistent with a previous report (Jiang et al., 2016) and that of R. mucronulatum was zero in cpDNA. The nucleotide diversity of R. dauricum was higher than that of other species of Rhododendron, such as R. simsii (π = 1.06 × 10⁻³) (Li et al., 2012). In addition, R. dauricum contained all 10 haplotypes, while R. mucronulatum had only one haplotype (H6) and shared it with R. dauricum. Compared to other temperate species, such as R. delavayi (Hd = 0.5570) (Sharma et al., 2014), R. simsii (Hd = 0.749) (Li et al., 2012), and Platycrater arguta (Hd = 0.8820) (Qiu et al., 2009), R. dauricum was in the middle (Hd = 0.6610), but fewer than 170 angiosperms indicate cpDNA haplotype diversity (Hd = 0.6700) (Petit et al., 2005).
As noted by Wright and Gaut (2005), a series of factors may contribute to genetic diversity in plant species. The niche simulation analysis showed that R. dauricum and R. mucronulatum occupy different niches (Figures 5D, H), so climate may be an important driver that causes genetic diversity between the two species (Wang et al., 2015). For the extreme situation where R. mucronulatum has only one cpDNA haplotype, similarly low cpDNA diversity has been found in Acer mono (Guo et al., 2014) and Juglans mandshurica (Bai et al., 2016) distributed in NEC. These provide evidence that many of these northern populations may have experienced a bottleneck during LGM. Also, the limitation of marker sampling cannot be excluded. Furthermore, due to the ornamental value of this species, the influence of human factors on diversity cannot be ignored.
Oligocene Divergent Event and Demographic Histories of Two Species
Climate changes and tectonic events have had a profound influence on the evolution of different lineages and have often been associated with rapid divergence or speciation (Milne and Abbott, 2002; Milne, 2006; Mao et al., 2012; Zou et al., 2013). Previous studies showed drastic global cooling after the early Eocene Climatic Optimum (EECO; 52–50 Ma) (Zachos et al., 2001). Our study inferred that the divergence of R. dauricum and R. mucronulatum occurred at 32.41 Mya (i.e., the divergence between the Siberian and the Far Eastern clades, Figure 4). This may be driven by the global dramatic climate cooling and reduced sea level (Ivany et al., 2000; Katz et al., 2008; Liu et al., 2009; Buerki et al., 2013) during the late Eocene to the early Oligocene (40–30 Mya). In addition, the separation of most continents and the collision between the plates have a direct or indirect impact on speciation (Hall, 2009). During the North China tectonic period of the Middle Eocene-Oligocene (52–23.3 Mya), the Pacific plate displaced in the NWW (West-Northwest) direction. At approximately 34 Mya, the direction of motion suddenly changed from NNW (West-Northwest) to NWW, causing severe deformation in the eastern part of the Eurasian plate, and mainland China was squeezed in an east-west direction, simultaneously resulting in a series of near-south-north folds (Wan and Cao, 1992). Thus, the divergence between Siberian and the Far Eastern clades was likely to be directly impacted by geomorphological changes.
Based on the cpDNA haplotype geographical distribution (Figure 1), we found that the two populations of MLG and WD of R. dauricum located in LKM have the ancient haplotype H8, special haplotypes H9, H10, and a higher haplotype diversity. The populations of R. dauricum in CBM also have special haplotypes and higher haplotype diversity. In addition, the results of the niche model showed that the populations of R. dauricum clustered to the LKM and CBM in the LIG, with subsequent local expansion during the LGM. Therefore, it is speculated that multiple refugias were maintained in R. dauricum. Li et al. (2012) and Bao et al. (2015) also found similar situations for R. simsii and Pinus koraiensis. In contrast, R. mucronulatum is currently mainly distributed in North China. The niche model showed that its distribution shrank back to the Korean Peninsula during the LGM; thus, the Korean Peninsula may be a glacial refugia for R. mucronulatum (Watanabe et al., 2016).
The Relative Effectiveness of Natural Selection and Gene Flow in the Evolution of the Two Species
Natural selection and gene flow are two important influential factors in the evolution of species. Gene flow generally occurs within a species, but there are numerous examples of interspecific gene flow. Gene flow can achieve homogenizing effects between gene pools (Coyne and Orr, 2004), while natural selection can weaken this effect. When natural selection overcomes the homogenizing effects of gene flow, populations or species are able to evolve separately. Our results of the species tree estimated by TREEMIX suggested a higher proportion of gene flow in populations of R. dauricum from R. mucronulatum (Figure 2C), and the main hybrid zone was observed in the CBM region. Higher levels of migration were suggested from populations of R. mucronulatum to populations of R. dauricum located in the CBM. The divergence time analysis shows a pre-LGM divergence of the two species (Figure 4), and ecological niche modeling revealed the distribution from LGM to now of the two species overlapped in the CBM region (Figure 5). Therefore, gene flow may occur due to the overlap of regions (Li et al., 2010; Abbott et al., 2013; Sun et al., 2016).
In the haplotype geographical distribution, the range-edge populations (SJ, SL, and WHL) of R. dauricum contained the haplotype (H6) from R. mucronulatum (Figure 1B). Consistent with this, the phylogeny tree based on cpDNA showed that the R. dauricum individuals from CBM did not cluster with others that was assigned to the R. mucronulatum clade (Figure 3B). This suggests that there may be seed-mediated unidirectional gene flow from R. mucronulatum to the populations of R. dauricum in the CBM. However, the phylogeny tree based on markers sampled across the SLAF data present the correct topology that R. dauricum and R. mucronulatum form a monophyly, respectively. In addition, the results of clustering analysis based on the SLAF data (K=2) showed that individuals from the CBM experienced introgression from R. mucronulatum, and that group was separate when K=3 (Figure 2), but the optimal K value was 2. The AMOVA results showed that the main source of variation occurred among species in the SLAF data. In general, the main source of variation in cpDNA was among populations within species (Table 2), which may be due to the gene flow from R. mucronulatum increasing genetic differences between populations of R. dauricum. Furthermore, the FST value showed that the genetic differentiation between R. dauricum and R. mucronulatum was generally significant (Table 2). Therefore, all our results suggest that interspecies gene flow exists, but the role of gene flow is not sufficient to offset the disproportionation of natural selection, and the status of the two species has been maintained (Sun et al., 2016). Therefore, we support Tikhonova’s point mentioned above regarding the relationship between the two species that acted as two independent species.
On the other hand, the inconsistency between SLAF and cpDNA also indirectly illustrates the limitations of cpDNA for studying the genetic differentiation and speciation of closely related species, especially the presence of gene flow. Previous research has also demonstrated low species discrimination (24%) for Rhododendron based on cpDNA for both coding and noncoding gene regions when used singly or in combination (Li et al., 2011).
Conclusion
Numerous studies have shown that speciation and diversification cannot be adequately explained only by geographic isolation. Factors such as local selection and gene flow may likely and prevalently influence the divergence and diversification of closely related species. Our study investigated the genetic structure and demographic history of two closely related species distributed in northeastern China and revealed that divergence was strongly influenced by early the Oligocene climatic shift. Despite the deep differentiation of the two species, gene flow was not completely interrupted. The significantly different biogeographic structures indicated that the two species experienced divergent selection since their differentiation and overcame the homogenizing effect of gene flow. Our study provides an additional case of the evolutionary history of two closely related species and contributes to understanding the factors affecting this process.
Data Availability Statement
The original contributions presented in the study are publicly available. The SLAF data can be found in NCBI : [PRJNA589346], the cpDNA data can be found here: [MT603719-MT603738]. Publicly available datasets were analyzed in this study. This data can be found here: [https://www.ncbi.nlm.nih.gov/genbank/ KT696944-KT697615].
Author Contributions
BY and HX designed the research and wrote the manuscript. GZ conducted data analysis and figures made. FG performed the experiments. GZ, FG, MW, and HW collected experimental samples.
Funding
This work was supported by the Natural Science Foundation of the Science and Technology Department of Jilin Province (Subject layout project: 20190201184JC).
Conflict of Interest
Author Baiming Yang was employed by company Changchun Guoxin Modern Agricultural Technology Development Co., Ltd.,.
The remaining authors declare that the research was conducted in the absence of any commercial or financial relationships that could be construed as a potential conflict of interest.
Acknowledgments
The authors wish to thank Mingzhou Sun for his assistance with field sampling.
Supplementary Material
The Supplementary Material for this article can be found online at: https://www.frontiersin.org/articles/10.3389/fpls.2020.01093/full#supplementary-material
References
Abbott, R., Albach, D., Ansell, S., Arntzen, J. W., Baird, S. J. E., Bierne, N., et al. (2013). Hybridization and speciation. J. Evol. Biol. 26, 229–246. doi: 10.1111/j.1420-9101.2012.02599.x
Alexander, D. H., Novembre, J., Lange, K. (2009). Fast model-based estimation of ancestry in unrelated individuals. Genome Res. 19, 1655–1664. doi: 10.1101/gr.094052.109
Altschul, S. F., Gish, W., Miller, W., Myers, E. W., Lipman, D. J. (1990). Basic local alignment search tool. J. Mol. Biol. 215, 403–410. doi: 10.1016/S0022-2836(05)80360-2
Bai, W. N., Wang, W. T., Zhang, D. Y. (2016). Phylogeographic breaks within Asian butternuts indicate the existence of a phytogeographic divide in East Asia. New Phytol. 209, 1757–1772. doi: 10.1111/nph.13711
Bao, L., Ayijiamali, K., Bai, W. N., Chen, R. Z., Wang, T. M., Wang, H. F., et al. (2015). Contributions of multiple refugia during the last glacial period to current mainland populations of Korean pine (Pinus koraiensis). Sci. Rep. 5:18608. doi: 10.1038/srep18608
Baranova, T. V., Kalendar, R. N., Kalaev, V. N. (2014). K voprosu flogenii roda Rhododendron L. na osnove posledovatelnosti speisera ITS1-ITS2. Sibirsk Lesn. Zhur. 6, 29–45.
Bastian, P. R., Ulrich, W., Sebastian, E. R.-O., Martin, J. (2014). PopGenome: An Efficient Swiss Army Knife for Population Genomic Analyses in R. Mol. Biol. Evol. 31, 1929–1936. doi: 10.1093/molbev/msu136
Bhat, S., Amundsen, P. A., Knudsen, R., Gjelland, K. Ø., Fevolden, S. E., Bernatchez, L., et al. (2014). Speciation reversal in European whitefish (Coregonus lavaretus (L.)) caused by competitor invasion. PLoS One 9, e91208. doi: 10.1371/journal.pone.0091208
Buerki, S., Forest, F., Stadler, T., Alvarez, N. (2013). The abrupt climate change at the Eocene-Oligocene boundary and the emergence of South-East Asia triggered the spread of sapindaceous lineages. Ann. Bot. 112, 151–160. doi: 10.1093/aob/mct106
Butlin, R., Debelle, A., Kerth, C., Snook, R. R., Beukeboom, L. W., Cajas, R. F. C., et al. (2012). What do we need to know about speciation? Trends Ecol. Evol. 27, 27–39. doi: 10.1016/j.tree.2011.09.002
Chamberlain, D. F., Hyam, R., Argent, G., Fairweather, G., Walter, K. S. (1996). The genus Rhododendron—its classification and synonymy (Edinburgh: Royal Botanical Garden of Edinburgh Press).
Clement, M., Posada, D., Crandall, K. A. (2000). TCS: a computer program to estimate gene genealogies. Mol. Ecol. 9, 1657–1659. doi: 10.1046/j.1365-294x.2000.01020.x
Darriba, D., Taboada, G. L., Doallo, R., Posada, D. (2012). jModelTest 2: more models, new heuristics and parallel computing. Nat. Methods 9, 772. doi: 10.1038/nmeth.2109
DePristo, M. A., Banks, E., Poplin, R., Garimella, K. V., Maguire, J. R., Hartl, C., et al. (2011). A framework for variation discovery and genotyping using next-generation DNA sequencing data. Nat. Genet. 43, 491–498. doi: 10.1038/ng.806
Doyle, J., Doyle, J. L. (1987). Genomic plant DNA preparation from fresh tissue-CTAB method. Phytochem. Bull. 19, 11–15.
Excoffier, L., Laval, G., Schneider, S. (2005). Arlequin (version 3.0): an integrated software package for population genetics data analysis. Evol. Bioinform. 1, 47–50. doi: 10.1177/117693430500100003
Fang, M. Y., Fang, R. C., He, M. Y., Hu, L. Z., Yang, H. B., Chamberlain, D. (2005). Rhododendron (Beijing & St. Louis: Science Press & Missouri Botanical Garden Press).
Fu, Y. X., Li, W. H. (1993). Statistical tests of neutrality of mutations. Genetics 133, 693–709. doi: 10.0000/PMID8454210
Guo, X. D., Wang, H. F., Bao, L., Wang, T. M., Bai, W. N., Ye, J. W., et al. (2014). Evolutionary history of a widespread tree species Acer mono in East Asia. Ecol. Evol. 4, 4332–4345. doi: 10.1002/ece3.1278
Hall, T. A. (1999). BioEdit: a user-friendly biological sequence alignment editor and analysis program for Windows 95/98/NT. Nucleic Acids Symp Ser. 41, 95–98. doi: 10.1021/bk-1999-0734.ch008
Hall, R. (2009). Southeast Asia’s changing palaeogeography. Blumea 54, 148–161. doi: 10.3767/000651909X475941
Ivany, L. C., Patterson, W. P., Lohmann, K. C. (2000). Cooler winters as a possible cause of mass extinctions at the Eocene/Oligocene boundary. Nature 407, 887–890. doi: 10.1038/35038044
Jiang, N., Man, L., Zhang, W., Dong, H. X., Wang, H. Y., Li, M. R., et al. (2016). Chloroplast View of the Population Genetics and Phylogeography of a Widely Distributed Shrub Species, Rhododendron dauricum (Ericaceae). Syst. Bot. 41, 626–633. doi: 10.1600/036364416X692343
Johnston, K., Ver, H. J. M., Krivoruchko, K., Lucas, N. (2001). Using ArcGIS geostatistical analyst. Redlands: Esri. 300.
Kalyaanamoorthy, S. M., Wong, B. Q., Thomas, K. F., Haeseler, A. V., Jermiin, L. S. (2017). modelfinder: fast model selection for accurate phylogenetic estimates. Nat. Methods. 14, 587–589. doi: 10.1038/nmeth.4285
Katz, M. E., Miller, K. G., Wright, J. D., Wade, B. S., Browning, J. V., Cramer, B. S., et al. (2008). Stepwise transition from the Eocene greenhouse to the Oligocene icehouse. Nat. Geosci. 1, 329–334. doi: 10.1038/ngeo179
Koropachinskii, I. Y., Vstovskaya, T. N. (2002). Drevesnye rasteniya aziatskoi Rossii (Novosibirsk: Publisher House of SB RAS).
Kutsev, M. G., Karakulov, A. V. (2010). Rekonstruktsiya flogenii roda Rhododendron L. (Ericaceae) fory Rossii na osnove posledovatelnostei speiserov ITS1-ITS2. Turczaninowia 13, 59–62.
Larkin, M. A., Blackshields, G. N., Brown, P., Chenna, R., McGettigan, P. A., McWilliam, H., et al. (2007). Clustal W and clustal X version 2.0. Bioinformatics 23, 2947–2948. doi: 10.1093/bioinformatics/btm404
Li, H., Durbin, R. (2009). Fast and accurate short read alignment with Burrows-Wheeler transform. Bioinformatics 25, 1754–1760. doi: 10.1093/bioinformatics/btp324
Li, H., Handsaker, B., Wysoker, A., Fennell, T., Ruan, J. (2009). The sequence alignment/map format and SAMtools. Bioinformatics 25, 2078–2079. doi: 10.1093/bioinformatics/btp352
Li, J. W., Yeung, C. K. L., Tsai, P. W., Lin, R. C., Yeh, C. F., Yao, C. T., et al. (2010). Rejecting strictly allopatric speciation on a continental island: prolonged postdivergence gene flow between Taiwan (Leucodioptron taewanus, Passeriformes Timaliidae) and Chinese (L. canorum canorum) hwameis. Mol. Ecol. 19, 494–507. doi: 10.1111/j.1365-294X.2009.04494.x
Li, D. Z., Gao, L. M., Li, H. T., Wang, H., Ge, S. J., Liu, J. Q., et al. (2011). Comparative analysis of a large dataset indicates that internal transcribed spacer (ITS) should be incorporated into the core barcode for seed plants. Proc. Nat. Acad. Sci. U. S. A. 108, 19641–19646. doi: 10.1073/pnas.1104551108
Li, Y., Yan, H. F., Ge, X. J. (2012). Phylogeographic analysis and environmental niche modeling of widespread shrub Rhododendron simsii in China reveals multiple glacial refugia during the last glacial maximum. J. Sys. Evol. 50, 362–373. doi: 10.1111/j.1759-6831.2012.00209.x
Librado, P., Rozas, J. (2009). DnaSP v5: a software for comprehensive analysis of DNA polymorphism data. Bioinformatics 25, 1451–1452. doi: 10.1093/bioinformatics/btp187
Liu, Z. H., Pagani, M., Zinniker, D., DeConto, R., Huber, M., Brinkhuis, H., et al. (2009). Global cooling during the Eocene-Oligocene climate transition. Science 323, 1187–1190. doi: 10.1126/science.1166368
Lopez-Pujol, J., Zhang, F. M., Sun, H. Q., Ying, T. S., Ge, S. (2011). Centres of plant endemism in China: places for survival or for speciation? J. Biogeogr. 38, 1267–1280. doi: 10.1111/j.1365-2699.2011.02504.x
Ma, Y. P., Xie, W. J., Sun, W. B., Marczewski, T. (2016). Strong reproductive isolation despite occasional hybridization between a widely distributed and a narrow endemic Rhododendron species. Sci. Rep. 6, 19146. 10. doi: 10.1038/srep19146
Mao, K., Milne, R., II, Zhang, L., Peng, Y. L., Liu, J. Q., Philip, T., et al. (2012). Distribution of living Cupressaceae reflects the breakup of Pangea. Proc. Nat. Acad. Sci. U. S. A. 109, 7793–7798. doi: 10.1073/pnas.1114319109
Marczewski, T., Chamberlain, D. F., Milne, R., II (2015). Hybridization in closely related Rhododendron species: half of all species-differentiating markers experience serious transmission ratio distortion. Ecol. Evol. 5, 3003–3022. doi: 10.1002/ece3.1570
Mazurenko, M. T., Hohryakov, A. P. (1991). Ericaceae Juss (St. Petersburg: Sosudistye rasteniya sovetskogo Dalnego Vostoka. Nauka Press).
Milne, R., II, Abbott, R. J. (2002). The origin and evolution of Tertiary relict floras. Adv. Bot. Res. 38, 281–314. doi: 10.1016/S0065-2296(02)38033-9
Milne, R., II (2006). Northern Hemisphere plant disjunctions: a window on tertiary land bridges and climate change? Ann. Bot. 98, 465–472. doi: 10.1093/aob/mcl148
Orr, M. R., Smith, T. B. (1998). Ecology and speciation. Trends Ecol. Evol. 13, 502–506. doi: 10.1016/S0169-5347(98)01511-0
Palme, A. E., Su, Q., Palsson, S., Lascoux, M. (2004). Extensive sharing of chloroplast haplotypes among European birches indicates hybridization among Betula pendula, B. pubescens and B. nana. Mol. Ecol. 13, 167–178. doi: 10.1046/j.1365-294X.2003.02034.x
Papadopulos, A. S. T., Baker, W. J., Crayn, D., Butlin, R. K., Kynast, R. G., Hutton, I., et al. (2011). Speciation with gene flow on Lord Howe Island. Proc. Nat. Acad. Sci. U. S. A. 108, 13188–13193. doi: 10.1073/pnas.1106085108
Petit, R. J., Duminil, J., Fineschi, S., Hampe, A., Salvini, D., Vendramin, G. G. (2005). Invited review: comparative organization of chloroplast, mitochondrial and nuclear diversity in plant populations. Mol. Ecol. 14, 689–701. doi: 10.1111/j.1365-294X.2004.02410.x
Phillips, S. J., Anderson, R. P., Schapire, R. E. (2006). Maximum entropy modeling of species geographic distributions. Ecol. Model. 190, 231–259. doi: 10.1016/j.ecolmodel
Pickrell, J. K., Pritchard, J. K. (2012). Inference of population splits and mixtures from genome-wide allele frequency data. PLoS Genet. 8, e1002967. doi: 10.1371/journal.pgen.1002967
Polezhaeva, M. A., Pimenova, E. A., Tikhonova, N. A., Korchagina, O. S. (2018). Plastid DNA diversity and genetic divergence within Rhododendron dauricum s.l. (R. dauricum s.s., R. ledebourii, R. sichotense and R. mucronulatum; Ericaceae). Plant Sys. Evol. 304, 763–774. doi: 10.1007/s00606-018-1508-1
Price, A. L., Patterson, N. J., Plenge, R. M., Weinblatt, M. E., Shadick, N. A., Reich, D. (2006). Principal components analysis corrects for stratification in genome-wide association studies. Nat. Genet. 38, 904–909. doi: 10.1038/ng1847
Purcell, S., Neale, B., Todd-Brown, K., Thomas, L., Ferreira, M. A. R., Bender, D. (2007). PLINK: a tool set for whole-genome association and population-based linkage analyses. Am. J. Hum. Genet. 81, 559–575. doi: 10.1086/519795
Qiu, Y. X., Qi, X. S., Tao, X. Y., Fu, C. X., Naiki, A., Comes, H. P. (2009). Population genetic structure, phylogeography, and demographic history of Platycrater argute (Hydrangeaceae) endemic to East China and South Japan, inferred from chloroplast DNA sequence variation. Taxon 58, 1226–1241. doi: 10.1016/j.jallcom.2006.08.275
Ribera, I., Castro, A., Diaz, J. A., Garrido, J., Izquierdo, A., Jaech, M. A., et al. (2011). The geography of speciation in narrow-range endemics of the ‘Haenydra’ lineage (Coleoptera, Hydraenidae, Hydraena). J. Biogeogr. 38, 502–516. doi: 10.1111/j.1365-2699.2010.02417.x
Rundell, R. J., Price, T. D. (2009). Adaptive radiation, nonadaptive radiation, ecological speciation and nonecological speciation. Trends Ecol. Evol. 24, 394–399. doi: 10.1016/j.tree.2009.02.007
Rundle, H. D., Nosil, P. (2005). Ecological speciation. Ecol. Lett. 8, 336–352. doi: 10.1111/j.1461-0248.2004.00715.x
Runemark, A., Hey, J., Hansson, B., Svensson, E., II (2012). Vicariance divergence and gene flow among islet populations of an endemic lizard. Mol. Ecol. 21, 117–129. doi: 10.1111/j.1365-294X.2011.05377.x
Schluter, D. (2001). Ecology and the origin of species. Trends Ecol. Evol. 16, 372–380. doi: 10.1016/S0169-5347(01)02198-X
Seehausen, O. (2006). Sympatric speciation: Why the controversy? Curr. Biol. 16, R333–R334. doi: 10.1016/j.cub.2006.03.077
Sharma, A., Poudel, R. C., Li, A., Xu, J. C., Guan, K. Y. (2014). Genetic diversity of Rhododendron delavayi var. delavayi (C. B. Clarke) Ridley inferred from nuclear and chloroplast DNA: implications for the conservation of fragmented populations. Plant Syst. Evol. 300, 1853–1866. doi: 10.1007/s00606-014-1012-1
Shrestha, N., Wang, Z. H., Su, X. Y., Xu, X. T., Lyu, L., Liu, Y. P., et al. (2018). Global patterns of Rhododendron diversity: The role of evolutionary time and diversification rates. Global Ecol. Biogeogr. 27, 913–924. doi: 10.1111/geb.12750
Stamatakis, A., Hoover, P., Rougemont, J. (2008). A rapid bootstrap algorithm for the RAxML web servers. Syst. Biol. 57, 758–771. doi: 10.1080/10635150802429642
Sun, Y., Surget-Groba, Y., Gao, S. X. (2016). Divergence maintained by climatic selection despite recurrent gene flow: a case study of Castanopsis carlesii (Fagaceae). Mol. Ecol. 25, 4580–4592. doi: 10.1111/mec.13764
Tajima, F. (1989). Statistical method for testing the neutral mutation hypothesis by DNA polymorphism. Genetics 123, 585–595.
Taylor, E. B., Boughman, J. W., Groenenboom, M., Sniatynski, M., Schluter, D., Gow, J. L. (2005). Speciation in reverse: Morphological and genetic evidence of the collapse of a three-spined stickleback (Gasterosteus aculeatus) species pair. Mol. Ecol. 15, 343–355. doi: 10.1111/j.1365-294X.2005.02794.x
Tikhonova, N. A., Polezhaeva, M. A., Pimenova, E. A. (2012). AFLP analysis of the genetic diversity of closely related Rhododendron species of the section Rhodorastra (Ericaceae) from Siberia and the Far East of Russia. Russ J. Genet. 48, 1153–1161. doi: 10.1134/S1022795412100110
Vonlanthen, P., Bittner, D., Hudson, A. G., Young, K. A., M€uller, , R., Lundsgaard -Hansen, B., et al. (2012). Eutrophication causes speciation reversal in whitefish adaptive radiations. Nature 482, 357–362. doi: 10.1038/nature10824
Wan, T. F., Cao, R. P. (1992). Middle Eocene-Early Pleistocene tectonic events and stress fields in China. GEOCIECE 6, 3.
Wang, X., Li, Y., Liang, Q., Zhang, L., Wang, Q., Hu, H., et al. (2015). Contrasting responses to Pleistocene climate changes: a case study of two sister species Allium cyathophorum and A. spicata (Amaryllidaceae) distributed in the eastern and western Qinghai-Tibet Plateau. Ecol. Evol. 5, 1513–1524. doi: 10.1002/ece3.1449
Watanabe, Y., Ichiro, T., Shota, S., Song, J. S., Yamamoto, S., Tomaru, N. (2016). Population demographic history of a temperate shrub, Rhododendron weyrichii (Ericaceae), on continental islands of Japan and South Korea. Ecol. Evol. 6, 8800–8810. doi: 10.1002/ece3.2576
Webb, W. C., Marzluff, J. M., Omland, K. E. (2011). Random interbreeding between cryptic lineages of the Common Raven: Evidence for speciation in reverse. Mol. Ecol. 20, 2390–2402. doi: 10.1111/j.1365-294X.2011.05095.x
Wright, S., II, Gaut, B. S. (2005). Molecular population genetics and the search for adaptive evolution in plants. Mol. Biol. Evol. 22, 506–519. doi: 10.1093/molbev/msi035
Wright, S. (1984). Evolution and the genetics of populations (Chicago: University of Chicago press).
Wu, C. Y., Lu, A. M., Tang, Y. C., Li, D. Z. (2003). The Families and Genera of Angiosperms in China (A Comprehensive Analysis) (Beijing: Science Press).
Yang, Z. (2007). PAML 4: phylogenetic analysis by maximum likelihood. Mol. Biol. Evol. 24, 1586–1591. doi: 10.1093/molbev/msm088
Zachos, J., Pagani, M., Sloan, L., Thomas, E., Billups, K. (2001). Trends, rhythms, and aberrations in global climate 65 Ma to present. Science 292, 686–693. doi: 10.1126/science.1059412
Zhang, L., Xu, P., Cai, Y., Ma, L., Zhang, C., Gao, Q., et al. (2017). The draft genome assembly of Rhododendron delavayi Franch. var. delavayi. Gigascience 6, 1–11. doi: 10.1093/gigascience/gix076
Keywords: specific-locus amplified fragment, nucleotide differentiation, gene flow, niche simulation, climate changes
Citation: Yang B, Zhang G, Guo F, Wang M, Wang H and Xiao H (2020) A Genomewide Scan for Genetic Structure and Demographic History of Two Closely Related Species, Rhododendron dauricum and R. mucronulatum (Rhododendron, Ericaceae). Front. Plant Sci. 11:1093. doi: 10.3389/fpls.2020.01093
Received: 13 December 2019; Accepted: 02 July 2020;
Published: 17 July 2020.
Edited by:
Renato Paiva, Universidade Federal de Lavras, BrazilReviewed by:
Yoshiko Shimono, Kyoto University, JapanRobin Van Velzen, Wageningen University and Research, Netherlands
Copyright © 2020 Yang, Zhang, Guo, Wang, Wang and Xiao. This is an open-access article distributed under the terms of the Creative Commons Attribution License (CC BY). The use, distribution or reproduction in other forums is permitted, provided the original author(s) and the copyright owner(s) are credited and that the original publication in this journal is cited, in accordance with accepted academic practice. No use, distribution or reproduction is permitted which does not comply with these terms.
*Correspondence: Hongxing Xiao, eGlhb2h4NzcxQG5lbnUuZWR1LmNu