 Chung Hao Huang1†Gajendra Pratap Singh2†Su Hyun Park1Nam-Hai Chua1,2Rajeev J. Ram2,3*
 Bong Soo Park1*
- 1Temasek Life Sciences Laboratory, National University of Singapore, Singapore, Singapore
- 2Disruptive & Sustainable Technologies for Agricultural Precision, Singapore-MIT Alliance for Research and Technology, Singapore, Singapore
- 3Research Laboratory of Electronics, Massachusetts Institute of Technology, Cambridge, MA, United States
Nutrient deficiency alters growth and development of crop plants and compromises yield. Real-time non-invasive monitoring of the nutritional status of crops would allow timely applications of fertilizers to optimize for growth and yield at different times of the plant’s life cycle. Here, we used Raman spectroscopy to characterize Arabidopsis and two varieties of leafy vegetable crops under nitrogen sufficient and deficient conditions. We showed that the 1046 cm–1 Raman peak serves as a specific signature of nitrogen status in planta, which can be used for early diagnosis of nitrogen deficiency in plants before onset of any visible symptoms. Our research can be applied toward crop management for sustainable and precision agriculture.
Introduction
Precision farming deploys intelligent systems to increase agricultural productivity and profitability while protecting the environment. Sensors can play a valuable role in providing timely, spatially-resolved measurements of biophysical parameters that can guide management decisions. For example, fertilizer application can be tailored to specific crop health. Nitrogen is generally the most important and also the major limiting factor for crop growth and agriculture productivity (Masclaux-Daubresse et al., 2010; Kant et al., 2011). Nitrogen concentration in plant vegetation is related to chlorophyll content and photosynthesis efficiency. Nitrogen-limiting conditions promote leaf senescence lowering yield and biomass in plants (Kant et al., 2011). However, when nitrogen supply surpasses vegetation’s nutritional needs, the excess is eliminated by runoff and infiltration into the water table leading to pollution of aquatic ecosystems resulting in eutrophication. Further environmental pollution is linked to the production of nitrous oxides and the fossil fuels consumed in the production of ammonia (Santamaria, 2006; Ju et al., 2009). Precision agriculture seeks to limit this pollution by using sensor data to deliver precisely enough fertilizer to meet the nutritional needs of plants.
Previous work on optical sensing of nitrogen deficiency has relied on measuring the effect of nutrient stress on chlorophyll content, foliage reflectance and transmittance, via a reduction in chlorophyll, which were found to be affected by nitrogen deficiency. However, changes in the spectral reflectance due to nitrogen deficiency have been shown to overlap with the spectral response due to other nutrient deficient stresses (Chappelle et al., 1992; Peñuelas et al., 1994; Blackmer et al., 1996) and to general stress response (Carter, 1994; Altangerel et al., 2017; Farber and Kurouski, 2018; Sanchez et al., 2019).
Here, we report on the specific, early detection of nitrogen status in plants using Raman spectroscopy. Raman spectroscopy, discovered in Raman and Krishnan (1928), measures the inelastic scattering of laser light that results in a characteristic “fingerprint” of vibrational frequencies for various molecular species present in a sample. Early experiments on aqueous salts of nitrate established the strong Raman peaks near 1049 cm–1 associated with the symmetric stretching of the three oxygen atoms of the nitrate ion (Grassmann, 1932; Silveira and Bauer, 1932). Here, we demonstrate that this nitrate Raman peak can be measured non-invasively in leaves and serves as an early and specific indicator for nitrogen status in plants.
Materials and Methods
Plant Materials, Growth Conditions and Preparation of Plant Samples
Arabidopsis thaliana WT (Col-0) and two leafy vegetables, Pak Choi (Brassica rapa chinensis) and Choy Sum (Brassica rapa var. parachinensis), were used. The nrt2.1-2 mutant in the Col-0 background was obtained from the Salk Institute (Salk_035429). Seeds were germinated on 0.8% agar media containing Murashige and Skoog (MS) salts, 0.5 g/L MES and 10 g/L sucrose. Arabidopsis and vegetables were grown at 22°C with 60% relative humidity in long-day conditions (16 h light/8 h dark) under white light at 100 μmol m–2 s–1 in a growth chamber. Plants were grown in either +N or −N medium by modified Hoagland’s solution containing 2 mM CaCl2 and 3 mM KCl (pH 5.8) instead of 2 mM Ca(NO3)2 and 3 mM KNO3 (pH 5.8). After 3 days leaf yellowing which reflects nitrogen deficiency was not yet seen in plants grown on -N medium. For phosphate or potassium deficiency, we have replaced KH2PO4 with KCl, or KNO3 and KH2PO4 with NaNO3 and NaH2PO4, respectively. The number of biologically independent repeats in each experiment was described in figure legends.
nrt2.1-2 Mutant Genotyping
Arabidopsis genotypes were analyzed by Phire Plant Direct PCR Kit (Thermo Scientific). Briefly, 10 mg leaf sample was ground into a powder and dissolved in 10 ul dilution buffer. Total DNA extract was analyzed by PCR with gene-specific primer sets (Supplementary Table S1).
Total Chlorophyll Content Measurement
Arabidopsis (Col-0 and nrt2.1-2) and two leafy vegetables (Pak Choi and Choy Sum) grown for 3 and 5 days, respectively, on +N or −N medium were used for total chlorophyll measurement. Leaves were extracted with 80% acetone at 4°C for 24 h in darkness. Total chlorophyll per fresh weight of leaf No. 4 samples was calculated as described previously (Porra et al., 1989). The number of biologically independent repeats in each experiment was described in figure legends.
Nitrate Content Measurements
Nitrate content was determined as described previously (Cataldo et al., 1975). Briefly,100 mg leaf tissue was homogenized in 1 mL deionized water and incubated at 100°C for 20 min. 10 μL of the supernatant was mixed with 40 ul 5%(w/v) salicylic-sulphuric acid and the mixture incubated at room temperature for 20 min. Following addition of 950 μL 8% NaOH, the mixture was placed at room temperature for 20 min before O.D. at 410 nm was measured. The number of biologically independent repeats in each experiment was described in figure legends.
RNA Extraction and Quantitative RT-PCR Analysis
Total RNA was isolated from Arabidopsis (Col-0) and the two leafy vegetables (Pak Choi and Choy Sum) using QIAGEN RNeasy Mini Kits (QIAGEN) according to the manufacturer’s instructions. Reverse transcriptional reaction was performed using iScriptTM cDNA Synthesis Kit (Bio-Rad) following to the manufacturer’s instructions. Quantitative RT-PCR was performed using the CFS96 real-time system (Bio-Rad) with ORE1, NRT2.1, NRT2.2 specific primers and ACT2 as a reference gene, or ORE1 and ACT2 orthologous gene for two leafy vegetables (Supplementary Table S1). The number of biologically independent repeats in each experiment was described in figure legends.
Raman Methods
Raman spectra were collected using a purpose-built system designed for 830 nm excitation. The sample holder featured a 100 μm thick fused silica sampling window used for both excitation and collection of the Raman signal. An aspheric lens was used to focus the excitation light and collect the Raman scattered light. The lens was chosen with a depth of focus >1 mm so that Raman signal from the entire cross-section of a leaf was collected. The excitation laser used with this system was a fiber coupled laser (Innovative Photonic Solutions, United States) operating at 830 nm delivering approximately 100 mW of laser power to the sample. Light was delivered from the laser to collimating optics via a 105-micron core multimode fiber. The collimated light was passed through a Semrock MaxLine Laser Line 830 filter (Semrock Inc., United States) to remove any amplified spontaneous emission from the laser and any background generated within the delivery fiber. The filtered light was coupled into the optical path of the excitation lens by a Semrock long pass filter (Semrock Inc., United States) operated as a dichroic mirror. Collected light was passed back through the Semrock filter and then through an additional long pass filter to further attenuate Rayleigh scattered excitation light before being delivered to the spectrometer using an F# matching lens. Spectra were acquired using Kymera 328i spectrograph (Andor, United Kingdom) employing a 600 g/mm optical grating. For each sample of plant leaf, 5 spectra were collected with an integration time of 10 s per sample spot. Cosmic ray events were identified in the 10 s spectra and removed. After cosmic ray removal, the individual 10 s spectra were smoothed across wavelength using the Savitzky-Golay filter function (MATLAB Inc., United States) with a degree of 11. A representative sample spectrum was created by taking the mean value of the five filtered and smoothed spectra at each wavelength. The sample spectrum resulting from this processing contained Raman and fluorescence signal primarily from the leaf. To generate the leaf Raman spectra presented in the results section any residual fluorescence was removed by performing a positive residual style polynomial subtraction as described in reference (Lieber and Mahadevan-Jansen, 2003). Calibration of the Raman shift was performed using a polystyrene sample with a well-known Raman spectrum (Creely et al., 2005). The number of biologically independent repeats in each experiment was described in figure legends.
Principal Component Analysis (PCA)
The spectra were analyzed in the Raman shift wavenumber range of 900–1600 cm–1 across 5 locations across 3 biological replicates for plants and leaves of the same age grown under +N and −N conditions. The eigenvectors of the covariance matrix of the original data set define the principal components (PCs) - the maximal directions of variance within a dataset.
Results
We investigated possible correlation between intensity changes of Raman spectra and nitrogen status in the model plant Arabidopsis thaliana where metabolic pathways are well studied and mutants affected in specific metabolic pathways are available. Three-week-old Arabidopsis plants were grown under sufficient (+N; complete) or nitrogen-deficient (−N) hydroponic media. A typically visible phenotype of nitrogen deficiency is the degradation of chlorophyll leading to leaf yellowing. However, no visible difference in leaf color was seen between plants grown for 3 days under the two conditions (+N and -N) (Figure 1A) and no measurable difference in the leaf chlorophyll content was detected (Figure 1B). However, despite the similarity in visible plant phenotype and chlorophyll content, chemical analysis showed the nitrate content of −N plants was decreased by 8-fold, compared to +N plants (Figure 1C). Moreover, plants grown under −N conditions were indeed experiencing stress responses because transcript levels of ORE1, a nitrogen-starvation induced gene (Park et al., 2018), were 30-fold higher in plants grown under −N conditions compared to +N plants (Figure 1D). These results establish that plants mount a response to nitrogen availability within short time-periods even when visible phenotypic changes associated with nitrogen-deficient stress had not yet appeared.
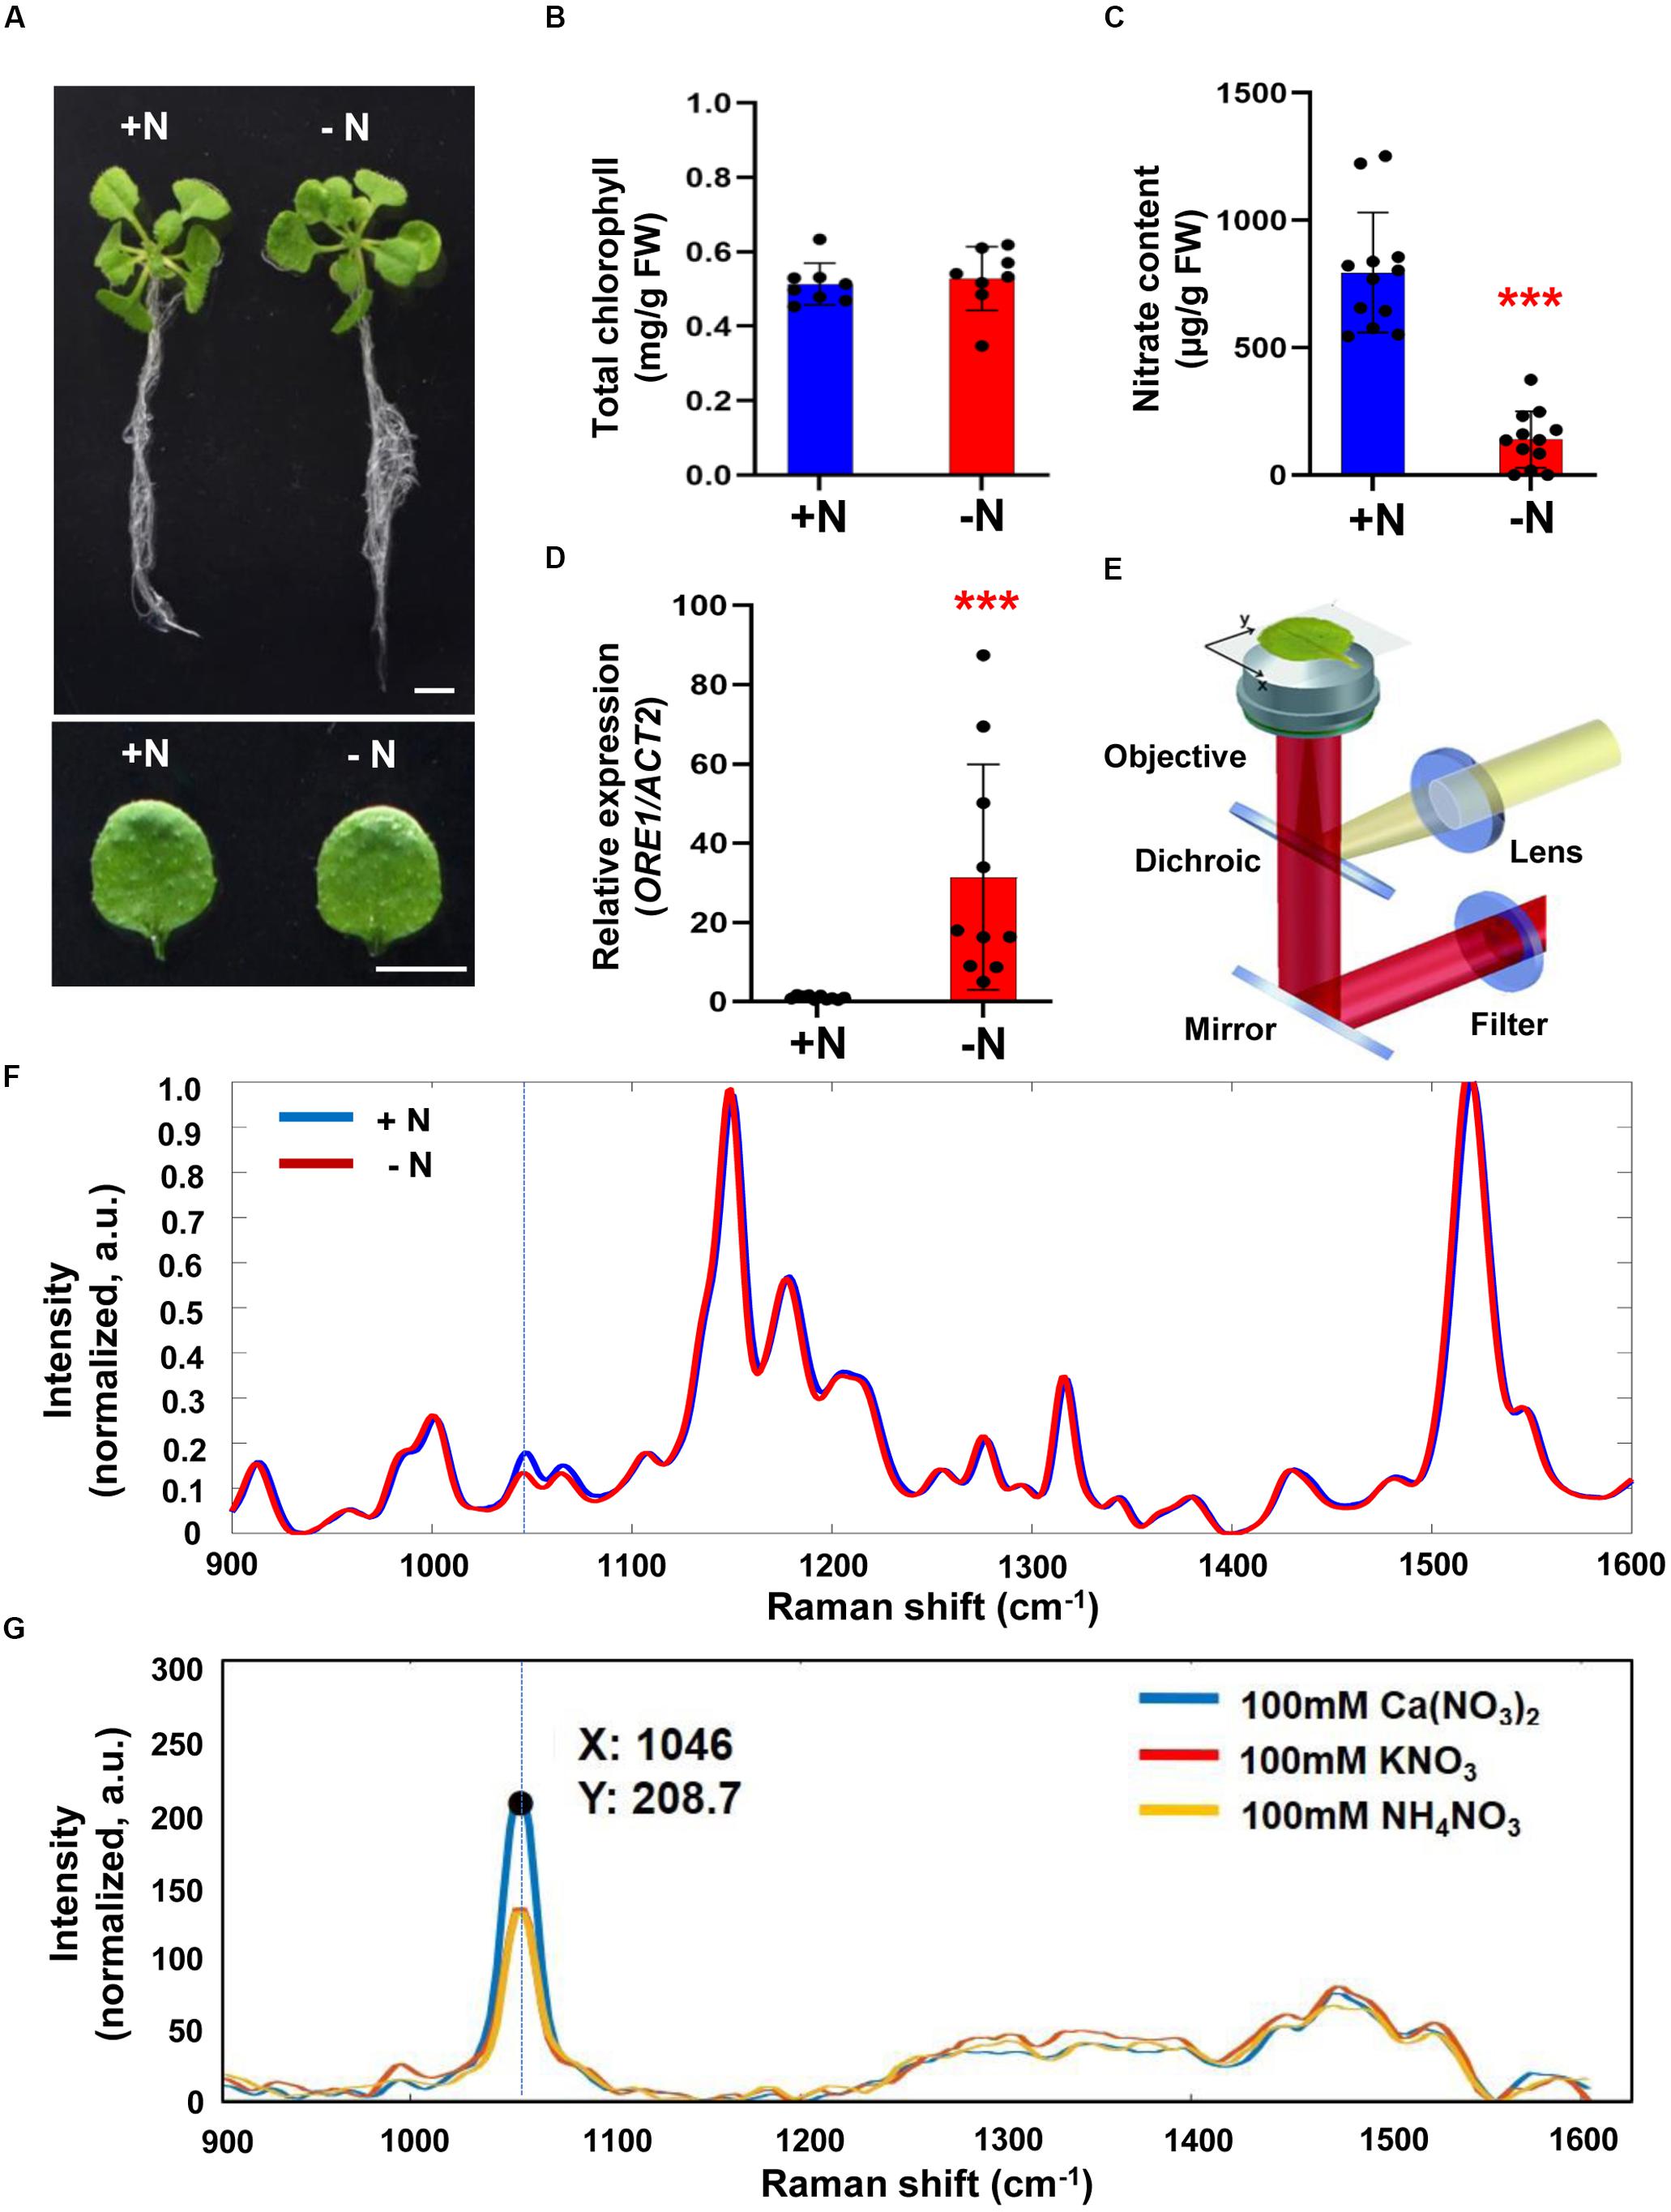
Figure 1. Analysis of biological/molecular phenotype and Raman spectrum of early nitrogen deficiency in Arabidopsis. Three-week-old seedlings of wild-type (WT) Arabidopsis (Col-0) were transferred into nitrogen-sufficient (+N) or nitrogen-deficient (–N) hydroponic medium and grown for an additional 3 days. (A) Morphological phenotype, scale bar, 1 cm. (B) Total chlorophyll content of leaf No. 4 was analyzed in +N and –N plants. n = 8 (biologically independent experiments). Data are mean values, n = 8 (biologically independent experiments) and individual data points are shown as overlays. FW; fresh weight. P values are given in Supplementary Table S2. (C) Nitrate content of leaf No. 4 was analyzed in +N or –N plants. Data are mean values, n = 12 (biologically independent experiments) and individual data points are shown as overlays. Asterisks indicate statistically significant difference compared with + N. *P < 0.05, **P < 0.01, and ***P < 0.001; two-tailed t-test. FW; fresh weight. Supplementary Table S2 shows P values. (D) ORE1 transcript levels were analyzed by qRT-PCR in leaf No.4 samples of +N or -N plants. Data are mean values, n = 10 (biologically independent experiments) and individual data points are shown as overlays. Asterisks indicate statistically significant difference compared with + N. *P < 0.05, **P < 0.01, and ***P < 0.001; two-tailed t-test. Supplementary Tables S1, S2 show primer sets and P values, respectively. (E). Schematic of the Raman spectroscopy setup. (F). Three-week-old seedlings of WT transferred into +N and –N hydroponic medium and grown for 3 days. Leaf No. 4 was used for measurement of Raman spectra. Peak intensities are mean values, n = 12 (biologically independent experiments). (G). Raman spectra of 100 mM Ca(NO3)2, KNO3, and NH4NO3. Identification of the nitrate peak by standard pure chemicals. a.u; arbitrary unit.
We wanted to explore if Raman spectroscopy can be used for early diagnosis of nitrogen deficiency in plants. Figure 1E shows a proposed Raman spectroscopy design for plant leaf analysis. The entire functioning components of Raman spectroscopy that were used in this work are shown in Supplementary Figure S1.
We compared Raman spectra of leaves from +N and −N plants and found differences in the intensity of Raman shifts at 1000 to 1100 cm–1 (Figure 1F). We measured Raman spectra of calcium nitrate [Ca(NO3)2], potassium nitrate (KNO3) and ammonium nitrate (NH4NO3) and all 3 compounds showed a peak at 1046 cm–1 indicating that this Raman shift (associated with the symmetrical stretching of nitrate) is indeed the nitrate peak (Figure 1G).
Three macronutrients are required for plant growth and development: nitrogen (N), phosphate (P) and potassium (K). To confirm the specific association of the 1046 cm–1 peak with nitrate deficiency we determined Raman spectra of plants starved with P or K (Figures 2A,B). Although there were changes between the Raman spectra of +P and −P plants no significant difference in the peak intensity at 1046 cm–1 was detected. Similar results were found for +K or −K plants (Figures 2C,D). These results show that the Raman peak at 1046 cm–1 can be used as a specific signature for plants grown under −N conditions.
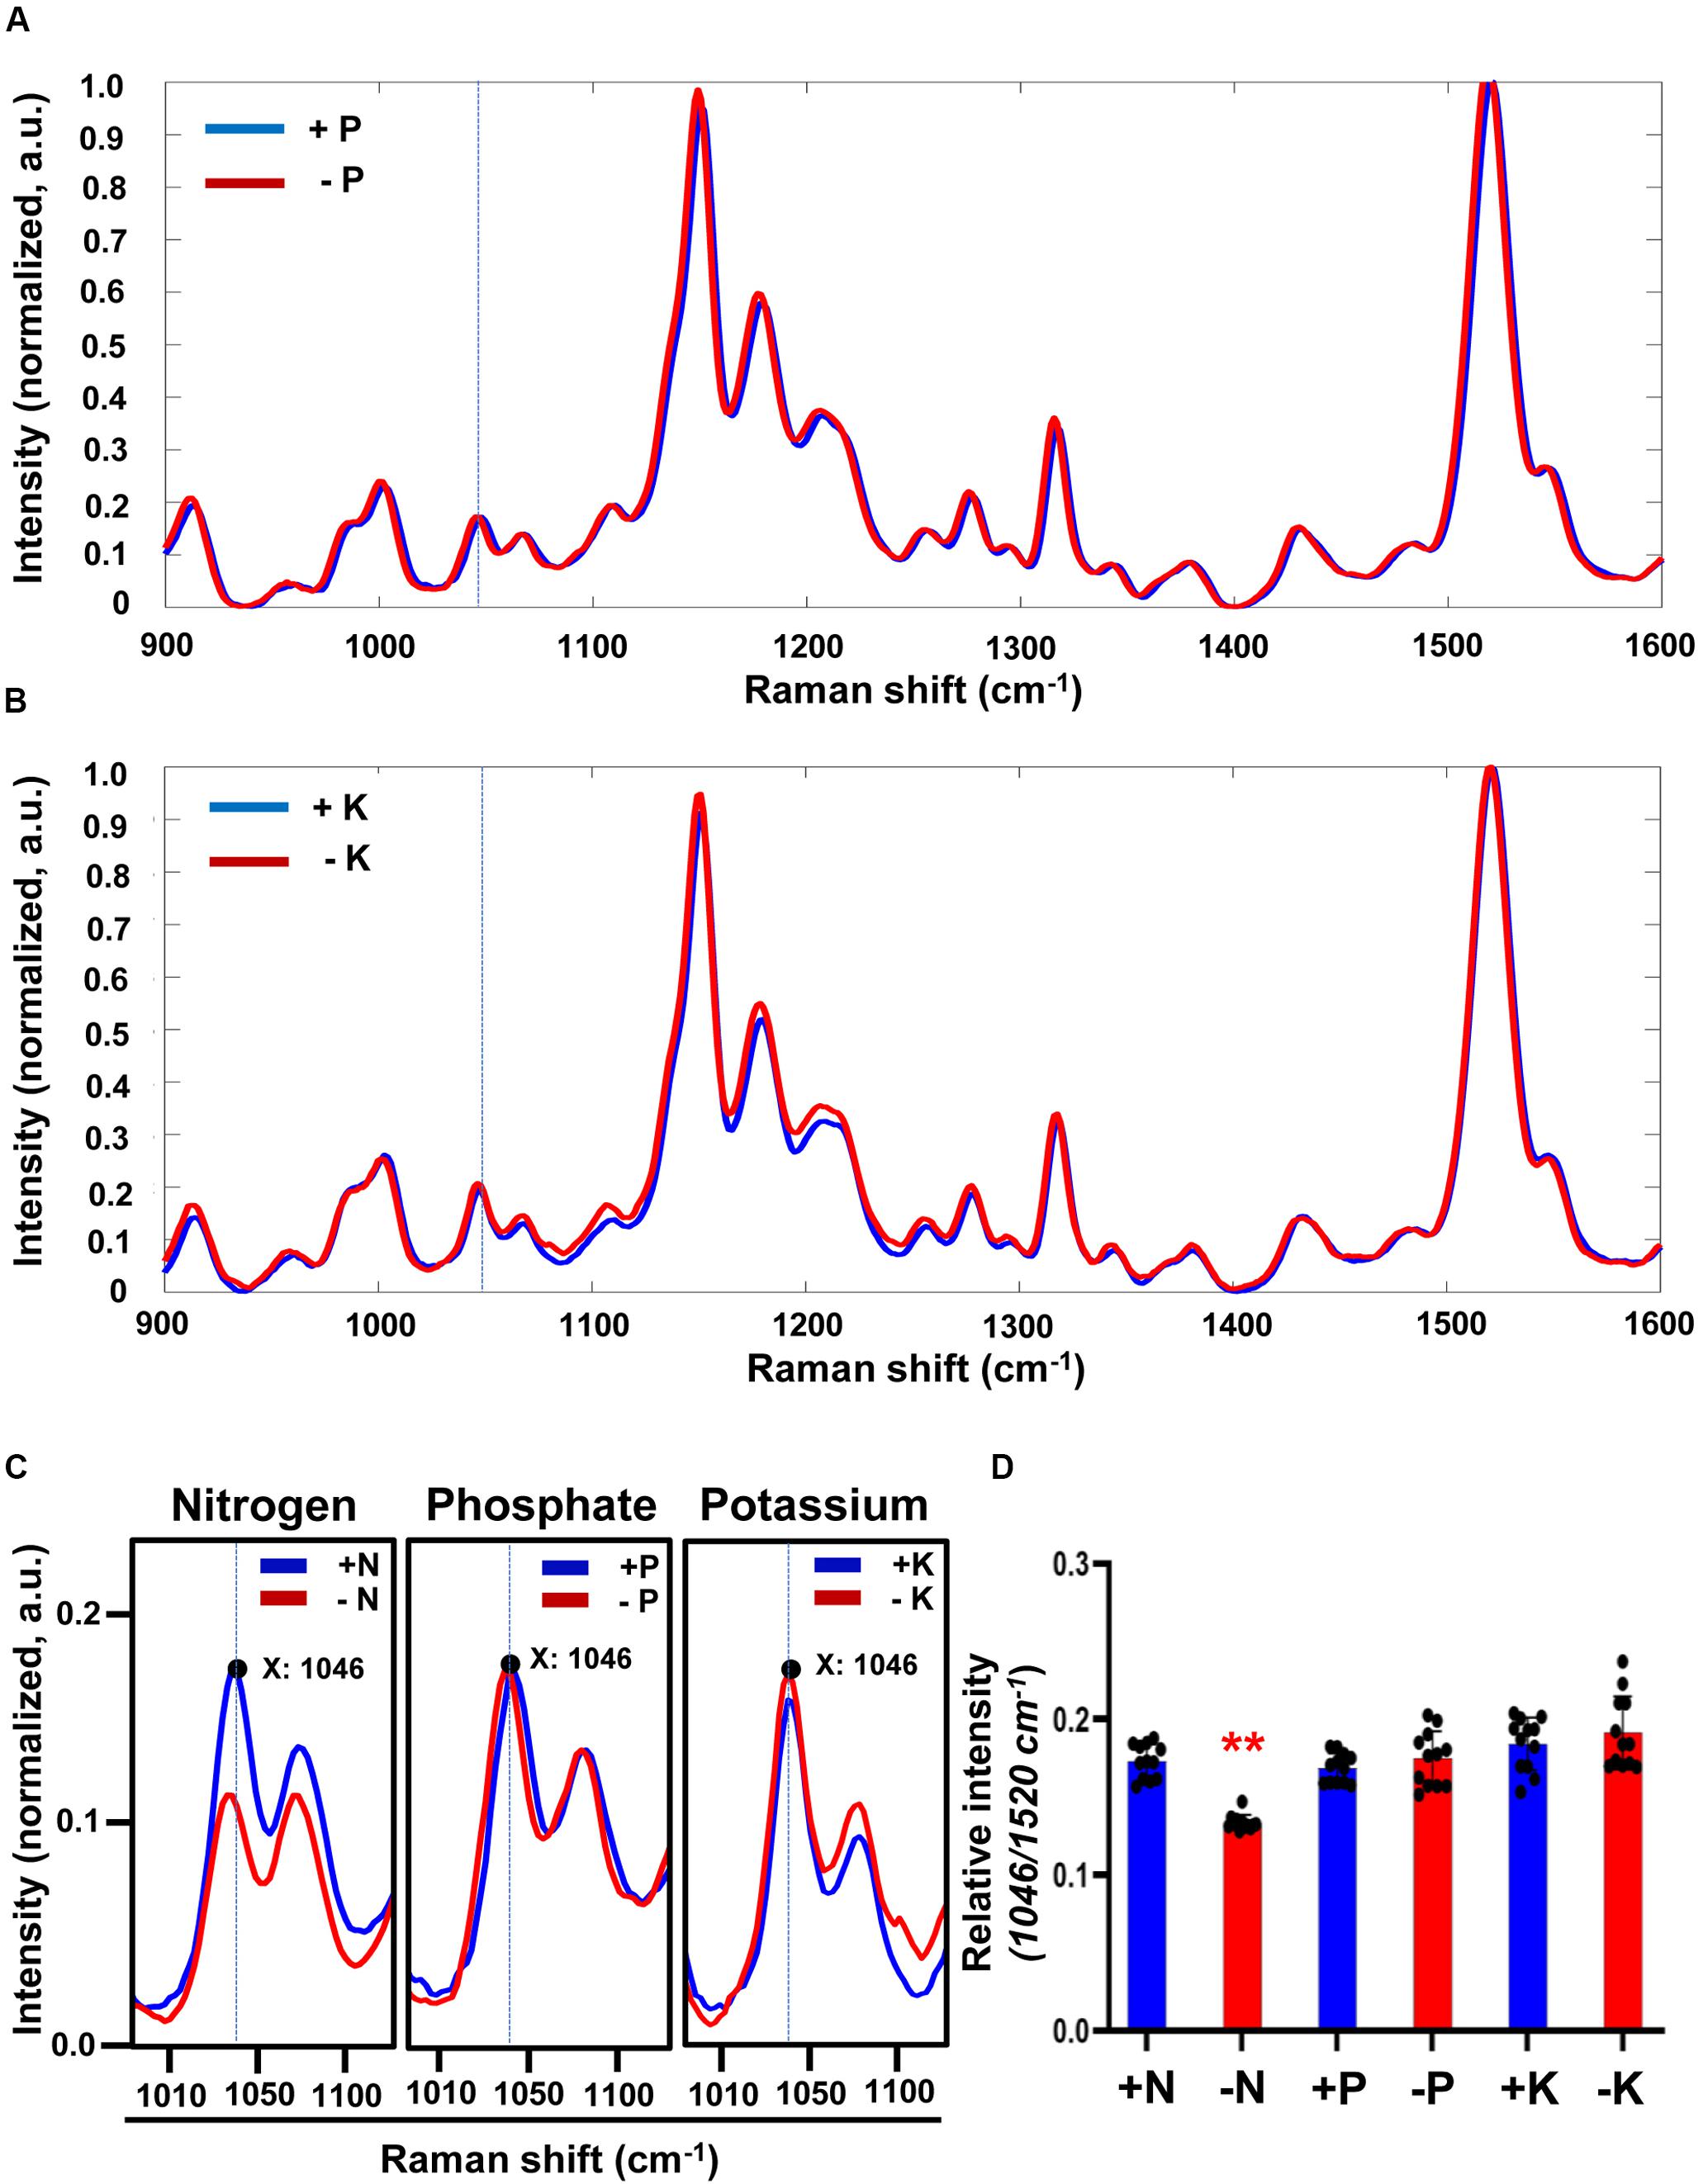
Figure 2. Comparison of Raman spectra under sufficient or deficient condition of 3 macronutrients (N, P, and K) in Arabidopsis. (A,B) Three-week-old seedlings of WT transferred into phosphate-sufficient (+P), phosphate-deficient (–P), potassium-sufficient (+K), or potassium-deficient (–K) hydroponic medium and grown for 3 days. Leaf No. 4 was used for measurement of Raman spectra. Peak intensities are mean values, n = 12 (biologically independent experiments). (C) Comparison of peak intensity of the 1046 cm–1 peak in +N, –N, +P, –P, +K or –K plants. Region of Raman spectra between 1010 and 1100 cm–1 is shown from Figure 1E, 2A,B. a.u; arbitrary unit. (D) The intensity of the 1046 cm–1 peak was analyzed. Data are mean values, n = 12 (biologically independent experiments) and individual data points are shown as overlays. Asterisks indicate statistically significant difference compared with +N, +P or +K, respectively. *P < 0.05, **P < 0.01, and ***P < 0.001; two-tailed t-test. P values are shown in Supplementary Table S3.
In Arabidopsis, several NRT2 genes are significantly expressed in roots and up-regulated by nitrogen deficiency suggesting that they may be responsible for the stimulation of the nitrate high affinity transporter system under nitrogen limiting conditions (Gansel et al., 2001; Orsel et al., 2002; Okamoto et al., 2003; Ju et al., 2009). Previously, it was shown that the influx capacity of the nrt2.1/nrt2.2 double mutants [named by nrt2.1-1 in Wassilewskija (Ws) and nrt2.1-2 in Col-0] at low nitrate concentration was decreased. The nitrate influx in nrt2.1/nrt2.2 was consistently reduced more than that in nrt2.1 at low and high nitrate concentrations (Li et al., 2007). Using nrt2.1-2 mutant, we analyzed the response of nitrate deficiency. First, we confirmed the genotype of the double mutant nrt2.1-2 by checking the expression of NRT2.1 and NRT2.2 using qRT-PCR (Supplementary Figure S2). We then analyzed molecular phenotypes and Raman spectra in 3-week-old wild-type (Col-0) and nrt2.1-2 mutant plants grown for 3 days under nitrogen deficient- and sufficient conditions. There was no difference in the phenotypes of WT and nrt2.1-2 plants grown under +N or −N condition (Figure 3A) and no significant difference in leaf chlorophyll content was detected (Figure 3B). However, chemical analysis showed that the nitrate content of nrt2.1-2 plants was 2-fold less compared to WT under both +N or −N condition (Figure 3C). Moreover, under +N condition ORE1 transcript levels in nrt2.1-2 were slightly induced compared to +N WT plants, and under −N condition, its transcript level of nrt2.1-2 plants were 5-fold higher and 3-fold higher than WT and nrt2.1-2 under +N condition, respectively (Figure 3D). These results show that nrt2.1-2 plants were already under moderate nitrogen deficient stress in +N condition. Figures 3E,F show that the relative peak intensity at 1046 cm–1 in the nrt2.1-2 mutant was significantly lower than in WT under both +N and −N conditions. These changes in 1046 cm–1 intensity correlate with changes in nitrate content. Wider-range spectra of Figure 3E are presented in Supplementary Figure S3.
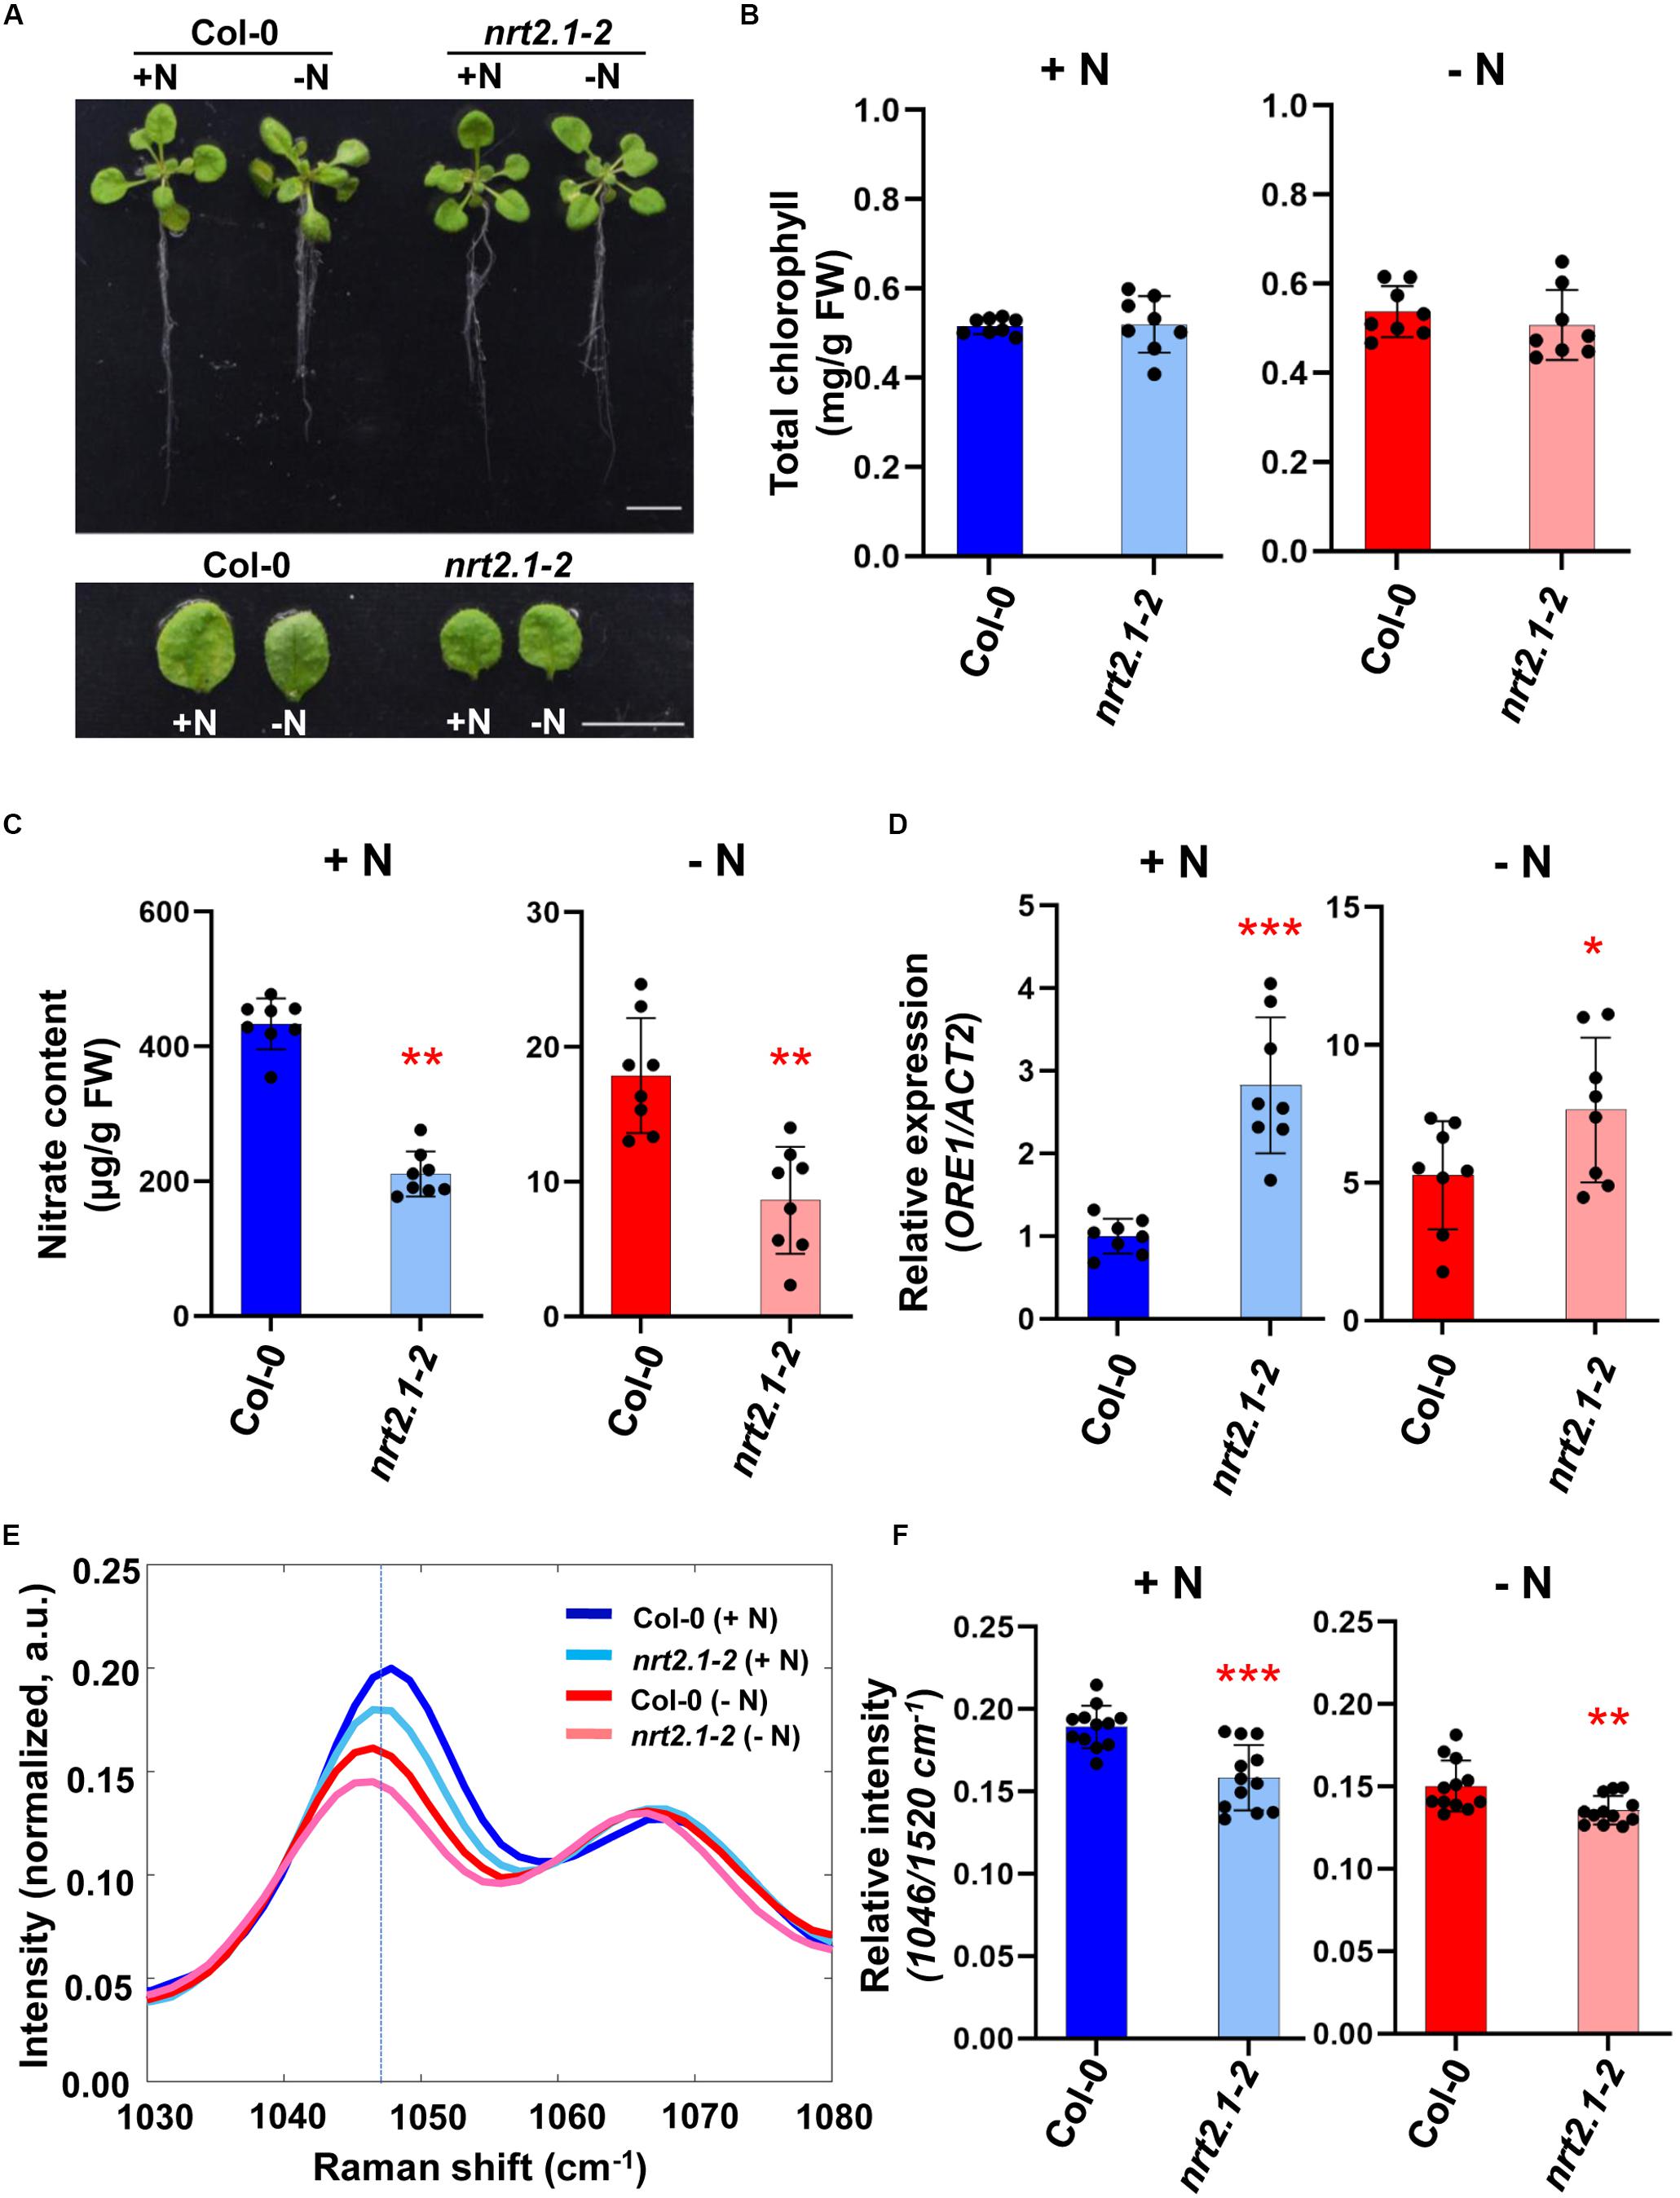
Figure 3. Comparative analysis of biological/molecular phenotype and Raman spectra of early nitrogen deficiency in Arabidopsis WT and nrt2.1-2. Three-week-old seedlings of Arabidopsis WT (Col-0) and nrt2.1-2 were transferred into +N or –N hydroponic medium and grown for 3 days. (A) Morphological phenotype, scale bar, 1 cm. n = 8 (biologically independent experiments). (B) Total chlorophyll content of leaf No. 4 samples was analyzed in +N and –N plants. Data are mean values, n = 8 (biologically independent experiments) and individual data points are shown as overlays. FW; fresh weight. P values are shown in Supplementary Table S4. (C) Nitrate content of leaf No. 4 samples was analyzed in +N and –N plants. Data are mean values, n = 8 (biologically independent experiments) and individual data points are shown as overlays. Asterisks indicate statistically significant difference compared with + N. *P < 0.05, **P < 0.01, and ***P < 0.001; two-tailed t-test. FW; fresh weight. Supplementary Table S4 shows P values. (D) ORE1 transcript levels were analyzed by qRT-PCR in leaf No.4 samples of +N and –N plants Data are mean values, n = 8 (biologically independent experiments) and individual data points are shown as overlays. Asterisks indicate statistically significant difference compared with + N. *P < 0.05, **P < 0.01, and ***P < 0.001; two-tailed t-test. Supplementary Tables S1, S4 show primer sets and P values, respectively. (E,F) Leaf No.4 samples of +N or –N plants were measured by Raman spectroscopy. The 1046 cm–1 region of Raman spectrum shows the nitrate peak of WT or nrt2.1-2 in +N or –N condition. Data are mean values, n = 12 (biologically independent experiments) and individual data points are shown as overlays. Asterisks indicate statistically significant difference compared with Col-0 (+N). *P < 0.05, **P < 0.01, and ***P < 0.001; two-tailed t-test. P values were shown in Supplementary Table S5. a.u; arbitrary unit.
To see if the Raman nitrate peak identified using Arabidopsis can be extended to crop plants, we analyzed Raman spectra of two leafy vegetables belonging to the Brassicacea family: Pak Choi (Brassica rapa chinensis) and Choy Sum (Brassica rapa var. parachinensis). As in Arabidopsis, two varieties of leafy vegetable plants were grown under +N or −N conditions but for 5 days. Similar to Arabidopsis, the two leafy vegetable plants exhibited little phenotypic differences when grown under +N or −N (Figure 4A); neither was there a significant change in their leaf chlorophyll content (Figure 4B). However, nitrate content was significantly decreased in −N plants (Figure 4C). Under −N condition, ORE1 orthologous gene transcript levels in Pak Choi and Choy Sum were increased by 10- and 20-fold, respectively indicating the implementation of nitrogen stress responses (Figure 4D). In both leafy vegetables, the relative intensity of the 1046 cm–1 peak under −N condition was significantly lower than that of +N condition and the peak pattern was similar to that of WT Arabidopsis under −N condition (Figures 4E,F). Wider-range spectra of Figure 4E are shown in Supplementary Figure S4. Taken together, our results suggest that the 1046 cm–1 nitrate peak identified by Raman spectroscopy can also be used to diagnose nitrogen status in crop plants as well.
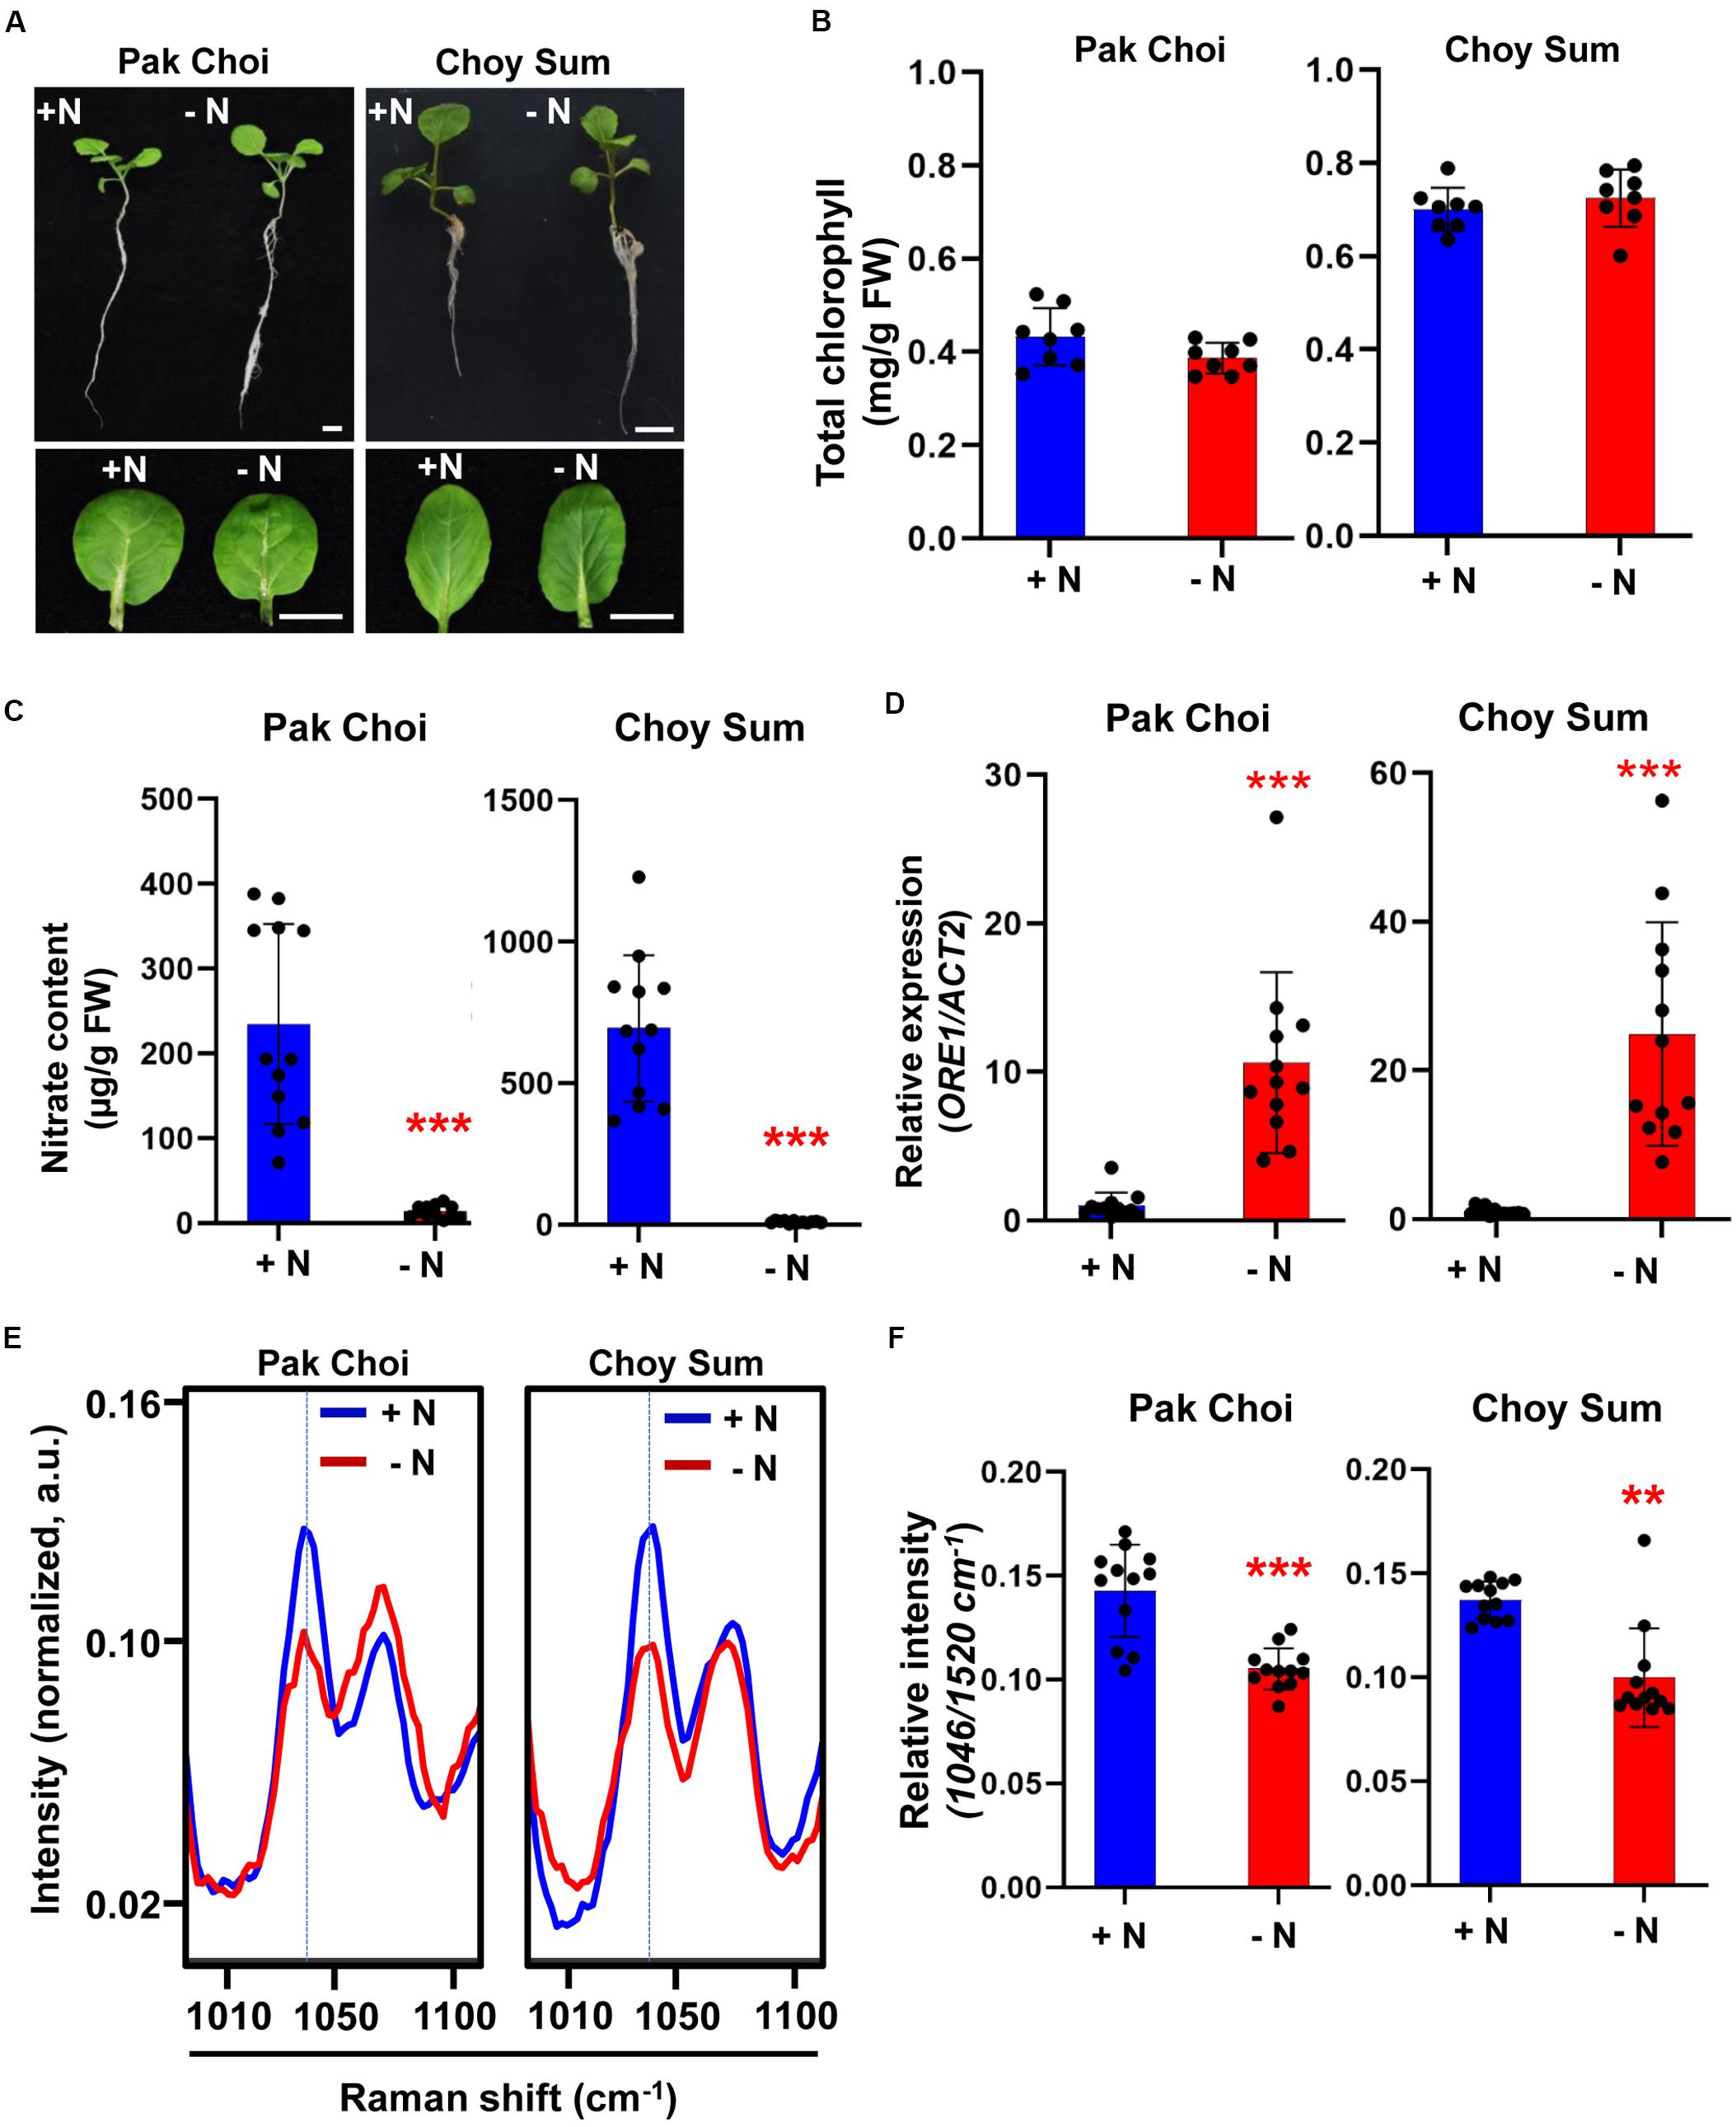
Figure 4. Biological/molecular phenotype and Raman spectral analysis of early nitrogen deficiency in leafy vegetables, Pak Choi and Choy Sum. Two-week-old seedlings of Pak Choi (Brassica rapa chinensis) and Choy Sum (Brassica rapa var. parachinensis) were transferred into +N or –N hydroponic medium and grown for 5 days. (A) Morphological phenotype, scale bar, 1 cm. n = 8 (biologically independent experiments). (B) Total chlorophyll content of leaf No. 4 samples was analyzed in +N and –N plants. Data are mean values, n = 8 (biologically independent experiments) and individual data points are shown as overlays. Asterisks indicate statistically significant difference compared with + N. *P < 0.05, **P < 0.01, and ***P < 0.001; two-tailed t-test. FW; fresh weight. P values are shown in Supplementary Table S2. (C) Nitrate content of leaf No. 4 samples was analyzed in +N and –N plants. Data are mean values, n = 12 (biologically independent experiments) and individual data points are shown as overlays. Asterisks indicate statistically significant difference compared with + N. *P < 0.05, **P < 0.01, and ***P < 0.001; two-tailed t-test. FW; fresh weight. P values are shown in Supplementary Table S2. (D) ORE1 orthologous gene transcript levels were analyzed by qRT-PCR in leaf No. 4 samples of Pak Choi and Choy Sum grown under +N or –N condition for 5 days. Data are mean values, n = 12 (biologically independent experiments) and individual data points are shown as overlays. Asterisks indicate statistically significant difference compared with +N. *P < 0.05, **P < 0.01, and ***P < 0.001; two-tailed t-test. Supplementary Tables S1, S2 show primer sets and P values, respectively. (E,F) Leaf No. 4 samples from +N and -N plants were measured by Raman spectroscopy. Only the 1046 cm–1 of Raman shift (cm–1) is shown. Data are mean values, n = 12 (biologically independent experiments) and individual data points are shown as overlays. Asterisks indicate statistically significant difference compared with +N. *P < 0.05, **P < 0.01, and ***P < 0.001; two-tailed t-test. P values were shown in Supplementary Table S5. a.u; arbitrary unit.
To see if Raman spectroscopy can be integrated into the management of plant nutritional status, we performed time course experiments of Arabidopsis under −N conditions. Figure 5A shows that the 1046 cm–1 peak intensity decreased with time upon transfer to the −N medium. To see if this decrease in peak intensity at 1046 cm–1 can be reversed we transferred −N (day 3) plants to +N medium and followed their recovery for several days. Figure 5B shows after one day in the +N medium nitrate peak intensity at 1046 cm–1 was still lower than that under nitrogen sufficient condition, but the peak intensity returned to the level of that of +N plants after 4 days in the full medium. Supplementary Figures S5, S6 show the corresponding wider-range spectra of Figures 5A,B, respectively.
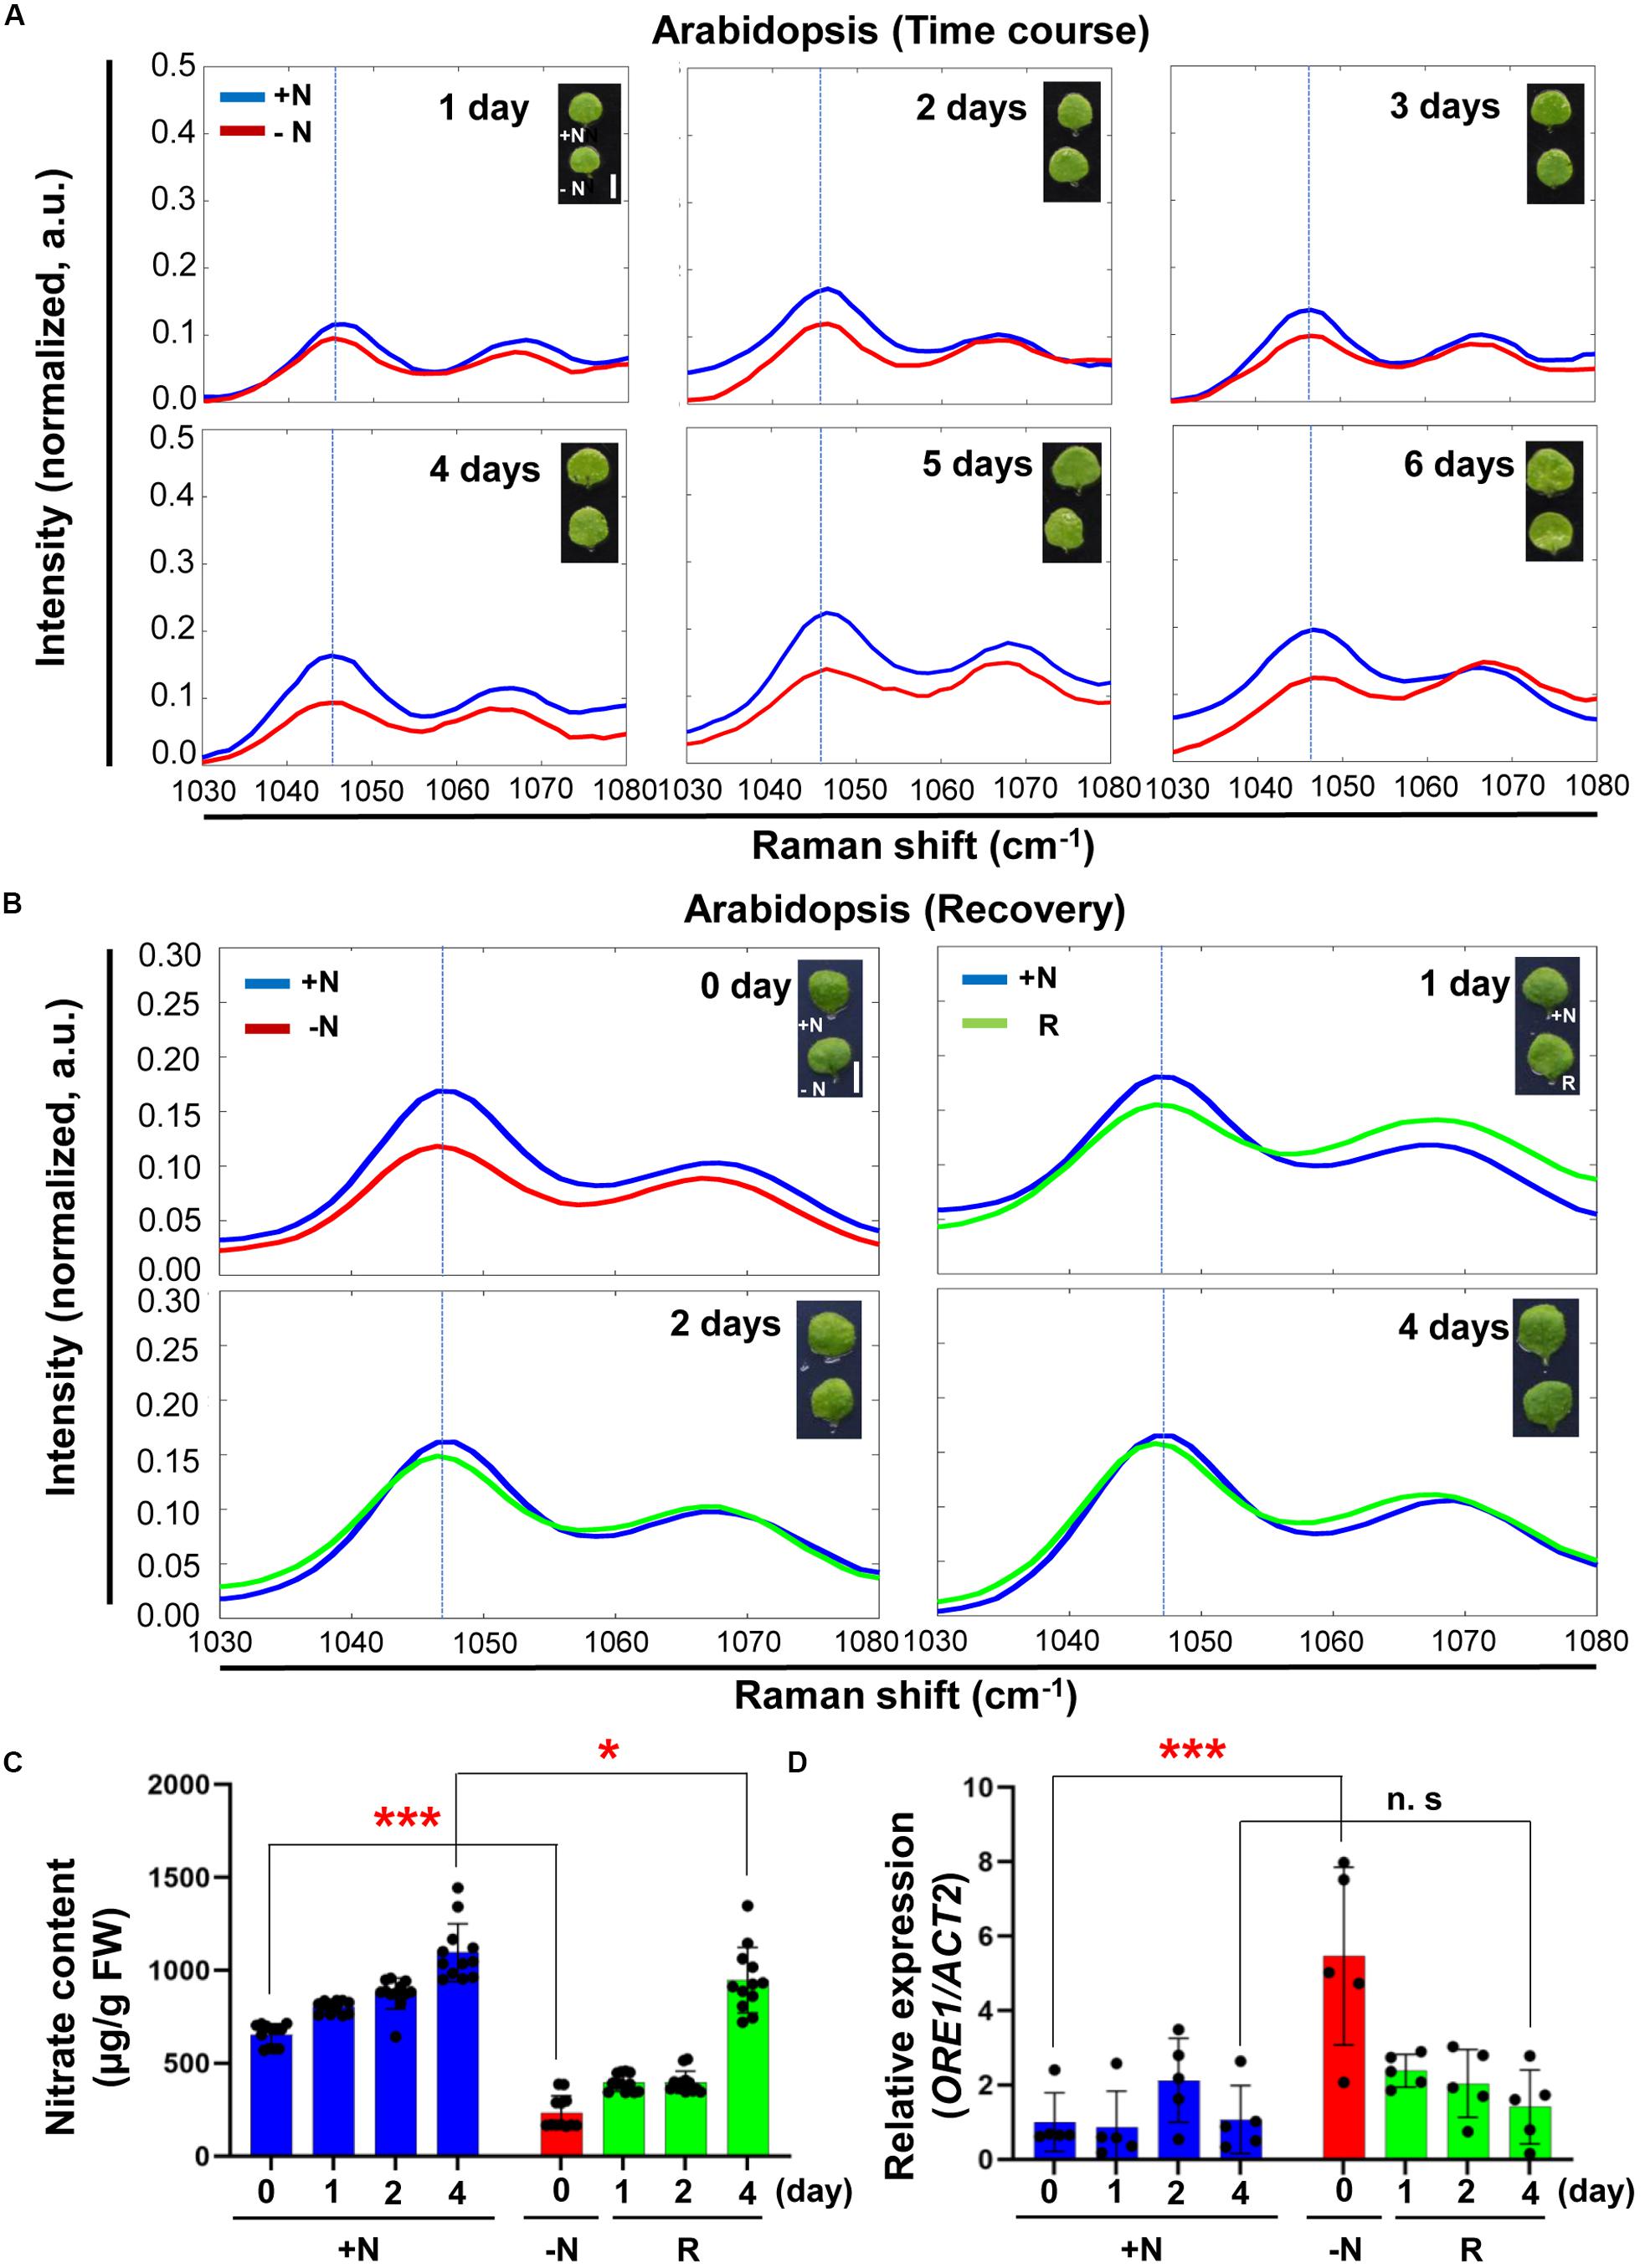
Figure 5. Time course analysis of Arabidopsis under + N, –N and recovery conditions by Raman spectroscopy. (A) Three-week-old seedlings of WT (Col-0) were transferred into +N or –N hydroponic medium. Leaf No. 4 samples were measured by Raman spectroscopy at various time points after transfer to –N medium. n = 10 (biologically independent experiments). (B) Arabidopsis plants grown under –N for 3 days were transferred into +N medium. Plants samples (R) at 0 day were same with samples grown for 3 days under –N medium. Samples were taken at various time points for 4 days. R; plants in the recovery +N medium, Scale bar, 0.5 cm (A,B). a.u; arbitrary unit. n = 10 (biologically independent experiments). (C) Nitrate content of leaf No. 4 was analyzed in +N or recovery plants (R). Data are mean values, n = 12 (biologically independent experiments) and individual data points are shown as overlays. Asterisks indicate statistically significant difference compared with +N. *P < 0.05, **P < 0.01, and ***P < 0.001; two-tailed t-test. FW; fresh weight. Supplementary Table S2 shows P values. (D) ORE1 transcript levels were analyzed by qRT-PCR in samples (leaf #4) of +N or recovery plants (R). Data are mean values, n = 5 (biologically independent experiments) and individual data points are shown as overlays. Asterisks indicate statistically significant difference compared with +N. *P < 0.05, **P < 0.01, and ***P < 0.001; two-tailed t-test. Supplementary Tables S1, S6 show primer set and P values, respectively.
We measured nitrate content and analyzed ORE1 transcript level of plants undergoing recovery in the full medium (Figures 5C,D). Plants starved for nitrate in the −N medium for 3 days were used for the recovery experiment. Compared with +N plants, the nitrate content of these −N plants was decreased by 3-fold. However, the nitrate content returned to the +N levels after 4 days in the +N medium. Changes in the nitrate content were matched by corresponding changes in the nitrate peak intensity (Figure 5C). Because of the nitrate replenishment, ORE1 transcript levels decreased by 3-fold after 4 days in the recovery medium (Figure 5D).
Similar experiments with the two leafy vegetable plants (Pak Choi and Choy Sum) showed that the intensity of the 1046 cm–1 peak also decreased after 3 and 5 days in the −N medium compared with 1 day in the same medium (Figures 6A,B).
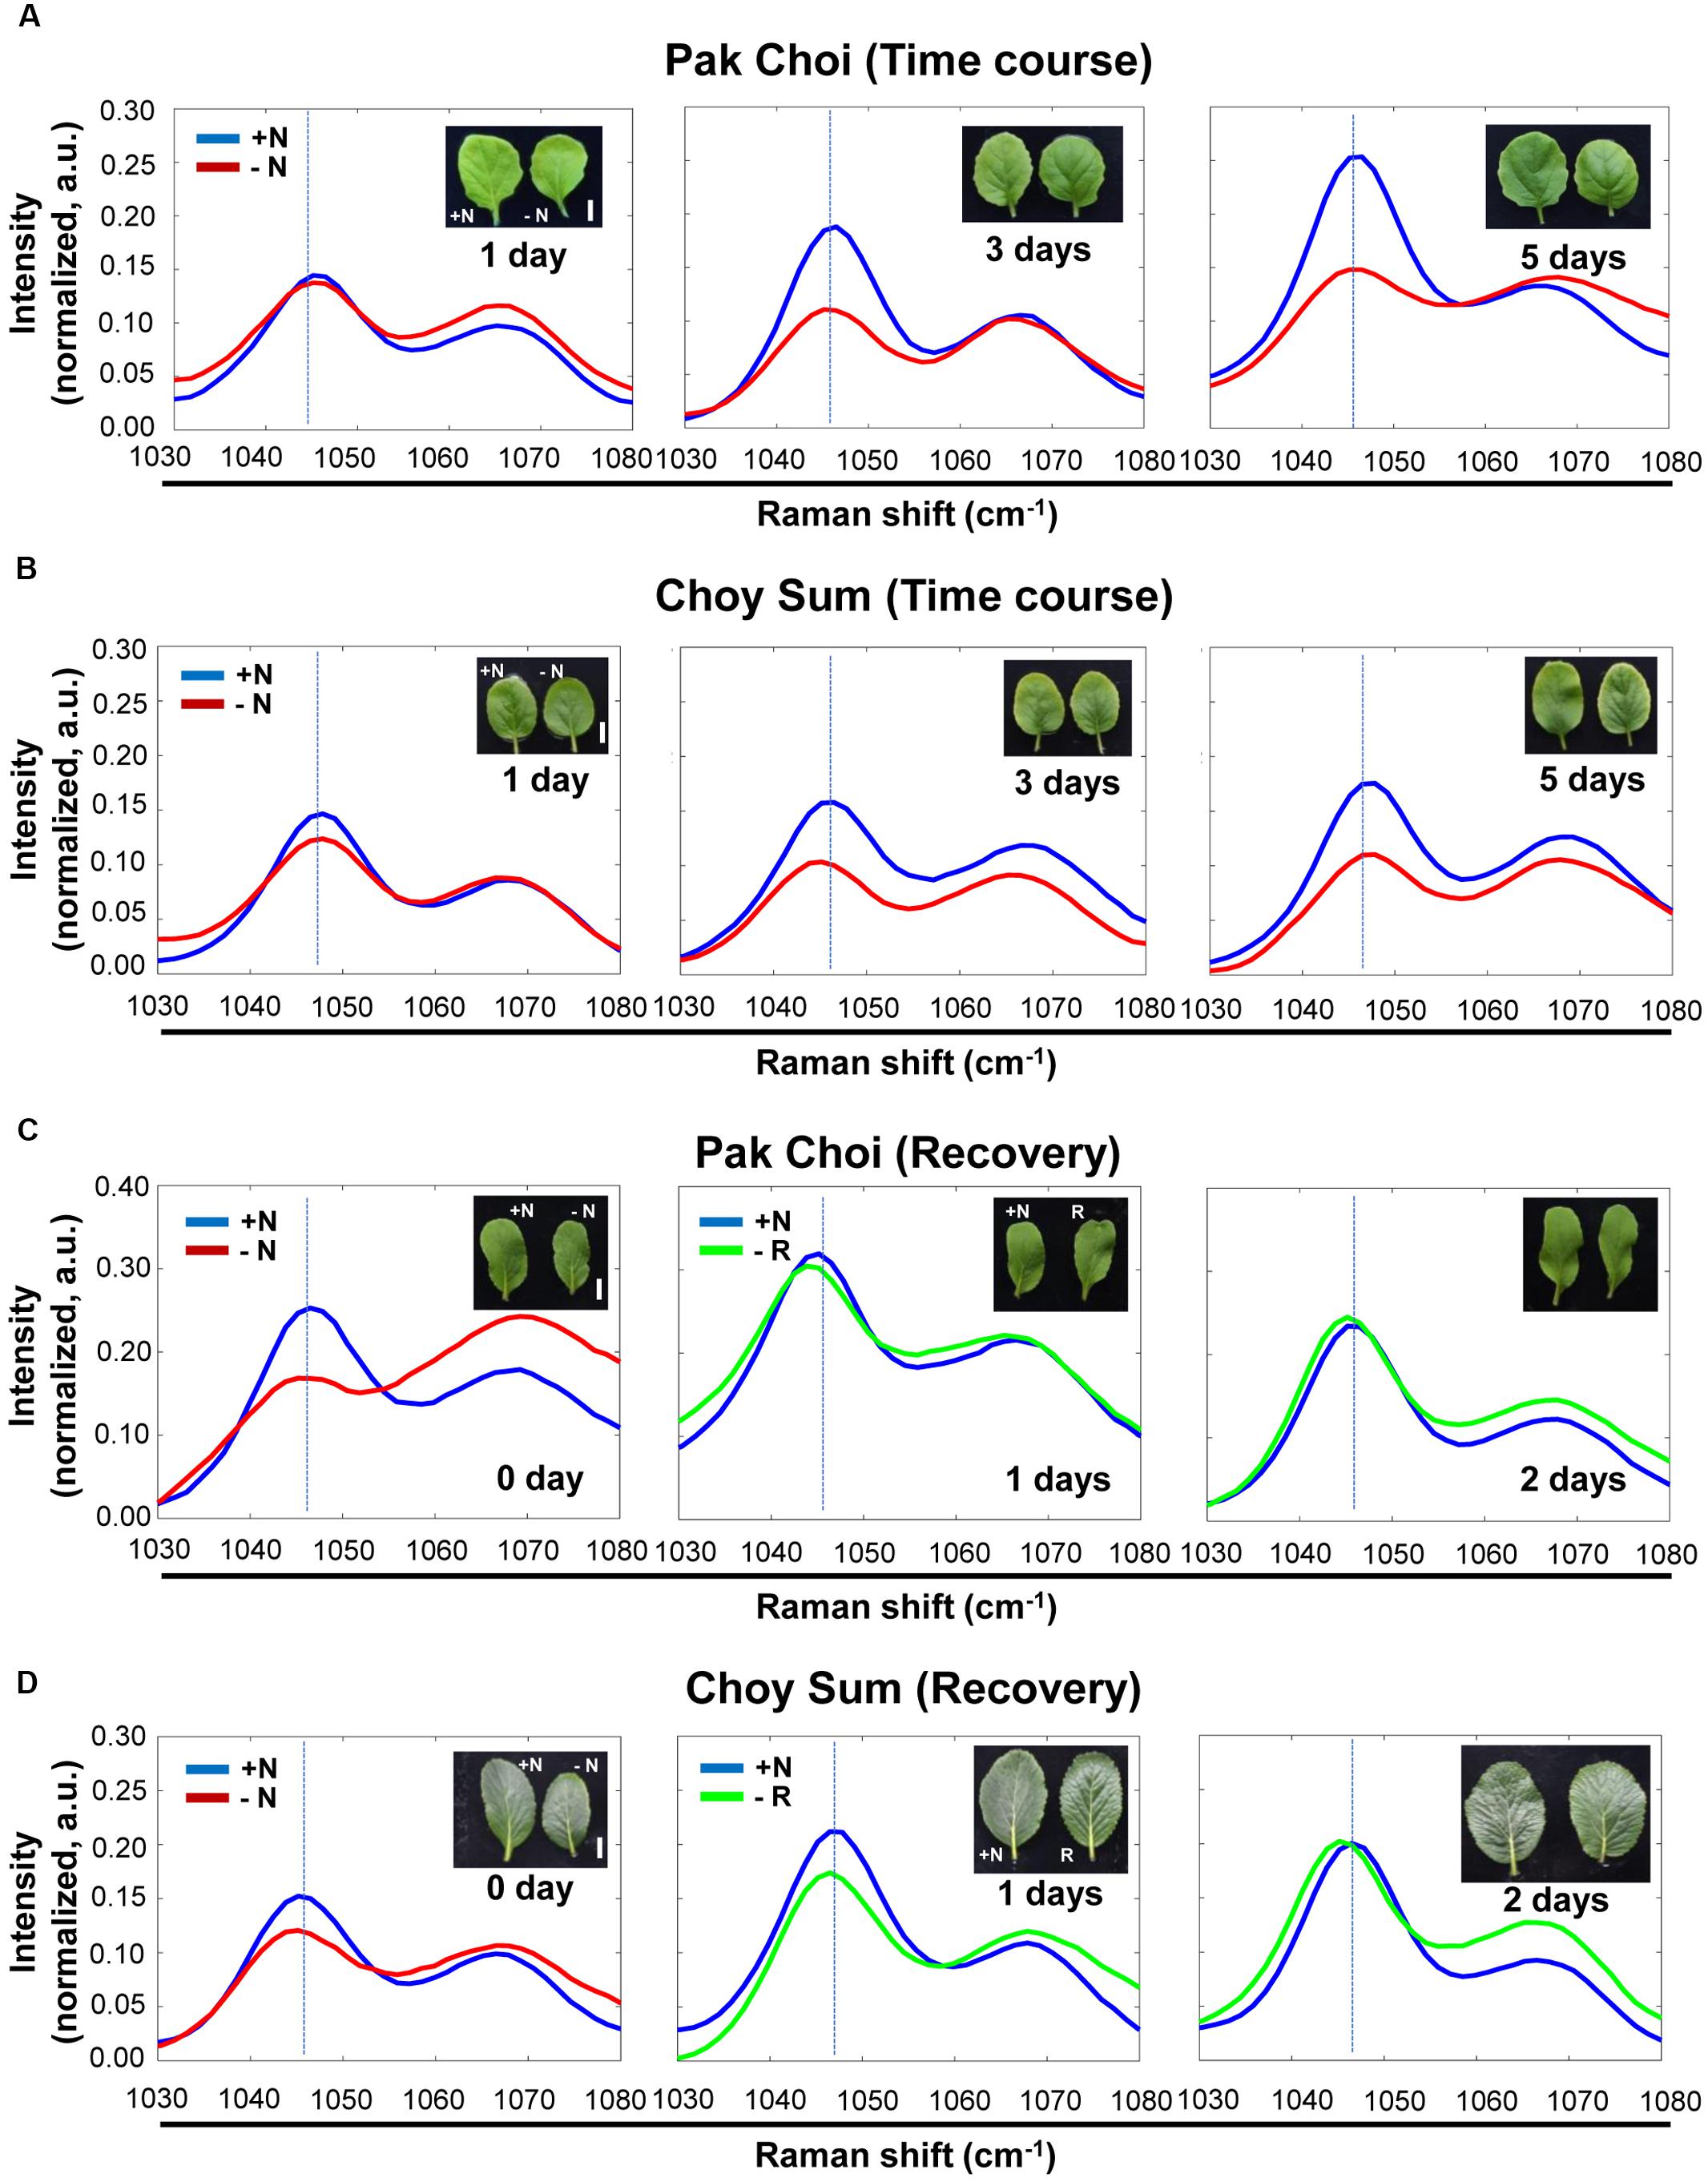
Figure 6. Time course analysis of leafy vegetables, Pak Choi and Choy Sum under + N, –N and recovery conditions by Raman spectroscopy. (A,B) Three-week old seedlings of two-week old seedlings of Pak Choi (Brassica rapa chinensis) and Choy Sum (Brassica rapa var. parachinensis) were transferred into +N or –N hydroponic medium. Leaf No. 4 samples were measured by Raman spectroscopy at various time points after transfer to –N medium. n = 10 (biologically independent experiments). (C,D) Pak Choi and Choy Sum plants grown under –N for 3 days were transferred into +N medium. Plants samples (R) at 0 day were same with samples grown for 3 days under –N medium. Samples were taken at various time points for 3 days. n = 5 (biologically independent experiments). R; recovery plant, Scale bar, 0.5 cm. a.u; arbitrary unit.
To see if this decrease in peak intensity at 1046 cm–1 can be reversed we transferred −N (day 3) plants to +N medium and followed their recovery for several days. Figures 6C,D show after 1 day in the +N recovery medium the nitrate peak intensity at 1046 cm–1 was still lower than that of plants under continuous +N condition. However, the peak intensity returned to the level of that of +N plants after 3 days of recovery in the +N medium. Supplementary Figures S7–S10 shows the corresponding wider-range spectra of Figures 6A–D, respectively.
We measured nitrate content and analyzed ORE1 orthologous gene transcript levels of the two leafy vegetable plants undergoing recovery in the full medium (Figure 7). Compared with plants under continuous +N condition, the nitrate content of these −N Pak Choi and Choy Sum plants was decreased by 500- and 350-fold, respectively, but it returned to the +N level after 3 days in the +N medium. Changes in the nitrate content of the two leafy vegetables were paralleled by corresponding changes in the nitrate peak intensity (Figures 7A,B). Similar results were obtained with Arabidopsis ORE1 transcript levels (Figures 7C,D).
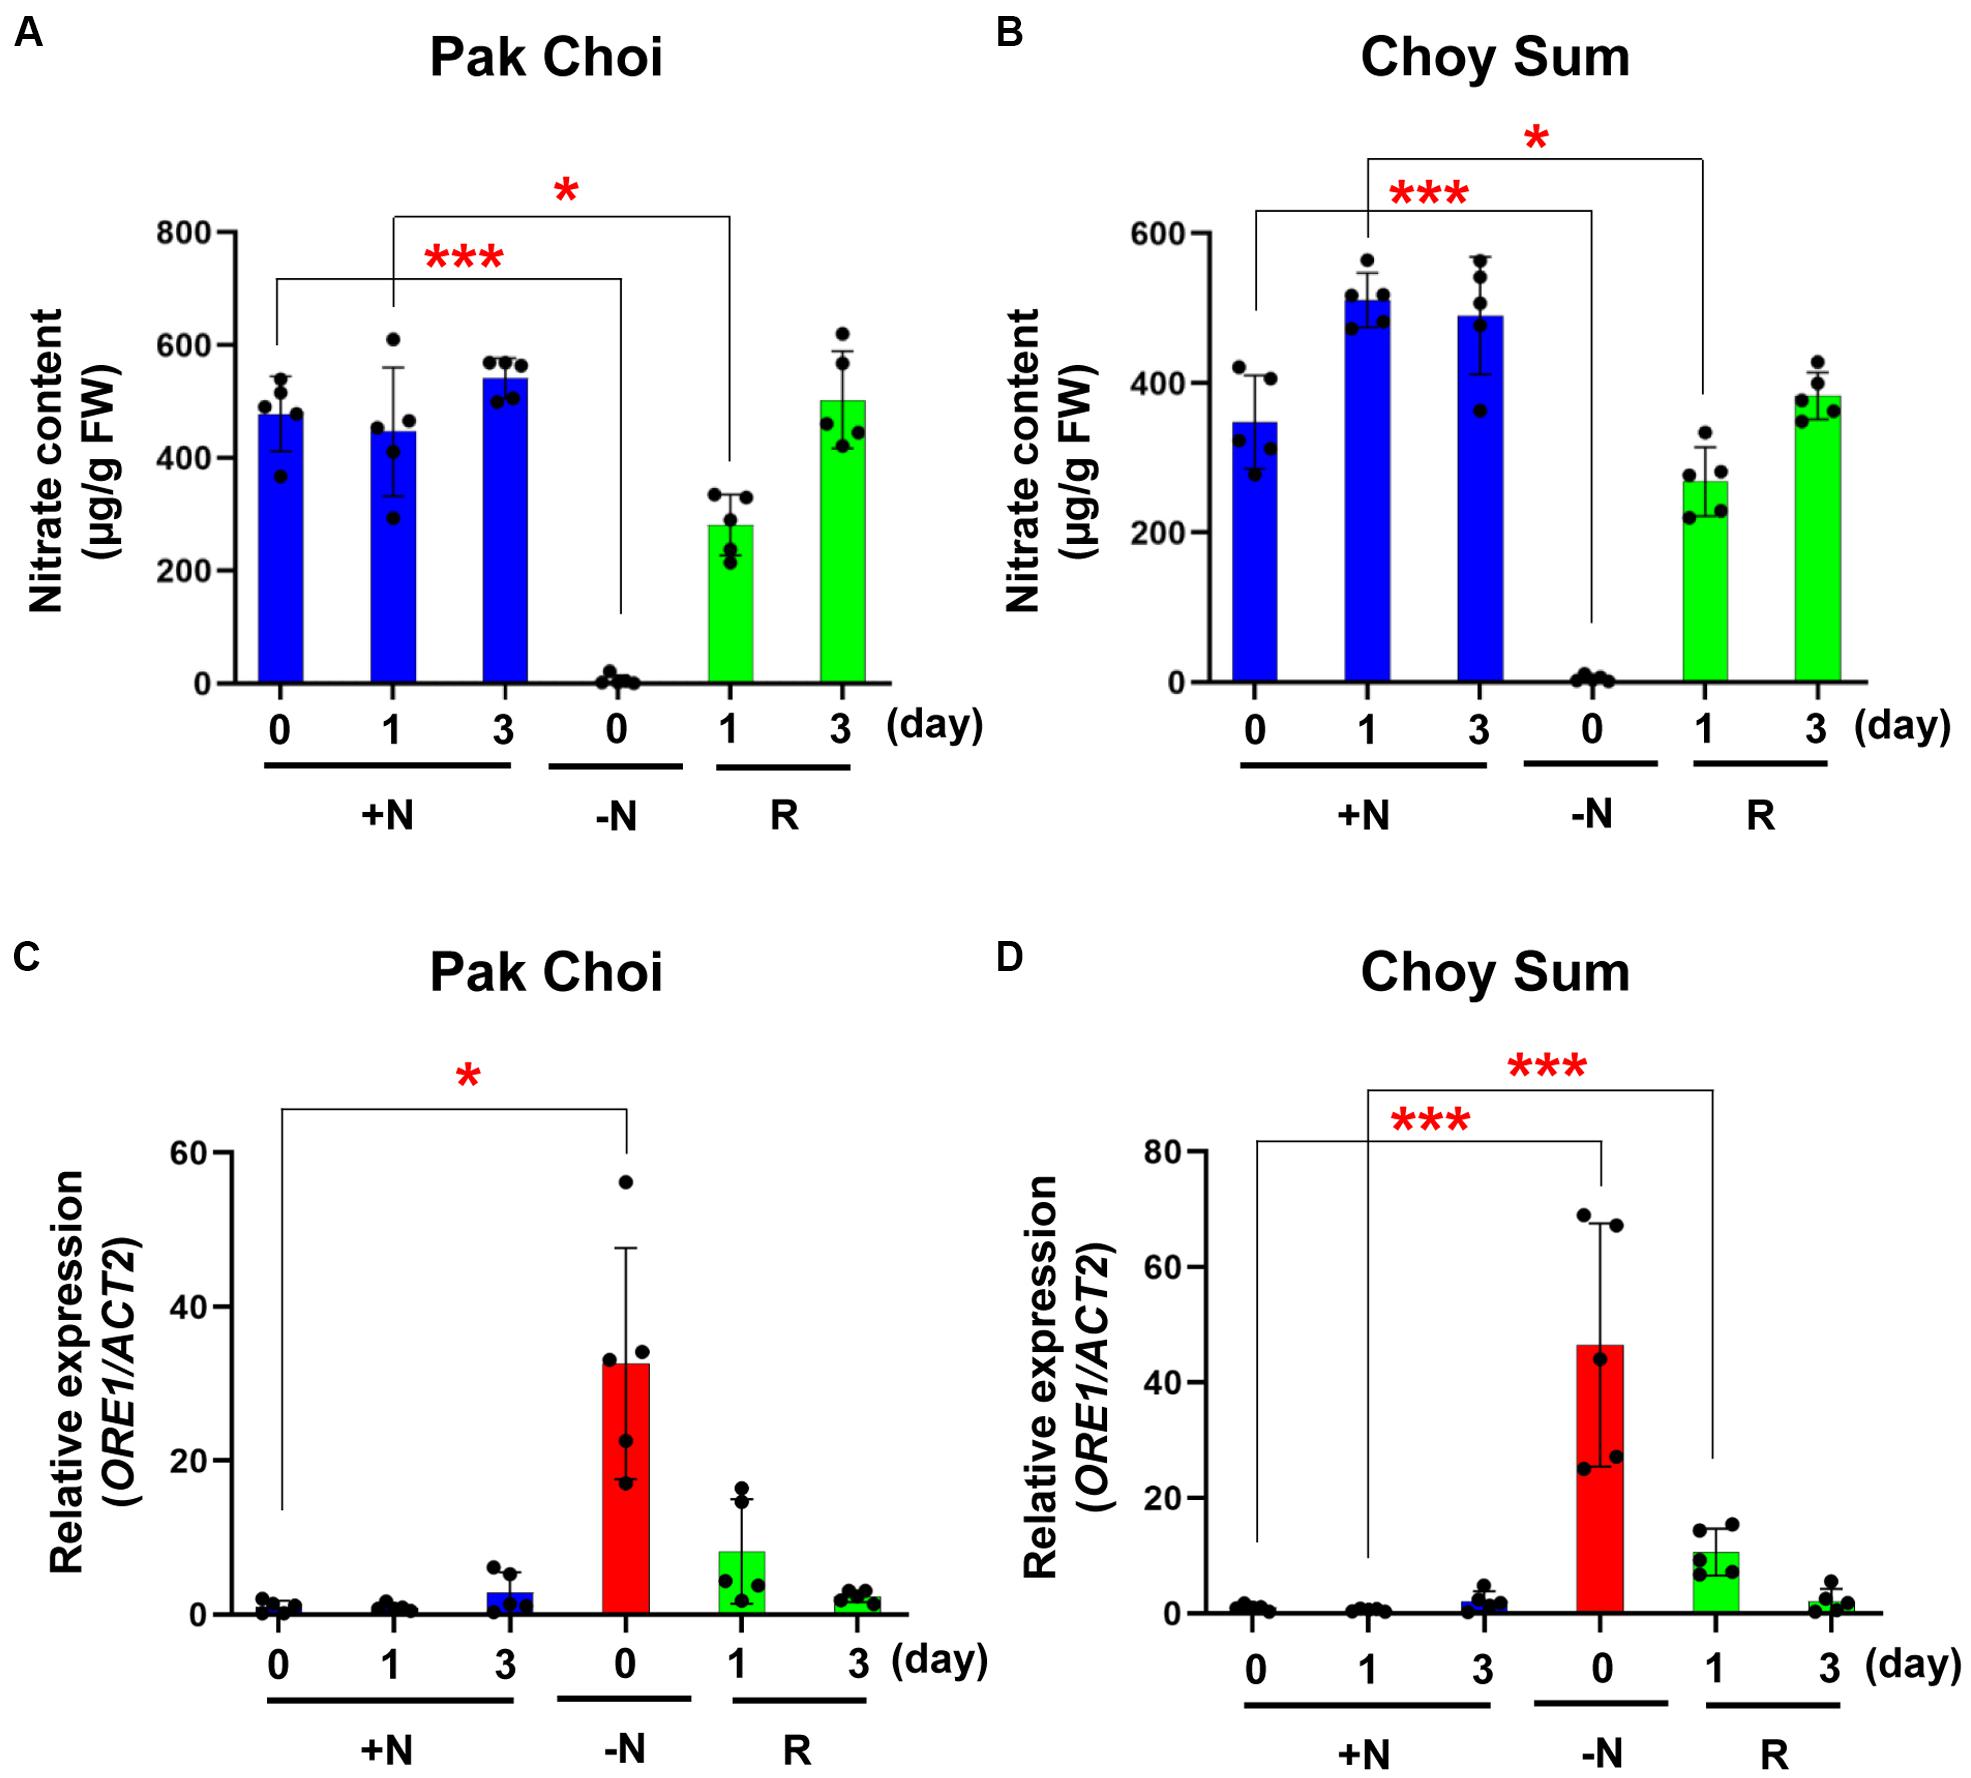
Figure 7. Nitrate content and ORE1 orthologous gene expression levels of two leafy vegetables in recovery experiments. (A,B) Nitrate content of leaf No. 4 was analyzed in +N or recovery plants (R) in Pak Choi (A) and Choy Sum (B). Data are mean values, n = 5 (biologically independent experiments) and individual data points are shown as overlays. Asterisks indicate statistically significant difference compared with +N. *P < 0.05, **P < 0.01, and ***P < 0.001; two-tailed t-test. FW; fresh weight. (C,D) ORE1 orthologous gene transcript levels were analyzed by qRT-PCR in leaf No. 4 samples of +N or recovery plants (R) in Pak Choi (C) and Choy Sum (D). Data are mean values, n = 5 (biologically independent experiments) and individual data points are shown as overlays. Asterisks indicate statistically significant difference compared with +N. *P < 0.05, **P < 0.01, and ***P < 0.001; two-tailed t-test. Supplementary Tables S1, S7 show primer sets and P values, respectively.
We performed Principal Component Analysis on the Raman spectra of +N and −N plants and separation between groups was observed for both Arabidopsis and Pak Choy (Supplementary Figures S11A, S12A). The strongest Raman spectral lines in the data set, which are attributed to carotenoids, were also observed in PC1 and were responsible for the largest spectral variance. The variance corresponding to PC2 can be used to partition the Raman spectra into classes relating to +N and -N conditions. The presence of the peak at 1046 cm–1 – which we identified as a nitrate Raman peak - in PC2 demonstrated that this region of the Raman spectra represented one of the main differentiation factors for +N and −N plants (Supplementary Figures S11B, S12B).
Discussion
Raman spectroscopy has been used to analyse either chlorophyll a or β-carotene content in microalgae under nitrogen deficient conditions (Heraud et al., 2006) and changes in storage lipids were clearly identified by Raman spectroscopy in nitrogen deficient C. sorokiniana and N. oleoabundans (Huang et al., 2010). Several well-identified Raman peaks corresponding to chlorophylls, carotenoids and triglycerides have been reported (Baranski et al., 2005; Pudney et al., 2011; Altangerel et al., 2017). However, changes in the intensity of these peaks are also seen in plants experiencing biotic and abiotic stresses rendering them unsuitable for use as specific Raman signatures for plants experiencing nitrogen deficiency. Near-infrared hyperspectral imaging has been used to diagnose nitrogen deficiency in cucumber plants based on chlorophyll distribution map of the plant (Shi et al., 2012). The drawback of this method is that it can only be used at the late stage of nitrogen deficiency when chlorophyll degradation occurs; besides, it is not specific to nitrogen stress because chlorophyll degradation can also be induced by many biotic and abiotic stresses.
Using standard solutions containing different concentrations of sodium nitrate Mabrouk et al. (2013) reported nitrate Raman shift of 1020 to 1070 cm−1. In addition, Chirico et al. (2016) showed that the Raman peak at 1043 cm−1, assigned to the totally symmetric vibration of NO3 ions, could be clearly measured in ammonium nitrate. Our results have confirmed these previous observations (Irish and Walrafen, 1967; Mabrouk et al., 2013; Chirico et al., 2016).
Here, we show that Raman spectroscopy can be used to query the state of plant health in a non-invasive manner and we have identified the 1046 cm–1 Raman peak as a specific signature of nitrogen status in Arabidopsis and vegetable crops in planta.
Five lines of evidence support our claims:
(1) We have confirmed the Raman shift at 1046 cm−1 attributed to nitrate using standard chemicals such as calcium nitrate [Ca(NO3)2], potassium nitrate (KNO3) and ammonium nitrate (NH4NO3).
(2) In WT plants the 1046 cm–1 peak intensity correlates with the nitrate content in WT Arabidopsis plants in starvation and recovery experiments.
(3) The peak intensity is reduced in Arabidopsis mutant in nrt2.1/nrt2.2 which is partially blocked in nitrate uptake.
(4) The peak intensity also correlates with nitrate content in two leafy vegetables (Pak Choi and Choy Sum) in starvation and recovery conditions.
(5) This Raman peak is specific to nitrogen stress as its intensity is not altered in plants under -P or -K.
Conclusion
An important aspect of our work is that nitrate deficiency of Arabidopsis as well as vegetables can be diagnosed by its specific Raman signature as early as 3 days on the starvation medium before the onset of any symptomatic manifestation of the deficient plants. This would facilitate plant stress management through early diagnosis of N deficiency in a non-invasive manner and allow application of appropriate remedial measures to ameliorate the stress. To this end, we have shown that −N plants can recover from nitrogen stress by returning them to a full medium, and along with this recovery the nitrate peak intensity also returns to the +N level. Our results show that Raman spectroscopy can be deployed as a tool for precision agriculture and we anticipate this method will be useful in the field management of crops.
Data Availability Statement
All datasets generated for this study are included in the article/Supplementary Material.
Author Contributions
CH, GS, N-HC, RR, and BP designed the experiments. CH, GS, and SP executed the experiments. All of the authors interpreted and discussed the data. CH, GS, N-HC, RR, and BP wrote the manuscript.
Funding
This research was supported by the National Research Foundation (NRF), Prime Minister’s Office, Singapore under its Campus for Research Excellence and Technological Enterprise (CREATE) program. The Disruptive and Sustainable Technologies for Agricultural Precision (DiSTAP) is an interdisciplinary research group (IRG) of the Singapore-MIT Alliance for Research and Technology Centre (SMART) supported by the National Research Foundation (NRF), Prime Minister’s Office, Singapore under its Campus for Research Excellence and Technological Enterprise (CREATE) program.
Conflict of Interest
The method for early diagnosis and management of nitrogen deficiency in plants utilizing Raman spectroscopy described in this manuscript has been included in a patent application filed by CH, GS, N-HC, RR, and BP.
The remaining author declares that the research was conducted in the absence of any commercial or financial relationships that could be construed as a potential conflict of interest.
Supplementary Material
The Supplementary Material for this article can be found online at: https://www.frontiersin.org/articles/10.3389/fpls.2020.00663/full#supplementary-material
FIGURE S1 | Schematic of the Raman spectroscopy setup. The excitation laser wavelength of 830 nm and power of 60 mW at the sample was used. The CCD camera was thermoelectrically cooled to −80°C. CCD, charge-coupled devices.
FIGURE S2 | Genotyping by qRT-PCR analysis of the nrt2.1-2 mutant. (A) PCR of the knock-out line of nrt2.1-2 was conducted by left/right genomic primer (LP and RP) and the left T-DNA border primer (LBb1.3). n = 3 (biologically independent experiments). (B) Expression levels of NRT2.1 and NRT2.2 were analyzed by qRT-PCR in WT and mutant plants. Data are mean values ± S.D., n = 5 (biologically independent experiments).
FIGURE S3 | Comparative Raman spectroscopic analysis of Arabidopsis WT and nrt2.1-2 under +N or -N conditions. The 900 to 1,600 (cm–1) region of the Raman spectrum is shown. For details, see legend to Figure 3E.
FIGURE S4 | Raman spectroscopic analysis of leafy vegetables under -N or +N condition. (A) Pak Choi; (B) Choy Sum. See Figure 4E legend for details.
FIGURE S5 | Comparative analysis of wide-range Raman spectrum of Arabidopsis plants grown under +N or -N condition by time course. See Figure 5A legend for details.
FIGURE S6 | Comparative analysis of wide-range Raman spectrum of Arabidopsis plants grown for recovery experiments by time course. Plants (R) were first grown in -N condition for 3 days before being returned to +N condition for an additional 3 days. See Figure 5B legend for details.
FIGURE S7 | Raman spectroscopic analysis of leafy vegetables, Pak Choi under +N or −N condition by time course. See Figure 6A legend for details.
FIGURE S8 | Raman spectroscopic analysis of leafy vegetables, Choy Sum under +N or −N condition by time course. See Figure 6B legend for details.
FIGURE S9 | Comparative analysis of wide-range Raman spectrum of leafy vegetables, Pak Choi grown for recovery experiments by time course. See Figure 6C legend for details.
FIGURE S10 | Comparative analysis of wide-range Raman spectrum of leafy vegetables, Choy Sum grown for recovery experiments by time course. See Figure 6D legend for details.
FIGURE S11 | Principal Component Analysis of Raman spectra acquired from nitrogen sufficient and nitrogen deficient Arabidopsis leaf samples. (A) Classification of nitrate sufficient and deficient samples based on the first two principal components (PCs) is shown. (B) The principal component 2 (PC2) clearly shows the presence of 1046 cm–1 Raman peak which we have identified as nitrate Raman peak in plant leaves.
FIGURE S12 | Principal Component Analysis of Raman spectra acquired from nitrogen sufficient and nitrogen deficient Pak Choi leaf samples. (A) Classification of nitrate sufficient and deficient samples based on the first two principal components (PCs) is shown. (B) The principal component 2 (PC2) clearly shows the presence of 1046 cm–1 Raman peak which we have identified as nitrate Raman peak in plant leaves.
TABLE S1 | Primer sets for qRT-PCR and genotyping analysis.
TABLE S2 | P-value data for Figures 1B–D, 4B–D.
TABLE S3 | P-value data for Figure 2D.
TABLE S4 | P-value data for Figures 3B–D. ∗Nitrate peak indicated Raman spectrum at 1046 cm–1 and normalized with cartenoids peak (1520 cm–1). P value of nutrient-deprived growth (−N, −P, and −K, respectively) relative to Full medium as obtained from student’s t-test analysis (n=14–16).
TABLE S5 | P-value data for intensity in Figures 3F, 4F.
TABLE S6 | P-value data for Figures 5C,D.
TABLE S7 | P-value data for Figure 7.
References
Altangerel, N., Ariunbold, G. O., Gorman, C., Alkahtani, M. H., Borrego, E. J., Bohlmeyer, D., et al. (2017). In vivo diagnostics of early abiotic plant stress response via Raman spectroscopy. Proc. Natl. Acad. Sci. U.S.A. 114, 3393–3396. doi: 10.1073/pnas.1701328114
Baranski, R., Baranska, M., and Schulz, H. (2005). Changes in carotenoid content and distribution in living plant tissue can be observed and mapped in situ using NIR-FT-Raman spectroscopy. Planta 222, 448–457. doi: 10.1007/s00425-005-1566-9
Blackmer, T. M., Schepers, J. S., Varvel, G. E., and Walter-Shea, E. A. (1996). Nitrogen deficiency detection using reflected shortwave radiation from irrigated corn canopies. Agron. J. 88, 1–5. doi: 10.2134/agronj1996.00021962008800010001x
Carter, G. A. (1994). Ratios of leaf reflectances in narrow wavebands as indicators of plant stress. Int. J. Remote Sens. 15, 697–703. doi: 10.1080/01431169408954109
Cataldo, D. A., Maroon, M., Schrader, L. E., and Youngs, V. L. (1975). Rapid colorimetric determination of nitrate in plant tissue by nitration of salicylic acid. Commun. Soil Sci. Plant Anal. 6, 71–80. doi: 10.1080/00103627509366547
Chappelle, E. W., Kim, M. S., and McMurtrey, J. E. I. I. I. (1992). Ratio analysis of reflectance spectra (RARS): an algorithm for the remote estimation of the concentrations of Chlorophyll A, Chlorophyll B, and carotenoids in soybean leaves remote sens. Environment 39, 239–247. doi: 10.1016/0034-4257(92)90089-3
Chirico, R., Almaviva, S., Colao, F., Fiorani, L., Nuvoli, M., Schweikert, W., et al. (2016). Proximal detection of traces of energetic materials with an eye-safe uv raman prototype developed for civil applications. Sensors 16:8. doi: 10.3390/s16010008
Creely, C. M., Singh, G. P., and Petrov, D. (2005). Dual wavelength optical tweezers for confocal Raman spectroscopy. Opt. Commun. 245, 465–470. doi: 10.1016/j.optcom.2004.10.011
Farber, C., and Kurouski, D. (2018). Detection and identification of plant pathogens on maize kernels with a hand-held raman spectrometer. Anal. Chem. 90, 3009–3012. doi: 10.1021/acs.analchem.8b00222
Gansel, X., Munos, S., Tillard, P., and Gojon, A. (2001). Differential regulation of the NO3- and NH4+ transporter genes AtNrt2.1 and AtAmt1.1 in Arabidopsis: relation with long-distance and local controls by N status of the plant. Plant J. 26, 143–155. doi: 10.1046/j.1365-313x.2001.01016.x
Grassmann, P. (1932). Der Ramaneffekt wässeriger Nitratlösungen. Z. Phys. 77, 616–631. doi: 10.1007/bf01330885
Heraud, P., Wood, B. R., Beardall, J., and McNaughton, D. (2006). Effects of pre-processing of Raman spectra on in vivo classification of nutrient status of microalgal cells. J. Chemometrics 20, 193–197. doi: 10.1002/cem.990
Huang, Y. Y., Beal, C. M., Cai, W. W., Ruoff, R. S., and Terentjev, E. M. (2010). Micro-Raman spectroscopy of algae: composition analysis and fluorescence background behavior. Biotechnol. Bioeng. 105, 889–898.
Irish, D. E., and Walrafen, G. E. (1967). Raman and infrared spectral studies of aqueous calcium nitrate solutions. J. Chem. Phys. 46:378. doi: 10.1063/1.1840398
Ju, X. T., Xing, G. X., Chen, X. P., Zhang, S. L., Zhang, L. J., Liu, X. J., et al. (2009). Reducing environmental risk by improving N management in intensive Chinese agricultural systems. Proc. Natl. Acad. Sci. U.S.A. 106, 3041–3046. doi: 10.1073/pnas.0813417106
Kant, S., Bi, Y. M., and Rothstein, S. J. (2011). Understanding plant response to nitrogen limitation for the improvement of crop nitrogen use efficiency. J. Exp. Bot. 62, 1499–1509. doi: 10.1093/jxb/erq297
Li, W., Wang, Y., Okamoto, M., Crawford, N. M., Siddiqi, M. Y., and Glass, A. D. (2007). Dissection of the AtNRT2.1:AtNRT2.2 inducible high-affinity nitrate transporter gene cluster. Plant. Physiol. 143, 425–433. doi: 10.1104/pp.106.091223
Lieber, C. A., and Mahadevan-Jansen, A. (2003). Automated method for subtraction of fluorescence from biological Raman spectra. Appl. Spectrosc. 57, 1363–1367. doi: 10.1366/000370203322554518
Mabrouk, K. B., Kauffmann, T. H., and Fontana, M. D. (2013). Abilities of Raman sensor to probe pollutants in water. J. Phys. Conf. Ser. 450:012014. doi: 10.1088/1742-6596/450/1/012014
Masclaux-Daubresse, C., Daniel-Vedele, F., Dechorgnat, J., Chardon, F., Gaufichon, L., and Suzuki, A. (2010). Nitrogen uptake, assimilation and remobilization in plants: challenges for sustainable and productive agriculture. Ann. Bot. 105, 1141–1157. doi: 10.1093/aob/mcq028
Okamoto, M., Vidmar, J. J., and Glass, A. D. (2003). Regulation of NRT1 and NRT2 gene families of Arabidopsis thaliana: responses to nitrate provision. Plant Cell. Physiol. 44, 304–317. doi: 10.1093/pcp/pcg036
Orsel, M., Krapp, A., and Daniel-Vedele, F. (2002). Analysis of the NRT2 nitrate transporter family in Arabidopsis. Structure and gene expression. Plant Physiol. 129, 886–896. doi: 10.1104/pp.005280
Park, B. S., Yao, T., Seo, J. S., Wong, E. C. C., Mitsuda, N., Huang, C. H., et al. (2018). Arabidopsis nitrogen limitation adaptation regulates ORE1 homeostasis during senescence induced by nitrogen deficiency. Nat. Plants 4, 898–903. doi: 10.1038/s41477-018-0269-8
Peñuelas, J., Gamon, J. A., Fredeen, A. L., Merino, J., and Field, C. B. (1994). Reflectance indices associated with physiological changes in nitrogen-and water-limited sunflower leaves. Remote Sens. Environ. 48, 135–146. doi: 10.1016/0034-4257(94)90136-8
Porra, R. J., Thompson, W. A., and Kriedemann, P. E. (1989). Determination of accurate extinction coefficients and simultaneous equations for assaying chlorophylls a and b extracted with four different solvents: verification of the concentration of chlorophyll standards by atomic absorption spectroscopy. Biochim. Biophys. Acta 975, 384–394. doi: 10.1016/s0005-2728(89)80347-0
Pudney, P. D. A., Gambelli, L., and Gidley, M. (2011). Confocal Raman microspectroscopic study of the molecular status of carotenoids in tomato fruits and foods. Appl. Spectr. 65, 127–134. doi: 10.1366/10-06121
Raman, C. V., and Krishnan, K. S. (1928). A new type of secondary radiation. Nature 121, 501–502. doi: 10.1038/121501c0
Sanchez, L., Pant, S., Xing, Z., Mandadi, K., and Kurouski, D. (2019). Rapid and noninvasive diagnostics of Huanglongbing and nutrient deficits on citrus trees with a handheld Raman spectrometer. Anal. Bioanal. Chem. 411, 3125–3133. doi: 10.1007/s00216-019-01776-4
Santamaria, P. (2006). Nitrate in vegetables: toxicity, content, intake and EC regulation. J. Sci. Food Agric. 86, 10–17. doi: 10.1002/jsfa.2351
Shi, J. Y., Zou, X. B., Zhao, J. W., Wang, K. L., Chen, Z. W., Huang, X. W., et al. (2012). Nondestructive diagnostics of nitrogen deficiency by cucumber leaf chlorophyll distribution map based on near infrared hyperspectral imaging. Sci. Hortic. 138, 190–197. doi: 10.1016/j.scienta.2012.02.024
Keywords: nitrogen deficiency, Raman spectroscopy, nitrate peak, Arabidopsis, leafy vegetables
Citation: Huang CH, Singh GP, Park SH, Chua N-H, Ram RJ and Park BS (2020) Early Diagnosis and Management of Nitrogen Deficiency in Plants Utilizing Raman Spectroscopy. Front. Plant Sci. 11:663. doi: 10.3389/fpls.2020.00663
Received: 06 February 2020; Accepted: 29 April 2020;
Published: 05 June 2020.
Edited by:
Francisco M. Cánovas, University of Malaga, SpainReviewed by:
Javier Ramirez Aguilar, University of Malaga, SpainAgnieszka Klimek-Kopyra, University of Agriculture in Krakow, Poland
Copyright © 2020 Huang, Singh, Park, Chua, Ram and Park. This is an open-access article distributed under the terms of the Creative Commons Attribution License (CC BY). The use, distribution or reproduction in other forums is permitted, provided the original author(s) and the copyright owner(s) are credited and that the original publication in this journal is cited, in accordance with accepted academic practice. No use, distribution or reproduction is permitted which does not comply with these terms.
*Correspondence: Rajeev J. Ram, cmFqZWV2QG1pdC5lZHU=; Bong Soo Park, Ym9uZ3Nvb0B0bGwub3JnLnNn
†These authors have contributed equally to this work