 Yanlong Fang1
 Shulin Liu2Quanzhong Dong1
 Kaixin Zhang1
 Zhixi Tian2Xiyu Li1
 Wenbin Li1Zhongying Qi1Yue Wang1Xiaocui Tian1Jie Song1Jiajing Wang1Chang Yang1Sitong Jiang1Wen-Xia Li1*
 Hailong Ning1*
- 1Key Laboratory of Soybean Biology, Ministry of Education/Key Laboratory of Soybean Biology and Breeding/Genetics, Ministry of Agriculture, Northeast Agricultural University, Harbin, China
- 2State Key Laboratory of Plant Cell and Chromosome Engineering, Institute of Genetics and Developmental Biology, Chinese Academy of Sciences, Beijing, China
Plant height is an important target for soybean breeding. It is a typical quantitative trait controlled by multiple genes and is susceptible to environmental influences. Here, we carried out phenotypic analysis of 156 recombinant inbred lines derived from “Dongnong L13” and “Henong 60” in nine environments at four locations over 6 years using interval mapping and inclusive composite interval mapping methods. We performed quantitative trait locus (QTL) analysis by applying pre-built simple-sequence repeat maps. We detected 48 QTLs, including nine significant QTLs detected by multiple methods and in multiple environments. Meanwhile, genotyping of all lines using the SoySNP660k BeadChip produced 54,836 non-redundant single-nucleotide polymorphism (SNP) genotypes. We used five multi-locus genome-wide association analysis methods to locate 10 quantitative trait nucleotides (QTNs), four of which overlap with previously located QTLs. Five candidate genes related to plant height are predicted to lie within 200 kb of these four QTNs. We identified 19 homologous genes in Arabidopsis, two of which may be associated with plant height. These findings further our understanding of the multi-gene regulatory network and genetic determinants of soybean plant height, which will be important for breeding high-yielding soybean.
Introduction
Soybean [Glycine max (L.) Merr.] is an important crop around the world, and worldwide soybean consumption has increased rapidly in recent years. Increasing production per unit area thus remains an important breeding target. Yield is influenced by a variety of traits, such as number of pods, number of seeds, and number of nodes. Plant height is an important factor in the formation of yield traits, and at the same time promotes or inhibits other yield components. Plant height mainly affects yield by influencing lodging resistance and the number of pods per plant (Akhter and Sneller, 1996). With the development of molecular genetics and molecular marker technology (Keim et al., 1990), the traditional breeding process has been greatly improved, producing cultivars with excellent traits.
Most agronomic traits in soybean, such as plant height and pod number, are controlled by quantitative trait loci (QTLs) (Mansur et al., 1996), making it difficult to understand their genetic basis and molecular mechanism due to insufficient precision. A large number of plant height-related QTLs have been reported. Specht et al. (2001) used a recombinant inbred line (RIL) population containing 236 individuals derived from a cross between “Minsoy” and “Noir 1” to identify nine soybean plant height QTLs distributed on eight chromosomes. Sun et al. (2006) used a RIL population containing 143 individuals derived from a cross between “Charleston” and “Dongnong 59” to uncover 17 plant height QTLs distributed on 10 chromosomes. Guzman et al. (2007) identified three soybean plant height QTLs using three backcross-derived populations. Yao et al. (2015a) used an F2-derivative group constructed from “Jiyu50” and “Jnong18” and containing 236 individuals to identify nine plant height QTLs distributed across linkage groups A1, C2, G, M, F, and K.
Genome-wide association studies (GWAS) exploit the abundant mutations and recombinations existing in diverse populations. They have a relatively high localization accuracy compared to traditional QTL mapping methods, enabling prediction and identification of genes. With the development of genotyping and sequencing technologies, GWAS have been widely used to study the genetic basis of traits in major crops such as maize (Poland et al., 2011; Li et al., 2013; Feng et al., 2015), rice (Huang et al., 2010; Bandillo et al., 2013), wheat (Huang et al., 2012; Sukumaran et al., 2015), Arabidopsis thaliana (Kover et al., 2009), and tomato (Zhang et al., 2016). GWAS are also widely used for genetic analysis of major traits in soybean such as flowering time (Zhang et al., 2015b), pod number (Fang et al., 2017), seed oil (Zhou et al., 2015), seed protein (Bandillo et al., 2015), salt tolerance (Kan et al., 2015), and 100-seed weight (Zhang et al., 2015a). However, there are few reports on GWAS of high-density single-nucleotide polymorphisms (SNPs) in soybean (Hwang et al., 2014). Therefore, the application of GWAS in soybean, especially for agronomic traits, remains to be explored. Previous studies have shown that soybean plant height is a typical quantitative trait controlled by multiple genes, and its genetic effect is relatively small. However, more effective methods are required for detecting QTLs. Multi-locus GWAS is a suitable method for detecting significant quantitative trait nucleotides (QTNs) and has been used in several studies (Hou et al., 2018; Zhang et al., 2018c).
In addition to natural populations, GWAS are widely used for genetic analysis of other mapping populations, such as nested association mapping (NAM) and multi-parent advanced generation inter-cross (MAGIC) populations (Korte and Farlow, 2013). Tian et al. (2011) used a maize NAM population for GWAS to determine the genetic basis of important leaf structural features. Cook et al. (2012) constructed a NAM population of 25 RILs and identified beneficial alleles for improving maize kernel starch, protein, and oil. Zhang et al. (2018a) used a four-way RIL to perform GWAS on the genetic mechanism of soybean protein. Henning et al. (2016) conducted GWAS using a hop population constructed from the parents “Teamaker” and USDA 21422M, revealing the genetic basis of fiber quality traits and yield components in 231 lines. Liu et al. (2018) used a F6:8 RIL derived from cotton cultivars “Lumianyan28” and “Xinluzao24” to detect 134 QTLs for fiber quality traits and 122 QTLs for yield components, with 35 common candidate genes. Therefore, analyzing the genetic basis of complex traits in single bi-parental populations is feasible using GWAS. At the same time, Ott et al. (2011) consider that linkage analysis and association analysis together are more accurate and effective than single analysis methods in revealing the genetic mechanisms of traits.
To investigate the genetic basis of soybean plant height variation, we chose two parents with significant genetic differences in plant height, “Dongnong L13” and “Henong 60”, to construct a RIL population with 156 lines. We used simple-sequence repeat (SSR) markers for genotyping and obtained QTLs related to plant height from linkage analysis between genotypic data and phenotypic data obtained in different environments. We then performed SNP genotyping of the RIL population using gene chip technology and conducted association analysis between SNP marker genotypes and phenotypic traits. Association analysis results not only further verified the QTLs obtained by linkage analysis, but also narrowed the search for candidate genes related to plant height, which will accelerate molecular breeding to select and improve agronomic traits in soybean.
Materials and Methods
Plant Materials
Two soybean cultivars, “Dongnong L13” (P1) and “Henong 60” (P2), with wide genetic differences in plant height were used as parents for constructing RILs. “Dongnong L13” was bred by crossing “Heinong 40” and “Jiujiao 5640”, and “Henong 60” was bred by crossing “Beifeng 11” and “Hobbit”. The cross P1 × P2 was carried out in Harbin (E 126.63°, N 45.75°), Heilongjiang Province, China, and F1 seeds were harvested in 2008. In the same winter, F1 seeds were sowed in Yacheng City, Hainan Province (E 109.00°, N 17.50°). From 2010 to 2014, F1 plants were self-crossed in Harbin and Yacheng following the single-seed descent method, that is, single seeds were selected from individual plants at each generation until all individuals showed homozygous genotypes. RIL6013 containing 156 families was obtained and used for construction of genetic maps and QTL mapping.
Field Experiment and Trait Evaluations
Experiments were carried out at four locations: Keshan (E 125.64°, N 48.25°), Harbin, Acheng (E 127.63°, N 45.82°), and Shuangcheng Cities (E 126.92°, N 45.75°). Field tests of nine environments across 4 years and four locations were carried out: Keshan (E1) in 2013, Harbin (E2) in 2014, Keshan (E3) and Harbin (E4) in 2015, Acheng (E5), Shuangcheng (E6), and Harbin (E7) in 2016, Shuangcheng (E8) in 2017, and Acheng (E9) in 2018. All plant materials in each environment were grown in three-row 3 m × 0.7 m plots in a completely randomized block design with three replications. Experimental plots were managed identically to local soybean crops.
Plant height was investigated in the field after maturity and defined as length from the cotyledon mark to the top of the main stem. Plant height of the 156 RILs was measured with a meter ruler. Plants with marginal utility were avoided during the survey, and 10 plants were randomly selected from each plot to conduct field investigations to determine plant height. The mean value of the 10 observations was taken as the observation value for the plot, and the average of the observation values of the three block replicates was used as the phenotypic data for QTL mapping.
Statistical Analyses of Phenotypic Data
Minimum, maximum, mean, standard deviation, kurtosis, and skewness of the sample observations were calculated using the software SAS V9.21 (https://www.sas.com/en_us/home.html) and histograms of plant height frequency distribution of the RIL6013 population in the nine environments were drawn. The significance of the genotypic variance in each group of observations was then calculated using the general linear model (GLM) for analysis of variance (ANOVA). Finally, the VARCOMP command was used to estimate the variance component of the mixed linear model (MLM), and the generalized heritability of plant height in a single environment was calculated according to the following equation:
(where is the genotypic variance, is the error variance).
SSR Marker Map and QTL Analysis
Construction of the RIL6013 map was based on the method of Ning et al. (2018). The genetic map contained 20 soybean linkage groups and 137 SSR markers covering a total genome length of 1886.80 cM. The genetic distance of each linkage group was 19.68 cM (H) – 163.67 cM (F), and the average genetic length was 94.34 cM. Each linkage group contained four to 11 markers, and the average genetic distance between the two markers was 16.13 cM.
Interval mapping (IM-ADD) and inclusive composite interval mapping (ICIM-ADD) under the .bip (QTL mapping in bi-parental populations) function built into the software QTL Icimapping V 4.1 (Wang, 2009) were used to detect additive QTLs. The Scan Step was set to 1.00 cM and the LOD threshold was set to 2.50. In addition, for ICIM-ADD, the PIN value was set to 0.001. After the QTL positioning results were obtained, they were named according to the method of McCouch (1997).
SNP Genotyping
DNA samples extracted were used for SNP genotyping using the SoySNP660K BeadChip at Beijing Boao Biotechnology Co., Ltd. A total of 54836 SNPs across 20 chromosomes remained after quality filtering; SNP markers were excluded by minor allele frequency (MAF < 0.05), and the maximum missing sites per SNP was <10% (Belamkar et al., 2016). These SNPs were used for analysis of population structure and GWAS.
Analysis of Population Structure
The analysis of population structure was performed using STRUCTURE V2.3.4 (Pritchard et al., 2000). For each run, the number of burn-in iterations was set to 100000, and the number of Marko Chain Monte Carlo (MCMC) was set to 100,000, while the mixed model and allele frequency correlation model were considered in the analysis. Set the K number of the subpopulations in the population from 1 to 10, and number of iterations was set to 5.To determine the best K value using STRUCTURE HARVESTER (Earl, 2012) (http://taylor0.biology.ucla.edu/structureHarvester).
Linkage Disequilibrium Analysis
TASSEL 5.0 (Bradbury et al., 2007) was used to analyze linkage disequilibrium (LD) by analyzing r2 values of all pairs. The LD decay trend was analyzed using negative natural logarithm, and the physical distance of LD decay was estimated to where r2 dropped to 0.2.
Genome-Wide Association Studies
mrMLM.GUI software was used to perform GWAS with the following the five methods for identifying significant QTNs: mrMLM (Wang et al., 2016), FASTmrMLM (Tamba et al., 2017), FASTmrEMMA (Wen et al., 2017), pLARmEB (Zhang et al., 2017), and ISIS EM-BLASSO (Tamba et al., 2017). The critical P value of FASTmrEMMA was set to 0.005 while the critical P value parameter of the other methods was set to 0.01, and the critical LOD value of significant QTNs was set to 3 (Wang et al., 2016). QTNs located in at least two environments or detected using two different methods were considered to be significant. The kinship matrix used in the analysis process was also calculated by the software.
Identification of Potential Candidate Genes
QTNs were used to predict potential candidate genes based on GWAS. Genes highly expressed in stems according to the Phytozome website (https://phytozome.jgi.doe.gov) were searched for in the interval of LD decay distance when r2 dropped to 0.2 on both sides of the QTN. These genes were used for pathway analysis by combining gene annotation information and protein conserved domain functions from the NCBI database (https://www.ncbi.nlm.nih.gov/) and previous studies. Potential candidate genes were identified from the pathway analysis and used to identify homologous genes on the ensemble plant website (http://plants.ensembl.org/index.html) and speculate on their potential functions based on their gene ontology (GO) number (https://www.ebi.ac.uk/QuickGO/).
Results and Analysis
Phenotypic Variation Analysis
The RIL6013 population showed a bimodal distribution in the nine environments, except for E8 and E6, and plant height observations generally showed a unimodal distribution. We speculate that the plant height of this population may be regulated by multiple major and minor genes (Figure 1). The plant height range of the population was generally higher than that of the parents, indicating a large separation within the population. Genotypic variances between lines were extremely significant (P < 0.01), and the kurtosis and skewness of statistical observations ranged from [−1, 1]. We therefore considered that this population was suitable for plant height research and QTL identification (Table 1).
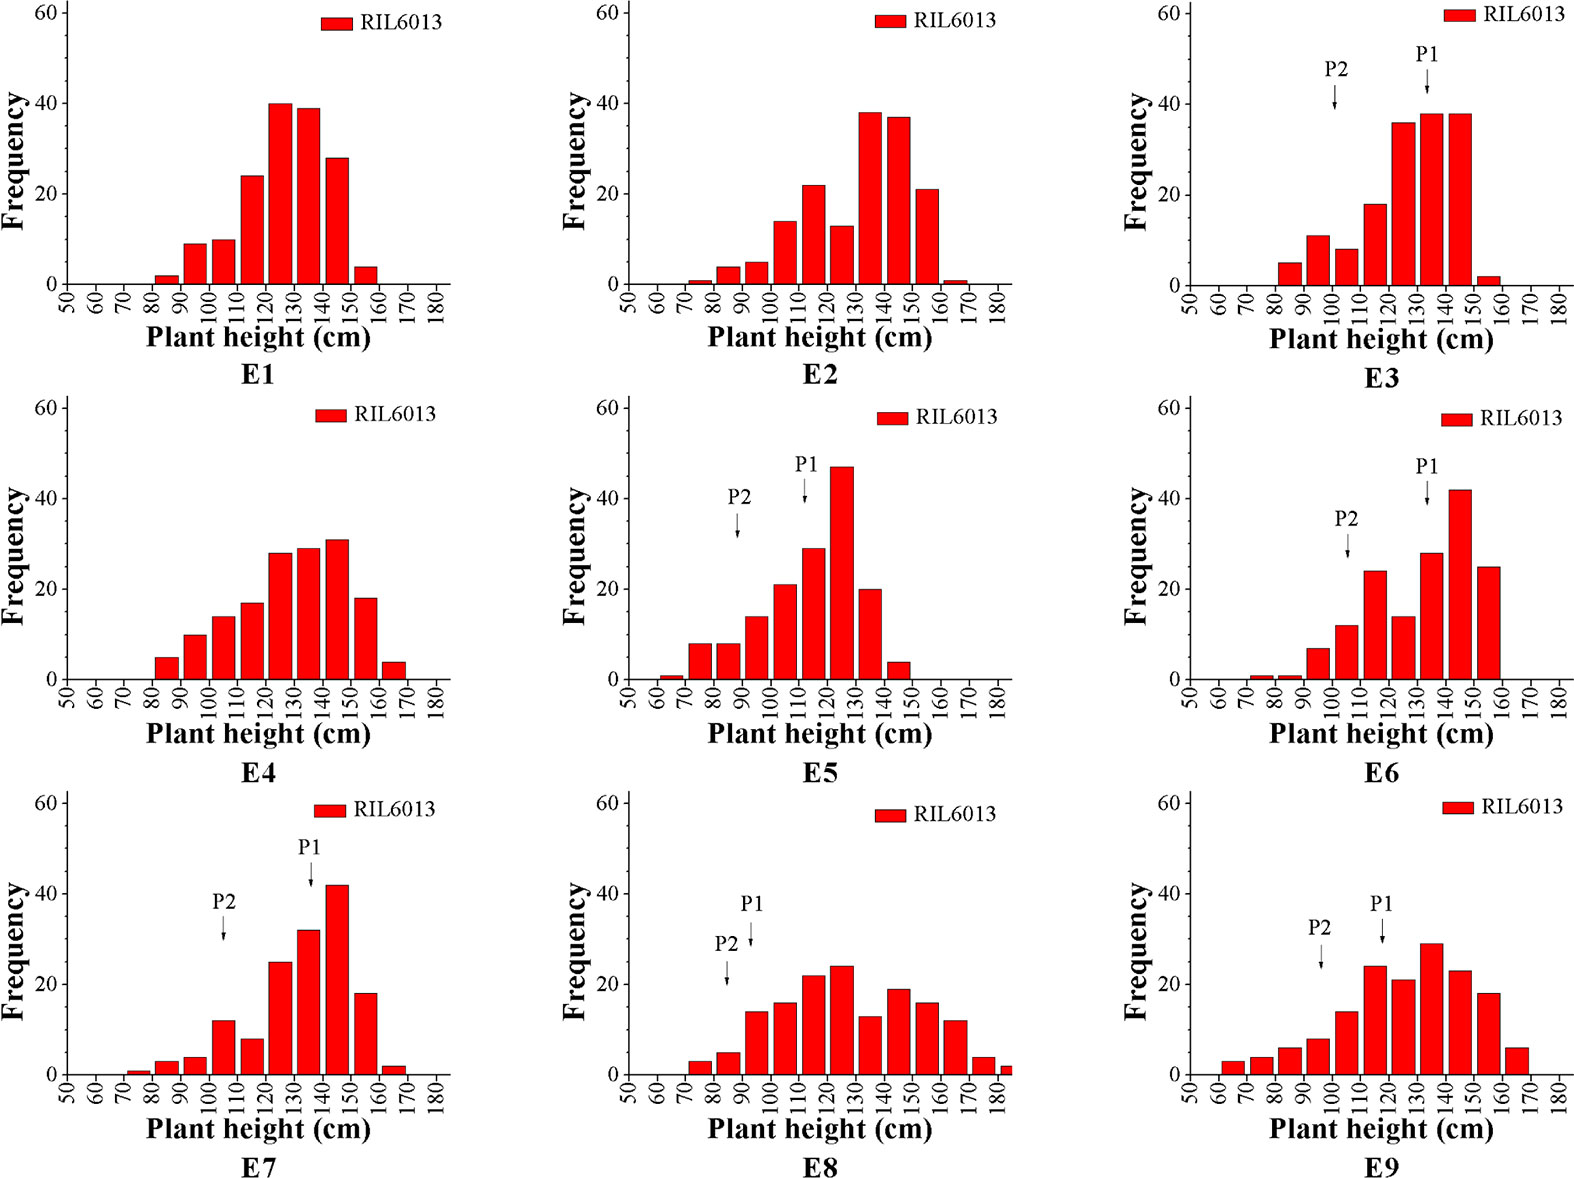
Figure 1 Frequency histograms of plant height in RIL6013 in population in nine environments.
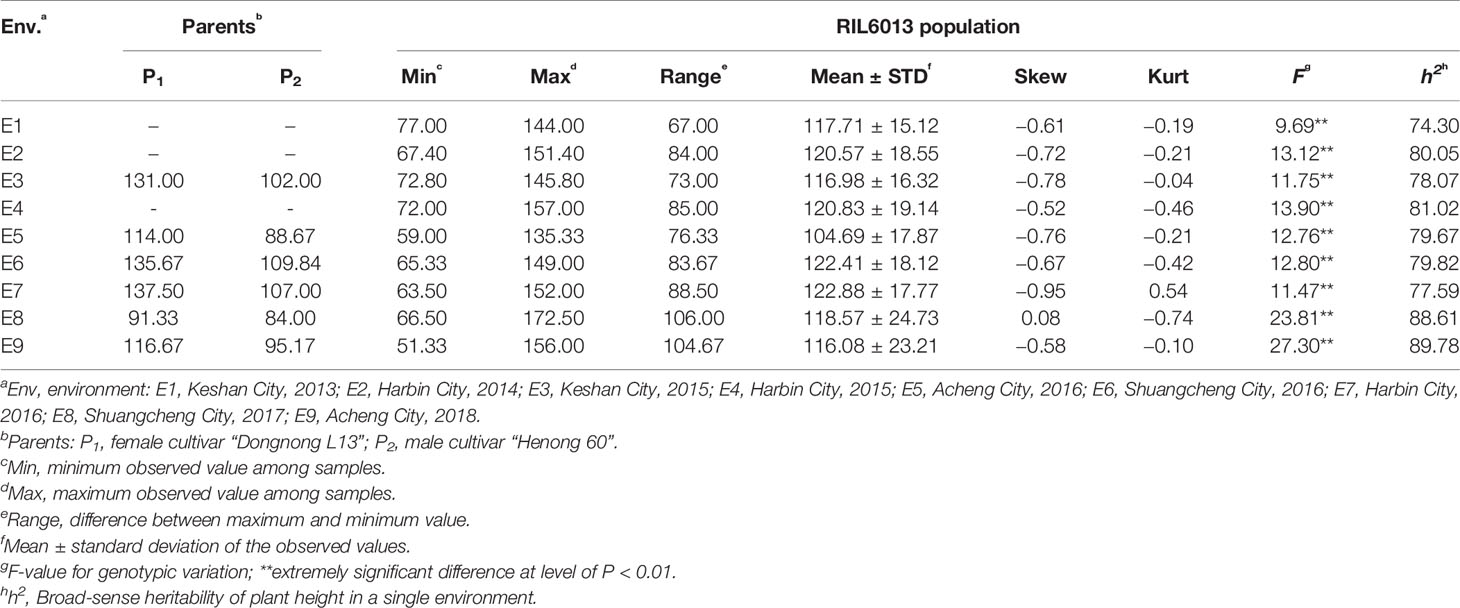
Table 1 Statistical analysis of soybean plant height for parents and the RIL6013 population in nine environments.
The coefficient of variation (CV) for plant height was between 12.84% and 20.86%. The range of plant heights in RIL6013 demonstrated that plant height variation is large. Mean heights of the population under E4, E6, and E7 were higher than those under the other six environments, and the CVs in E8 and E9 were larger than those in the other seven environments (Table 1). This suggested that different QTLs might be detected in different environments.
From a breeding point of view, except in E8, the plant height of the parents fell within the range of [Mean−STD, Mean+STD] for the population, indicating that the population has strong transgressive heterosis and plant height breeding goals will have a larger choice within the population.
The heritability of RIL6013 was between 74.30% and 89.78% in a single environment (Table 1). This high heritability indicates that the genetic variance is superior to the error variance, and RIL6013 is suitable for high-quality selection of plant height in soybean.
Correlation analysis revealed a strong correlation between the various environments (Table 2). The ANOVA results showed extremely significant differences (P<0.01) between the genotypes of this population, and also significant differences between the various environments. There were significant differences between genotypes, environment, and the genotype-by-environment interaction (Table 3), indicating that soybean plant height is highly influenced by all of these factors.
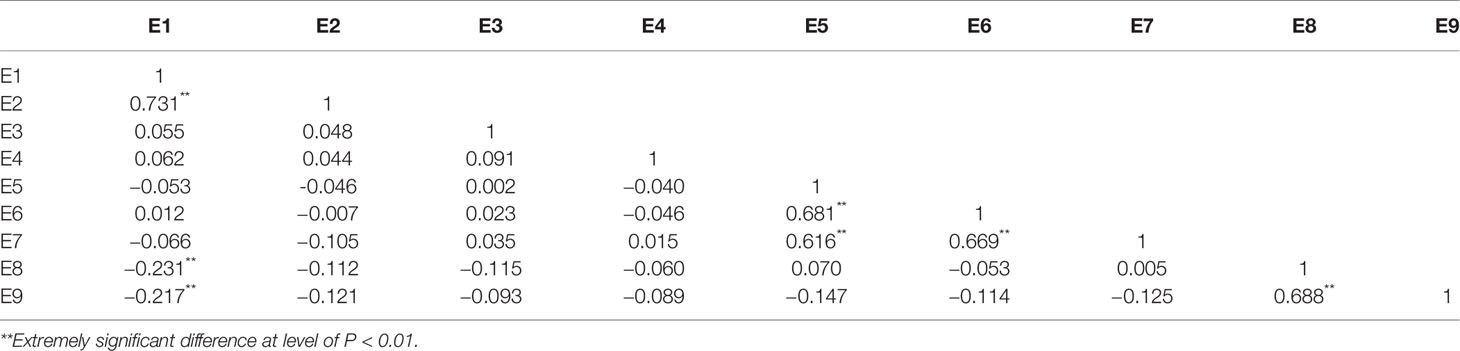
Table 2 Correlation analysis of nine environments.
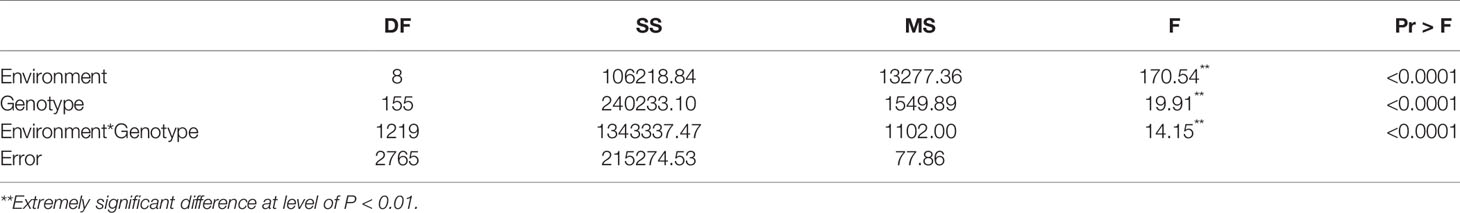
Table 3 Joint ANOVA of plant height in RIL6013 in multiple environments.
QTL Mapping of the Plant Height
We detected 48 plant height QTLs (Table S1), distributed across the 20 soybean linkage groups. One (I) to five (M) QTLs mapped to each linkage group with LOD values between 2.54 and 13.46, and each QTL explained between 0.55% and 19.55% of the phenotypic variation. Four QTLs (qPH-C1-1, qPH-M-1, qPH-F-1, qPH-L-1) explaining >10% phenotypic variation can be considered the major QTLs controlling plant height.
Twelve QTLs were detected by both IM and ICIM methods and were distributed on 10 linkage groups A2, B1, C1, C2, D1a, D1b, F, H, L, and N (Table S2). LOD values were between 2.54 and 13.46, and the phenotypic variation explained (PVE) ranged from 1.45% to 19.55%. The additive effects of qPH-F-1 detected in the E8 environment were negative, indicating that the allele derived from the male parent “Henong 60” increased plant height. The additive effects of the remaining QTLs were positive, indicating that the allele derived from the female parent “Dongnong L13” increase plant height.
We identified 21 QTLs in two or more environments, distributed over 14 linkage groups except D1b, A1, C2, B2, E, and I (Table S3). LOD values were 2.58 to 13.46, and the PVE ranged from 0.55% to 14.83%. Additive effects of qPH-K-2 detected in E1 and E2, qPH-F-1 detected in E8, and qPH-J-1 detected in E1 and E2 were negative, indicating the genes causing greatest effect were from the male parent; for the remaining QTLs, the genes making the greatest contribution were from the female parent.
We detected nine QTLs across multiple environments and using multiple methods (Table 4): E2 and E7, one QTL (qPH-A2-1); E1 and E3, one QTL (qPH-N-2); E1 and E2, five QTLs (qPH-B1-1, qPH-C1-1, qPH-D1a-3, qPH-H-1, and qPH-L-1); E1, E2, E5, and E7, one QTL (qPH-D1a-2); E2, E5, E6, E7, and E8, one QTL (qPH-F-1) (Figure 2). qPH-A2-1 was detected in the A2 linkage group, with LOD values from 2.97 to 3.13, PVE ranging from 1.13% to 6.93%, and a positive additive effect indicating that the dominant gene was derived from the female parent. qPH-N-2 was detected in the N linkage group with LOD value of 2.92 to 3.14 and PVE ranging from 1.12% to 1.75%, in which the gene with greatest contribution to the QTL under E1 was derived from the male parent while that with the greatest contribution under E3 was derived from the female parent. qPH-B1-1 was detected in the B1 linkage group, with LOD value of 4.86 to 7.27, PVE ranging from 2.12% to 9.79%, and the dominant gene derived from the female parent. qPH-C1-1 was detected in the C1 linkage group, with LOD value of 3.79 to 13.46, PVE ranging from 1.91% to 19.55%, and the dominant gene derived from the female parent. qPH-D1a-3 was detected in the D1a linkage group, with LOD value of 2.64 to 8.35, PVE ranging from 1.60% to 9.38%, and the dominant gene derived from the female parent. qPH-H-1 was detected in the H linkage group, with LOD value of 4.84 to 7.00, PVE from 1.02% to 7.04%, and the dominant gene derived from the female parent. qPH-L-1 was detected in the L linkage group, with LOD value of 4.58 to 8.20, PVE ranging from 3.02% to 14.00%, and the dominant gene derived from the female parent. qPH-D1a-2 was detected in the D1a linkage group, with LOD value of 2.83 to 5.27, PVE from 2.52% to 5.71%, and the dominant gene derived from the female parent. qPH-F-1 was detected in the F linkage group, with LOD value of 3.29 to 6.97, and PVE ranging from 1.14% to 10.72%; the additive effect in E2 and E8 was negative, indicating that the dominant gene was derived from the male parent.
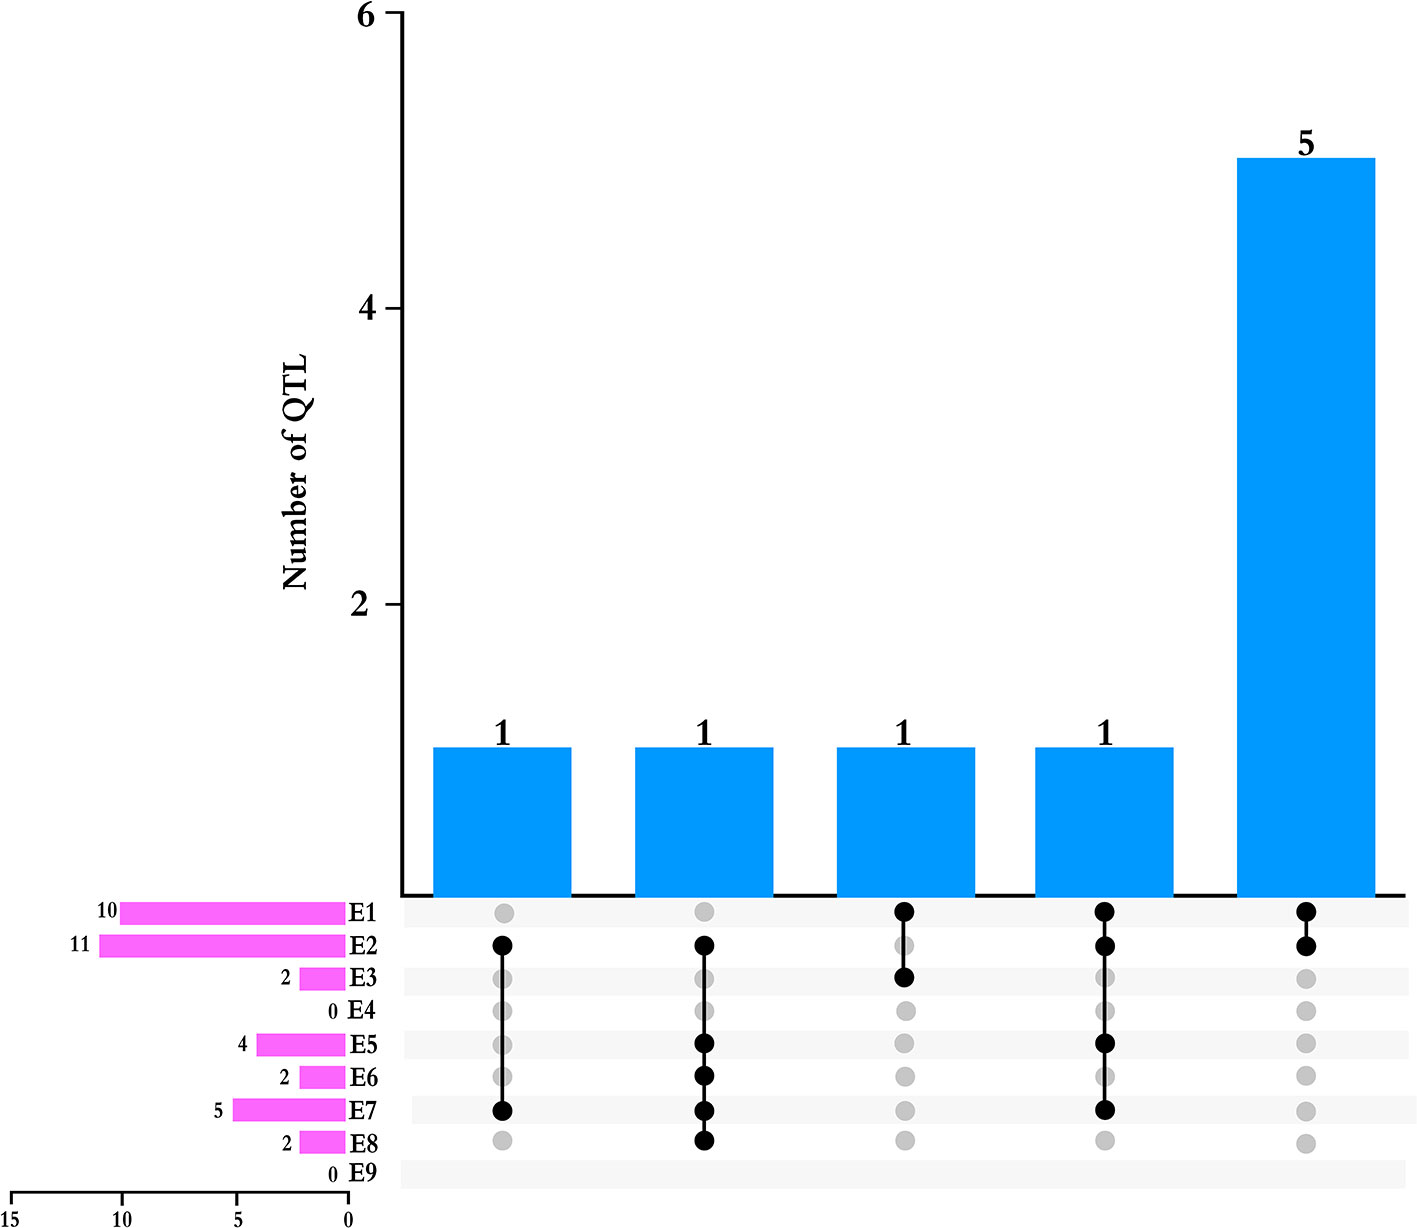
Figure 2 Total numbers of QTLs detected across multiple environments and by multiple methods. Pink bars indicated the number of QTLs detected in each environment.
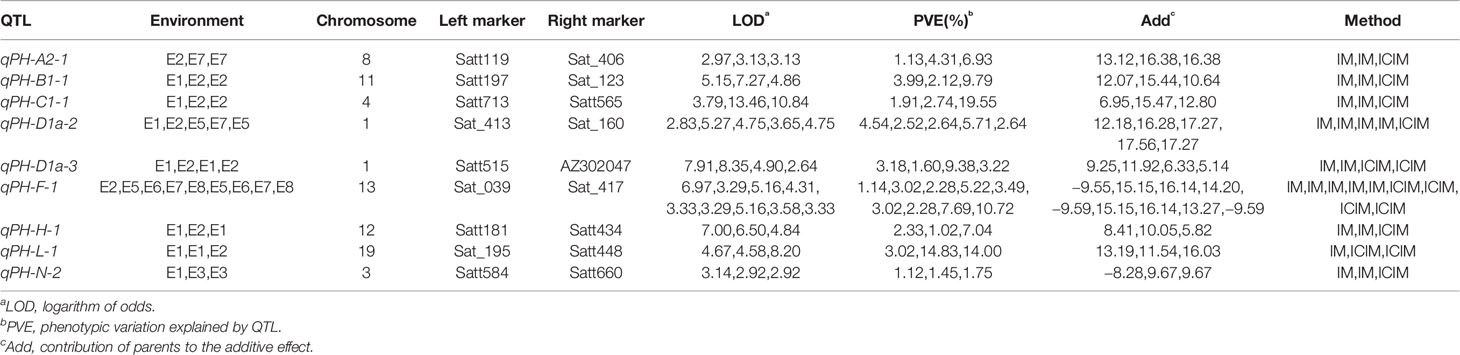
Table 4 Stably expressed QTLs identified by multiple methods and in multiple environments.
Population Structure
Selected 5000 of the 54836 with more polymorphic SNP markers (Pritchard et al., 2003), which were randomly distributed on 20 soybean chromosomes. Calculating ΔK using STRUCTURE 2.3.4 (Figure 3A, K = 1–10), revealing two subgroups (K = 2) based on the ΔK value (Figure 3B). These two subgroups contain 64 (46.04%) and 75 (53.96%) lines, respectively.
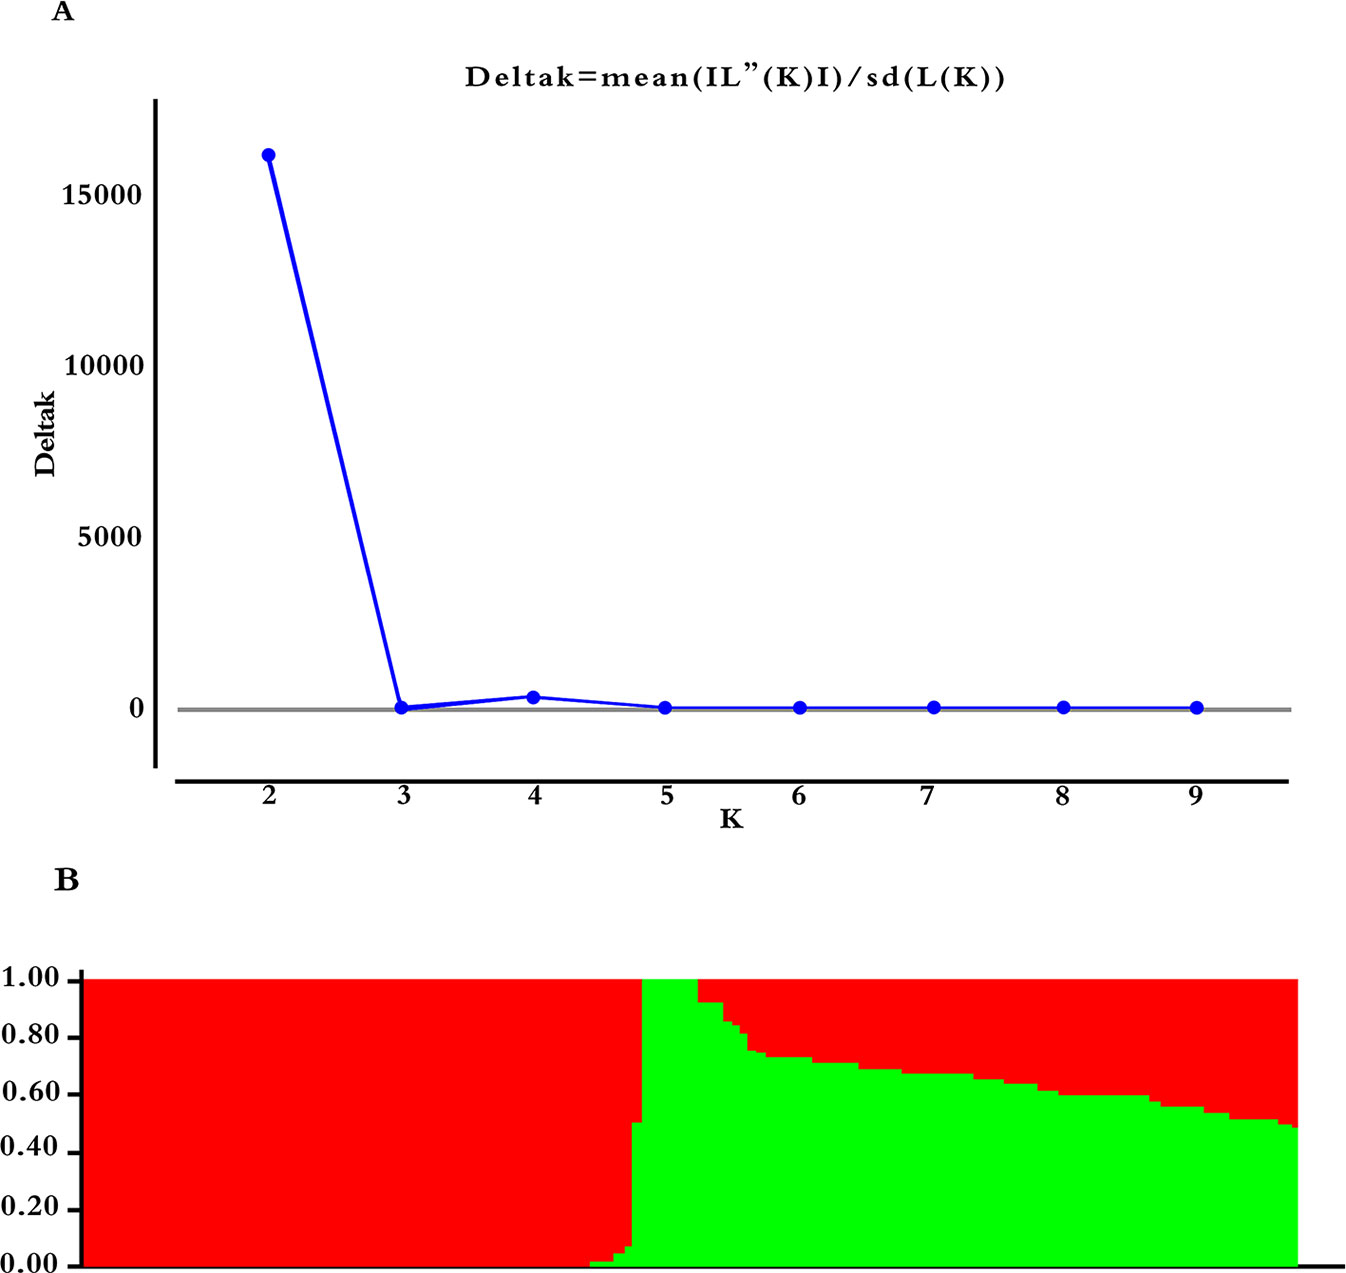
Figure 3 Population structure based on 5,000 SNPs distributed across 20 chromosomes. (A) Plot of ΔK calculated for K = 1–10. (B) Population structure (K = 2); the areas of the two colors (green and red) illustrate the proportion of each subgroup.
Linkage Disequilibrium Analysis
Because we used a bi-parental population, the LD decay distance was much longer than that in the natural population. As shown in Figure S1, r2 decreased gradually with increased distance, and the LD decay distance was estimated at 950 kb when r2 was 0.2. As this distance is too large, we determined the range for potential candidate genes according to the region showing the fastest LD decay. LD decayed fastest within 200 kb, and then gradually slowed down, so we searched for potential candidate genes in the interval of 100 kb on either side of each QTN.
QTN Location by Multi-Locus GWAS Methods
We used mrMLM, FASTmrMLM, FASTmrEMMA, pLARmEB, and ISIS EM-BLASSO to detect 10 QTNs (Table 5), and the five methods detected three, one, one, two, and seven QTNs, respectively (Figure 4A). We detected two, one, one, two, one, and three QTNs in environments E1, E3, E5, E6, E8, and E9, respectively (Figure 4B). No significant QTN was identified in environments E2, E4, or E7.
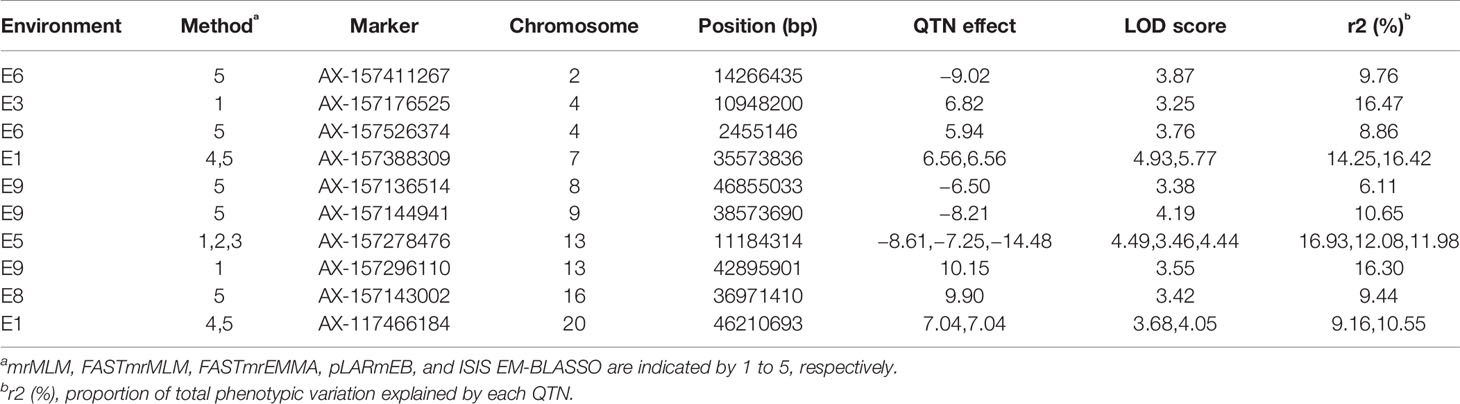
Table 5 QTNs identified by multiple methods.
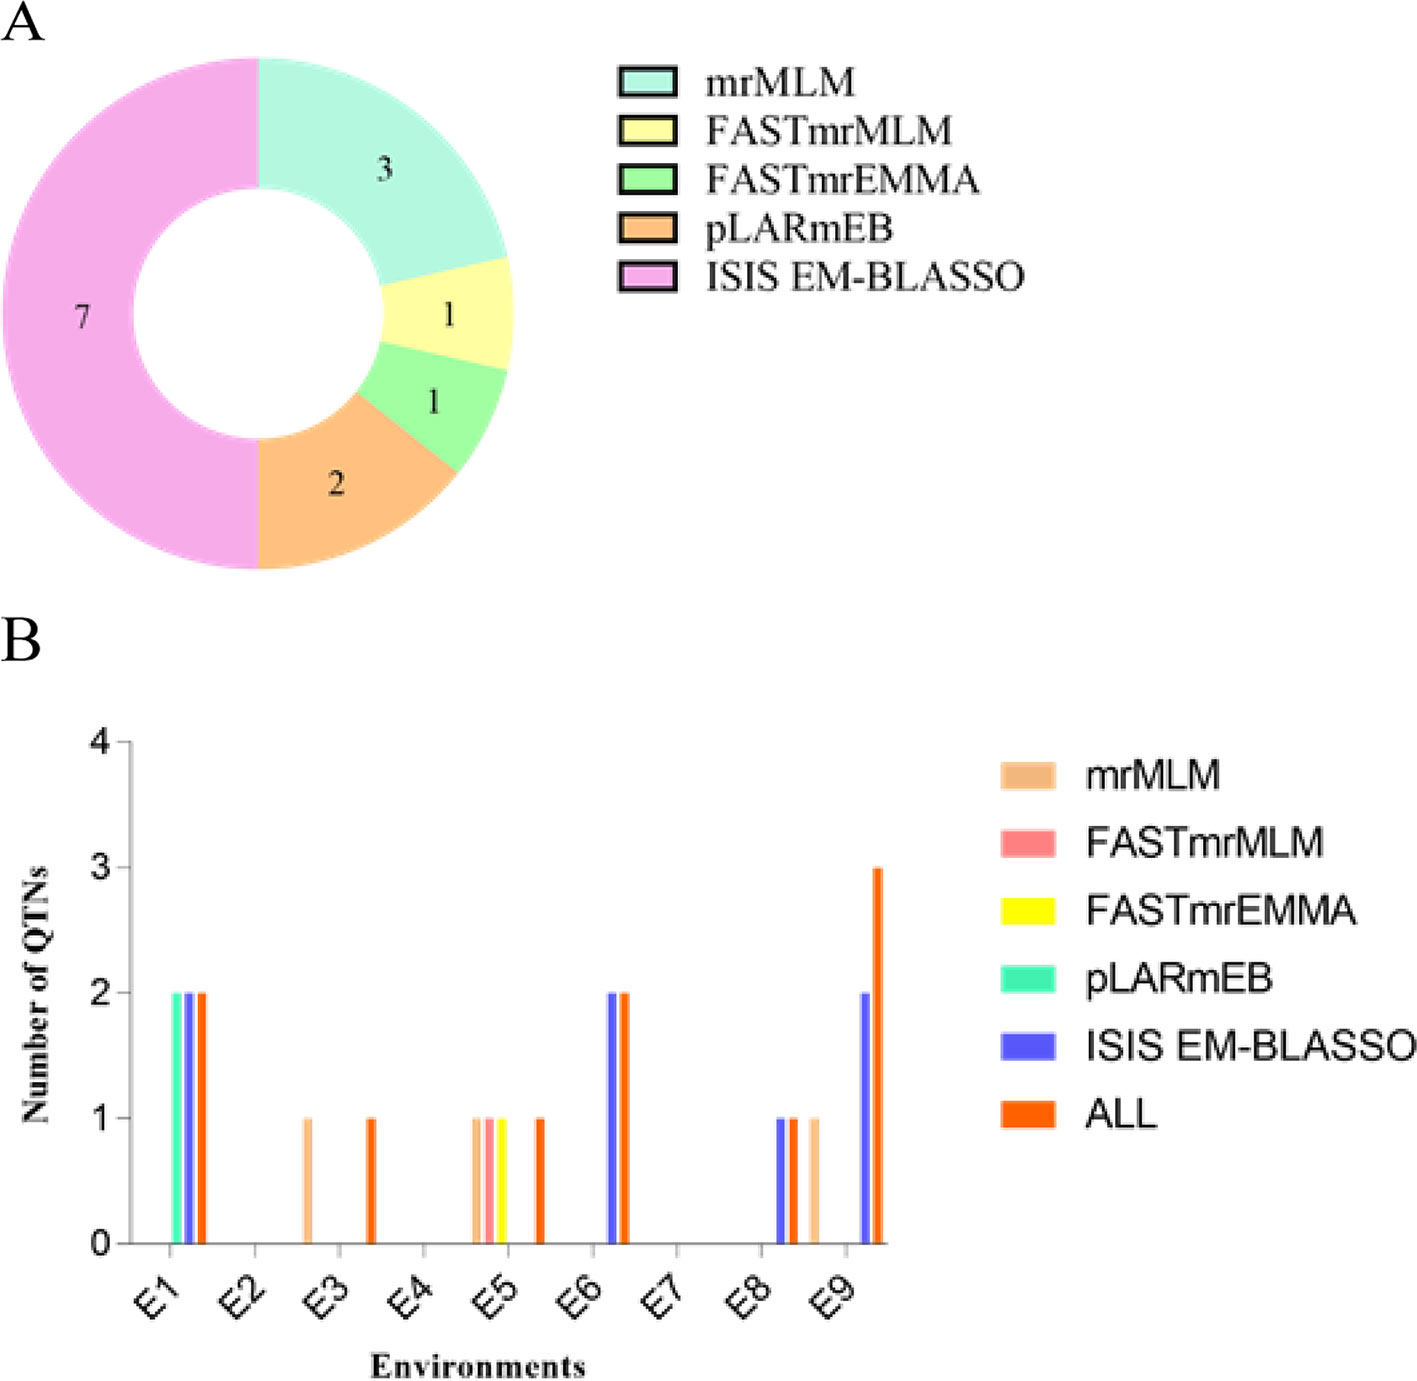
Figure 4 (A) Total number of significant QTNs detected by five methods. (B) Total number of significant QTNs detected in nine environments using five methods.
We detected three QTNs using multiple methods (Table 6, Figure 4B). The pLARmEB and ISIS EM-BLASSO methods detected a single QTN (AX-157388309) on chromosome 7, with LOD values ranging from 4.93 to 5.77 and PVE of 14.25% to 16.42%, and a QTN (AX-117466184) located on chromosome 20, with LOD value of 3.68 to 4.05 and PVE ranging from 9.16% to 10.55%. Both QTN effects were positive. The mrMLM, FASTmrMLM, and FASTmrEMMA methods detected a single QTN (AX-157278476) located on chromosome 13, with LOD value ranging from 3.46 to 4.49 and PVE ranging from 11.98% to 16.93%; the QTN effect was negative. The ISIS EM-BLASSO method detected the largest number of QTNs located in multiple environments, and the QTN effects detected by various methods were consistent (both positive or negative).
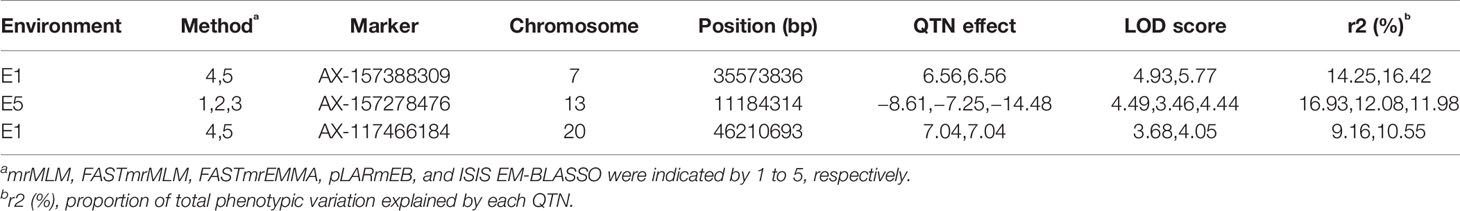
Table 6 Stably expressed QTNs identified by multiple methods.
Potential Candidate Gene Determination
We searched for potential candidate genes within 100-kb intervals on both sides of four QTNs, AX-157278476, AX-157296110, AX-157176525, and AX-157526374, which were repeatedly identified by linkage analysis and GWAS. Five genes were in the interval 11.08–12.08 Mb and 25 genes in the interval 42.80–43.00 Mb on chromosome 13, and three genes were in the interval 10.84–11.04 Mb and 29 in the interval 2.36–2.56 Mb on chromosome 4. We identified a total of 62 genes, of which 56 were expressed in stems and 24 were highly expressed in stems according to the Phytozome website. We used these 56 genes for pathway analysis, of which 19 (33.9%) were annotated in 16 pathways in the KEGG database (http://www.kegg.jp/) (Table 7, Figure 5). Through the ensemble plant website, we identified homologs of the 56 candidate genes in Arabidopsis thaliana, and predicted their possible functions (Table 8).
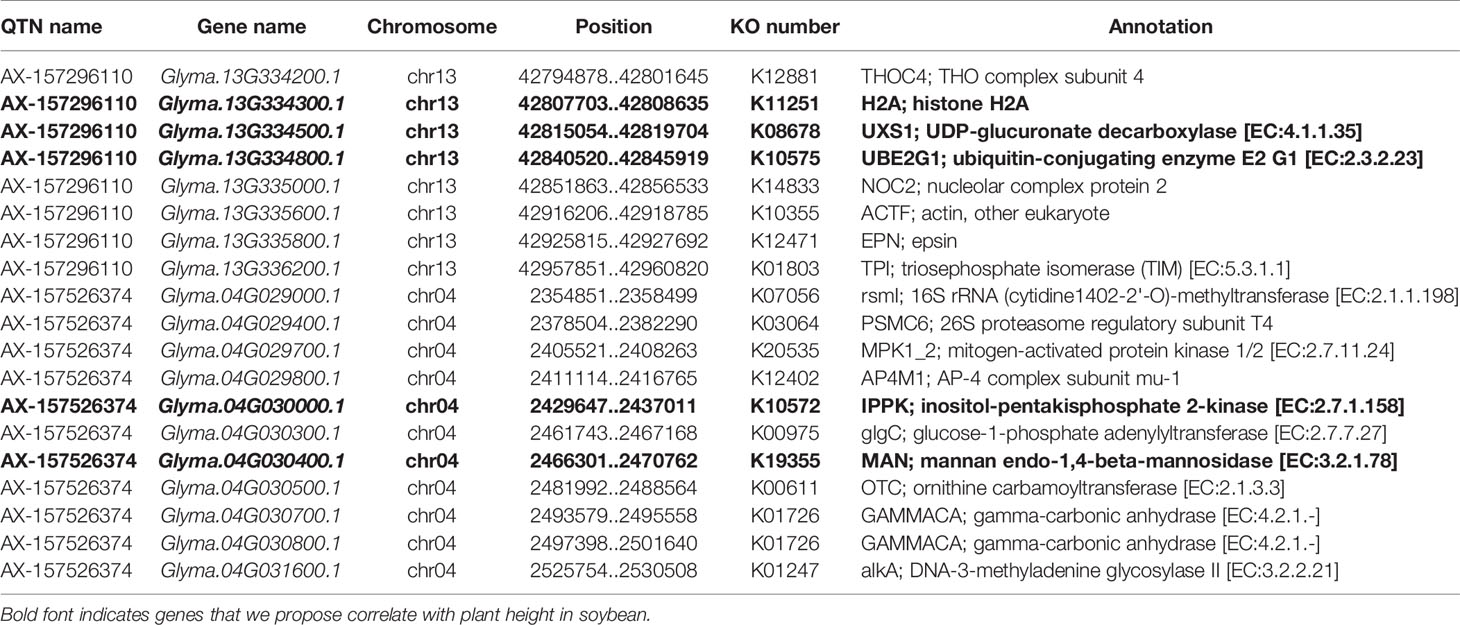
Table 7 Details of 19 candidate genes annotated in the KEGG database.
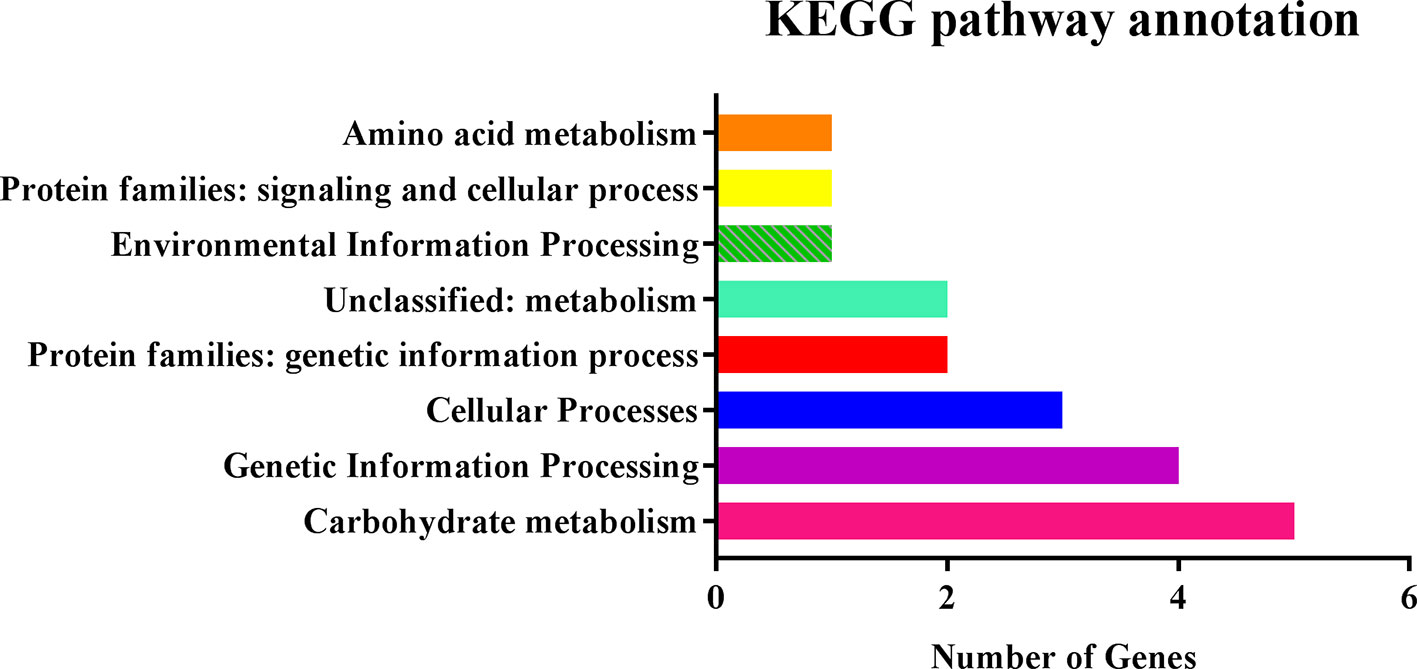
Figure 5 KEGG pathway annotation for 19 candidate genes.

Table 8 Annotation information of homologous genes in Arabidopsis thaliana.
Discussion
There are two parents, Dongnong L13 (110 cm) and Heongong 60 (70 cm), with significant differences in plant height, were distributed among 156 families. At the same time, the plant height observations of each family in the population showed a unimodal distribution, indicating that the plant height is a typical quantitative trait and controlled by multiple genes. The variation of plant height among the families in the population was large, and the genetic basis was rich. The range of RIL6013 is large than population conducted by “Minsoy” and “Noir 1”, indicated this population is more suitable for QTL mapping. At the same time, the results of the F test showed that the differences between the families in each environment were extremely significant (P < 0.01), also indicated that the population is suitable for analysis of variance and QTL mapping.
There is increasing research on QTLs related to soybean yield traits employing different methods. Most previous studies were single-environment analyses, affected by loss of related QTLs and data loss when using high LOD values or false positive detection of QTLs when using low LOD values. There are many detection methods for QTL mapping of soybean traits, including single marker analysis (SMA), interval mapping (IM), composite interval mapping (CIM), and inclusive complete interval mapping (ICIM). SMA is generally used in the case of few molecular markers, and genetic map construction is difficult. There are limitations on the development of QTL research using SMA (Haley and Knott, 1992), and genetic effects of QTLs and markers between the linkage distance cannot be distinguished. IM was first proposed by Lander and Botstein (1989). The possible location of QTLs can be inferred by marker interval, and the number of individuals required for the method is small. However, linkage between QTLs easily creates false positives, resulting in low detection efficiency of QTLs. Zeng (1993) proposed a CIM method, which introduces molecular markers closely linked to other QTLs as background genetic control, thereby reducing the residual variance, eliminating the influence of other QTLs, and improving the accuracy of QTL mapping. However, this method cannot be used in complex situations such as those involving epistasis or environment interactions. Compared with CIM, Wang (2009) proposed that ICIM simplifies the process of controlling genetic background variation and improves the detection efficiency of QTLs (Li H. et al., 2010). We used both IM and ICIM to effectively detect QTL intervals accurately in this study.
GWAS are effective methods for analyzing the genetic basis of complex traits in natural plant populations. Meanwhile, linkage analysis of segregating populations can effectively eliminate false positives, a defect of GWAS, but the results of linkage analysis usually have large intervals making it harder to find target genes. The four multi-locus GWAS methods can accurately map QTNs, and using two methods to verify each other can improve the accuracy of mapping. Analysis of multi-year and multi-environment data improves the accuracy of QTL position and effect estimation (Jansen et al., 1995) and is conducive to searching for stable QTLs. We also used multi-locus GWAS to detect QTNs related to soybean plant height. Linkage analysis based on multiple methods and environments detected nine QTLs (Table 4), while GWAS analysis detected 10 QTNs (Table 5). These included qPH-F-1 located on chromosome 13 at 1.91–43.31 Mb; AX-157278476 and AX-157296110 located at 11.11 Mb and 42.90 Mb on chromosome 13, respectively; qPH-C1-1 located at 0.55–46.13 Mb on chromosome 4; and AX-157526374 and AX-157176525 at 2.46 Mb and 10.95 Mb on chromosome 4, respectively (Figure 6, Table S4). Use of two methods not only narrowed the search range for candidate genes, but also supported the reliability of our results.
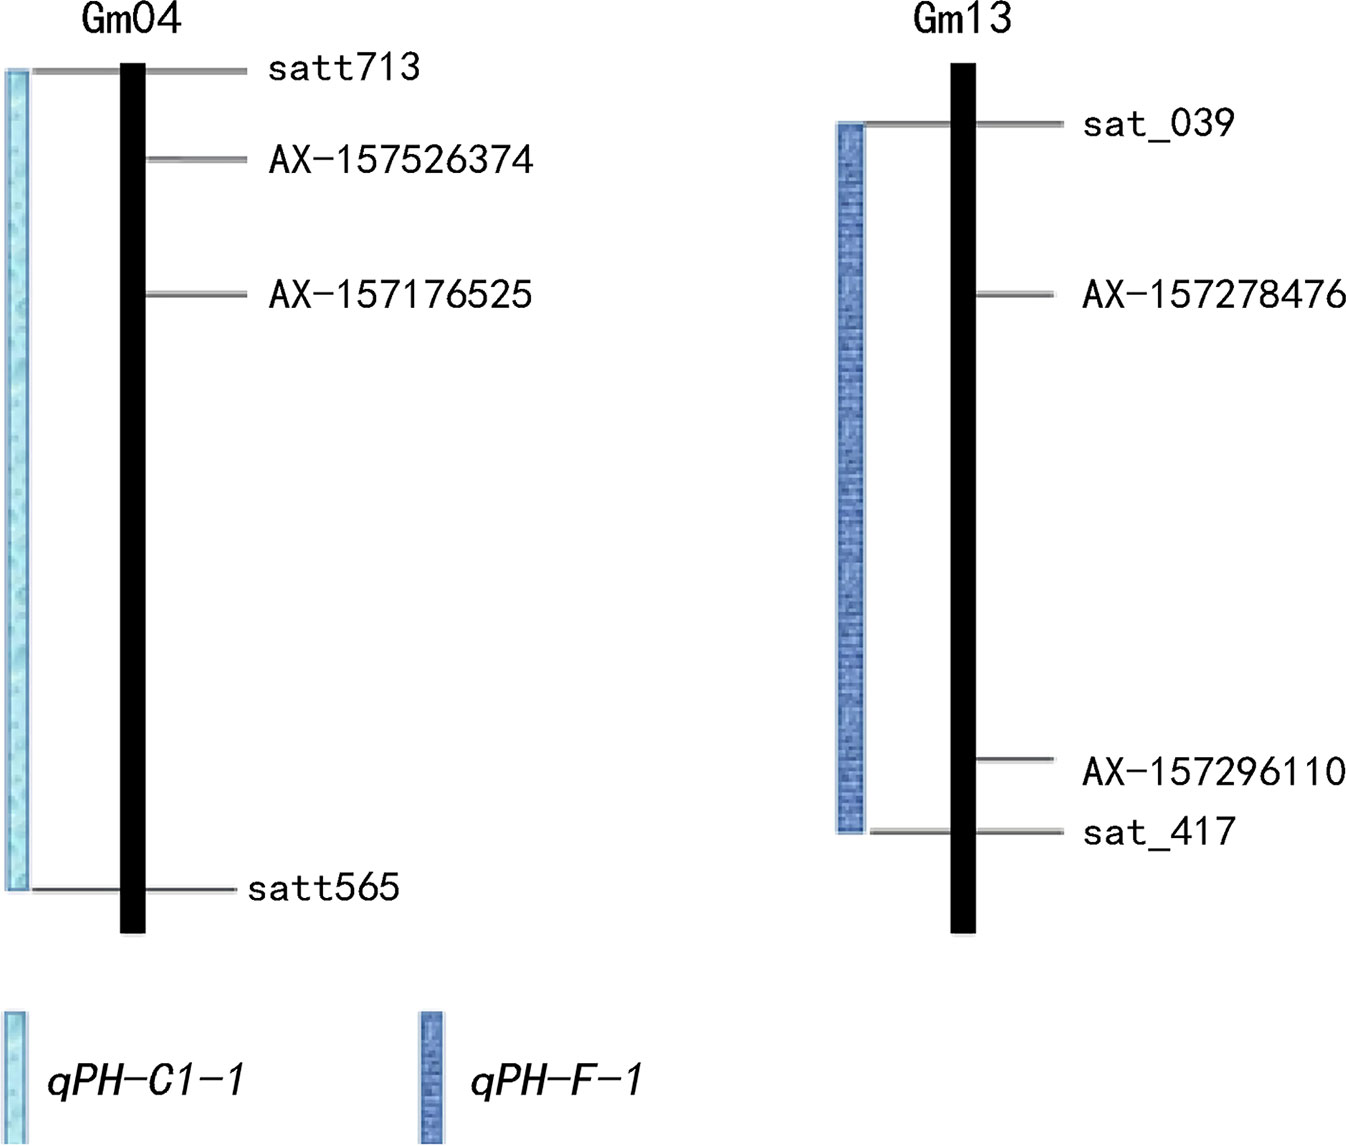
Figure 6 Details of overlapping loci on two chromosomes.
The population structure is an important factor leading to false positives in the results of association analysis, and the population structure is evaluated to determine the statistical model used. In statistics, confounding factors refer to irrelevant variable that are related to both dependent variables and independent variables (Miller, 2005). The population structure variables are confounding factors and are related to genotypes and phenotypes. At the same time, many traits are directly related to the subsets. There are differences in the phenotype and genotype between the families of the RIL population, so it is necessary to analyze the population structure of the RIL population. We performed multi-locus GWAS by a model removed Q, and the results were significantly different from the model Q+K (Table S5), indicating that the population structure has a great influence on the GWAS, so we adopted the model Q+K.
There is a close relationship between quantitative traits and environment. Plant height is a typical quantitative trait, and also affects soybean yield. The interaction between plant height and environmental conditions is an important factor affecting soybean yield. Huang et al. (1997) reported that QTLs are sensitive to environmental performance and there are large differences in QTL detection between different environments, but QTLs for different traits have different stability, and those with high heritability are more easily detected across different environments. Fulton et al. (1997) believe that QTLs that detect higher effect values in a single environment are not as efficient as those detected in multiple environments. Among the QTNs mapped by GWAS, three (AX-157388309, AX-157278476, and AX-117466184) that could be located by multiple methods explained phenotypic variation ranging from 9.16% to 16.93%. These stable main QTNs can be used for fine mapping and related research on marker-assisted selection.
Song et al. (2004) proposed the soybean genetic map GmComposite2003 based on the SoyBase database (https://www.soybase.org/) and results of recent studies, covering 20 chromosomes of soybean, with a total length of 2562.28 cM, and including 3334 markers. We used this as a reference map for integrating the results of this experiment. We detected nine soybean plant height QTLs using multiple methods and in multiple environments, and eight of these QTLs—qPH-D1a-2 (Lark et al., 1995; Chen et al., 2007; Hu et al., 2013), qPH-D1a-3 (Hu et al., 2013), qPH-N-2 (Kabelka et al., 2004), qPH-C1-1 (Lee et al., 1996; Kim et al., 2012), qPH-A2-1 (Lee et al., 1996), qPH-B1-1 (Lee et al., 1996; Sun et al., 2006; Gai et al., 2007; Sun et al., 2012), qPH-F-1 (Lee et al., 1996; Kabelka et al., 2004; Reinprecht et al., 2006; Gai et al., 2007; Josie et al., 2007; Li D. et al., 2010; Lee et al., 2015; Yao et al., 2015; Yao et al., 2015; Zhang et al., 2018b), and qPH-L-1 (Lark et al., 1995; Lee et al., 1996; Li et al., 2008))—showed inclusion within or overlap with chromosomal regions of QTLs detected in previous studies (Table 9). qPH-H-1 detected in E1 and E2 on chromosome 12 is not reported on the genetic map. We consider this a newly discovered QTL with PVE ranging from 1.02% to 7.04%. The 10 QTNs located in this study are not overlapping with or close to previously described regions, and represent newly located QTNs, which can explain phenotypic variation of 6.11% to 16.93%.
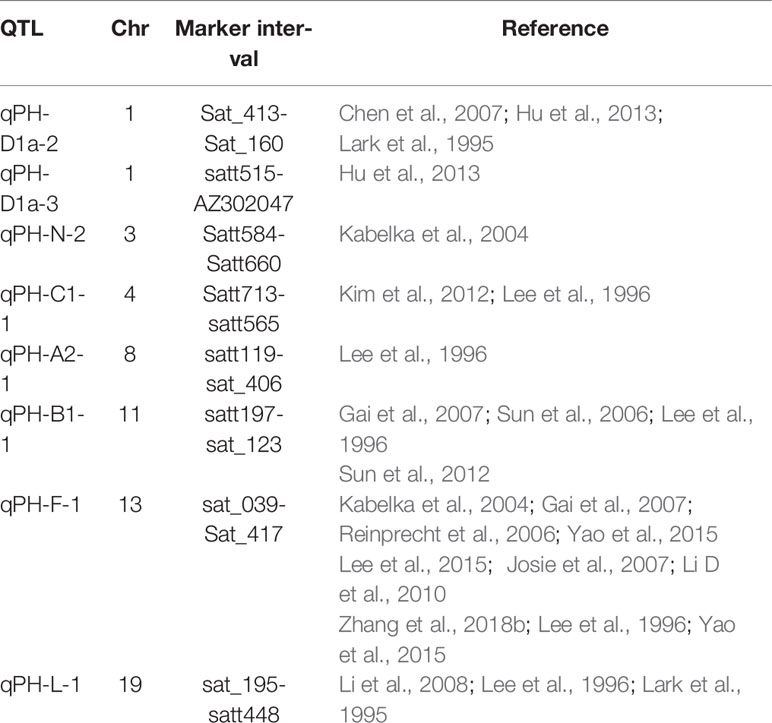
Table 9 QTLs located in previous studies.
Based on the analysis of 19 significant genes in the KEGG pathway, we conclude that five genes may regulate the growth and development of soybean cells (Table 7, bold text), which in turn affects soybean plant height and yield. Glyma.13G334500 is involved in the steroid biosynthesis process and regulates oxidoreductase activity, participates in the redox process, and is closely related to plant growth. Glyma.04G030000 is involved in the binding of ATP and specifically binds to 5-adenosine triphosphate (Ives et al., 2000). Glyma.04G030400 is involved in all carbohydrate pathways in the cell. Glyma.13G334300 is involved in the biosynthesis of histone H2A, which plays an important role in regulating plant flowering, growth and development, immune response, mitosis, and DNA repair (Berriri et al., 2016). Glyma.13G334800 regulates the production of ubiquitin ligase, which plays an important role in plant growth and development and stress regulation, including plant height and seed weight (Liu et al., 2013).These genes are all thought to be closely related to the stem growth of soybean plants.
We identified 19 genes in Arabidopsis homologous to the 56 candidate soybean genes, two of which may be associated with soybean plant height (Table 8). Glyma.13G035900 appears in the GO: 0004672 pathway. The homologous gene in Arabidopsis is AT1G21250, which regulates the synthesis of cell wall receptor kinase and controls cell wall elongation, which may be related to plant stem growth. Glyma.04G030000 appears in the GO: 0005524 pathway; the homologous gene in Arabidopsis is AT1G22100, which is involved in the synthesis of ATP and is involved in cell growth and development.
Summary
We detected nine significant QTLs by linkage analysis and 10 QTNs using five multi-locus GWAS methods. Combining the two analysis methods, we obtained four significant QTNs and predicted five candidate genes closely related to soybean plant height around these four QTNs. We identified 19 homologous genes in Arabidopsis, two of which may regulate plant height and development.
Data Availability Statement
All datasets generated for this study are included in the article/Supplementary Material.
Author Contributions
W-XL and HN conceived and designed the experiments. YF, QD, XL, ZQ, YW, XT, JS, JW, CY, and SJ performed the field experiments. SL and ZT performed the genome sequencing. YF, KZ, and HN analyzed and interpreted the results. YF and HN drafted the manuscript, and all the authors contributed to manuscript revision. WL provided laboratory conditions.
Funding
The authors gratefully acknowledge the financial support for this study provided by grants from the National Key Research and Development Program of China (2017YFD0101303-6) to W-XL and Project of Research and Development on Applied Technology of Harbin in Heilongjiang Province (2017RAXXJ019) to HN.
Conflict of Interest
The authors declare that the research was conducted in the absence of any commercial or financial relationships that could be construed as a potential conflict of interest.
Supplementary Material
The Supplementary Material for this article can be found online at: https://www.frontiersin.org/articles/10.3389/fpls.2020.00009/full#supplementary-material
References
Akhter, M., Sneller, C. (1996). Yield and yield components of early maturing soybean genotypes in the mid-south. Crop Sci. 36 (4), 877–882. doi: 10.2135/cropsci1996.0011183X0036000400010x
Bandillo, N., Raghavan, C., Muyco, P. A., Ma, A. L. S., Lobina, I. T., Dilla-Ermita, C. J., et al. (2013). Multi-parent advanced generation inter-cross (MAGIC) populations in rice: progress and potential for genetics research and breeding. Rice 6, 1–15. doi: 10.1186/1939-8433-6-11
Bandillo, N., Jarquin, D., Song, Q., Nelson, R., Cregan, P., Specht, J., et al. (2015). A population structure and genome-wide association analysis on the USDA soybean germplasm collection. Plant Genome 8 (3). doi: 10.3835/plantgenome2015.04.0024
Belamkar, V., Farmer, A. D., Weeks, N. T., Kalberer, S. R., Blackmon, W. J., Cannon, S. B. (2016). Genomics-assisted characterization of a breeding collection of Apios americana, an edible tuberous legume. Sci. Rep. 6, 34908. doi: 10.1038/srep34908
Berriri, S., Gangappa, S. N., Kumar, S. V. (2016). SWR1 chromatin-remodeling complex subunits and H2A. Z have non-overlapping functions in immunity and gene regulation in Arabidopsis. Mol. Plant 9, 1051–1065. doi: 10.1016/j.molp.2016.04.003
Bradbury, P., Zhang, Z., Kroon, D., Casstevens, T. Y., Buckler, E. (2007). TASSEL: software for association mapping of complex traits in diverse samples. Bioinformatics 23, 2633–2635. doi: 10.1093/bioinformatics/btm308
Chen, Q.-S., Zhang, Z.-C., Liu, C.-Y., Xin, D.-W., Qiu, H.-M., Shan, D.-P., et al. (2007). QTL analysis of major agronomic traits in soybean. Agric. Sci. China 6, 399–405. doi: 10.1016/S1671-2927(07)60062-5
Cook, J. P., Mcmullen, M. D., Holland, J. B., Tian, F., Bradbury, P., Ross-Ibarra, J., et al. (2012). Genetic architecture of maize kernel composition in the nested association mapping and inbred association panels. Plant Physiol. 158, 824–834. doi: 10.1104/pp.111.185033
Earl, D. A. (2012). Structure harvester: a website and program for visualizing STRUCTURE output and implementing the Evanno method. Conserv. Genet. Resour. 4, 359–361. doi: 10.1007/s12686-011-9548-7
Fang, C., Ma, Y., Wu, S., Liu, Z., Wang, Z., Yang, R., et al. (2017). Genome-wide association studies dissect the genetic networks underlying agronomical traits in soybean. Genome Biol. 18, 161. doi: 10.1186/s13059-017-1289-9
Feng, T., Bradbury, P. J., Brown, P. J., Hsiaoyi, H., Qi, S., Sherry, F. G., et al. (2015). Genome-wide association study of leaf architecture in the maize nested association mapping population. Nat. Genet. 43, 159–162. doi: 10.1038/ng.746
Fulton, T., Beck-Bunn, T., Emmatty, D., Eshed, Y., Lopez, J., Petiard, V., et al. (1997). QTL analysis of an advanced backcross of Lycopersicon peruvianum to the cultivated tomato and comparisons with QTLs found in other wild species. Theor. Appl. Genet. 95, 881–894. doi: 10.1007/s001220050639
Gai, J., Wang, Y., Wu, X., Chen, S. (2007). A comparative study on segregation analysis and QTL mapping of quantitative traits in plants—with a case in soybean. Front. Agric. China 1, 1–7. doi: 10.1007/s11703-007-0001-3
Guzman, P. S., Diers, B. W., Neece, D. J., Martin, S. K. S., Leroy, A. R., Grau, C. R., et al. (2007). QTL associated with yield in three backcross-derived populations of soybean. Crop Sci. 47, 111–122. doi: 10.2135/cropsci2006.01.0003
Haley, C. S., Knott, S. A. (1992). A simple regression method for mapping quantitative trait loci in line crosses using flanking markers. Heredity 69, 315. doi: 10.1038/hdy.1992.131
Henning, J., Gent, D., Twomey, M., Townsend, M., Pitra, N., Matthews, P. (2016). Genotyping-by-sequencing of a bi-parental mapping population segregating for downy mildew resistance in hop (Humulus lupulus L.). Euphytica 208, 545–559. doi: 10.1007/s10681-015-1600-3
Hou, S., Zhu, G., Li, Y., Li, W., Fu, J., Niu, E., et al. (2018). Genome-wide association studies reveal genetic variation and candidate genes of drought stress related traits in cotton (Gossypium hirsutum L.). Front. Plant Sci. 9, 1276. doi: 10.3389/fpls.2018.01276
Hu, Z., Zhang, H., Kan, G., Ma, D., Zhang, D., Shi, G., et al. (2013). Determination of the genetic architecture of seed size and shape via linkage and association analysis in soybean (Glycine max L. Merr.). Genetica 141, 247–254. doi: 10.1007/s10709-013-9723-8
Huang, N., Angeles, E., Domingo, J., Magpantay, G., Singh, S., Zhang, G., et al. (1997). Pyramiding of bacterial blight resistance genes in rice: marker-assisted selection using RFLP and PCR. Theor. Appl. Genet. 95, 313–320. doi: 10.1007/s001220050565
Huang, X., Sang, T., Zhao, Q., Feng, Q., Zhao, Y., Li, C., et al. (2010). Genome-wide association studies of 14 agronomic traits in rice landraces. Nat. Genet. 42, 961. doi: 10.1038/ng.695
Huang, B. E., George, A. W., Forrest, K. L., Kilian, A., Hayden, M. J., Morell, M. K., et al. (2012). A multiparent advanced generation inter-cross population for genetic analysis in wheat. Plant Biotechnol. J. 10, 826–839. doi: 10.1111/j.1467-7652.2012.00702.x
Hwang, E.-Y., Song, Q., Jia, G., Specht, J. E., Hyten, D. L., Costa, J., et al. (2014). A genome-wide association study of seed protein and oil content in soybean. BMC Genomics 15, 1. doi: 10.1186/1471-2164-15-1
Ives, E. B., Nichols, J., Wente, S. R., York, J. D. (2000). Biochemical and functional characterization of inositol 1, 3, 4, 5, 6-pentakisphosphate 2-kinases. J. Biol. Chem. 275, 36575–36583. doi: 10.1074/jbc.M007586200
Jansen, R., Van Ooijen, J., Stam, P., Lister, C., Dean, C. (1995). Genotype-by-environment interaction in genetic mapping of multiple quantitative trait loci. Theor. Appl. Genet. 91, 33–37. doi: 10.1007/BF00220855
Josie, J., Alcivar, A., Rainho, J., Kassem, M. A. (2007). Genomic regions containing QTL for plant height, internodes length, and flower color in soybean [Glycine max (L.) Merr]. Bios 78, 119–127. doi: 10.1893/0005-3155(2007)78[119:RAGRCQ]2.0.CO;2
Kabelka, E., Diers, B., Fehr, W., Leroy, A., Baianu, I., You, T., et al. (2004). Putative alleles for increased yield from soybean plant introductions. Crop Sci. 44, 784–791. doi: 10.2135/cropsci2004.7840
Kan, G., Zhang, W., Yang, W., Ma, D., Zhang, D., Hao, D., et al. (2015). Association mapping of soybean seed germination under salt stress. Mol. Genet. Genomics 290, 2147–2162. doi: 10.1007/s00438-015-1066-y
Keim, P., Diers, B. W., Olson, T. C., Shoemaker, R. C. (1990). RFLP mapping in soybean: association between marker loci and variation in quantitative traits. Genetics 126, 735–742. doi: 10.1007/BF00056365
Kim, K.-S., Diers, B., Hyten, D., Mian, M. R., Shannon, J., Nelson, R. (2012). Identification of positive yield QTL alleles from exotic soybean germplasm in two backcross populations. Theor. Appl. Genet. 125, 1353–1369. doi: 10.1007/s00122-012-1944-1
Korte, A., Farlow, A. (2013). The advantages and limitations of trait analysis with GWAS: a review. Plant Methods 9, 29. doi: 10.1186/1746-4811-9-29
Kover, P. X., Valdar, W., Trakalo, J., Scarcelli, N., Ehrenreich, I. M., Purugganan, M. D., et al. (2009). A multiparent advanced generation inter-cross to fine-map quantitative traits in Arabidopsis thaliana. PLoS Genet. 5, e1000551. doi: 10.1371/journal.pgen.1000551
Lander, E. S., Botstein, D. (1989). Mapping mendelian factors underlying quantitative traits using RFLP linkage maps. Genetics 121, 185–199. doi: 10.1007/BF00121515
Lark, K. G., Chase, K., Adler, F., Mansur, L. M., Orf, J. H. (1995). Interactions between quantitative trait loci in soybean in which trait variation at one locus is conditional upon a specific allele at another. Proc. Natl. Acad. Sci. 92, 4656–4660. doi: 10.1073/pnas.92.10.4656
Lee, S., Bailey, M., Mian, M., Carter, T., Ashley, D., Hussey, R., et al. (1996). Molecular markers associated with soybean plant height, lodging, and maturity across locations. Crop Sci. 36, 728–735. doi: 10.2135/cropsci1996.0011183X003600030035x
Lee, S., Jun, T., Michel, A. P., Mian, M. R. (2015). SNP markers linked to QTL conditioning plant height, lodging, and maturity in soybean. Euphytica 203, 521–532. doi: 10.1007/s10681-014-1252-8
Li, D., Pfeiffer, T., Cornelius, P. (2008). Soybean QTL for yield and yield components associated with Glycine soja alleles. Crop Sci. 48, 571–581. doi: 10.2135/cropsci2007.06.0361
Li, D., Sun, M., Han, Y., Teng, W., Li, W. (2010). Identification of QTL underlying soluble pigment content in soybean stems related to resistance to soybean white mold (Sclerotinia sclerotiorum). Euphytica 172, 49–57. doi: 10.1007/s10681-009-0036-z
Li, H., Zhang, L., Wang, J. (2010). Analysis and answers to frequently asked questions in quantitative trait locus mapping. Acta Agronomica Sin. 36, 918–931. doi: 10.3724/SP.J.1006.2010.00918
Li, H., Peng, Z., Yang, X., Wang, W., Fu, J., Wang, J., et al. (2013). Genome-wide association study dissects the genetic architecture of oil biosynthesis in maize kernels. Nat. Genet. 45, 43–U72. doi: 10.1038/ng.2484
Liu, F., Jiang, Y., Cao, Y., Li, H. (2013). Expression pattern assay of ZmGW2, a RING-domain E3 ubiquitin ligase gene in maize. J. Maize Sci. 21, 47–51. doi: 10.13597/j.cnki.maize.science.2013.02.010
Liu, R., Gong, J., Xiao, X., Zhang, Z., Li, J., Liu, A., et al. (2018). GWAS analysis and QTL identification of fiber quality traits and yield components in upland cotton using enriched high-density SNP markers. Front. Plant Sci. 9, 1067. doi: 10.3389/fpls.2018.01067
Mansur, L., Orf, J. H., Chase, K., Jarvik, T., Cregan, P., Lark, K. (1996). Genetic mapping of agronomic traits using recombinant inbred lines of soybean. Crop Sci. 36, 1327–1336. doi: 10.2135/cropsci1996.0011183X003600050042x
Miller, S. (2005). Experimental design and statistics (London: Routledge). doi: 10.4324/9780203977644
Ning, H., Yuan, J., Dong, Q., Li, W., Xue, H., Wang, Y., et al. (2018). Identification of QTLs related to the vertical distribution and seed-set of pod number in soybean [Glycine max (L.) Merri]. PLoS One 13, e0195830. doi: 10.1371/journal.pone.0195830
Ott, J., Kamatani, Y., Lathrop, M. (2011). Family-based designs for genome-wide association studies. Nat. Rev. Genet. 12, 465. doi: 10.1038/nrg2989
Poland, J. A., Bradbury, P. J., Buckler, E. S., Nelson, R. J. (2011). Genome-wide nested association mapping of quantitative resistance to northern leaf blight in maize. Proc. Natl. Acad. Sci. U. S. A 108, 6893–6898. doi: 10.1073/pnas.1010894108
Pritchard, J. K., Stephens, M., Rosenberg, N. A., Donnelly, P. (2000). Association mapping in structured populations. Am. J. Hum. Genet. 67, 170–181. doi: 10.1086/302959
Pritchard, J. K., Wen, W., Falush, D. (2003). Documentation for STRUCTURE software: Version 2. (Chicago, IL: The University of Chicago Press.)
Reinprecht, Y., Poysa, V. W., Yu, K., Rajcan, I., Ablett, G. R., Pauls, K. P. (2006). Seed and agronomic QTL in low linolenic acid, lipoxygenase-free soybean (Glycine max (L.) Merrill) germplasm. Genome 49, 1510–1527. doi: 10.1139/g06-112
Song, Q., Marek, L., Shoemaker, R., Lark, K., Concibido, V., Delannay, X., et al. (2004). A new integrated genetic linkage map of the soybean. Theor. Appl. Genet. 109, 122–128. doi: 10.1007/s00122-004-1602-3
Specht, J., Chase, K., Macrander, M., Graef, G., Chung, J., Markwell, J., et al. (2001). Soybean response to water. Crop Sci. 41, 493–509. doi: 10.2135/cropsci2001.412493x
Sukumaran, S., Dreisigacker, S., Lopes, M., Chavez, P., Reynolds, M. P. (2015). Genome-wide association study for grain yield and related traits in an elite spring wheat population grown in temperate irrigated environments. Theor. Appl. Genet. 128, 353–363. doi: 10.1007/s00122-014-2435-3
Sun, D., Li, W., Zhang, Z., Chen, Q., Ning, H., Qiu, L., et al. (2006). Quantitative trait loci analysis for the developmental behavior of soybean (Glycinemax L. Merr.). Theor. Appl. Genet. 112, 665–673. doi: 10.1007/s00122-005-0169-y
Sun, Y. N., Luan, H., Qi, Z., Shan, D., Liu, C., Hu, G., et al. (2012). Mapping and meta-analysis of height QTLs in soybean. Legume Genomics Genet. 3, 1–7. doi: 10.5376/lgg.2012.03.0001
Tamba, C. L., Ni, Y.-L., Zhang, Y.-M. (2017). Iterative sure independence screening EM-Bayesian LASSO algorithm for multi-locus genome-wide association studies. PLoS Comput. Biol. 13, e1005357. doi: 10.1371/journal.pcbi.1005357
Tian, F., Bradbury, P. J., Brown, P. J., Hung, H., Sun, Q., Flint-Garcia, S., et al. (2011). Genome-wide association study of leaf architecture in the maize nested association mapping population. Nat. Genet. 43, 159. doi: 10.1038/ng.746
Wang, S.-B., Feng, J.-Y., Ren, W.-L., Huang, B., Zhou, L., Wen, Y.-J., et al. (2016). Improving power and accuracy of genome-wide association studies via a multi-locus mixed linear model methodology. Sci. Rep. 6, 19444. doi: 10.1038/srep19444
Wang, J. (2009). Inclusive composite interval mapping of quantitative trait genes. Acta Agronomica Sin. 35, 239–245. doi: 10.3724/SP.J.1006.2009.00239
Wen, Y.-J., Zhang, H., Ni, Y.-L., Huang, B., Zhang, J., Feng, J.-Y., et al. (2017). Methodological implementation of mixed linear models in multi-locus genome-wide association studies. Briefings Bioinf. 19, 700–712. doi: 10.1093/bib/bbw145
Yao, D., Liu, Z., Zhang, J., Liu, S., Qu, J., Guan, S., et al. (2015). Analysis of quantitative trait loci for main plant traits in soybean. Genet. Mol. Res. 14, 6101–6109. doi: 10.4238/2015.June.8.8
Zeng, Z.-B. (1993). Theoretical basis for separation of multiple linked gene effects in mapping quantitative trait loci. Proc. Natl. Acad. Sci. 90, 10972–10976. doi: 10.1073/pnas.90.23.10972
Zhang, H., Hao, D., Sitoe, H. M., Yin, Z., Hu, Z., Zhang, G., et al. (2015a). Genetic dissection of the relationship between plant architecture and yield component traits in soybean (Glycine max) by association analysis across multiple environments. Plant Breed. 134, 564–572. doi: 10.1111/pbr.12305
Zhang, J., Song, Q., Cregan, P. B., Nelson, R. L., Wang, X., Wu, J., et al. (2015b). Genome-wide association study for flowering time, maturity dates and plant height in early maturing soybean (Glycine max) germplasm. BMC Genomics 16, 217. doi: 10.1186/s12864-015-1441-4
Zhang, J., Zhao, J., Liang, Y., Zou, Z. (2016). Genome-wide association-mapping for fruit quality traits in tomato. Euphytica 207, 439–451. doi: 10.1007/s10681-015-1567-0
Zhang, J., Feng, J., Ni, Y., Wen, Y., Niu, Y., Tamba, C., et al. (2017). pLARmEB: integration of least angle regression with empirical Bayes for multilocus genome-wide association studies. Heredity 118, 517. doi: 10.1038/hdy.2017.8
Zhang, K., Liu, S., Li, W., Liu, S., Li, X., Fang, Y., et al. (2018a). Identification of QTNs controlling seed protein content in soybean using multi-locus genome-wide association studies. Front. Plant Sci. 9, 1690. doi: 10.3389/fpls.2018.01690
Zhang, X., Wang, W., Guo, N., Zhang, Y., Bu, Y., Zhao, J., et al. (2018b). Combining QTL-seq and linkage mapping to fine map a wild soybean allele characteristic of greater plant height. BMC Genomics 19, 226. doi: 10.1186/s12864-018-4582-4
Zhang, Y., Liu, P., Zhang, X., Zheng, Q., Chen, M., Ge, F., et al. (2018c). Multi-locus genome-wide association study reveals the genetic architecture of stalk lodging resistance-related traits in maize. Front. Plant Sci. 9, 611. doi: 10.3389/fpls.2018.00611
Keywords: soybean, plant height, quantitative trait nucleotides, multi-locus genome-wide association studies, linkage analysis
Citation: Fang Y, Liu S, Dong Q, Zhang K, Tian Z, Li X, Li W, Qi Z, Wang Y, Tian X, Song J, Wang J, Yang C, Jiang S, Li W-X and Ning H (2020) Linkage Analysis and Multi-Locus Genome-Wide Association Studies Identify QTNs Controlling Soybean Plant Height. Front. Plant Sci. 11:9. doi: 10.3389/fpls.2020.00009
Received: 22 May 2019; Accepted: 07 January 2020;
Published: 14 February 2020.
Edited by:
Yuan-Ming Zhang, Huazhong Agricultural University, ChinaReviewed by:
Haiming Xu, Zhejiang University, ChinaZhenyu Jia, University of California, Riverside, United States
Copyright © 2020 Fang, Liu, Dong, Zhang, Tian, Li, Li, Qi, Wang, Tian, Song, Wang, Yang, Jiang, Li and Ning. This is an open-access article distributed under the terms of the Creative Commons Attribution License (CC BY). The use, distribution or reproduction in other forums is permitted, provided the original author(s) and the copyright owner(s) are credited and that the original publication in this journal is cited, in accordance with accepted academic practice. No use, distribution or reproduction is permitted which does not comply with these terms.
*Correspondence: Wen-Xia Li, bGl3ZW54aWFuZWF1QDEyNi5jb20=; Hailong Ning, bmluZ2hhaWxvbmduZWF1QDEyNi5jb20=