 Ricardo José Stein1
 Guilherme Leitão Duarte2
 Lívia Scheunemann3†Marta Gomes Spohr3
 Artur Teixeira de Araújo Júnior2
 Felipe Klein Ricachenevsky4
 Luis Mauro Gonçalves Rosa5Nilson Ivo Tonin Zanchin6
 Rinaldo Pires dos Santos3
 Janette Palma Fett2,3*
- 1Faculdade Murialdo, Caxias do Sul, Brazil
- 2Centro de Biotecnologia, Universidade Federal do Rio Grande do Sul, Porto Alegre, Brazil
- 3Instituto de Biociências, Universidade Federal do Rio Grande do Sul, Porto Alegre, Brazil
- 4Departamento de Biologia, Universidade Federal de Santa Maria, Santa Maria, Brazil
- 5Departamento de Plantas Forrageiras e Agrometeorologia, Faculdade de Agronomia, Universidade Federal do Rio Grande do Sul, Porto Alegre, Brazil
- 6Instituto Carlos Chagas, Fundação Oswaldo Cruz – FIOCRUZ, Curitiba, Brazil
Iron (Fe) is an essential element to plants, but can be harmful if accumulated to toxic concentrations. Fe toxicity can be a major nutritional disorder in rice (Oryza sativa) when cultivated under waterlogged conditions, as a result of excessive Fe solubilization of in the soil. However, little is known about the basis of Fe toxicity and tolerance at both physiological and molecular level. To identify mechanisms and potential candidate genes for Fe tolerance in rice, we comparatively analyzed the effects of excess Fe on two cultivars with distinct tolerance to Fe toxicity, EPAGRI 108 (tolerant) and BR-IRGA 409 (susceptible). After excess Fe treatment, BR-IRGA 409 plants showed reduced biomass and photosynthetic parameters, compared to EPAGRI 108. EPAGRI 108 plants accumulated lower amounts of Fe in both shoots and roots compared to BR-IRGA 409. We conducted transcriptomic analyses of roots from susceptible and tolerant plants under control and excess Fe conditions. We found 423 up-regulated and 92 down-regulated genes in the susceptible cultivar, and 42 up-regulated and 305 down-regulated genes in the tolerant one. We observed striking differences in root gene expression profiles following exposure to excess Fe: the two cultivars showed no genes regulated in the same way (up or down in both), and 264 genes were oppositely regulated in both cultivars. Plants from the susceptible cultivar showed down-regulation of known Fe uptake-related genes, indicating that plants are actively decreasing Fe acquisition. On the other hand, plants from the tolerant cultivar showed up-regulation of genes involved in root cell wall biosynthesis and lignification. We confirmed that the tolerant cultivar has increased lignification in the outer layers of the cortex and in the vascular bundle compared to the susceptible cultivar, suggesting that the capacity to avoid excessive Fe uptake could rely in root cell wall remodeling. Moreover, we showed that increased lignin concentrations in roots might be linked to Fe tolerance in other rice cultivars, suggesting that a similar mechanism might operate in multiple genotypes. Our results indicate that changes in root cell wall and Fe permeability might be related to Fe toxicity tolerance in rice natural variation.
Introduction
Iron (Fe) is an essential nutrient for plants. It is involved in oxi-reductive reactions in photosynthesis, respiration and nitrogen assimilation, as well as in other important plant biological processes. Thus, plants have evolved mechanisms to maintain Fe homeostasis when soil concentration is low (Sperotto et al., 2012; Ricachenevsky et al., 2018). However, Fe can also become toxic if accumulated inside the cell, acting as a potent generator of reactive oxygen species (ROS), specially the hydroxyl radical, by the Fenton reaction (Becana et al., 1998). This radical is extremely toxic to cell metabolism, leading to oxidation of biological macromolecules such as lipids, proteins and nucleic acids, causing membrane leakage and even cell death (Blokhina et al., 2003). Thus, plants must maintain Fe concentrations within a narrow range for proper growth and development.
Rice plants are especially prone to Fe toxicity when cultivated under flooded conditions. Well-aerated soils usually have high amounts of ferric Fe (Fe3+), which has low solubility. Waterlogging, however, results in an anoxic and reductive environment that reduces Fe3+ to the more soluble Fe2+, which is accumulated in the soil solution (Becker and Asch, 2005). Wetland rice stands for most of the world rice production, and Fe toxicity reduces rice yield by 12 to 100%, depending on the genotype, intensity of Fe toxicity stress and soil fertility status (Sahrawat, 2004). Two distinct types of toxicity have been described in the literature: a true (or real) Fe toxicity – characterized by the accumulation of toxic levels of Fe in the plant body (Sahrawat, 2000; Olaleye et al., 2001; Stein et al., 2009a) and an indirect toxicity, caused by Fe precipitation in the root apoplast – the Fe plaque – resulting in multiple nutritional deficiencies (Sahrawat, 2004).
Different Fe toxicity tolerance mechanisms have been proposed for rice plants: type I consists in Fe exclusion from roots, and uses aerenchyma-derived oxygen or enzymatic activity to oxidize Fe2+ into Fe3+, which precipitates as an Fe plaque at the root surface (Wu et al., 2014); type II consists of shoot tolerance to high Fe concentration, likely through compartmentalization via storage within the inner cavity of ferritin proteins (Stein et al., 2009b) or by the action of vacuolar transporters such as VITs (VACUOLAR IRON TRANSPORTER, Zhang et al., 2012); and type III, in the presence of an antioxidant system that detoxifies reactive oxygen species produced via Fenton when Fe is present in excess (Wu et al., 2017). Type I is considered a root-based mechanism, and types II and III are shoot-based mechanisms. Clearly, there is wide variation in tolerance, which depends on the stress duration, strength, and plant developmental stage. Some genotypes may present contrasting phenotypes depending on how the experiments are performed (Wu et al., 2014; Matthus et al., 2015), indicating the need to better understand the underlying physiological and molecular mechanisms of Fe tolerance. Previous work showed that (1) photosynthesis is affected by Fe toxicity (Stein et al., 2009a; Müller et al., 2017); known Fe uptake genes are down-regulated upon high Fe treatment (Finatto et al., 2015); and that early (3 days) and late (3 weeks) Fe toxicity responses are quite different in both roots and shoots (Quinet et al., 2012). However, molecular mechanisms associated with tolerant and sensitive genotypes are underexplored.
Although no causative gene that confers Fe tolerance was cloned, previous studies showed that Fe tolerance in distinct rice genotypes is a quantitative trait, with many QTL already described, all showing small effects (Dufey et al., 2009, 2012, 2015; Wu et al., 2014; Matthus et al., 2015; Zhang et al., 2017). Based on these studies, shoot-based tolerance might be linked to two glutathione S-transferases localized in chromosome 1, which are induced upon Fe stress (Matthus et al., 2015). For root-based mechanisms of Fe exclusion, one QTL co-localizes with OsIRT1, which is a Fe2+ transporter involved in the combined strategy for Fe acquisition present in rice (Ishimaru et al., 2006; Sperotto et al., 2012; Ricachenevsky and Sperotto, 2014).
Here, we analyzed the effects of high Fe concentration on two rice cultivars previously characterized as Fe toxicity susceptible and tolerant, BR-IRGA 409 and EPAGRI 108 (Silveira et al., 2007). The two cultivars are commonly used in rice fields in the two southernmost provinces of Brazil, Rio Grande do Sul, and Santa Catarina. Besides physiological characterization, transcriptomic analyses using microarrays were performed, showing markedly different gene expression profiles in the two contrasting cultivars. Our data suggest that tolerance to high Fe in some rice cultivars can be linked to increased lignification, which would in turn result in decreased permeability for Fe radial diffusion in roots and consequently lower root-to-shoot Fe translocation.
Results
BR-IRGA 409 and EPAGRI 108 Susceptibility and Tolerance to Fe Toxicity
BR-IRGA 409 and EPAGRI 108 (hereafter “susceptible” and “tolerant” cultivars) were previously characterized as susceptible and tolerant to Fe toxicity, respectively, based solely on shoot biomass (Silveira et al., 2007). In order to further characterize the physiological responses of these cultivars to high Fe, we exposed plants to 500 ppm (excess Fe) and 6.5 ppm (control) for 9 days. Plants from the susceptible cultivar developed typical symptoms of Fe toxicity, with appearance of bronzing and necrotic lesions on leaves, while roots turned brown/orange (Figures 1B,D). The tolerant cultivar showed weaker symptoms of Fe toxicity in both shoots and roots (Figures 1A,C). Confirming previous data, shoot and root dry weight of the susceptible cultivar were decreased upon excess Fe treatment (Figures 1E,F), while no significant differences were observed in shoot and root dry weight in the tolerant cultivar. Exposure to excess Fe also led to a severe reduction of chlorophyll concentration in the susceptible cultivar, but no reduction in the tolerant one (Figure 1G). This clearly shows that BR-IRGA 409 and EPAGRI 108 are susceptible and tolerant to excessive Fe in our experimental conditions.
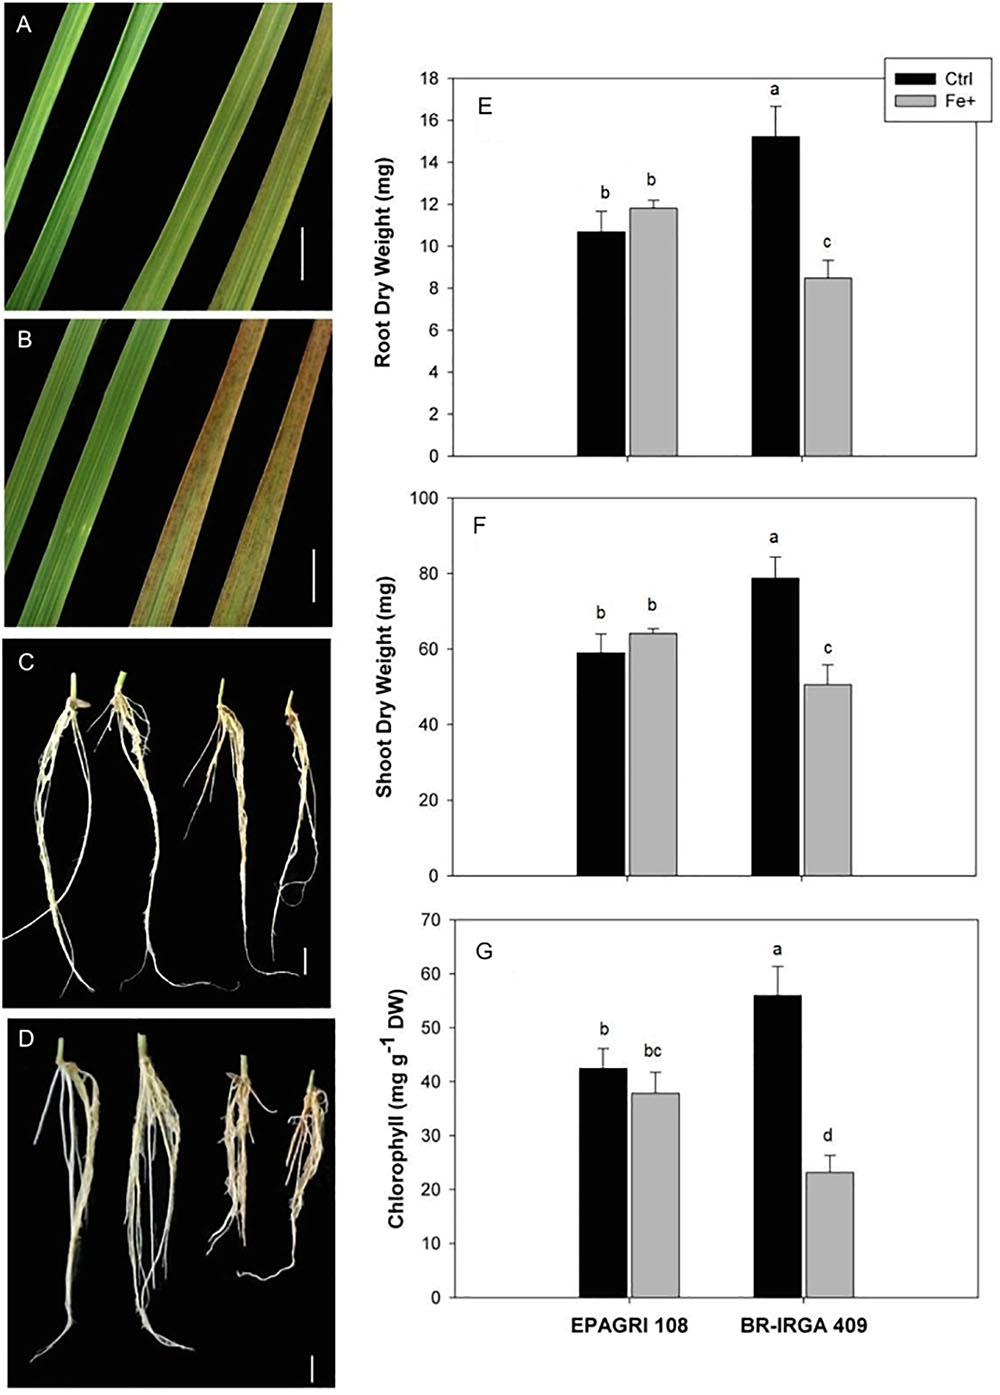
Figure 1. Effects of excess iron in leaves (A,B) and roots (C,D) from EPAGRI 108 (A,C) and BR-IRGA 409 (B,D) rice plants exposed for 9 days to control (left) and excess (right) iron treatments. Bars represent 0.5 cm. Root (E), and shoot (F) dry weight, and total chlorophyll (G) of plants exposed for 9 days to control (Ctrl) or iron excess (Fe+). Each value represents the mean of six replicates ± SE. Distinct letters above the bars indicate significant difference between means (Duncan test, P ≤ 0.05).
In order to find possible differences in Fe partitioning that could account for differences in tolerance, we quantified Fe concentrations in plants from both cultivars under control and excess Fe conditions (Table 1). Interestingly, shoots and roots (after Fe plaque removal – see below) from both cultivars showed comparable concentrations of Fe. Upon excess Fe treatment, shoots, and roots of the susceptible cultivar increased Fe concentration to a largest extent compared to the tolerant one. In shoots the susceptible cultivar had an increase of sevenfold, whereas the tolerant one had a fourfold increase (Table 1). In order to account for the larger biomass of the tolerant cultivar (Figure 1), we also considered the total Fe content (Fe concentrations in roots and shoots multiplied by the respective dry weights) in both cultivars. The average total Fe contents within plants (roots plus shoots, excluding the “Fe plaque”) under the control treatment were 27.8 and 35.3 mg of Fe in EPAGRI 108 and BR-IRGA 409 plants, respectively. Upon excess Fe treatment, those contents reached 100.8 μg Fe in the tolerant cultivar (EPAGRI 108) and 129.4 μg Fe in the susceptible one. Therefore, even with lower biomass, total Fe uptake in plants from the susceptible cultivar was 28% higher than in the tolerant plants. Similarly, the Fe concentration in roots “Fe plaque” was higher in plants submitted to excess Fe treatment than in control plants, again to a larger extent in the susceptible cultivar. Interestingly, root Fe concentration in the “Fe plaque” was lower under excess Fe conditions in the tolerant cultivar than in the susceptible one (Table 1). Taken together, these results indicate that EPAGRI 108 is capable of excluding Fe from entering the root symplast, thus decreasing root to shoot Fe translocation.
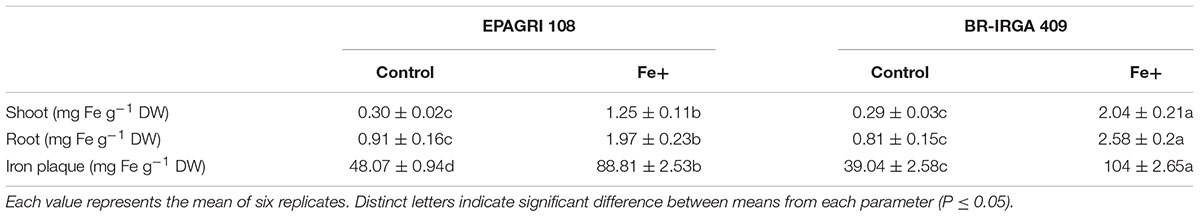
Table 1. Iron accumulation and distribution in rice plants from cultivars EPAGRI 108 and BR-IRGA 409 after 9 days of exposure to control (Control) or excess (Fe+) iron treatments.
Gas Exchange Measurements Reflect the Susceptible and Tolerant Phenotypes
Plants of both cultivars were exposed to excess Fe and control conditions for gas exchange measurements. Plants from the susceptible cultivar exposed to excess Fe showed lower rates of light saturated photosynthesis compared to control plants, while plants from the tolerant cultivar showed little difference between treatments (Figure 2). Decrease on carbon assimilation in BR-IRGA 409 plants was detected as early as the first day of exposure to excess Fe, with further decrease during the 9 days of treatment. In EPAGRI 108, a similar decrease in carbon assimilation was observed after 1 day of treatment. However, after 6 days of excess Fe treatment, plants from the tolerant cultivar recovered, and the photosynthetic activity reached levels similar to those of the control treatment. Thus, the tolerant cultivar is able to circumvent the effects of Fe toxicity to maintain carbon assimilation.
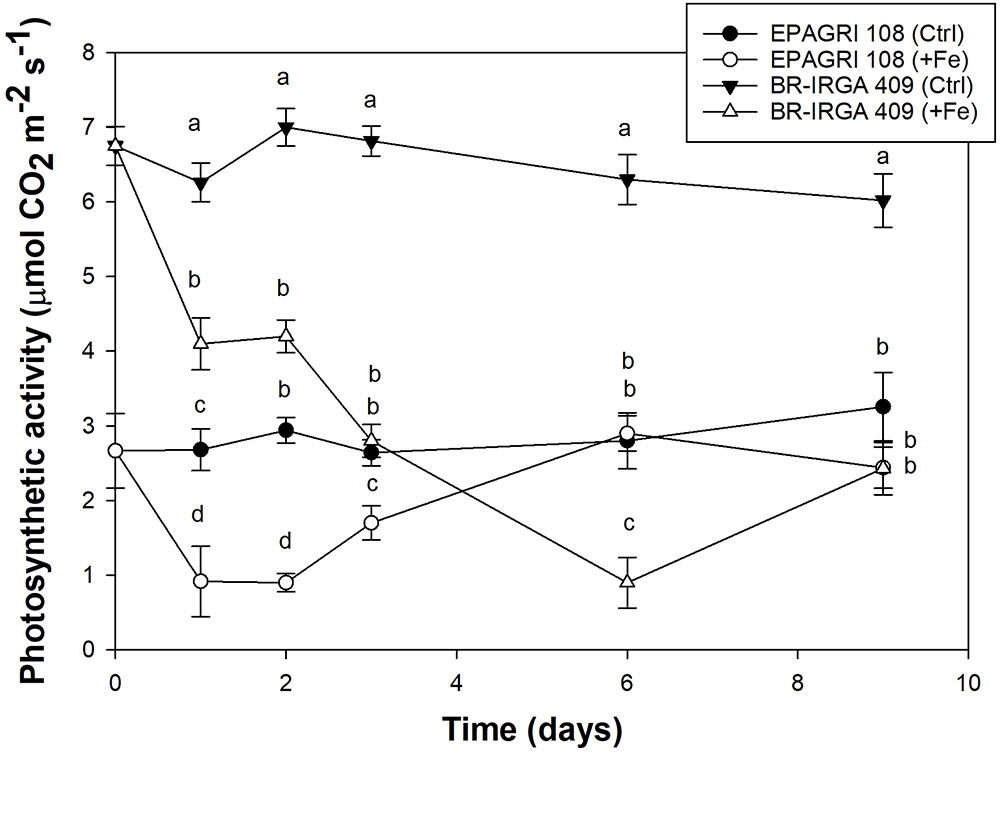
Figure 2. Net CO2 assimilation rate from cultivars BR-IRGA 409 (circles) and EPAGRI 108 (triangles) rice plants, exposed to control (closed symbols) or excess (open symbols) iron treatments. Gas exchange measurements were performed after 1, 2, 3, 6,and 9 days of exposure to treatments, using the youngest fully expanded leaf from each plant. Each value represents the mean of six replicates ± SE.
Different patterns of CO2 assimilation rates/estimated substomatal CO2 partial pressure (A/Ci) response curves were observed in tolerant EPAGRI 108 and susceptible BR-IRGA 409 plants (Figures 3A,B). Under excess Fe, plants from both cultivars showed a reduction in photosynthetic capacity (the maximum rate of photosynthesis reached under CO2 saturation as light is already saturating), which was clearer in BR-IRGA 409 plants. Plants from the susceptible cultivar also showed a decrease in the slope of the A/Ci relationship, indicating a reduction in the carboxylation efficiency under excess Fe compared to control conditions (Figure 3A). Plants from the tolerant cultivar, however, showed no reduction (Figure 3B). Analysis of the response curves by using the model proposed by Farquhar et al. (1980) indicated that excess Fe led to a decrease in maximum carboxylation rate (Vcmax, 24.5% reduction) and electron transport rate (Jmax, 41.7% reduction) after 6 days of exposure only in the susceptible cultivar (BR-IRGA 409), compared to the control treatment. EPAGRI 108 plants showed no statistically significant changes in both parameters (Table 2).
Figure 3. CO2 response (A,B) and light response (C,D) curves from BR-IRGA 409 (A,C) and EPAGRI 108 (B,D) rice plants after 6 days of exposure to control (closed circles) or excess (open circles) iron treatments. Photosynthetic response curves were obtained for the youngest fully expanded leaf from each plant. Each curve represents the measurements obtained from four independent plants. In C and D, means ± SE are shown. A, net CO2 assimilation rate; Ci, estimated substomatal CO2 partial pressure; PAR, photosynthetic active radiation.
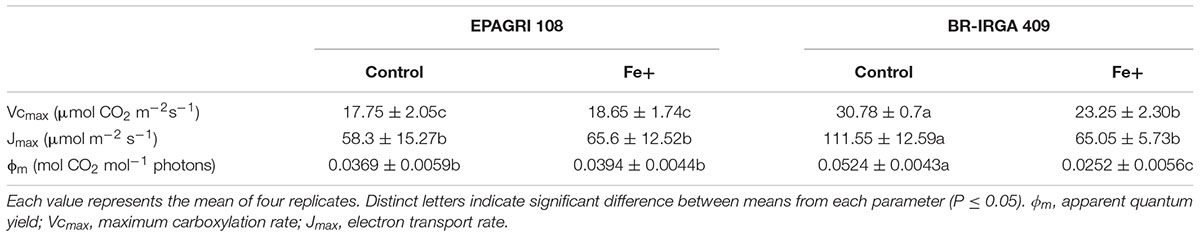
Table 2. Effects of 6-days exposure to control (Control) or excess (Fe+) iron treatments on photosynthetic parameters of rice plants from cultivars EPAGRI 108 and BR-IRGA 409.
The light response curves (Figures 3C,D) revealed a clear advantage for the susceptible BR-IRGA 409 plants under non-stressful conditions, while tolerant EPAGRI 108 plants showed no differences when cultivated under control or excess Fe treatments,. Exposure of BR-IRGA 409 plants to excess Fe resulted in a significant reduction (51.9%) on the apparent quantum yield (ϕm) as compared to control plants, while a small reduction (6.3%, not significant) was observed in EPAGRI 108 plants (Table 2). These data indicate that photosynthesis is only marginally affected by excess Fe in plants from the tolerant cultivar, whereas photosynthetic parameters showed significant decreases in plants from the susceptible one when exposed to excess Fe.
Oxidative Metabolism Is Affected in Leaves of the Susceptible but Not in Tolerant Cultivar Under Excess Fe
Differences in oxidative metabolism were already suggested as possible sources of tolerance to Fe toxicity in rice (Wu et al., 2017). In the present work, fully expanded leaves from plants of the susceptible cultivar exposed to excess Fe showed higher thiobarbituric acid-reacting substances (TBARS; Figure 4A), carbonyl concentration (Figure 4B) and H2O2 levels (Figure 4C) than leaves from plants in control conditions, while no difference could be observed in leaves of the tolerant cultivar (Figure 4). These data clearly indicated that excess Fe caused oxidative stress only in the susceptible cultivar (BR-IRGA 409), increasing to oxidation of lipids, proteins and the H2O2 accumulation in the leaves, whereas no changes are observed in the tolerant cultivar.
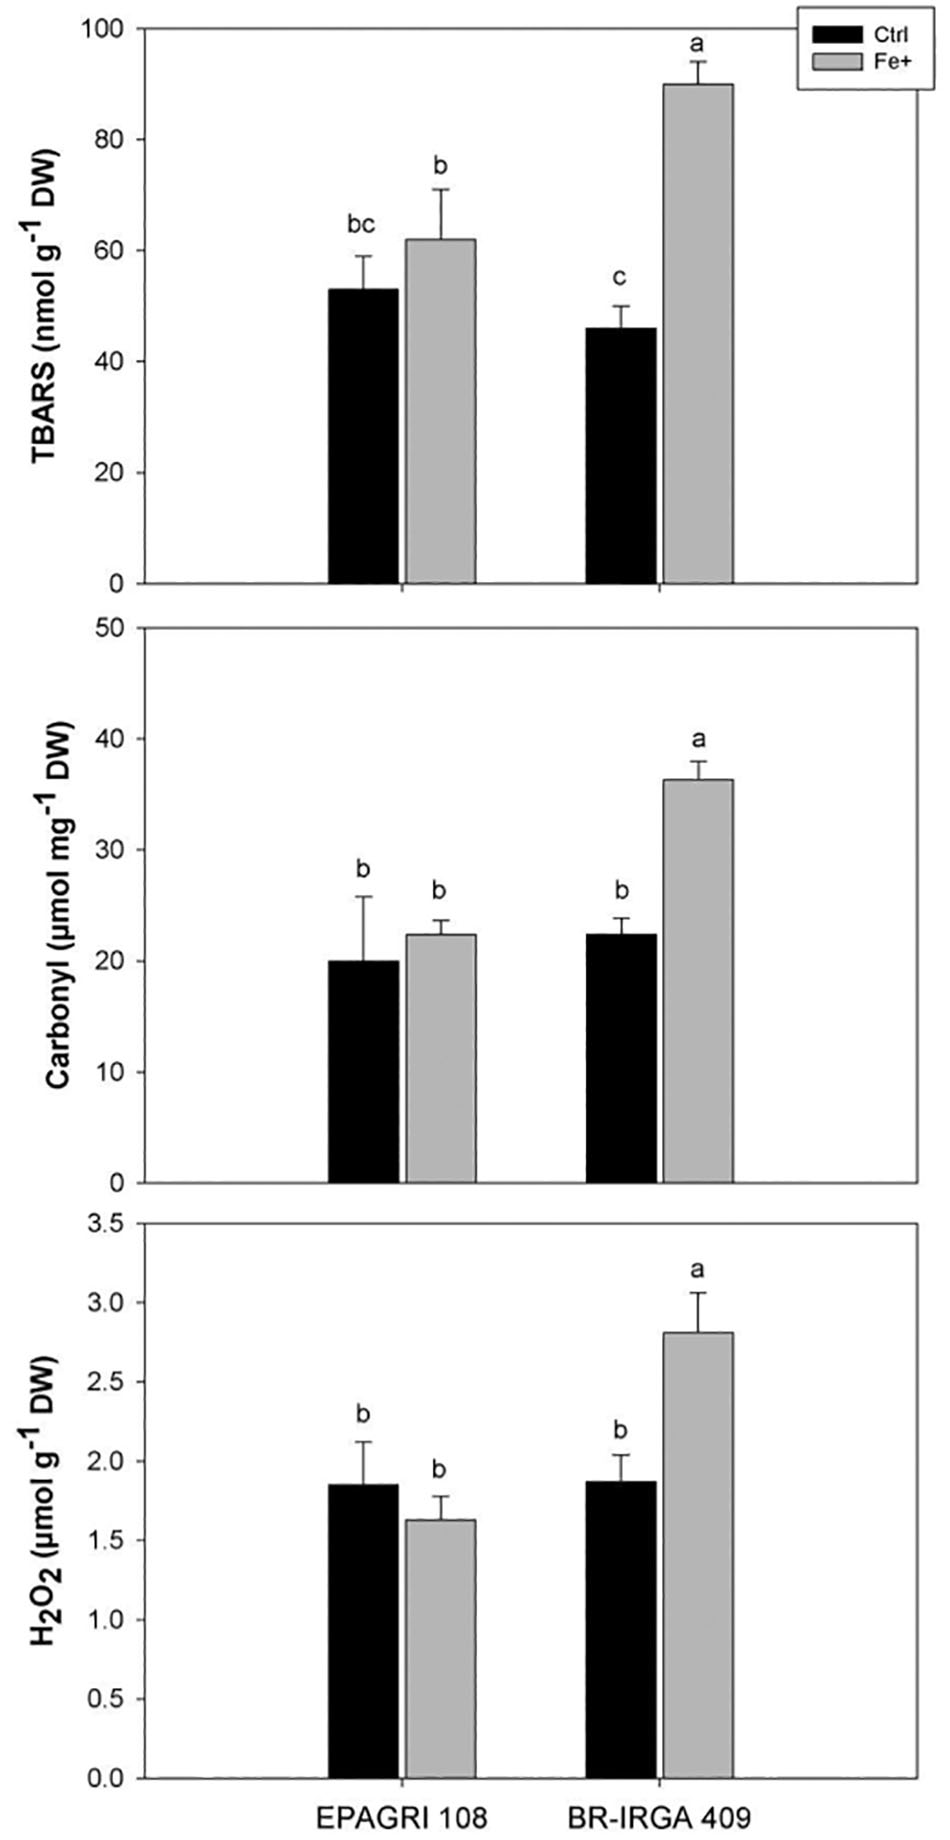
Figure 4. Oxidative damage to lipids and proteins (TBARS and Carbonyl accumulation, respectively) and H2O2 accumulation in fully expanded leaves from EPAGRI 108 and BR-IRGA 409 rice plants after 9 days of exposure to control (Ctrl) or excess (Fe+) iron treatments. Each value represents the mean of six replicates ± SE. Distinct letters above the bars indicate significant difference between means (Duncan test, P ≤ 0.05).
Antioxidative enzyme activities were differentially regulated upon excess Fe in each cultivar. Compared to controls, catalase (CAT) activity was increased by Fe toxicity in both cultivars, whereas ascorbate peroxidase (APX) activity was increased to a higher extent in the susceptible one (Figures 5A,B). No difference in superoxide dismutase (SOD) activity was observed in plants from both cultivars submitted to excess Fe compared to controls (Figure 5C). Although we cannot rule out a shoot-based mechanism for EPAGRI 108 Fe tolerance (e.g., increased Fe compartmentalization in vacuoles), these data indicate that the tolerant cultivar has few changes in the antioxidant metabolism that could account for the tolerant phenotype. Thus, EPAGRI 108 seems to be at least to some extent tolerant to excessive Fe due to root-based mechanisms.
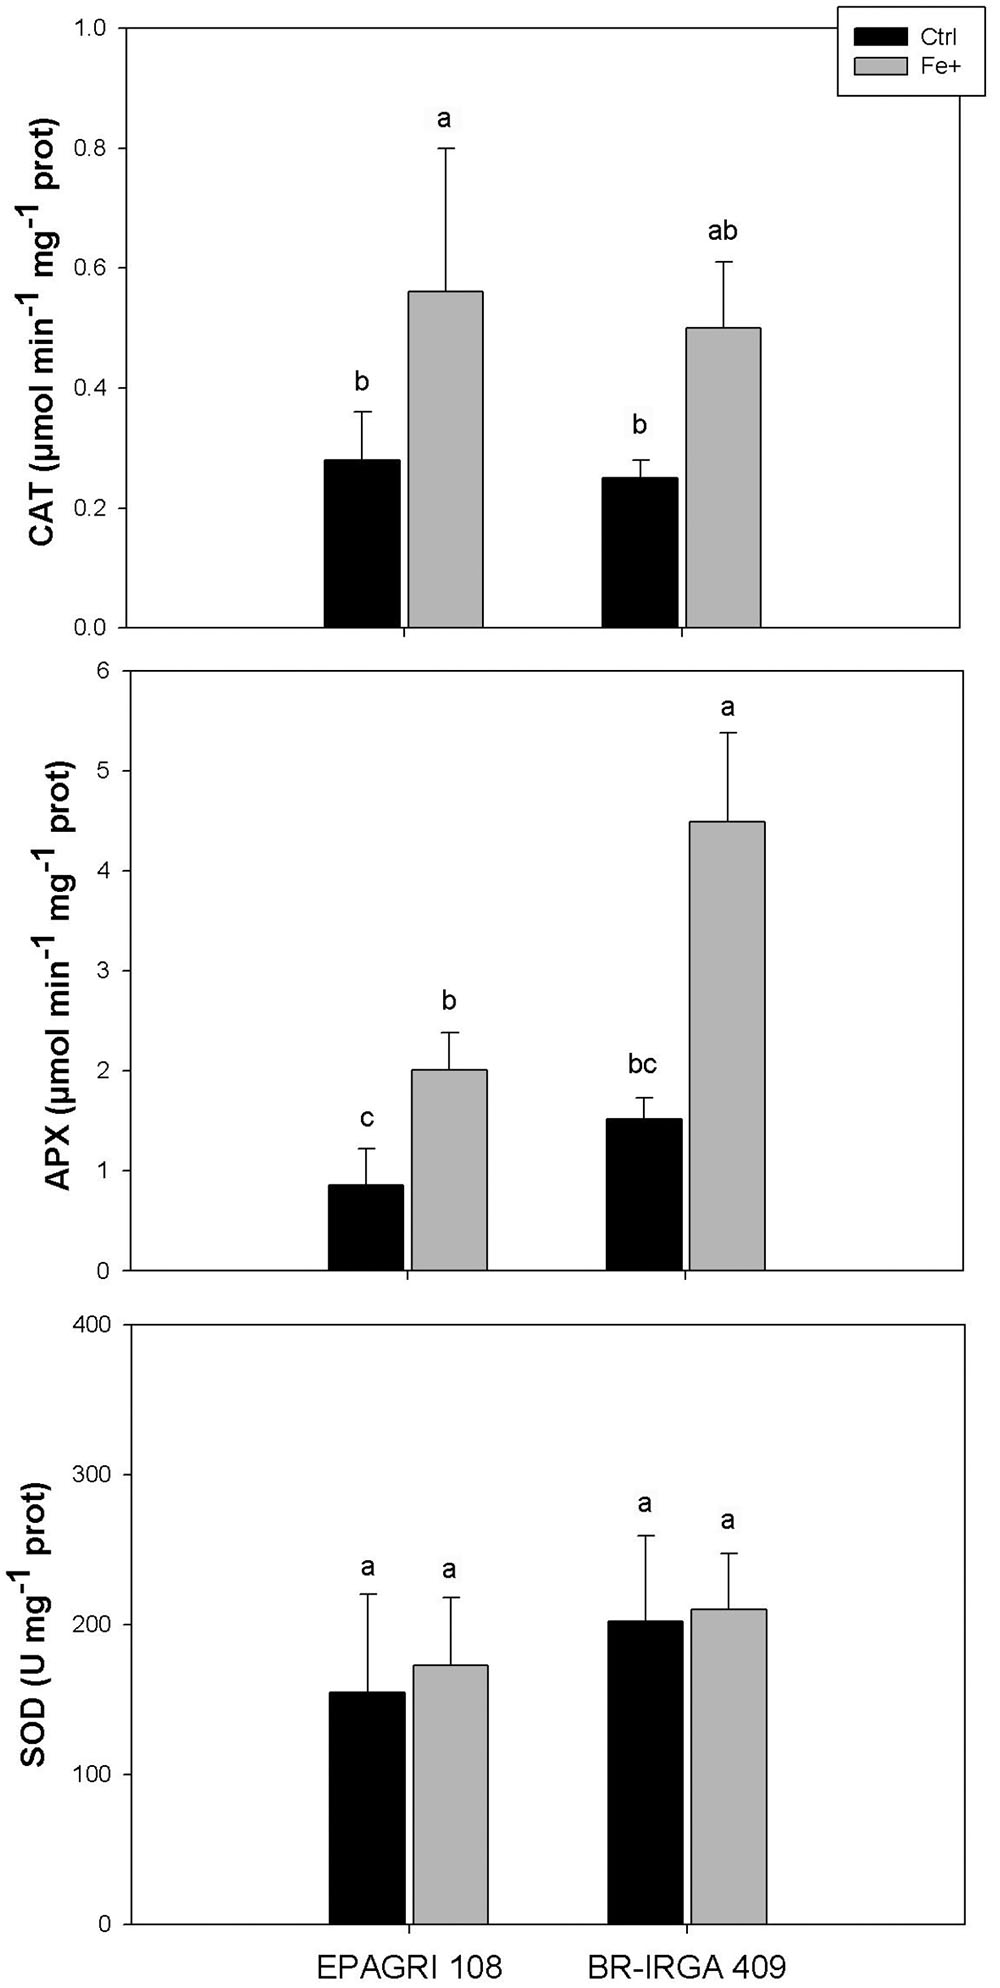
Figure 5. Activity of antioxidant enzymes (CAT, APX, and SOD) in fully expanded leaves from EPAGRI 108 and BR-IRGA 409 rice plants after 9 days exposure to control (Ctrl) or excess (Fe+) iron treatments. Each value represents the mean of six replicates ± SE. Distinct letters above the bars indicate significant difference between means (Duncan test, P ≤ 0.05).
The Gene Expression Profiles of Plants Exposed to Excess Fe Are Highly Divergent
To evaluate the impact of high levels of Fe on root gene expression profiles of the two rice cultivars, we used the Rice Gene Chip genome array (Affymetrix). Plants from EPAGRI 108 and BR-IRGA 409 cultivars were treated with excess Fe for 3 days. We chose this particular time point based on the photosynthetic activity data, which clearly indicated a slow but consistent increase in the photosynthetic capacity of EPAGRI 108 plants in day three after an initial drop upon exposure to excess Fe on days one and two (Figure 2), indicating that this could be the time point when tolerance-related traits started to be expressed. Exposure to excess Fe distinctly affected gene expression in the two cultivars: there were 423 up-regulated and 92 down-regulated genes in the susceptible cultivar BR-IRGA 409, while 43 up-regulated and 310 down-regulated genes were found in the tolerant cultivar EPAGRI 108 (Figure 6 and Supplementary Tables S1–S4). Strikingly, we found that there was no overlap between the responses in the two cultivars: 232 genes up-regulated in the susceptible cultivar were also down regulated in the tolerant one, while 29 down regulated in the susceptible were up regulated in the tolerant one. There were 191 and 15 exclusively up-regulated in the susceptible and tolerant cultivars, respectively; and 64 and 78 down regulated in the susceptible and tolerant cultivars, respectively (Figure 6). These results were confirmed by RT-qPCR analyses of 13 selected genes (Figures 7A–M). The microarray data was confirmed in most cases, with the exception of some genes that are regulated in opposite directions in the two cultivars, which did not show the expected down-regulation. This might be due to the fact that some genes shown as down-regulated in the microarray already have low expression under control conditions. Altogether, these results indicate that these cultivars respond very differently to excess Fe, and confirm the quality of our dataset.
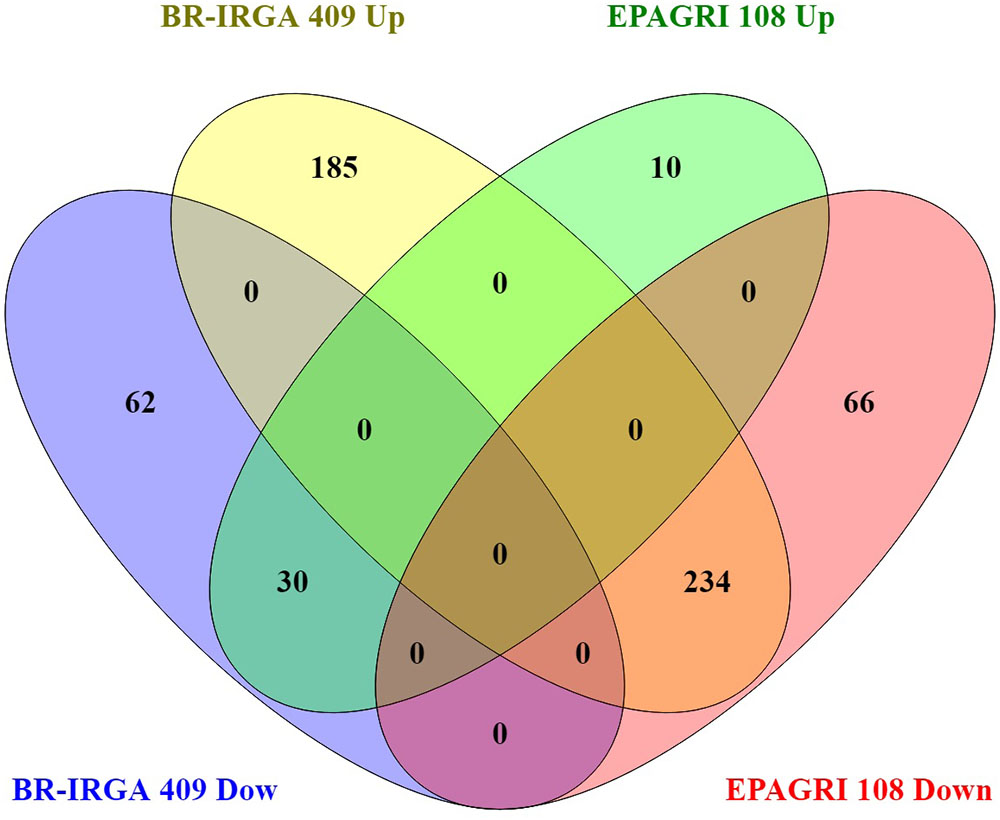
Figure 6. Venn diagram showing overlap between BR-IRGA 409 up-regulated genes, BR-IRGA 409 down-regulated genes, EPAGRI 108 up-regulated genes, and EPAGRI 108 down-regulated genes.
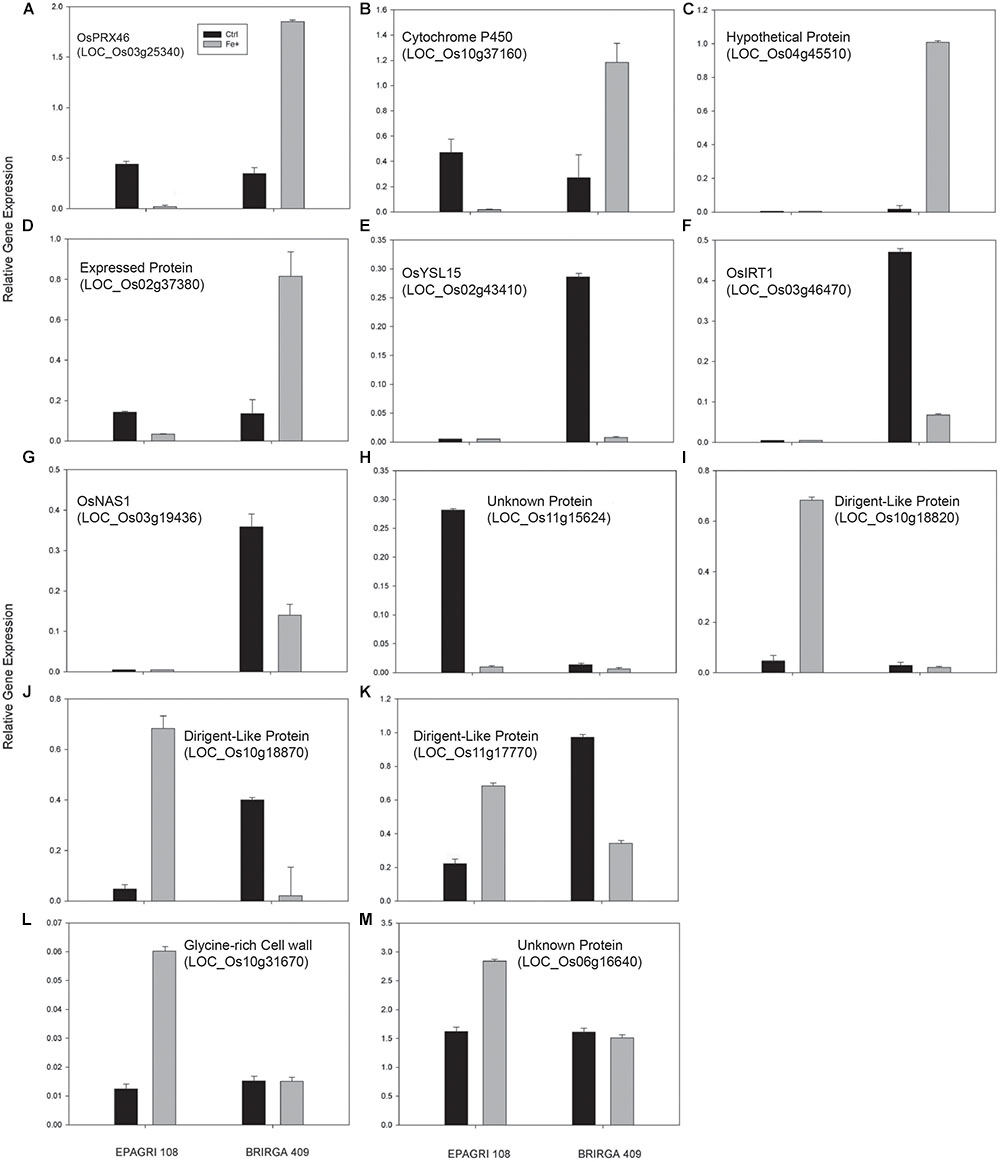
Figure 7. Validation of the microarray analysis by real-time PCR. Relative expression levels by RT-qPCR of selected genes were evaluated in roots of rice plants exposed for 3 days to control or excess iron treatments. (A) OsPRX46; (B) Cytochrome P450; (C) Hypothetical protein; (D) Expressed protein; (E) OsYSL15; (F) OsIRT1; (G) OsNAS1; (H) Unknown protein; (I) Dirigent-Like Protein; (J) Dirigent-Like Protein; (K) Dirigent-Like Protein; (L) GLycine-rich Cell wall protein; (M) Unknown protein. All Locus ID numbers are shown.Primers corresponding to all tested genes are listed in Supplementary Table S5. Values represent the mean ± SE of three biological replicates (n = 3).
We conducted a Gene Ontology (GO) term enrichment analysis to have an overview of the cultivar-specific response to excess Fe (Figure 8). Data clearly showed that the two cultivars have very different enriched categories, and many of them are found in opposite regulation (i.e., up regulated in one cultivar, down regulated in the other). We found that “Ion Transport,” “Metal Transport,” and “Cation Transport” categories were enriched in the susceptible cultivar up regulated gene set, but not in the tolerant one. We also found many categories related to cell wall enriched in both cultivars. Interestingly, the tolerant cultivar has up regulated categories such as “Cell Wall,” “Apoplast,” “Extracellular Region,” which were all down regulated in the susceptible one. Moreover, the tolerant cultivar did not have categories associated with ion or metal transport up or down regulated (Figure 8).
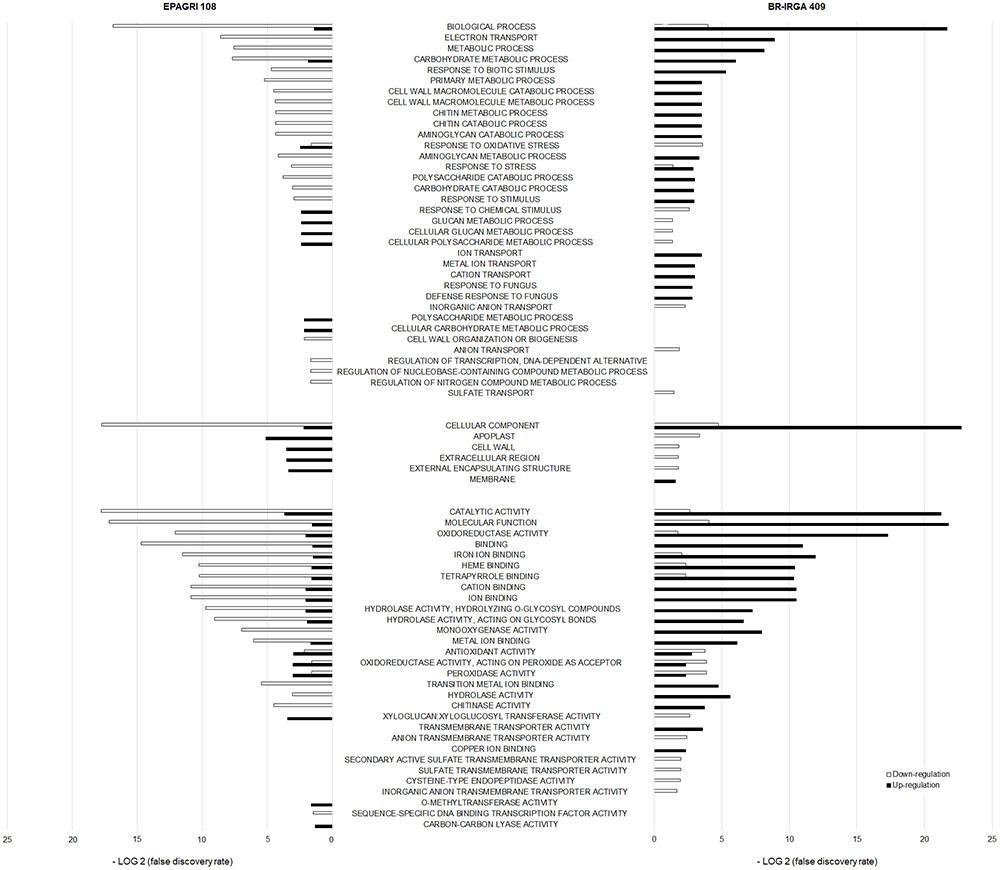
Figure 8. Comparison of Gene Ontology terms enrichment between the two cultivars up- and down regulated genes. Term enrichment is shown as a function of the False Discovery Rate observed. Terms enriched in up- or down-regulated gene sets of either BR-IRGA 409 or EPAGRI 108 are highlighted.
In order to have a more in-depth, gene-by-gene view of the different responses of each cultivar, we analyzed the 15 top regulated genes up- and down-regulated (Table 3). We found among the top up-regulated genes in BR-IRGA 409 a vacuolar Fe transporter, OsVIT2, that is responsive to excess Fe (Zhang et al., 2012); an uncharacterized VIT-Like (VTL) transporter (69-fold), similar to the VTL proteins known to mediate Fe transport into vacuoles in Arabidopsis (Gollhofer et al., 2014); OsASR3 (abscisic stress ripening protein; 25-fold), which was already been shown to be responsive to drought stress (Joo et al., 2013), and aluminum toxicity (Arenhart et al., 2013); and one abscisic acid responsive protein (18-fold). Moreover, the well-known Fe-excess responsive Ferritin genes OsFER1 and OsFER2 (Stein et al., 2009b; Ricachenevsky et al., 2010) were also up-regulated in BR-IRGA 409 (3.8- and 4.3 fold, respectively; Supplementary Table S1), indicating that these plants are responding as expected to high Fe concentrations.
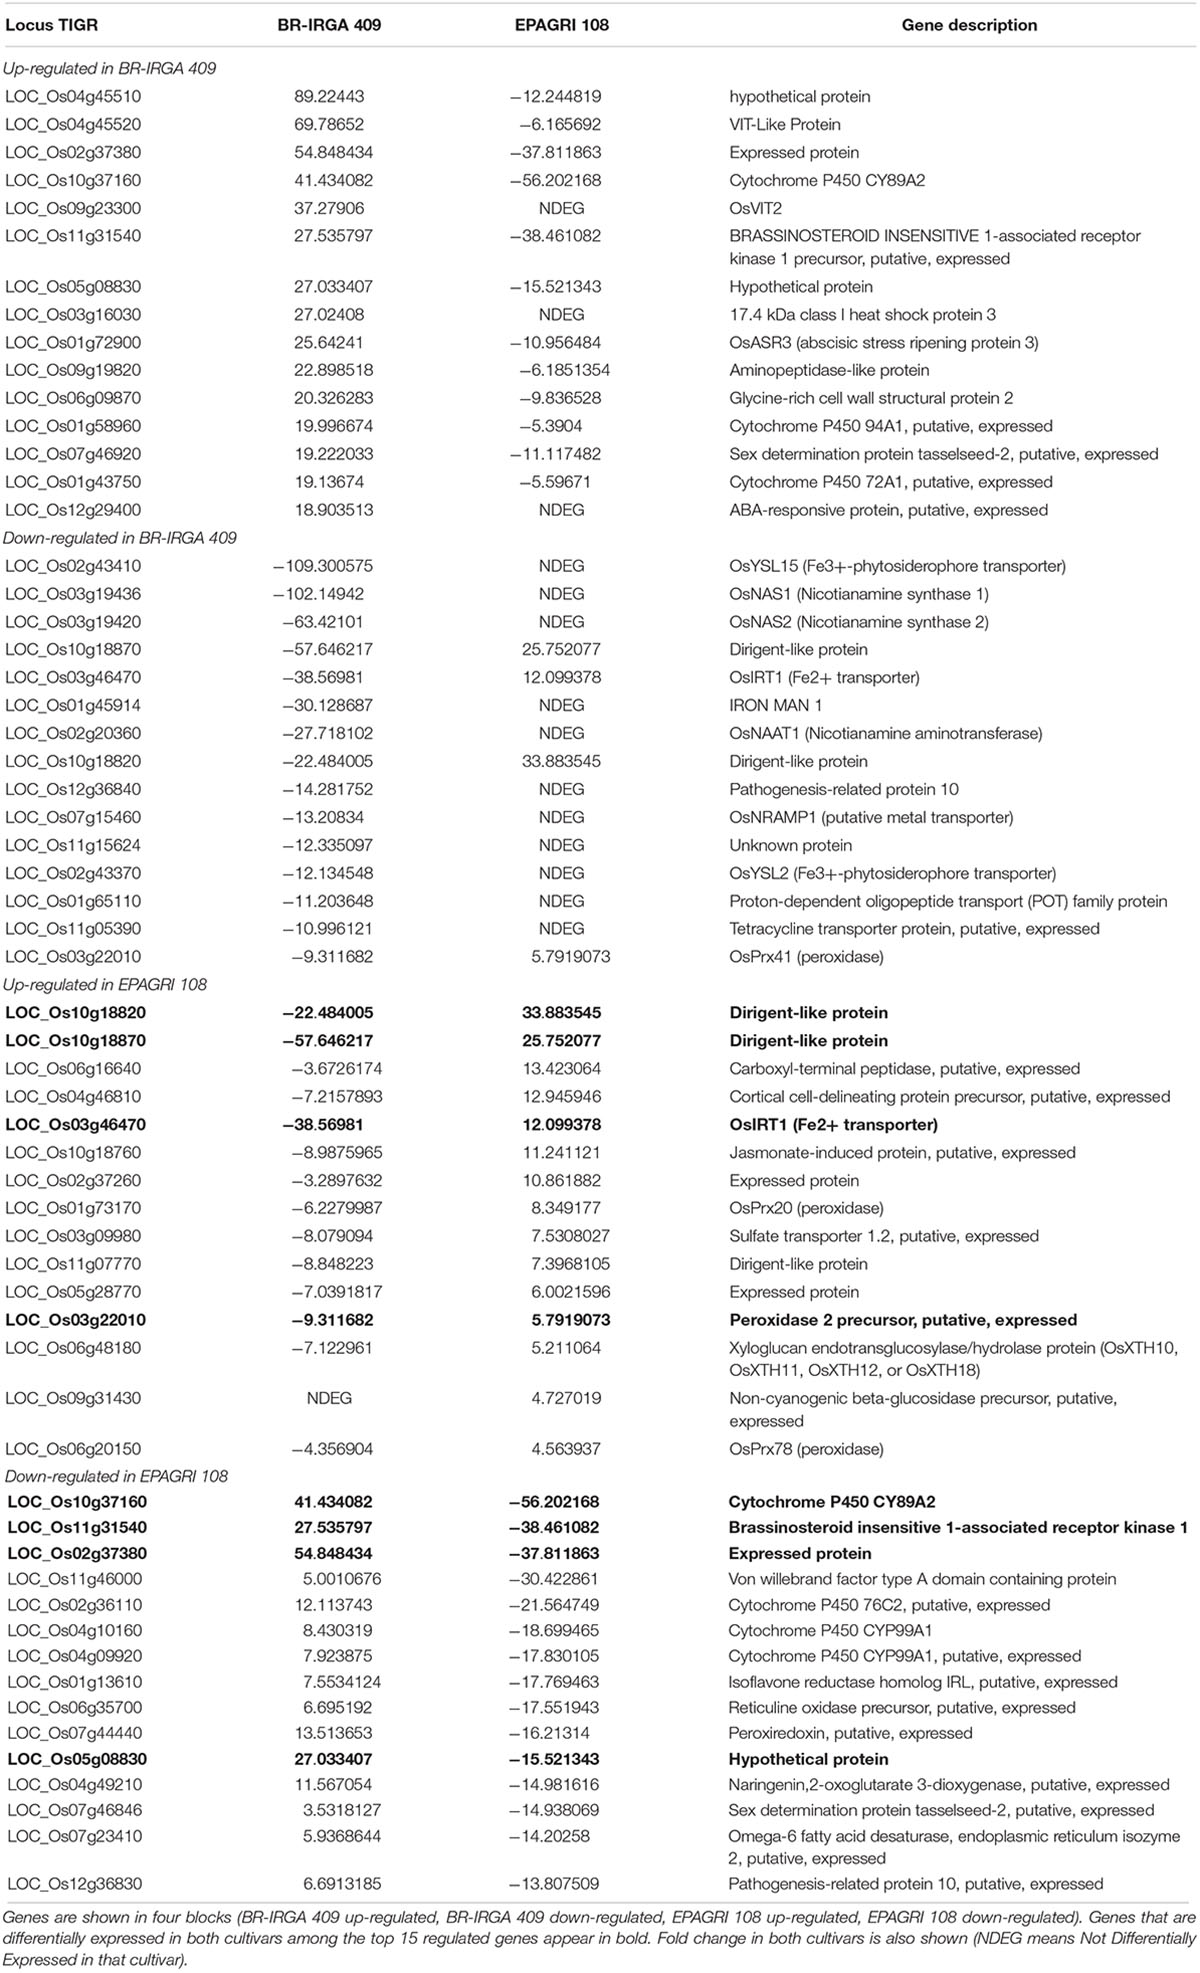
Table 3. Top 15 up- and down regulated genes in each cultivar. Genes are shown in four blocks (BR-IRGA 409 up-regulated, BR-IRGA 409 down-regulated, EPAGRI 108 up-regulated, EPAGRI 108 down-regulated).
Conversely, we found several genes related to Fe deficiency responses down-regulated in the susceptible cultivar when exposed to excess Fe (Table 3 and Supplementary Table S2). Among the top 15 down-regulated genes in BR-IRGA 409, eight genes are well-described as being up-regulated under Fe deficiency (Zheng et al., 2009; Grillet et al., 2018), including the Fe(III)-Deoxymugineic acid (DMA) transporter OsYSL15 (-109-fold) and the Fe(II)-Nicotianamine (NA) transporter OsYSL2 (-12-fold); the Fe2+ transporters OsIRT1 (-38-fold), and OsNRAMP1 (-13-fold); the DMA biosynthesis-related genes OsNAS1 (-102-fold), OsNAS2 (-63-fold), and OsNAAT1 (-27-fold); and the regulatory peptide OsIMA1 (IRON MAN 1; Grillet et al., 2018). Other genes that are commonly associated with the Fe deficiency regulon were also down regulated, but not among the top 15 genes, such as OsZIFL4/TOM1 (-6.2-fold; Nozoye et al., 2011; Ricachenevsky et al., 2011), OsYSL16 (-3.6-fold; Kakei et al., 2012), and OsMIR (-3.2-fold; Ishimaru et al., 2009). Thus, these results show that BR-IRGA 409 plants are down-regulating Fe acquisition-related genes.
In contrast, the tolerant cultivar EPAGRI 108 showed three dirigent (DIR)-like proteins among the top 15 up-regulated genes (7-, 25-, and 33- fold; Table 3 and Supplementary Table S3), which are related to lignin and lignin biosynthesis (Paniagua et al., 2017); two cell-wall modifying enzymes (Xyloglucan endotransglucosylase/hydrolase protein, 5/2-fold; a beta-glucosidase, 4.7-fold); and three peroxidases (8.4-, 5.7-, and 4.5-fold), which were already linked to metal stress (Kidwai et al., 2019). Interestingly, we found OsIRT1 up-regulated in this cultivar (12-fold), which is the opposite regulation found in the susceptible cultivar BR-IRGA 409. However, the absolute expression levels were extremely low, as shown in RT-qPCR data (Figure 7), and might not be physiologically relevant.
Among the top 15 genes down-regulated in EPAGRI 108 cultivar, the three most strongly down-regulated genes are also among the top 15 up-regulated genes in BR-IRGA 409, again demonstrating a clear opposite transcriptional regulation in these two cultivars upon excess Fe. Several Cytochrome P450 genes were also down-regulated (Table 3).
Roots of the Tolerant Cultivar Show Increased Lignin Deposition Upon Excess Fe Treatment Compared to the Susceptible One
Based on the microarray data, we hypothesized that the tolerant cultivar might show tolerance to Fe toxicity because of cell wall modifications. Since DIR proteins are involved in lignin biosynthesis, we analyzed lignin deposition in roots of both cultivars under control and excess Fe conditions. We found almost no change in lignin deposition pattern in the susceptible cultivar BR-IRGA 409 when comparing root sections of plants under control (Figure 9A) and excess Fe (Figure 9B) treatments. However, root sections of plants from the tolerant cultivar EPAGRI 108 cultivated under control (Figure 9C) and excess Fe (Figure 9D) presented markedly distinct lignin localization.
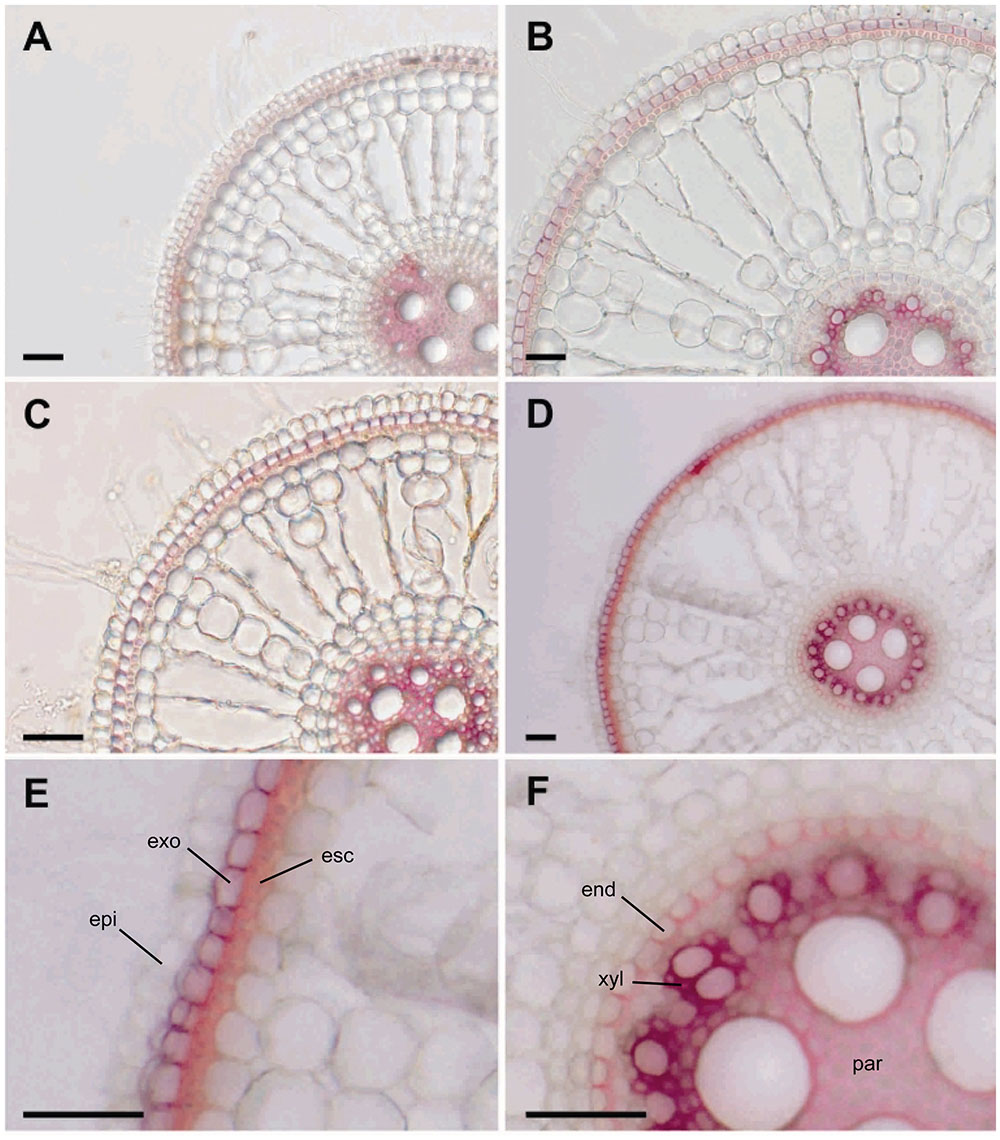
Figure 9. Root lignification under iron excess. Cross-sections of root sectors from BR-IRGA 409 (A,B) and EPAGRI 108 (C,D) plants maintained for 15 days under control (A,C) or iron excess (B,D) treatments, showing the extent of lignification (cell walls stained in red) indicated by the Wiesner reaction (acidified phloroglucinol solution). Magnifications from figure D show more intense cell wall lignification of exodermis (exo) and esclerenchyma (esc), in the outer layers of the cortex (E), and lignin deposition in endodermis (end), xylem parenchyma (xyl), and pith parenchyma (par) cell walls (F). Scale bars = 100 μm.
Lignin deposition in roots of the tolerant cultivar increased both in the outer layers of the cortex (exodermis and sclerenchyma ring, Figure 9E), in u-shaped secondary cell wall deposits of the tertiary endodermis around the vascular cylinder, in the primary xylem parenchyma cells (intense red staining), and in the pith parenchyma cells (Figure 9F). These results indicate that altered lignin deposition might be involved in the tolerance mechanism found in EPAGRI 108.
Lignin Concentrations in Roots of Susceptible and Tolerant Genotypes
Based on the clear change in lignin deposition, we decided to analyze the lignin concentration in other rice cultivars that might contrast in their Fe tolerance. In order to access Fe tolerance/susceptibility, we used maximum photochemical efficiency (FV/FM) values. Our susceptible and tolerant reference cultivars showed markedly different responses to excess Fe: BR-IRGA 409 showed a clear decrease in FV/FM value upon excess Fe exposure, whereas EPAGRI 108 showed no difference compared to control plants (Figure 10A). Lignin quantification showed that the susceptible cultivar has a decreased in lignin concentration, while the tolerant one showed a slight increase (Figure 10B). A set of eight genotypes were also evaluated, and cultivars that showed decreased FV/FM values when treated with excessive Fe were considered susceptible, whereas those showing no change (or slight increase in one case) were considered tolerant (Figure 10A). Clearly, tolerant cultivars showed increased lignin concentration in roots when plants were treated with excess Fe (Figure 10B). Conversely, susceptible cultivars showed decreased lignin (Figure 10B). Data from all ten cultivars were plotted comparing the % of variation in FV/FM values and lignin concentration when exposed to excess Fe compared to the same cultivar under control conditions. Tolerant and susceptible genotypes grouped separately (Figure 10C), indicating that changes in total lignin concentrations are involved in tolerance to excess Fe.
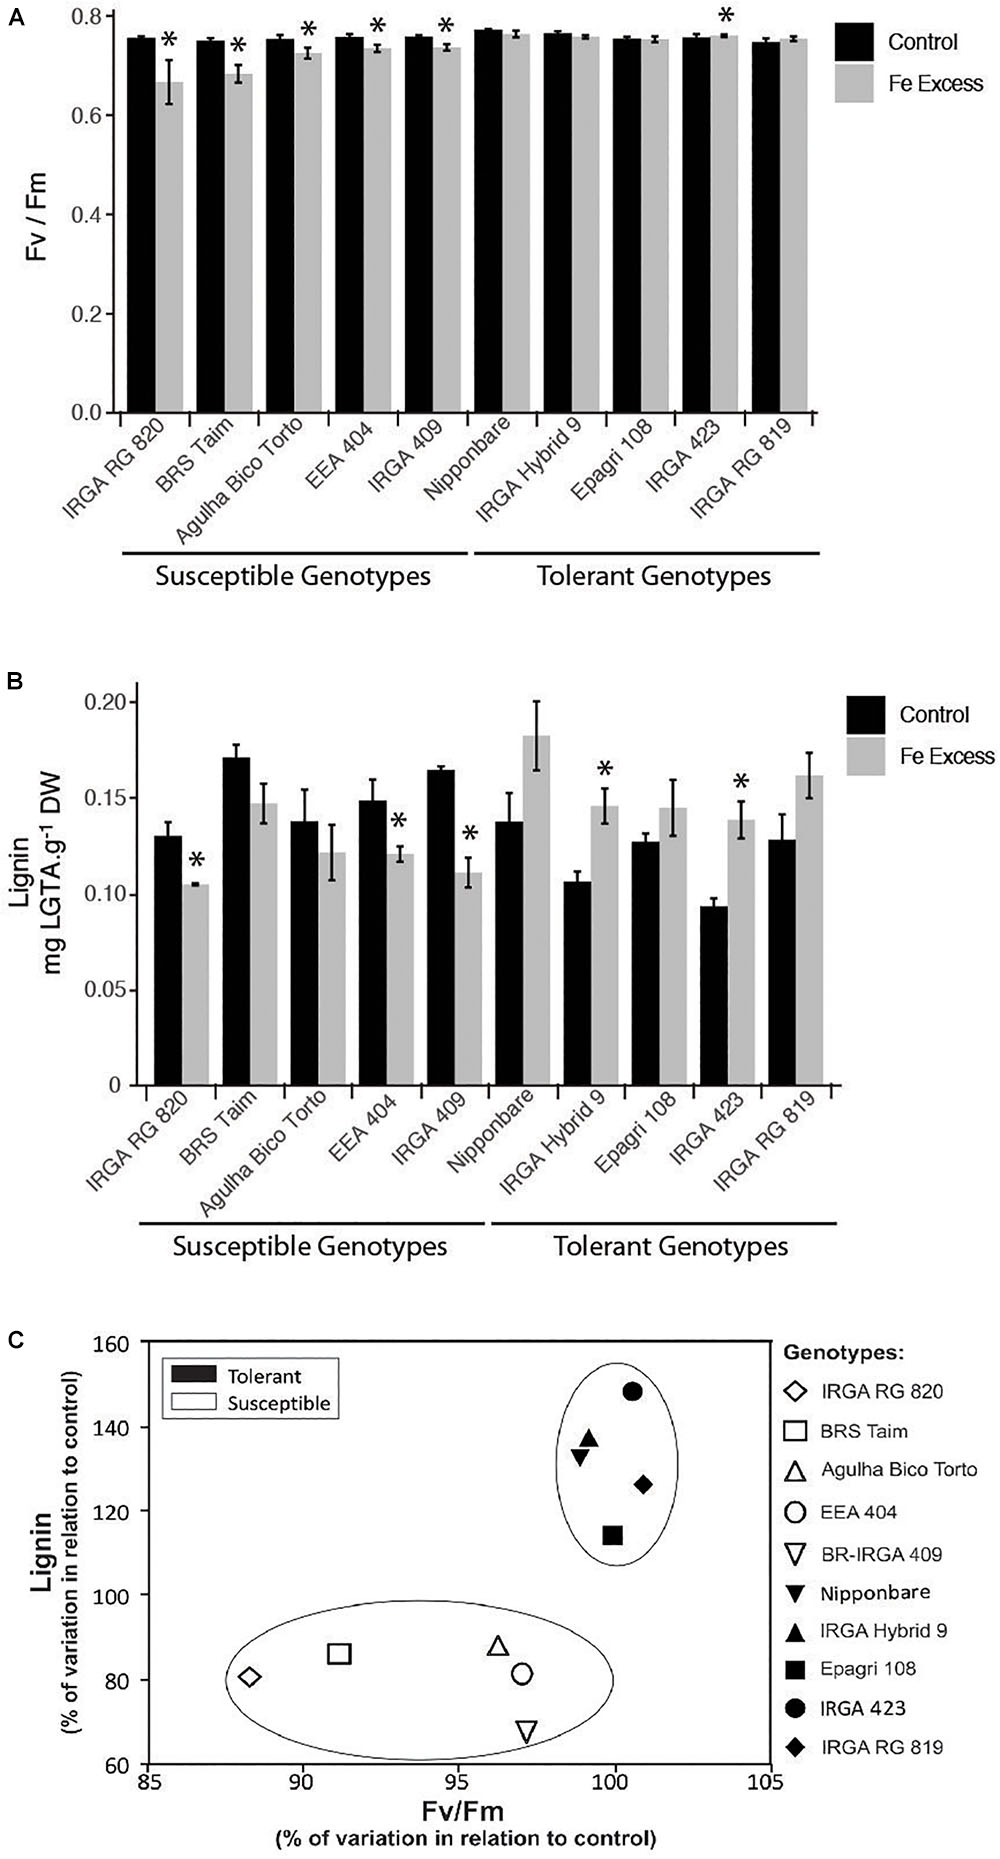
Figure 10. Effects of iron excess in plants from ten rice genotypes exposed to 500 mg L-1 FeSO4 (Fe+) or 6.5 mg L-1 FeSO4 (Ctrl) for 15 days: maximum photochemical efficiency (FV/FM) from leaves (A); lignin concentration from roots (B); and genotype distribution plot (C), based on % variations observed in iron excess treated plants in relation to control plants (% variation in leaf FV/FM values against % variation in root lignin concentrations). In A and B, the asterisks indicate means that are significantly different from control by the Student’s t-test (P ≤ 0.05). Experiments were performed using n = 8 to 9 plants per genotype.
Discussion
Contrasting Physiological Impacts of Excess Fe on the Two Rice Cultivars
Excess Fe led to decreased biomass accumulation (in shoots and roots), loss of chlorophyll and decreased photosynthetic activity in the susceptible BR-IRGA 409 cultivar (Figures 1–3). The tolerant cultivar, however, showed no change in biomass or chlorophyll, and slight decrease in photosynthetic parameters, which were mostly recovered during the course of the 9-day excess Fe treatment (Figures 2, 3). Previous work with the same rice cultivars showed that exposure to excess Fe did not indirectly induce deficiency of other nutrients, indicating a direct effect of excess Fe, a result that was later confirmed by field experiments (Silveira et al., 2007; Stein et al., 2009a). The toxic effects were directly related to accumulation of higher levels of Fe in shoots and roots of BR-IRGA 409 plants. Consistently, Olaleye et al. (2001) reported that high concentrations of Fe resulted in decreased plant weight and grain yield, and the growth retardation observed was not attributed to deficiencies of other nutrients, but to physiological problems directly originating from excessive Fe accumulation. Thus, our data confirmed the tolerant and the susceptible traits of these cultivars, validating the experimental approach used in this work.
In this study, photosynthetic activity decreased in plants from both cultivars after the initial period of exposure to excess Fe. However, the tolerant cultivar (EPAGRI 108) was able to fully recover its photosynthetic capacity after 6 days, a reasonable lag period for the induction of its tolerance mechanisms. For this reason, our transcriptomic analyses were performed at 3 days of exposure to excess Fe. Using A/Ci and light response curves, we could identify the impact of excess Fe on carbon fixation, affecting the maximum carboxylation rate (Vcmax), electron transport rate (Jmax), and maximum apparent quantum yield (ϕm) in the susceptible cultivar, but not in the tolerant one (Table 2). The reduction in Vcmax may result from the reduced rate of electron transport, limiting the amount of available energy for Calvin cycle enzymes. The reduction in chlorophyll concentration associated to lower electron transport rates may indicate a direct effect of excess Fe on the photosynthetic electron transport chain components (either LHCII or Cytb6/f). The toxic effects of Fe in photosynthesis were also observed in Nicotiana plumbaginifolia cuttings accompanied by photoinhibition, increased reduction of PSII and higher thylakoid energization (Kampfenkel et al., 1995). Excessive amounts of Fe in thylakoid membranes in the form of cytochrome b6/f complex showed correlation with photodamage to PSII, derived from excessive production of singlet oxygen in pea plants (Suh et al., 2002).
Data from independent studies showed that BR-IRGA 409 increases photorespiration under excess Fe (Pereira et al., 2013), and together with electron transport rate and carboxylation efficiency were proposed as good parameters to access rice Fe tolerance (Müller et al., 2017). Our tolerant cultivar showed no change in Vcmax, Jmax (Table 2), and Fv/Fm (Figure 9), in contrast with the susceptible one, which corroborate the use of photosynthetic parameters for easy, non-destructive access to Fe tolerance in rice genotypes (Pereira et al., 2013; Müller et al., 2017).
Mechanisms of Fe Tolerance in the Two Rice Cultivars
Tolerance to Fe toxicity in rice can have three general possible sources of tolerance: Fe exclusion (i.e., avoiding Fe entering plant tissues); Fe uptake and further compartmentalization (i.e., in Fe storage proteins such as Ferritins, or in vacuoles); and Fe uptake associated with increased tolerance to the consequent reactive oxygen species using anti-oxidants (Wu et al., 2014). Of course, one given genotype can combine two or more tolerance mechanisms. Here both cultivars showed comparable concentrations of Fe in shoots and roots under control conditions, whereas exposure to excess Fe induced Fe accumulation in roots and shoots of both cultivars (Table 1). The susceptible cultivar, however, showed higher levels of Fe compared to the tolerant one on both organs, suggesting that the tolerant genotype is able to exclude Fe. Exclusion by roots can be achieved by increased oxidation capacity, resulting in higher Fe2+ oxidation to Fe3+, Fe precipitation and Fe plaque formation, limiting the absorption of Fe by the root system (Wu et al., 2014). After 9 days of excess Fe treatment, both cultivars showed increased Fe concentrations in the Fe plaque (Table 1). However, the susceptible cultivar (BR-IRGA 409) showed significantly higher levels of Fe in the Fe plaque than the tolerant cultivar (Table 1). These data suggest that the tolerant cultivar does not have increased oxidation power in roots, which would lead to higher levels of Fe in the apoplast. In fact, EPAGRI 108 decreased levels of Fe in the Fe plaque might be due to increased lignification, which would decrease root oxygen loss and therefore reduce root oxidation power. Thus, these data indicate that EPAGRI 108 tolerance is based at least partially on a distinct mechanism.
The increased Fe concentration in shoots of plants from the tolerant cultivar treated with excess Fe accumulation was significant, but with little effect on the plant phenotype compared to the susceptible one (Figure 1). Thus, it is likely that EPAGRI 108 also has Fe shoot – based tolerance as well. This is consistent with the observation that the susceptible cultivar has increased markers for ROS stress, while the tolerant one showed no difference compared to controls (Figure 4). Enzymatic detoxification of ROS could be involved in Fe toxicity responses (Fang et al., 2001; Majerus et al., 2007). APX activity, which could be part of a ROS tolerance, shoot-based mechanism as previously proposed (Wu et al., 2017), is induced only in the susceptible cultivar (Figure 5B), but not in the tolerant. Catalase activity was shown to be slightly higher in the tolerant cultivar (Figure 5A). Previous analyses of Fe tolerant and susceptible rice cultivars associated lower dehydroascorbate reductase, higher ascorbate oxidase activity and high rates of ascorbate reduction to tolerance (Wu et al., 2017), which were not tested in our experiments. Thus, EPAGRI 108 should be further investigated to identify the nature of its shoot-based tolerance mechanism.
Fe Homeostasis-Related Genes Are Strongly Regulated in the Susceptible Cultivar
Our data clearly shows that the susceptible BR-IRGA 409 cultivar is responding as expected to Fe toxicity (Table 3 and Supplementary Tables S1–S5). Genes such as OsVIT2, OsFER1, and OsFER2 are up-regulated indicating that plants are compartmentalizing excessive Fe into vacuoles and ferritin holoproteins (Stein et al., 2009b; Zhang et al., 2012). Another interesting finding is that a putative, uncharacterized VTL transporter was one of the highly expressed genes under excess Fe. VTL were shown to transport Fe into the vacuoles in Arabidopsis (Gollhofer et al., 2014), indicating that the rice homolog might be important for Fe detoxification in vacuoles. Moreover, we found two ASR genes, OsASR1 and OsASR3, up-regulated in this cultivar. Both genes are up regulated by aluminum (Al) stress, and OsASR1 is involved in regulating the Al stress response in rice, acting as a transcription factor (Arenhart et al., 2013). Fe and Al stresses are common in acidic soils, and thus ASR proteins might be involved to some extent in Fe toxicity gene regulation as well. Alternatively, Fe and Al stress responses in roots might be convergent, since both result in changes in root length due to decreased elongation. This, however, remains to be tested.
As already described in other studies, the Fe deficiency responsive genes were down regulated under excess Fe, but exclusively in the susceptible cultivar. Fe uptake transporters OsYSL15, OsIRT1, and OsNRAMP1; nicotianamine and phytosiderophore synthesis enzymes (NAS and NAAT); and phytosiderophore secretion transporter OsZIFL4/TOM1 were among them (Table 3 and Supplementary Table S2). These indicate that plants from the susceptible cultivar are attempting to avoid Fe uptake under excess Fe, and is in agreement with previous observations (Quinet et al., 2012; Bashir et al., 2014). An Fe and Cu transporter, OsYSL16, was also found as down-regulated (Supplementary Table S2). OsYSL16 was shown to be important for Fe distribution in rice plants, and its activation-tagging (which results in higher steady-state expression levels) results in increased Fe efficiency (Kakei et al., 2012; Lee et al., 2012). Thus, OsYSL16 decreased expression under excess Fe might be also contributing to avoid Fe accumulation.
Interestingly, we also found the recently described OsIMA1 (LOC_Os01g45914; IRON MAN 1), a small peptide that was clearly involved in regulating the Fe deficiency response in Arabidopsis (Grillet et al., 2018). Microarray data already demonstrated that OsIMA1 was up regulated by Fe deficiency (Zheng et al., 2009) and heterologous expression in Arabidopsis showed it is able to regulate Fe deficiency responses (Grillet et al., 2018). However, OsIMA1 physiological role is not established yet. Our data shows that it may be also important to regulate rice responses to Fe toxicity, likely by down regulating the Fe uptake machinery. In agreement with that, OsMIR, an orphan rice small protein that is also involved in Fe deficiency responses (Ishimaru et al., 2009), was also down regulated in BR-IRGA 409, again indicating the importance of such small regulatory peptides in regulating Fe concentration in plants.
However, it is puzzling that we haven’t found any commonly regulated genes in the tolerant cultivar compared to the susceptible one. We considered that 3 days of Fe excess treatment would be a good time point to identify contrasting differences in the two cultivars, based on physiological data. However, we should consider that sampling at later time points, when Fe would build up to higher levels in the tolerant cultivar, could show us similar genes regulated in EPAGRI 108 as observed in the susceptible BR-IRGA 409 after 3 days treatment with Fe excess. A time course transcriptional experiment could reveal the dynamics of this regulation, and how tolerant and susceptible cultivars may differ in the timing at which some genes are up and down regulated. Thus, our non-overlapping expression patterns would likely not be maintained throughout Fe excess responses for more than 3 days.
Root Lignification Might Be Involved in Tolerance to Excess Fe
As inferred from the distinct Fe accumulation and distribution in the plant body between the two studied cultivars, the capacity to accumulate lower levels of Fe greatly contributes to the tolerance character of EPAGRI 108 plants. Based on the gene expression pattern and on the root anatomical analysis described in this work, root cell wall lignification and remodeling could play an important role in providing such a capacity to EPAGRI 108 plants. The tolerant cultivar showed only 42 genes up-regulated by excess Fe after 3 days of exposure. Among these, we found four peroxidases, one laccase and three dirigent proteins, most of them among the top up-regulated genes (Table 3 and Supplementary Table S3) indicating that the dirigent-guided lignin deposition might be up-regulated in the roots of the tolerant cultivar under excess Fe. The synthesis of coniferyl alcohols by peroxidases and laccases is known to lack region and stereoselectivity (Paniagua et al., 2017). Dirigent proteins stipulate, at regional and stereochemical levels, the outcome from the coupling of two molecules of E-coniferyl alcohol to produce the lignan (+)-pinoresinol (Davin et al., 1997). One characterized dirigent protein was shown to require the provision of one-electron oxidation through an auxiliary source, such as laccases, peroxidases and monooxygenases for its activity, and to be expressed mainly in lignifying tissues (Burlat et al., 2001). Two enzymes involved in lignin biosynthesis, Caffeoyl-CoA O-methyltransferase and O-methyltransferase ZRP4 (Raes et al., 2003; Boerjan et al., 2003), were also up-regulated in EPAGRI 108 (Supplementary Table S3). These results indicated that lignin deposition might be involved in Fe tolerance observed in EPAGRI 108.
Our data further corroborated this hypothesis showing that other Fe tolerant cultivars induce lignin deposition in roots, whereas Fe susceptible cultivars decrease total lignin (Figure 10). A recent work showed that heterologous expression in Arabidopsis of OsPRX38, a rice Class III peroxidase, leads to higher tolerance to arsenic (Kidwai et al., 2019). Interestingly, expression of OsPRX38 caused increased expression lignin biosynthesis genes such as Caffeoyl-CoA O-methyltransferase, which results in root lignification, providing an apoplastic barrier for arsenic diffusion and therefore less arsenic uptake by Arabidopsis plants (Kidwai et al., 2019). Similarly, expression of Arabidopsis AtHMA4 (a membrane-localized Zn/Cd efflux transporter) in tobacco resulted in decreased Cd concentration in roots and shoots. Lignin biosynthesis genes were up-regulated when these plants were exposed to Cd, with consequent increased lignification, which blocked apoplastic diffusion of Cd (Siemianowski et al., 2014). Cu excess or Mn excess were also shown to induce lignification in Arabidopsis and rice, respectively (Lequeux et al., 2010; Dziwornu et al., 2018). Our data shows for the first time that lignin biosynthesis is linked to excess Fe responses and to Fe tolerance.
Lignin deposition increased both in the exodermis and in the endodermis, possibly limiting Fe uptake into the root and Fe translocation to the shoot, respectively. The exodermis and the endodermis are the outer- and innermost cortical layers of a root, and serve as filtration sites for the passive movement of ions between the soil solution and the stele (Ma and Peterson, 2003). These are the root tissue layers where rice deposits Casparian strips, which act as apoplastic diffusional barriers (Cai et al., 2011). Interestingly, work in Arabidopsis showed that Casparian strips are entirely made of a lignin polymer without suberin, contrary to what was previously accepted (Naseer et al., 2012). The Casparian strip works as a barrier for nutrient diffusion both into and out of the stele, which can have consequences for root to shoot translocation of minerals (Doblas et al., 2017; Ricachenevsky et al., 2018). The transcriptional control and further steps for its formation are being dissected in detail. Among these, a dirigent protein named ENHANCED SUBERIN 1 (ESB1)/AtDIR10 was shown as essential for Casparian strip integrity in Arabidopsis (Hosmani et al., 2013). However, rice orthologous proteins to the ones involved in Casparian strip synthesis and maintenance are not among the differentially expressed genes in our datasets. Therefore, lignin deposition in response to excess Fe in the tolerant cultivar is performed by a different set of genes, likely reinforcing the Casparian strip barrier or adding other layers of lignification in similar tissues to avoid Fe diffusion into the roots. Based on our data (Figure 10) this new mechanism might be common to other rice cultivars, indicating a new avenue for rice Fe tolerance breeding and engineering.
In EPAGRI 108 roots under iron excess, the additional lignification of cell walls of the xylem parenchyma cells, which surround the tracheal metaxylem elements, may represent an extra barrier against iron translocation. Parenchyma xylem cells are the final water transport route before the tracheal cell entrance, after passage through the epidermis and cortical layers (including exoderm and endoderm). Therefore, an increase in lignification in the parenchyma of the xylem can function as a final “line of defense” against Fe transport (another apoplastic barrier). In the roots of Brachiaria decumbens, all xylem cells (i.e., including xylem parenchyma cells) are thickened with an evident deposition of lignin on the wall because of the increased concentration of heavy metals (Gomes et al., 2011).
Conclusion
Our results described two rice cultivars, one tolerant and one susceptible, to excess Fe. We provide datasets for gene expression of two contrasting rice cultivars regarding Fe toxicity tolerance under early Fe excess stress. We suggest that tolerance in the EPAGRI 108 cultivar, and likely in other rice germplasm, could be linked to increased cell wall lignification in the root cortex layers (endodermis and exodermis), as well as in the central cylinder (primary xylem and pith parenchyma cell), which would be a new mechanism for rice tolerance to high Fe concentrations. The data provided here could be important for further studying the responses of rice cultivars to Fe excess, and uncovering a possible Fe tolerance mechanism linked to cell wall remodeling.
Materials and Methods
Plant Material, Growth, and Treatments
Seeds from rice (Oryza sativa L. ssp. indica) genotypes used in this work were provided by the Rice Breeding Group from IRGA (Instituto Rio Grandense do Arroz, Brazil). BR-IRGA 409, IRGA RG 820, BRS Taim, Agulha Bico Torto, EEA 404, Nipponbare, IRGA Hybrid 9, EPAGRI 108, IRGA 423, and IRGA RG 819 are part of the germplasm bank of IRGA, and are commonly used for testing different traits in breeding programs of the Institute. The two genotypes used in most experiments are cultivated in southern Brazil and were previously characterized as tolerant (EPAGRI 108) and susceptible (BR-IRGA 409) to Fe toxicity (Silveira et al., 2007). Seeds were surface sterilized in 70% ethanol for 2 min, followed by 1.5% NaClO4 for 1 min, and then washed with abundant distilled water and germinated on moistened filter paper in Petri dishes. The seedlings were kept in the dark during the first 48 h, transferred to 16 h/8 h day/light regime (65 μmol m-2s-1 of photosynthetic active radiation) at 28°C for 2 days and then transferred to pots with vermiculite, watered with nutrient solution consisted of 1.42 mM NH4NO3; 0.4 mM NaH2PO4; 0.5 mM K2SO4; 1.7 mM CaCl2.2 H2O; 1.7 mM MgSO4.7H2O; 9.5 μM MnCl2.4 H2O; 0.07 μM (NH4)6Mo7O24.4H2O; 20 μM H3BO3; 0.16 μM ZnSO4.7H2O; 0.16 μM CuSO4.5H2O; 35.6 μM FeCl3.6H2O, and 0.07 mM citric acid (Yoshida et al., 1976). After 10 days, plants were transferred to hydroponic conditions, using the same nutrient solution, and after 10 more days plants were subjected to excess Fe (500 mg L-1 of iron) or control concentration (6.5 mg L-1), both using FeSO4 as the Fe source. To avoid possible effects of sulfur concentrations, Na2SO4 was added to the control solution to obtain equimolar sulfur concentration in both treatments. To maintain the concentration and keep Fe soluble, nutrient solutions were replaced every 72 h.
Dry Weight and Chlorophyll Determinations
After 9 days of treatment, plants were separated in shoots and roots, immediately frozen in liquid nitrogen and kept at –20°C until further analysis. Shoots and roots were dried at 60°C to constant weight for the determination of DW. Fully expanded leaves were ground in liquid nitrogen and chlorophyll extracted in acetone 85%. Total chlorophyll (chlorophyll a+ chlorophyll b) was quantified by measuring absorbance at 663 nm and 645 nm, and the concentrations calculated as in Stein et al. (2009a).
Gas Exchange Measurements
Gas exchange measurements were performed after 1, 2, 3, 6, and 9 days of exposure to the Fe treatments, using a portable photosynthesis system (LI-6400, LiCor Inc., Lincoln, NE, United States). All determinations of photosynthetic rate were performed using a reference CO2 concentration of 400 μL L-1, 1000 μmol m-2 s-1 photosynthetic photon flux (PPF) and leaf temperature of 22°C, using only the youngest fully expanded leaf. Light response curves were performed using a reference CO2 concentration of 400 μL L-1, leaf temperature of 22°C and a PPF range from 1500 to 0 μmol m-2s-1. CO2 response curves were performed using 1000 μmol m-2 s-1 PPF, leaf temperature of 22°C, with reference CO2 concentrations ranging from 800 to 50 μL L-1. All photosynthetic response curves were performed using only the youngest fully expanded leaf, after 6 days of exposure of plants to treatments (control and excess Fe), and the photosynthetic parameters were estimated according to the biochemical model described in Farquhar et al. (1980).
Fe Concentration in Shoots, Roots, and Fe Plaque
To determine the Fe concentration in the Fe plaque, root systems were washed in abundant distilled water and immediately incubated for 3 h in cold dithionite-citrate-bicarbonate solution (Taylor and Crowder, 1983) and the Fe concentration determined by atomic absorption spectrometry (Varian-Model Spectra 10/20, Victoria, VIC, Australia). After extraction of Fe plaque, root systems were washed in distilled water and dried at 60°C. Dry samples (shoots and roots) were ashed at 500°C for 3 h. Ashes were digested with concentrated HCl and Fe was quantified by atomic absorption spectrometry.
Oxidative Damage to Lipids, Proteins, and H2O2 Determination
Lipid peroxides were extracted in 80% ethanol from fully expanded leaves and lipid peroxidation determined by measuring the concentration of TBARS as described by Hodges et al. (1999). Oxidative damage to proteins was determined by the quantification of carbonyl groups, by derivatization with 2,4-dinitrophenyl-hydrazine. Fully expanded leaves were ground in cold extraction buffer [50 mM Tris (pH 8.0), 2 mM EDTA, 1 mM phenylmethylsulfonyl fluoride and 1 mM benzamidine], centrifuged at 12,000 × g for 15 min at 4°C, and the supernatants immediately used for carbonyl determination according to Levine et al. (1990) and normalized with the protein concentration determined using the dye-binding method (Bradford, 1976). H2O2 was quantified spectrophotometrically (Cintra 5, GBC Scientific Equipment, Victoria, VIC, Australia) after extraction with 0.1% trichloroacetic acid and reaction with KI in the dark (Alexieva et al., 2001). The amount of H2O2 was calculated using a standard curve prepared with known concentrations.
Antioxidant Enzymes Activity
For all enzymatic activity determinations, fully expanded leaves were ground in cold extraction buffer containing 50 mM of sodium phosphate buffer (pH 7.4), 1% (w/v) polyvinylpyrrolidone, 1 mM EDTA, 1 mM phenylmethylsulfonyl fluoride, and 1 mM benzamidine. The homogenate was centrifuged at 12,000 × g for 15 min at 4°C and the supernatant immediately used for enzymatic assays.
Ascorbate peroxidase activity was determined according to Klapheck et al. (1990), from the decrease in absorbance at 290 nm; CAT activity was determined following the decrease of absorbance at 240 nm due to H2O2 consumption (Cakmak and Marschner, 1992); and SOD activity was quantified as described by Beyer and Fridovich (1987), using 15 min of illumination and recording the absorbance at 560 nm. All enzymatic assays were performed at 25°C as initial activities, with no lag period, and total protein concentration determined by the dye-binding method (Bradford, 1976).
Global Gene Expression Analysis and Real-Time PCR
For global gene expression analysis, highly purified total RNA was obtained using NucleoSpin RNA II (Macherey-Nagel) from roots of EPAGRI 108 and BR-IRGA 409 plants exposed for 3 days to control or excess Fe conditions. RNA purity and quality was assessed by absorbance measurement (260 and 280 nm ratio) and by analysis on a Bioanalyzer (Agilent Technologies). Global gene expressions analyses were performed using the GeneChip Rice Genome Array (Affymetrix), which contains probes to query 51,279 transcripts representing two rice subspecies, with approximately 48,564 transcripts from japonica and 1,260 transcripts from the indica subspecies, respectively. 5 μg of total RNA were used as starting material for each sample, which were labeled using the one-cycle target labeling and control reagents (Affymetrix). Target preparation, micro-chip hybridization, washing, staining, and scanning were carried out according to manufacturer’s instructions (Affymetrix). The Affymetrix GeneChip Operating Software 1.2.1 was used for washing and scanning in the Fluidics Station 450 (Affymetrix) and the Scanner 3300 (Affymetrix), respectively. Sample quality was assessed by examining the 3′ to 5′ intensity ratios of the Poly-A and hybridization controls, and the housekeeping genes. For further data analysis, the probe intensity files (.cel) were imported into the ArrayAssist software (Stratagene) and normalization and probe summarization were performed using the Robust Multichip Analysis algorithm (Irizarry et al., 2003), followed by variance stabilization. Variance stabilization was performed to suppress noise by addition of a fixed quantity to all linear scale signal values.
To identify differentially expressed genes, a Student’s t-test (using P ≤ 0.05) was performed and the genes that showed significant differences and were up- or down-regulated by threefold or more were considered to be differentially expressed. Averages from three biological replicates for each sample were used for analysis.
The results from the microarray analysis were validated by real-time PCR. Total RNA was isolated from roots of rice plants exposed for 3 days to control or excess Fe treatments, and one microgram was treated with DNAse and reverse transcribed. Polymerase chain reactions were performed in a StepOne real time PCR System (Applied Biosystems), using SYBR® Green (Invitrogen) to monitor dsDNA synthesis. The following standard thermal profile was used for all PCRs: 95°C for 5 min; 40 cycles of 95°C for 15 s, 60°C for 10 s, 72°C for 15 s, and 60°C for 35 s. Relative expression was determined based on Schmittgen and Livak (2008) method with slight modifications, as described previously (Dametto et al., 2015). Primer sequences corresponding to all tested genes are listed in Supplementary Table S5. The microarray data obtained is publicly available at Gene Expression Omnibus1 under the accession number GSE131287.
Gene Ontology Analyses and Venn Diagram
Gene Ontology analyses were performed using PlantGSEA2. The 20 most highly enriched categories were selected, and showed with false discovery rate transformed to Log10 base. Categories were separated in “Biological Process,” “Cellular Component,” and “Molecular Function.” The Venn diagram was generated using Venny3.
Histochemical Staining
Plants were harvested after 15 days of treatment. The five millimeters most distal from the root tip were harvested from each root and fixed in 1.5 mL of 2.5% (w/v) glutaraldehyde and 3% (w/v) formaldehyde in phosphate buffer (pH 7.2). Hand-cut transverse sections were taken from fixed roots, after phosphate buffer (pH 7.2) washing followed by rinse in distilled water. The presence of lignin was determined by the Wiesner reaction (Wiesner, 1878), which gives a characteristic red coloration due to cinnamic aldehydes contained in lignified cell walls (Pomar et al., 2002), when viewed under bright field light microscopy. Sections of the roots were soaked in 1:1 aqueous solution of 2% (w/v) phloroglucinol and 70% (v/v) HCl, transferred to a glass-slide, topped with one drop of glycerin and covered with a cover slip. Observations and images were made using a Leica DM light microscope equipped with a Leica DFC500 Digital Camera system.
Chlorophyll a Fluorescence
Chlorophyll fluorescence was evaluated using a portable Chlorophyll Fluorometer (OS-30p Opti-Sciences Inc., Hudson, NH, United States). The fast kinetics rising transient (OJIP) measurements were made on attached youngest fully expanded leaves, which were dark-adapted for 12 h. For these measurements, eight plants from each genotype and treatment were used. The FV/FM ratio or trapping probability, TR0/ABS, which is the probability that an absorbed photon will be trapped by the Photosystem II reaction center with the resultant reduction of QA (primary electron acceptor of Photosystem II) was estimated from the JIP test parameters (Strasser and Strasser, 1995; Krüger et al., 1997). Experiments were performed using n = 8 to 9 plants per genotype.
Lignin Quantification
After 15 days of treatment, roots of nine plants from each genotype were harvested and dried in an oven (60°C, 9 days). The eight millimeters most distal from the root tip were harvested from each root for lignin analysis. Root lignin concentration was determined from the protein-free cell wall fraction by the formation and quantification of lignin-thioglycolic acid (LTGA) (Santos et al., 2004, modified proportionally to use 0.05 g of dry roots per sample). The LTGA pellets were dried at 60°C, dissolved in 0.5 M NaOH and diluted to yield an appropriate absorbance for spectrophotometric determination at 280 nm. For lignin’s standard curve preparation, different concentrations from 0.005 to 0.5 mg ml-1 of lignin (Aldrich 37,096-7 Lignin, alkali, 2-hydroxy-propyl ether) were prepared in the same way (reaction with thioglycolic acid and HCl) and the absorbance at 280 nm was determined. Lignin concentration was expressed as milligram LTGA per gram of dry weight. Experiments were performed using n = 8 to 9 plants per genotype.
Statistical Analysis
Means from most physiological and biochemical analyses were compared by ANOVA, followed by Duncan test, according to Quinn and Keough (2002). FV/FM and lignin concentration means were compared to the respective controls by the Student’s t-test (P ≤ 0.05) using the SPSS Base 12.0 for Windows (SPSS Inc., Chicago, IL, United States). Differences were considered significant when P ≤ 0.05.
Data Availability
All datasets for this study are included in the manuscript and the Supplementary Files. The microarray data obtained in this work is available at Gene Expression Omnibus4 under the accession number GSE131287.
Author Contributions
RJS and JPF conceived the study. RJS, GLD, LS, and MGS conducted the experiments. RJS, AdAJ, FKR, LMGR, NITZ, RS, and JPF analyzed the data. JPF, LMGR, NITZ, and RJS provided the experimental tools. RJS, FKR, and JPF wrote the manuscript. All authors approved the current version of the manuscript.
Funding
This work was supported by CNPq (Conselho Nacional de Desenvolvimento Científico e Tecnológico – Brazil), CAPES (Coordenação de Aperfeiçoamento de Pessoal de Nível Superior – Brazil), FAPERGS (Fundação de Apoio à Pesquisa do Estado do Rio Grande do Sul), FAPESP (Fundação de Apoio à Pesquisa do Estado de São Paulo), and CIAT (Centro Internacional de Agricultura Tropical).
Conflict of Interest Statement
The authors declare that the research was conducted in the absence of any commercial or financial relationships that could be construed as a potential conflict of interest.
Acknowledgments
The authors thank IRGA (Instituto Rio Grandense do Arroz) for kindly providing rice seeds and access to atomic absorption spectrometry equipment.
Supplementary Material
The Supplementary Material for this article can be found online at: https://www.frontiersin.org/articles/10.3389/fpls.2019.00746/full#supplementary-material
Footnotes
- ^https://www.ncbi.nlm.nih.gov/geo/
- ^http://structuralbiology.cau.edu.cn/PlantGSEA/analysis.php
- ^http://bioinfogp.cnb.csic.es/tools/venny/
- ^https://www.ncbi.nlm.nih.gov/geo/
References
Alexieva, V., Sergiev, S., Mapelli, S., and Karanov, E. (2001). The effect of drought and ultraviolet radiation on growth and stress markers in pea and wheat. Plant Cell Environ. 24, 1337–1344.
Arenhart, R. A., Lima, J. C., Pedron, M., Carvalho, F. E., Silveira, J. A., Rosa, S. B., et al. (2013). Involvement of ASR genes in aluminium tolerance mechanisms in rice. Plant Cell Environ. 36, 52–67. doi: 10.1111/j.1365-3040.2012.02553.x
Bashir, K., Hanada, K., Shimizu, M., Seki, M., Nakanishi, H., and Nishizawa, N. K. (2014). Transcriptomic analysis of rice in response to iron deficiency and excess. Rice 7, :18. doi: 10.1186/s12284-014-0018-1
Becana, M., Moran, J. F., and Iturbe-Ormaetxe, I. (1998). Iron-dependent oxygen free radical generation in plants subjected to environmental stress: toxicity and antioxidant protection. Plant Soil 201, 137–147.
Becker, M., and Asch, F. (2005). Iron toxicity in rice—conditions and management concepts. J. Plant Nutr. Soil Sci. 168, 558–573.
Beyer, W. F., and Fridovich, I. (1987). Assaying of superoxide dismutase activity: some large consequences of minor changes in conditions. Anal. Biochem. 161, 559–566.
Blokhina, O., Virolainen, E., and Fagerstedt, K. V. (2003). Antioxidants, oxidative damage and oxygen deprivation stress: a review. Ann. Bot. 91, 179–194.
Boerjan, W., Ralph, J., and Baucher, M. (2003). Lignin biosynthesis. Ann. Rev. Plant Biol. 54, 519–546.
Bradford, M. M. (1976). A rapid and sensitive method for the quantitation of microgram quantities of protein utilizing the principle of protein-dye binding. Anal. Biochem. 72, 248–254.
Burlat, V., Kwon, M., Davin, L. B., and Lewis, N. G. (2001). Dirigent proteins and dirigent sites in lignifying tissues. Phytochemistry 57, 883–897.
Cai, X., Chen, T., Zhou, Q., Xu, L., Qu, L., Hua, X., et al. (2011). Development of casparian strip in rice cultivars. Plant Signal. Behav. 6, 59–65.
Cakmak, I., and Marschner, H. (1992). Magnesium deficiency and high light intensity enhance activities of superoxide dismutase, ascorbate peroxidase and glutathione reductase in bean leaves. Plant Physiol. 98, 1222–1227.
Dametto, A., Sperotto, R. A., Adamski, J. M., Blasi,É. A., Cargnelutti, D., de Oliveira, L. F., et al. (2015). Cold tolerance in rice germinating seeds revealed by deep RNAseq analysis of contrasting indica genotypes. Plant Sci. 238, 1–12. doi: 10.1016/j.plantsci.2015.05.009
Davin, L. B., Wang, H. B., Crowell, A. L., Bedgar, D. L., Martin, D. M., Sarkanen, S., et al. (1997). Stereoselective bimolecular phenoxy radical coupling by an auxiliary (dirigent) protein without an active center. Science 275, 362–366.
Doblas, V. G., Geldner, N., and Barberon, M. (2017). The endodermis, a tightly controlled barrier for nutrients. Curr. Opin. Plant Biol. 39, 136–143. doi: 10.1016/j.pbi.2017.06.010
Dufey, I., Hakizimana, P., Draye, X., Lutts, S., and Bertin, P. (2009). QTL mapping for biomass and physiological parameters linked to resistance mechanisms to ferrous iron toxicity in rice. Euphytica 167, 143–160.
Dufey, I., Hiel, M. P., Hakizimana, P., Draye, X., Lutts, S., Koné, B., et al. (2012). Multienvironment quantitative trait loci mapping and consistency across environments of resistance mechanisms to ferrous iron toxicity in rice. Crop Sci. 52, 539–550.
Dufey, I., Mathieu, A.-S., Draye, X., Lutts, S., and Bertin, P. (2015). Construc- tion of an integrated map through comparative studies allows the identification of candidate regions for resistance to ferrous iron toxicity in rice. Euphytica 203, 59–69.
Dziwornu, A. K., Shrestha, A., Matthus, E., Ali, B., Wu, L. B., and Frei, M. (2018). Responses of contrasting rice genotypes to excess manganese and their implications for lignin synthesis. Plant Physiol. Biochem. 123, 252–259. doi: 10.1016/j.plaphy.2017.12.018
Fang, W. C., Wang, J. W., Lin, C. C., and Kao, C. H. (2001). Iron induction of lipid peroxidation and effects on antioxidative enzymes activities in rice leaves. Plant Growth Regul. 35, 75–80.
Farquhar, G. D., Von Caemmerer, S., and Berry, J. A. (1980). A biochemical model of photosynthetic CO2 assimilation in leaves of C3 species. Planta 149, 78–90. doi: 10.1007/BF00386231
Finatto, T., de Oliveira, A. C., Chaparro, C., da Maia, L. C., Farias, D. R., Woyann, L. G., et al. (2015). Abiotic stress and genome dynamics: specific genes and transposable elements response to iron excess in rice. Rice 8, :13. doi: 10.1186/s12284-015-0045-6
Gollhofer, J., Timofeev, R., Lan, P., Schmidt, W., and Buckhout, T. J. (2014). Vacuolar-iron-transporter1-like proteins mediate iron homeostasis in Arabidopsis. PLoS One 9:e110468. doi: 10.1371/journal.pone.0110468
Gomes, M. P., Marques, T. C. L. S. M., Nogueira, M. O. G., Castro, E. M., and Soares, A. M. (2011). Ecophysiological and anatomical changes due to uptake and accumulation of heavy metal in Brachiaria decumbens. Sci. Agric. 68, 566–573. doi: 10.1590/S0103-90162011000500009
Grillet, L., Lan, P., Li, W., Mokkapati, G., and Schmidt, W. (2018). IRON MAN is a ubiquitous family of peptides that control iron transport in plants. Nat. Plants 4, 953–963. doi: 10.1038/s41477-018-0266-y
Hodges, D. M., DeLong, J. M., Forney, C. F., and Prange, R. K. (1999). Improving the thiobarbituric acid-reactive-substances assay for estimating lipid peroxidation in plant tissues containing anthocyanin and other interfering compounds. Planta 207, 604–611.
Hosmani, P. S., Kamiya, T., Danku, J., Naseer, S., Geldner, N., Guerinot, M. L., et al. (2013). Dirigent domain-containing protein is part of the machinery required for formation of the lignin-based casparian strip in the root. Proc.eedings of the Natl.ional Acad.emy of Sci.ences, U.S.A. 110, 14498–14503. doi: 10.1073/pnas.1308412110
Irizarry, R. A., Bolstad, B. M., Collin, F., Cope, L. M., Bridget, H., and Terence, P. (2003). Summaries of affymetrix genechip probe level data. Nucleic Acids Res. 31, e15.
Ishimaru, Y., Bashir, K., Fujimoto, M., An, G., Itai, R. N., Tsutsumi, N., et al. (2009). Rice-specific mitochondrial iron-regulated gene (MIR) plays an important role in iron homeostasis. Mol. Plant 2, 1059–1066. doi: 10.1093/mp/ssp051
Ishimaru, Y., Suzuki, M., Tsukamoto, T., Suzuki, K., Nakazono, M., Kobayashi, T., et al. (2006). Rice plants take up iron as an Fe3+-phytosiderophore and as Fe2+. Plant J.ournal 45, 335–346. doi: 10.1111/j.1365-313X.2005.02624.x
Joo, J., Lee, Y. H., Kim, Y. K., Nahm, B. H., and Song, S. I. (2013). Abiotic stress responsive rice ASR1 and ASR3 exhibit different tissue-dependent sugar and hormone-sensitivities. Mol. Cells 35, 421–435. doi: 10.1007/s10059-013-0036-7
Kakei, Y., Ishimaru, Y., Kobayashi, T., Yamakawa, T., Nakanishi, H., and Nishizawa, N. K. (2012). OsYSL16 plays a role in the allocation of iron. Plant Mol. Biol. 79, 583–594. doi: 10.1007/s11103-012-9930-1
Kampfenkel, K., van Montagu, M., and Inzé, D. (1995). Effects of iron excess on Nicotiana plumbaginifolia. Implications to oxidative stress. Plant Physiol. 107, 725–735.
Kidwai, M., Dhar, Y. V., Gautam, N., Tiwari, M., Ahmad, I. Z., Asif, M. H., et al. (2019). Oryza sativa class III peroxidase (OsPRX38) overexpression in Arabidopsis thaliana reduces arsenic accumulation due to apoplastic lignification. J. Hazard. Mater. 362, 383–393. doi: 10.1016/j.jhazmat.2018.09.029
Klapheck, S., Zimmer, I., and Cosse, H. (1990). Scavenging of hydrogen peroxide in the endosperm of Ricinus communis by ascorbate peroxidase. Plant Cell Physiol. 31:, 1005–1013.
Krüger, G. H. J., Tsimilli-Michael, M., and Strasser, R. J. (1997). Light stress provokes plastic and elastic modifications in structure and function of photosystem II in camellia leaves. Physiol. Plant. 101, 265–277.
Lee, S., Ryoo, N., Jeon, J. S., Guerinot, M. L., and An, G. (2012). Activation of rice yellow stripe1-like 16 (OsYSL16) enhances iron efficiency. Mol. Cells 33, 117–126. doi: 10.1007/s10059-012-2165-9
Lequeux, H., Hermans, C., Lutts, S., and Verbruggen, N. (2010). Response to copper excess in Arabidopsis thaliana: impact on the root system architecture, hormone distribution, lignin accumulation and mineral profile. Plant Physiol. Biochem. 48, 673–682. doi: 10.1016/j.plaphy.2010.05.005
Levine, R. L., Garland, D., Oliver, C. N., Amici, A., Climent, I., Lenz, A., et al. (1990). Determination of carbonyl content in oxidatively modified proteins. Methods Enzymol. 186, 464–478.
Ma, F., and Peterson, C. A. (2003). Current insides into the development, structure, and chemistry of the endodermis and exodermis of roots. Can. J. Bot. 81, 405–421.
Majerus, V., Bertin, P., Swenden, V., Fortemps, A., Lobreaux, S., and Lutts, S. (2007). Organ-dependent responses of the african rice to short-term iron toxicity: fer- ritin regulation and antioxidative responses. Biol.ogia Plant.arum 51, 303–312.
Matthus, E., Wu, L. B., Ueda, Y., Höller, S., Becker, M., and Frei, M. (2015). Loci, genes, and mechanisms associated with tolerance to ferrous iron toxicity in rice (Oryza sativa L.). Theor. Appl. Genet. 128, 2085–2098. doi: 10.1007/s00122-015-2569-y
Müller, C., Silveira, S. F. D. S., Daloso, D. M., Mendes, G. C., Merchant, A., Kuki, K. N., et al. (2017). Ecophysiological responses to excess iron in lowland and upland rice cultivars. Chemosphere 189, 123–133. doi: 10.1016/j.chemosphere.2017.09.033
Naseer, S., Lee, Y., Lapierre, C., Franke, R., Nawrath, C., and Geldner, N. (2012). Casparian strip diffusion barrier in Arabidopsis is made of a lignin polymer without suberin. Proc. Natl. Acad. Sci. U.S.A. 109, 10101–10106. doi: 10.1073/pnas.1205726109
Nozoye, T., Nagasaka, S., Kobayashi, T., Takahashi, M., Sato, Y., Sato, Y., et al. (2011). Phytosiderophore efflux transporters are crucial for iron acquisition in graminaceous plants. J. Biol. Chem. 286, 5446–5454. doi: 10.1074/jbc.M110.180026
Olaleye, A. O., Tabi, F. O., Ogunkule, A. O., Singh, B. N., and Sahrawat, K. L. (2001). Effect of toxic iron concentration on the growth of lowland rice. J. Plant Nutr. 24, 441–457.
Paniagua, C., Bilkova, A., Jackson, P., Dabravolski, S., Riber, W., Didi, V., et al. (2017). Dirigent proteins in plants: modulating cell wall metabolism during abiotic and biotic stress exposure. J. Exp. Bot. 68, 3287–3301. doi: 10.1093/jxb/erx141
Pereira, E. G., Oliva, M. A., Rosado-Souza, L., Mendes, G. C., Colares, D. S., Stopato, C. H., et al. (2013). Iron excess affects rice photosynthesis through stomatal and non-stomatal limitations. Plant Sci. 20, 81–92. doi: 10.1016/j.plantsci.2012.12.003
Pomar, F., Merino, F., and Barcelo, A. R. (2002). O-4- linked coniferyl and sinapyl aldehydes in lignifying cell walls are the main targets of the wiesner (phloroglucinol-HCl) reaction. Protoplasma 220, 17–28. doi: 10.1007/s00709-002-0030-y
Quinn, G. P., and Keough, M. J. (2002). Experimental Design and Data Analysis for Biologists. Cambridge: Cambridge University Press, 738.
Quinet, M., Vromman, D., Clippe, A., Bertin, P., Lequeux, H., Dufey, I., et al. (2012). Combined transcriptomic and physiological approaches reveal strong differences between short- and long-term response of rice (Oryza sativa) to iron toxicity. Plant Cell Environ. 35, 1837–1859. doi: 10.1111/j.1365-3040.2012.02521.x
Raes, J., Rohde, A., Christensen, J. H., Van de Peer, Y., and Boerjan, W. (2003). Genome-wide characterization of the lignification toolbox in Arabidopsis. Plant Physiol. 1, 1051–1071.
Ricachenevsky, F. K., de Araújo Junior, A. T., Fett, J. P., and Sperotto, R. A. (2018). You shall not pass: root vacuoles as a symplastic checkpoint for metal translocation to shoots and possible application to grain nutritional quality. Front. Plant Sci. 9:412. doi: 10.3389/fpls.2018.00412
Ricachenevsky, F. K., and Sperotto, R. A. (2014). There and back again, or always there? The evolution of rice combined strategy for Fe uptake. Front. Plant Sci. 5:89. doi: 10.3389/fpls.2014.00189
Ricachenevsky, F. K., Sperotto, R. A., Menguer, P. K., and Fett, J. P. (2010). Identification of Fe-excess-induced genes in rice shoots reveals a WRKY transcription factor responsive to Fe, drought and senescence. Mol. Biol. Rep. 37, 3735–3745. doi: 10.1007/s11033-010-0027-0
Ricachenevsky, F. K., Sperotto, R. A., Menguer, P. K., Sperb, E. R., Lopes, K. L., and Fett, J. P. (2011). ZINC-induced facilitator-like family in plants: lineage-specific expansion in monocotyledons and conserved genomic and expression features among rice (Oryza sativa) paralogs. BMC Plant Biol. 11:20. doi: 10.1186/1471-2229-11-20
Sahrawat, K. L. (2000). Elemental composition of rice plants as affected by iron toxicity under field conditions. Commun. Soil Sci. Plant Anal. 31, 2819–2827.
Sahrawat, K. L. (2004). Iron toxicity in wetland rice and the role of other nutrients. J. Plant Nutr. 27, 1471–1504.
Santos, W. D., Ferrarese, M. L. L., Finger, A., Teixeira, A. C. N., and Ferrarese-Filho, O. (2004). Lignification and related enzymes in soybean root growth-inhibition by ferulic acid. J. Chem. Ecol. 30, 1203–1212.
Schmittgen, T. D., and Livak, K. J. (2008). Analyzing real-time PCR data by the comparative CT method. Nat.ure Protoc. 3, 1101–1108.
Siemianowski, O., Barabasz, A., Kendziorek, M., Ruszczynska, A., Bulska, E., Williams, L. E., et al. (2014). HMA4 expression in tobacco reduces Cd accumulation due to the induction of the apoplastic barrier. J. Exp. Bot. 65, 1125–1139. doi: 10.1093/jxb/ert471
Silveira, V. C., Oliveira, A. P., Sperotto, R. A., Espindola, L., Amaral, L., Dias, J. F., et al. (2007). Influence of iron on mineral status of two rice (Oryza sativa L.) cultivars. Braz. J. Plant Physiol. 19, 127–139.
Sperotto, R. A., Ricachenevsky, F. K., Waldow Vde, A., and Fett, J. P. (2012). Iron biofortification in rice: it”s a long way to the top. Plant Sci. 190, 24–39. doi: 10.1016/j.plantsci.2012.03.004
Strasser, B. J., and Strasser, R. J. (1995). “Measuring fast fluorescence transients to address environmental questions: the JIP test,” in: Mathis P (ed) Photosynthesis: From Light to Biosphere (Dordrecht: Kluwer Acadamic Publishers), 977–980.
Stein, R. J., Duarte, G. L., Spohr, M. G., Lopes, S. I. G., and Fett, J. P. (2009a). Distinct physiological responses of two rice cultivars subjected to iron toxicity under field conditions. Ann. Appl. Biol. 154, 269–277.
Stein, R. J., Ricachenevsky, F. K., and Fett, J. P. (2009b). Differential regulation of the two rice ferritin genes (OsFER1 and OsFER2). Plant Sci. 177, 563–569.
Suh, H., Kim, C. S., Lee, J., and Jung, J. (2002). Photodynamic effect of iron excess on photosystem II function in pea plants. Photochem. Photobiol. 75, 513–518.
Taylor, G., and Crowder, A. A. (1983). Use of the DCB technique for extraction of hydrous iron oxides from roots of wetland plants. Am. J. Bot. 70, 1254–1257.
Wiesner, J. (1878). Note űber das verhalten des phloroglucins und einiger verwandter körper zur verholzten zellmembrane. Sitzungsber Akad Wiss Math-naturw Kl 77, 60–66.
Wu, L.-B., Shhadi, M., Gregorio, G., Matthus, E., Becker, M., and Frei, M. (2014). Genetic and physiological analysis of tolerance to acute iron tox- icity in rice. Rice 7, :8. doi: 10.1186/s12284-014-0008-3
Wu, L. B., Ueda, Y., Lai, S. K., and Frei, M. (2017). Shoot tolerance mechanisms to iron toxicity in rice (Oryza sativa L.). Plant Cell Environ. 40, 570–584. doi: 10.1111/pce.12733
Yoshida, S., Forno, D. A., Cock, J. H., and Gomez, K. A. (1976). Laboratory Manual for Physiological Studies of Rice, 3rd Edn. Manila: International Rice Research Institutes, 61.
Zhang, J., Chen, K., Pang, Y., Naveed, S. A., Zhao, X., Wang, X., et al. (2017). QTL mapping and candidate gene analysis of ferrous iron and zinc toxicity tolerance at seedling stage in rice by genome-wide association study. BMC Genomics 18:828. doi: 10.1186/s12864-017-4221-5
Zhang, Y., Xu, Y. H., Yi, H. Y., and Gong, J. M. (2012). Vacuolar membrane transporters OsVIT1 and OsVIT2 modulate iron translocation between flag leaves and seeds in rice. Plant J. 72, 400–410. doi: 10.1111/j.1365-313X.2012.05088.x
Keywords: iron, rice, lignin, root, exclusion
Citation: Stein RJ, Duarte GL, Scheunemann L, Spohr MG, de Araújo Júnior AT, Ricachenevsky FK, Rosa LMG, Zanchin NIT, Santos RP and Fett JP (2019) Genotype Variation in Rice (Oryza sativa L.) Tolerance to Fe Toxicity Might Be Linked to Root Cell Wall Lignification. Front. Plant Sci. 10:746. doi: 10.3389/fpls.2019.00746
Received: 29 January 2019; Accepted: 21 May 2019;
Published: 12 June 2019.
Edited by:
Thomas J. Buckhout, Humboldt University of Berlin, GermanyCopyright © 2019 Stein, Duarte, Scheunemann, Spohr, de Araújo Júnior, Ricachenevsky, Rosa, Zanchin, Santos and Fett. This is an open-access article distributed under the terms of the Creative Commons Attribution License (CC BY). The use, distribution or reproduction in other forums is permitted, provided the original author(s) and the copyright owner(s) are credited and that the original publication in this journal is cited, in accordance with accepted academic practice. No use, distribution or reproduction is permitted which does not comply with these terms.
*Correspondence: Janette Palma Fett, anBmZXR0QGNiaW90LnVmcmdzLmJy
†Present address: Lívia Scheunemann, Department of Genetics, Ludwig-Maximilians-Universität, Munich, Germany