 Hui Yang1
 Shaozhong Kang
 Taisheng Du
94% of researchers rate our articles as excellent or good
Learn more about the work of our research integrity team to safeguard the quality of each article we publish.
Find out more
ORIGINAL RESEARCH article
Front. Plant Sci. , 28 February 2019
Sec. Plant Physiology
Volume 10 - 2019 | https://doi.org/10.3389/fpls.2019.00160
This article is part of the Research Topic Water-Use Efficiency: Advances and Challenges in a Changing Climate View all 10 articles
Interactive effects of reduced irrigation and salt stress on leaf physiological parameters, biomass accumulation, and water use efficiency (WUE) of tomato plants at leaf and whole plant scales were investigated in a field experiment during 2016 and a greenhouse experiment during 2017. Experiment utilized two irrigation regimes (full, 2/3 of full irrigation) and four soil salt regimes (0, 0.3, 0.6, 0.9% in 2016 season; and 0, 0.2, 0.3, 0.4% in 2017 season). Three salts, sodium chloride, magnesium sulfate, and calcium sulfate (mass ratio of 2:2:1), were homogeneously mixed with soil prior to packing into containers (0.024 m3). Li-COR 6400 was used to measure tomato leaf physiological parameters. Instantaneous water use efficiency (WUEins, μmol mmol−1) and intrinsic water use efficiency (WUEint, μmol mol−1) were determined at leaf scale, yield water use efficiency (WUEY, g L−1), and dry biomass water use efficiency (WUEDM, g L−1) were determined at whole plant scale. Plants irrigated with 2/3 of full irrigation with zero soil-salt treatment had higher dry biomass and yield per plant, resulting in the highest WUEDM and WUEY at whole plant scale. Increasing soil salinity decreased dry biomass and yield, leading to greater decreases in whole plant WUEDM and WUEY under both irrigation treatments. At full irrigation, no decreases in stomatal conductance (gs, mol m−2 s−1) and slight increase in photosynthetic rate (Pn, μmol m−2 s−1) led to higher WUEint at leaf scale during both years. Under full and reduced irrigation, increasing soil salt content decreased Pn and transpiration rate (Tr, mmol m−2 s−1) and led to reductions in WUEins at the leaf scale. However, compared to full irrigation, reduced irrigation improved WUEins with a significant decline in Tr in no salt and 0.3% soil-salt treatments during both years. For soil salt content of 0.6%, stomatal limitation due to salt stress resulted in higher WUEint, but soil salt content of 0.9% decreased WUEint due to non-stomatal limitation. Soil salt content significantly decreased sap flow, with the maximum variation of daily sap flow per plant of 7.96–31.37 g/h in 2016 and 12.52–36.02 g h−1 in 2017. Sap flow rate was linearly related to air temperature (Ta, °C), solar radiation (Rs, W m−2), and vapor pressure deficit (VPD, kPa). These results advance knowledge on tomato response to abiotic stresses and could improve management of tomato production in water- and salt-stressed areas.
Appropriate water-saving irrigation regimes are needed to alleviate the threat of water shortage and severe drought on food security under increasing population worldwide (Wei et al., 2016), especially in ecologically fragile arid and semi-arid areas. More than 6% of the world's land is subject to salinity problems (Unesco Water Portal, 2007), and the use of water-saving strategies could exacerbate secondary salinization. Approximately 20% of irrigated land was affected by salinity where crop yields were notably reduced (Qadir et al., 2014). Therefore, soil salinity measurements must precede implementation of water-saving irrigation regimes (Reina-Sánchez et al., 2005). Increases in the duration of droughts have necessitated the use of lower quality groundwater to supplement irrigation in semi-arid regions (Flores et al., 2016, 2017; Baath et al., 2017). Understanding plant responses to coupled abiotic stresses of water and salinity, and the underlying mechanisms of improving WUE from leaf to whole plant scale, would be useful to stabilize crop performance and production under drought and saline conditions in a changing climate.
Salinity-induced morphological and physiological changes in plants are mostly identical to drought during osmotic stress phase (Munns, 2002). Drought and salinity stresses cause progressive reductions of water use, leaf growth, and yield via restriction on stomatal apertures to mediate leaf photochemistry and carbon metabolism (Negrão et al., 2017). Under salinity stress, plants could suffer due to salt-specific effects of ion toxicity (Deb et al., 2013; Farooq et al., 2015). Most of the experiments reported so far were conducted under simulated conditions of using either hydroponic culture with different gradients of nutritive solutions (Albaladejo et al., 2017) or soil irrigated with different levels of saline solutions of NaCl (Ahmed et al., 2013; Galli et al., 2016), NaCl and CaCl2 (Katerji et al., 2011), or brackish groundwater (Flores et al., 2016; Baath et al., 2017).
It is more realistic for plant roots to be exposed to multiple salts simultaneously due to the specific ion effects as wells as competitions among ions (Farooq et al., 2015), but very few studies have been conducted in soil containing salt. Schiattone et al. (2017) mixed two salts (NaCl and CaCl2) with soil to investigate water use and rocket crop performance under different salt-stressed conditions. The results showed that the increasing soil salt content decreased leaf size and numbers, water use, and yield. Faster uptake and transport from roots to the shoots of ions in solution caused symptoms to occur early in tomato leaves (Albaladejo et al., 2017). Na+ interfered with K+ uptake causing disturbance in stomatal regulations (Siddiqi et al., 2011) and also stimulated sulfate uptake of safflower plant (Patil, 2012).
Plant acclimation to water stress is the result of osmotic adjustment by chemical growth regulators in roots which maintain plants water status with little influence on photosynthetic rate (Martínez et al., 2007; Chaves et al., 2009; Du et al., 2015; Negrão et al., 2017). In addition, plant adaptation to salinity causes adjustments in ion uptake, extrusion, and sequestration as well as synthesis of compatible solutes to maintain cellular homeostasis (Chaves et al., 2009). Some salt-tolerant species are better able to maintain a longer greenness and photosynthetic process under high levels of Na+ concentration in tissues (Flores et al., 2016; Negrão et al., 2017). However, response to individual stress factors cannot be isolated from plant response (Mittler, 2006).
Another challenge is linking changes in leaf physiology to WUE at leaf and whole plant scales. Reduced irrigation has been reported to improve WUE at plant scale by maintaining yield (Chen et al., 2013; Cosić et al., 2015; Yang et al., 2017). WUE at leaf scale is impacted by external factors, e.g., VPD and soil water content, and internal factors, e.g., stomatal conductance, leaf mesophyll conductance, and leaf water deficit (Chaves et al., 2009; Niu et al., 2011). Instantaneous water use efficiency (WUEins, μmol mmol−1) is reported to decrease with increasing rainfall (Farquhar and Sharkey, 1982) while intrinsic water use efficiency (WUEint, μmol mol−1) is improved by sustaining Pn or decreasing gs (Wang et al., 2010).
Tomato is moderately tolerant to salinity, with a threshold saturated paste EC of 1.3~6 dS m−1 (Maggio et al., 2004). The marketable yield and dry matter of tomato decrease with salinity (Reina-Sánchez et al., 2005). Dry biomass water use efficiency (WUEDM, g L−1) of tomato plants did not differ at 35 and 70 mM NaCl compared to control (Romero-Aranda et al., 2001). In contrast, Reina-Sánchez et al. (2005) found that WUEDM of four tomato cultivars slightly improved, while yield water use efficiency (WUEY, g L−1) decreased with increasing salinity (Zhang et al., 2016). However, water use efficiency (WUEins and WUEint) at leaf scale for tomato species under salt-stressed conditions are still unknown.
Generally, sap flow rate is affected by various internal and external factors. Internal factors refer to plant water status, i.e., canopy structure, stomatal aperture, stem hydraulic structure, and hydraulic conductivity of roots; and external factors including solar radiation (Rs, W m−2) and VPD (De Swaef and Steppe, 2010; Liu et al., 2010). Only a few studies have documented that sap flow of tomato plants significantly decreased in deficit-irrigated treatments (Liu et al., 2010; Qiu et al., 2015; Mao et al., 2017).
Tomato is widely planted in northwest China. However, with increasing tomato consumption and decreasing water resources in northwest China, greenhouse tomato cultivation has shown a large potential. Therefore, in this study, one field experiment and one greenhouse experiment were conducted in 2016 and 2017, respectively. Our hypotheses were that reduced irrigation coupled with salt stress will decrease tomato sap flow rate and the WUE will improve under water stress with/without mild salt stress at leaf and plant levels. The objectives were to (1) investigate the influence of simultaneous water and salt stresses on WUEins and WUEint at leaf and plant scale, (2) evaluate actual transpiration of tomato under different water and salt treatments, and (3) determine tomato WUE from leaf scale to plant scale under different water and salt stresses.
Two experiments were carried out, one in a field and another in a solar greenhouse 200 m away from the field, at the Shiyanghe Experimental Station of Crop Water Use, Wuwei city of northwest China (37°52′N, 102°50′E, 1581 m above sea level). The field experiment was conducted from May to August 2016 (2016 season) and the greenhouse experiment from April to August 2017 (2017 season). The greenhouse was 76 × 8 m in size and made of a steel frame covered with 0.2-mm thick polyethylene, with no heating or cooling system. A narrow ventilation on the roof controled the interior daytime temperature in the summer.
The pink series tomato (Lycopersicon esculentum, cultivars “Nathen” and “Jinpeng”) were grown in the 2016 and 2017 seasons; both are common indeterminate tomato cultivars widely used in local tomato production. During both field and greenhouse experiments, the seedlings were transplanted at the 3rd to 4th leaf stage into 7.8L plastic containers (35 cm top diameter, 30 cm bottom diameter, and 25 cm depth) filled with 16 kg air-dried sandy loam soil (<5 mm) with a bulk density of 1.3 ± 0.5 g cm−3. During both years, cheesecloth and 1 kg of small gravel were packed at the bottom of the container to prevent soil loss. The containers were buried in the ground up to the top edge to maintain a soil temperature similar to the field. Soil surface of each container was covered with white polyethylene film to prevent soil water evaporation. The fertilizers applied were 200 mg kg−1 soil N (CH4N2O), 390 mg kg−1 soil P (Ca(H2PO4), and 55 mg kg−1 soil K (KH2PO4). All three fertilizers were mixed homogeneously with soil before filling the containers to support plant growth during both years. The sandy loam soil had an average in situ bulk density of 1.52 g cm−3, volumetric soil water content of 25.3% at pot water-holding capacity, electrical conductivity of 0.302 dS m−1, and pH of 7.88 (Table 1). Considering the cultivars' characteristics of indetermination, tomato plants were pinched when the third truss of flowers came out.
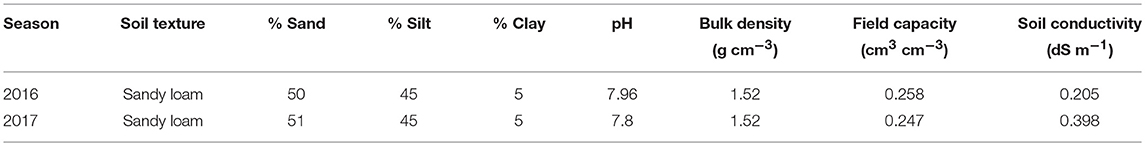
Table 1. Mean for some of the physiochemical properties of soil used for field experiment in 2016 and greenhouse experiment in 2017.
Two levels of irrigation, full irrigation (W1) and reduced irrigation (W2/3, 2/3 of W1), were applied with four soil salt regimes during two experiments. In the field experiment of 2016, four salt treatments created were S0 (no salt added), S3 (0.3%), S6 (0.6%), and S9 (0.9%), corresponding to the soil solution electrical conductivity (ECs) of 0.205, 1.030, 1.932, and 2.597 dS m−1. Salt content in parentheses represents the mass ratio of total salts to air-dried soil. Three salts, sodium chloride (NaCl), magnesium sulfate (MgSO4), and calcium sulfate (CaSO4), were homogeneously mixed with soil prior to packing into containers with the mass ratio of 2:2:1, respectively. In the greenhouse experiment of 2017, S6 and S9 salinity treatments were discontinued and replaced with S2 (0.2%) and S4 (0.4%) with ECs of 0.814, and 1.326 dS m−1 because plants were almost dead under S6 and S9 treatments. The experiment design was a split plot with water treatments (two levels) as main plot and salt treatments (four levels) as sub-plot, each treatment has 10 and 20 containers in 2016 and 2017, respectively.
One tomato plant was transplanted to each container at the 3rd to 4th leaf stage on 9 May 2016 and 24 April 2017. Container spacing was 0.5 × 0.4 m, resulting in five plants per m2. A drip arrow irrigation system was employed with two-drop arrow emitters in each container. For each treatment, the irrigation volume was controlled by a plastic bucket with scales installed at the head of the drip pipes, and sand and mesh filters were installed to prevent emitter clogging. Tap water with an electrical conductivity of 0.62 dS m−1 was used for irrigation. The irrigation treatments started on June 5th in 2016 at flowering stage, and on May 5th in 2017 in the middle of vegetative stage. Tomato plants were irrigated to 90% of pot water-holding capacity for the full irrigation treatment when its average soil water content (observed by 5TE sensors) decreased to 50 ± 2% of pot water-holding capacity. Irrigation amounts and times for each treatment are listed in Table 2.
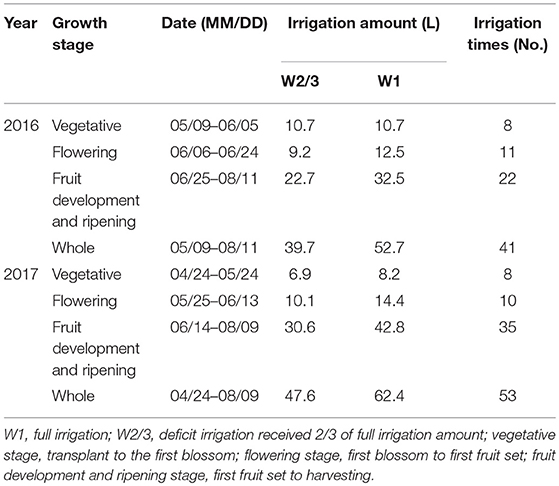
Table 2. Details of irrigation treatment during tomato growth period during 2016–2017.
The entire growth period of tomato was divided into three stages, i.e., vegetative stage (transplant to first blossom), flowering stage (first blossom to first fruit set), and fruit development and ripening stage (first fruit set to harvesting). Details of growth periods and irrigations are shown in Table 2.
The meteorological factors, solar radiation (Rs, W m−2), relative humidity (RH, %), air temperature (Ta, °C), and vapor pressure deficit (VPD, kPa), for field and greenhouse experiments are shown in Figure 1. In the field experiment of 2016, meteorological data were recorded every 15 min from a weather station (Weather Hawk, Campbell Scientific, USA) 50 m away from the experiment field. In the greenhouse experiment of 2017, an automatic weather station (HOBO, Onset Computer Corp., USA) was installed in the middle of the greenhouse and data were collected every 15 min. VPD was calculated from RH and Ta (Norman, 1998). To measure soil water content (SWC, cm3 cm−3), one 5TE sensor (Decagon Devices, Inc., USA) was installed at the depth of 15 cm in three randomly selected containers in each treatment in both experiments. The data were collected every 30 min by an EM50 data logger (Decagon Devices, Inc., USA). Sensors were calibrated by optimizing gravimetrically and sensor-measured volumetric water contents.
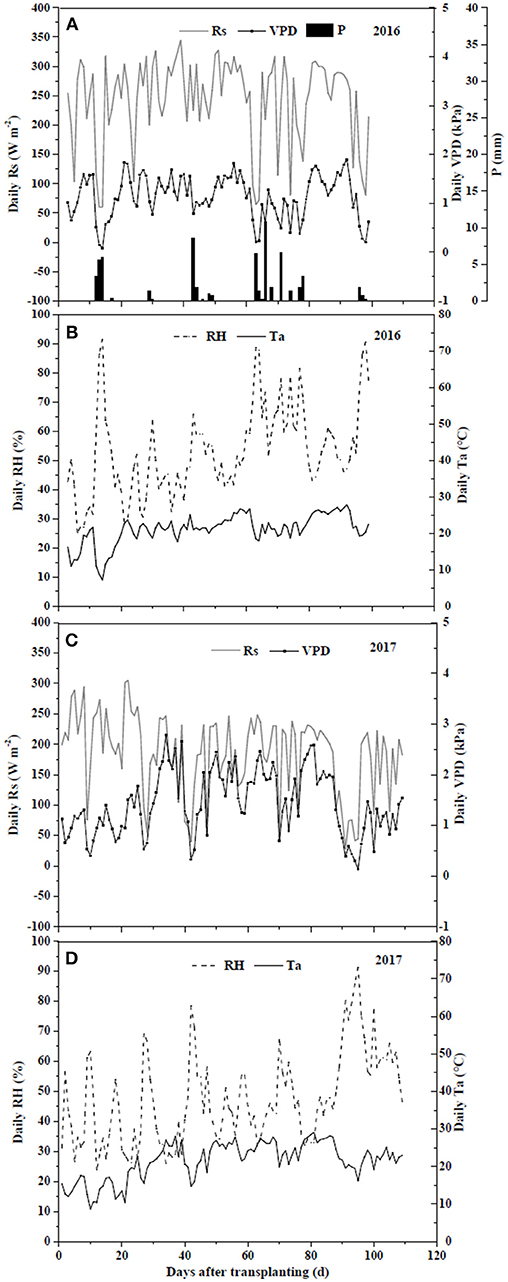
Figure 1. Climate variances including daily solar radiation (Rs) (A,C), relative humidity (RH) (B,D), temperature (Ta) (B,D), and vapor pressure deficit (VPD) (A,C) of field experiment in 2016 and greenhouse experiment in 2017.
Leaf gas exchange parameters, including photosynthesis rate (Pn, μmol m−2 s−1), transpiration rate (Tr, mmol m−2 s−1), stomatal conductance (gs, mol m−2 s−1), and the ratio of interacellular CO2 concentration (Ci, μmol CO2 mol−1) to atmospheric CO2 concentration (Ca, μmol CO2 mol−1) were determined on fully expanded upper leaves with three replications in each treatment using a Portable Photosynthesis System (LI-6400XT, LI-COR Corporation, USA). Measurements were conducted on random sunny days from 7:00 a.m. to 7:00 p.m. every 2 h on 22 July and 7 August in 2016 and 4 July, 11 July, and 9 August in 2017 at the fruit development and ripening stages. Instantaneous water use efficiency (WUEins, mmol mol−1) was defined as the ratio of Pn to Tr and instrinsic water use efficiency (WUEint, μmol mol−1) as the ratio of Pn to gs (Bierhuizen and Slatyer, 1965; Sinclair et al., 1984).
Sap flow rates of tomato plants were measured using dynagages (SGB9, SGB13, Dynamax, USA) during fruit development and ripening stages with Stem Heat Balance (SHB) method. In this method a stem is wrapped in a heater coil emitting a constant energy flux. The supplied energy is dissipated by convection along the stem by sap flow transport. Therefore, by measuring the convective heat fluxes and the energy supply, the rate of water flux along a stem can be calculated (Trambouze and Voltz, 2001). The dynagages were installed on the stems of plants between the third and fourth internode above the soil surface. Leaf branches beneath the fifth internode were removed and plastic film was placed to avoid stem transpiration. A CR1000 data logger (Campbell Scientific, USA) was used to collect data every 30 s and averaged every 15 min. Consequently, hourly sap flow rate per plant (Qh, g h−1) was obtained. Since the CR1000 had eight channels, two plants per treatment of W2/3 treatments were first randomly selected to monitor sap flow during 27 June to 6 July, and two plants per treatment of W1 treatments were then selected from 19 July to 28 July in the 2016 season. In 2017, one plant per treatment was selected for sap flow measurement between 25 June and 30 June.
Three tomato plants for each treatment were harvested on 11 August 2016 and 9 August 2017. All fresh fruits from the three plants in each treatment were collected and yield (Y, g per plant) was recorded using an electronic balance with accuracy of 0.01 g (ME2002E, Mettler Toledo, USA). Roots, stems, and leaves were seperately dried at 75 °C in the oven to the constant weight and dry matter weight was recorded. Water use efficiency at plant scale WUEDM was calculated as the ratio of dry aboveground biomass to irrigation water per plant, and WUEY as fresh yield to irrigation water per plant.
Two-way analysis of variance was performed using SPSS version 23.0 (IBM Statistics) by year to evaluate the effects of irrigation and salt regimes, as well as their interactions on tomato leaf physiology parameters and WUE at different scales. Duncan's multiple range test was used to assess differences between treatments at P = 0.05. Pearson correlation analysis was done for 13 parameters, including WUEDM, WUEY, WUEint, WUEins, Pn, Tr, gs, Ci/Ca, yield, dry aboveground biomass, sap flow rate, irrigation amount, and SSC (Table 4). The values of leaf physiology parameters were daily averages of all measurements.
Principal component analysis (PCA) was used to evaluate the comprehensive WUE at different scales as affected by reduced irrigation and salt stress regimes. The standardized data included WUEDM, WUEY, WUEint, and WUEins. PCA was carried out using correlation matrix of SPSS version 23.0 after the KMO and Bartlett's test, and factors with eigenvalues >1 were retained. Using compute variables module in SPSS, PCs were determined and then maximum and minimum principal component for each treatment were calculated. Finally, a comprehensive score was determined for each treatment; the larger the score, the higher the performance of the treatment (Shukla et al., 2006; Wang et al., 2015).
In the field, Rs ranged from 59.7 W m−2 on cloudy or rainy days to 327.8 W m−2 on sunny days, with an average of 243.1 W m−2 (Figure 1). RH, Ta and VPD varied from 25.3 to 91.6%, from 7.2 to 27.8°C, and from 0.08 to 1.89 kPa, with the averages of 53.0%, 21.0°C and 1.14 kPa, respectively. In the greenhouse, Rs ranged from 28.2 to 305.1 W m−2, with an average of 171.8 W m−2. RH, Ta and VPD varied from 23.7 to 91.4%, from 8.7 to 29.1°C, and from 0.14 to 2.78 kPa, with the averages of 50.0%, 23.7°C and 1.56 kPa, respectively. Variations of daily average SWC in the 0–20 cm soil profile under different irrigation and salt stress treatments during field and greenhouse experiments are presented in Figure 2. In the field experiment of 2016, SWC under W1S9 treatment was higher than W1S6, W1S3, and W1S0 treatments during the whole growth season because plants were severely stressed and uptake was very low. Under reduced irrigation, the variation of SWC among S0, S3, and S6 treatments decreased compared to full irrigation (Figures 2A,B). In the greenhouse experiment of 2017, SWC increased with increasing soil salt content under both full and reduced irrigation (Figures 2C,D).
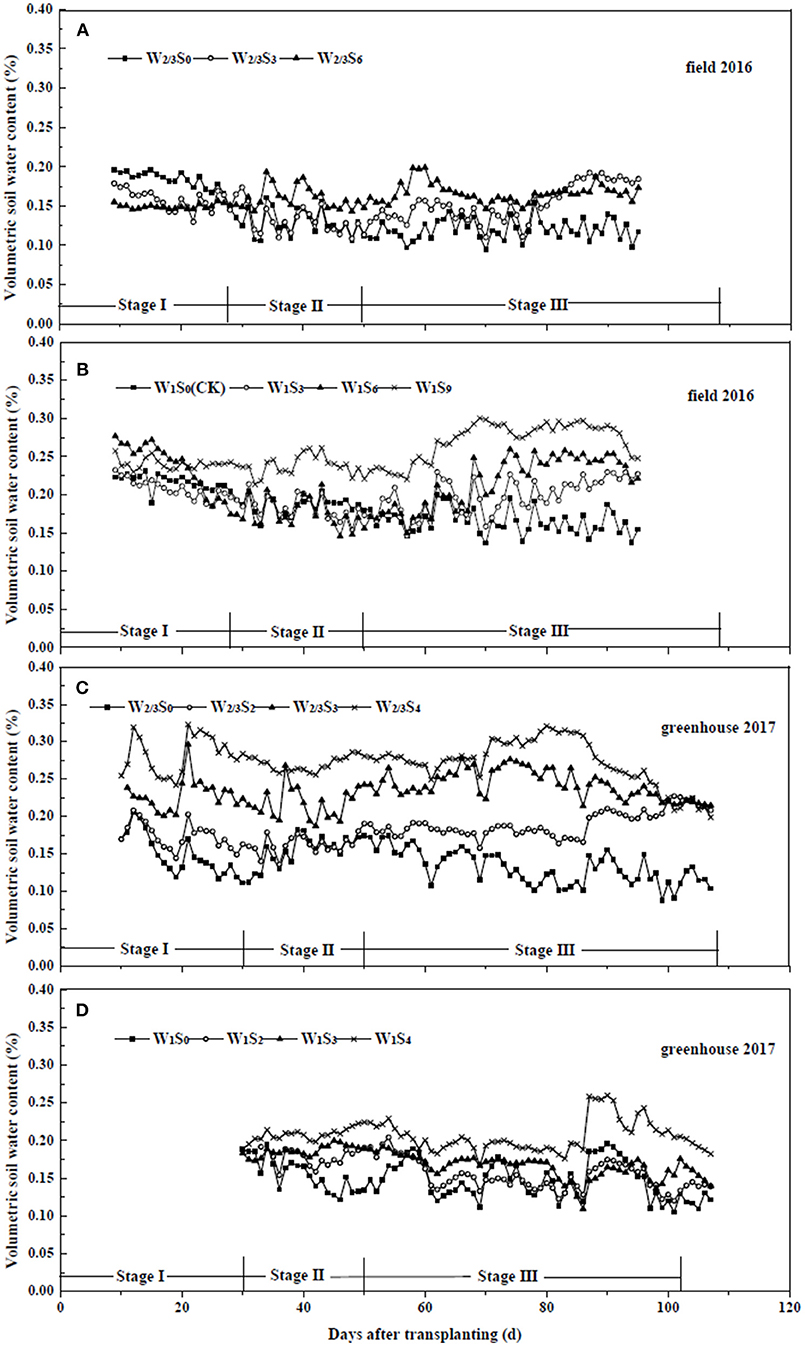
Figure 2. Soil water content of tomato under different water and salt treatments in field experiment of 2016 (A,B) and greenhouse experiment of 2017 (C,D). Stage I: vegetative stage, Stage II: flowering stage, Stage III: fruit development and ripening stage.
In the field experiment of 2016, dry biomass per plant of stem, leaf, root, and total as well as root/shoot ratio were significantly affected by soil salt treatments, while water treatments and the interaction of water and salt had no significant effects. Fresh fruit yield of tomato per plant was influenced by water and salt treatments, and their interaction (Table 3). Increasing soil salt content caused more yield reductions under both irrigation treatments. In the field experiment of 2016, reduced irrigation (W2/3) treatments produced higher yields compared to W1 under S0 and S3 treatments, while W2/3 treatments exacerbated yield reductions under S6 and S9 treatments. In the greenhouse experiment of 2017, since the gradient of soil salt treatments was reduced, salt treatments didnot show significant effects on dry biomass of stem, leaf, root, and root/shoot ratio. Only leaf biomass was affected by water treatments and the interaction of water and salt, and root/shoot ratio was influenced by water treatments. The effect of salt treatments on total biomass per plant was also significant. Yields showed similar trends with those in the field experiment of 2016 under water and salt treatments (Table 3). The proportions of stem, leaf, and root dry matter were about 45.5, 42.9, and 13.4%, respectively (Figure 3).
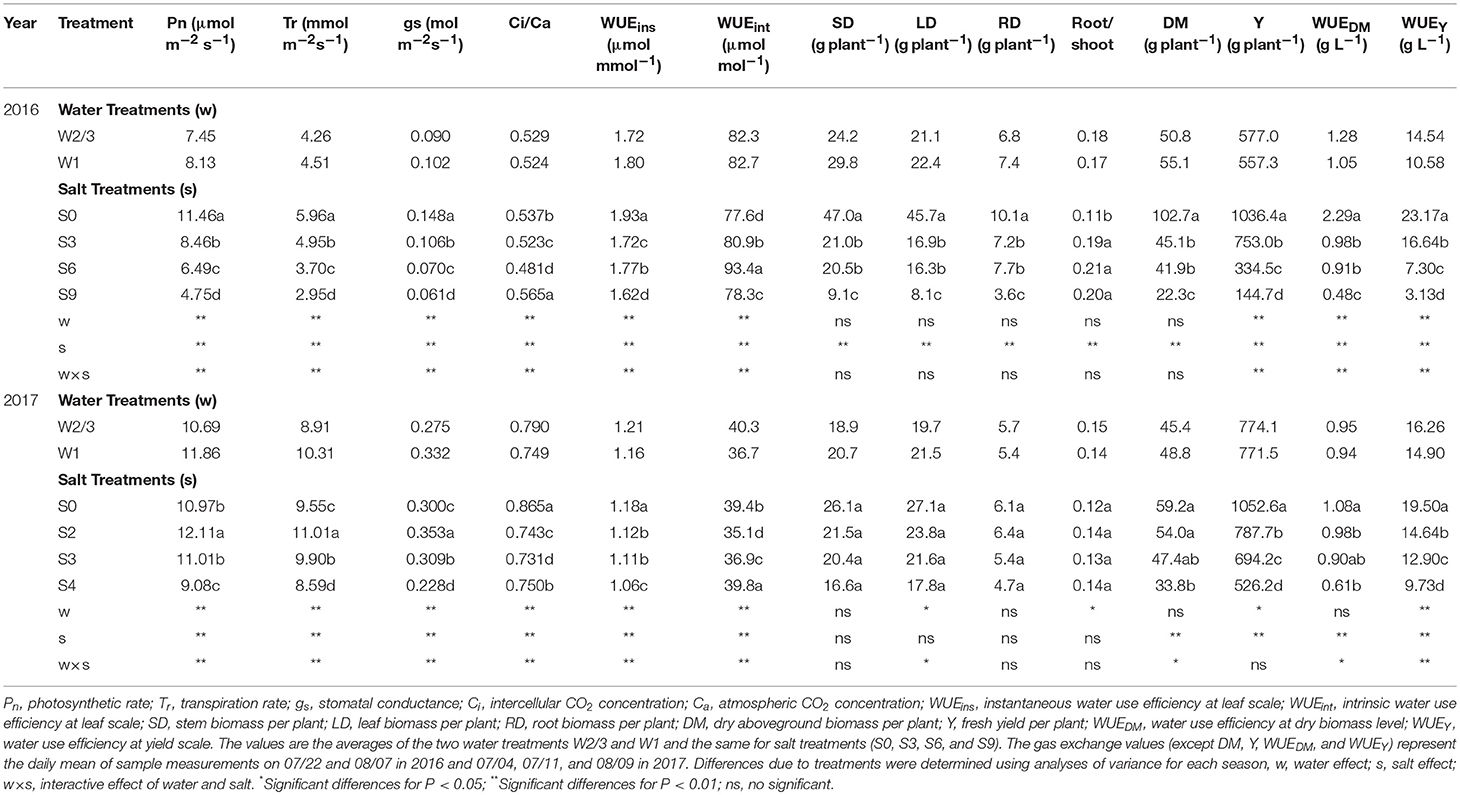
Table 3. Pn, Tr, gs, Ci/Ca, DM, Y, and WUE at different scale of tomato under water and salt treatments at fruit development and ripening stage during 2016–2017.
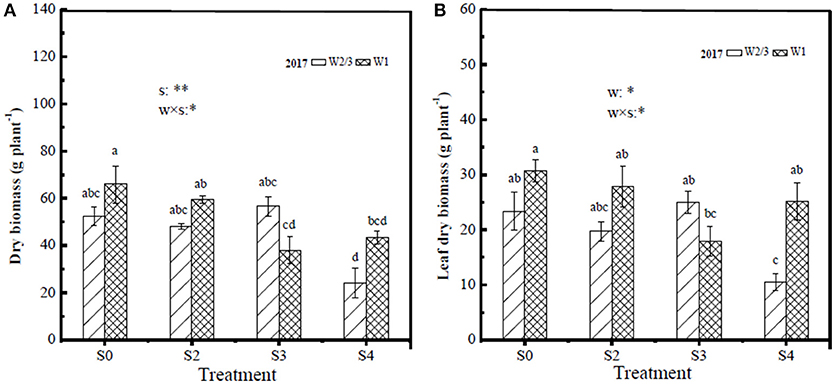
Figure 3. Tomato dry biomass of whole plant (A) and leaf dry biomass (B) under different water and salt treatments at harvest in 2017. Only the positive effects of the interactions (w × s) are showed in the figure, w, water treatments; s, salt treatments, *significant differences for P < 0.05; **significant differences for P < 0.01.
All the gas exchange parameters Pn, Tr, gs, and Ci/Ca were significantly affected by irrigation regimes, salt treatment, and their interactions in both experiments (Table 3). In 2016, Pn and Tr decreased with increasing soil salt stress under both W2/3 and W1 treatments. However, in the greenhouse experiment of 2017, plants grown in salt treatments of S2 and S3 had notably 35.5 and 49.4% higher Pn, respectively, than those grown in S0 treatment under reduced irrigation regime (W2/3). For W1 treatment, highest Pn of 13.30 μmol m−2 s−1 was for S0 treatment (Table 3). Moreover, Tr was significantly positively correlated with Pn and gs and was also notably correlated with Pn and Tr (Table 4). Although irrigation amount and soil salt content notably affected Ci/Ca (Table 3), Pearson correlation coefficients between Ci/Ca, irrigation amount and soil salt content were not significant; Ci/Ca had significant positive correlation with Tr and gs (Table 4).
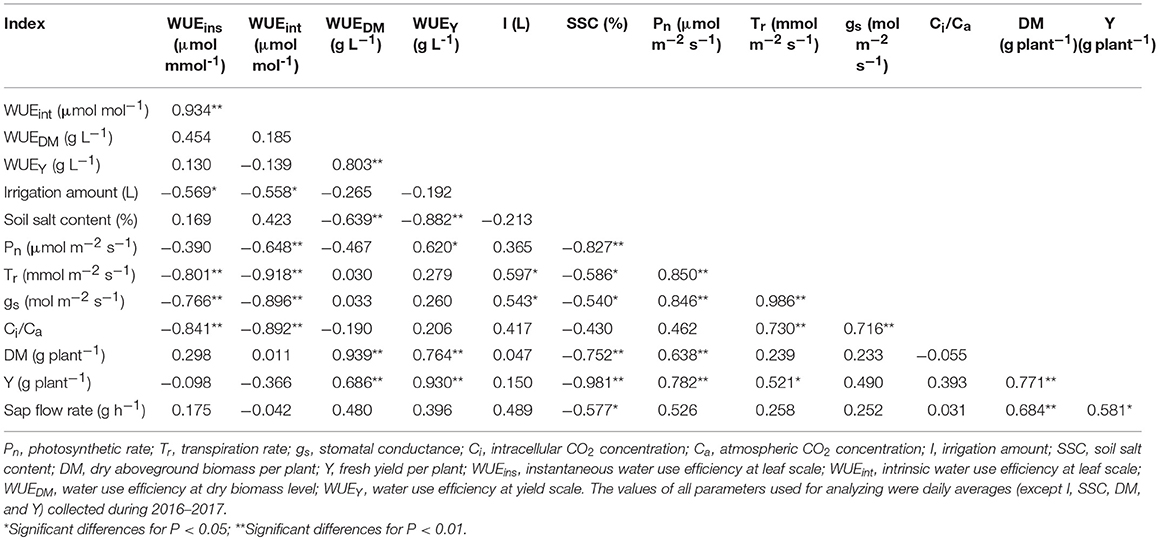
Table 4. Pearson correlation coefficients between WUE at leaf and plant scales and irrigation amount, soil salt content, sap flow rate, leaf physiological parameters, dry matter per plant, and fresh yield per plant.
In 2016, diurnal variations of Pn and gs in S0 treatment under W2/3 and W1 regimes initially showed an increase from 7:00 to 9:00 a.m. and a decrease until 3:00 p.m.; however, multiple peaks were observed around 5:00 p.m., compensation of mild salt stress (S3) in Pn was more obvious than that of S0 (Figures 4A,B,E, F). In 2017, the diurnal variations of gs under various water and salt treatments showed a single-peak curve with the peak occurring at 10:00 a.m. (Figures 5E,F), and Tr remained relatively high between 10:00 a.m. and 2:00 p.m. (Figures 5C,D), which was consistent with the results in the field experiment during 2016 (Figures 4C,D).
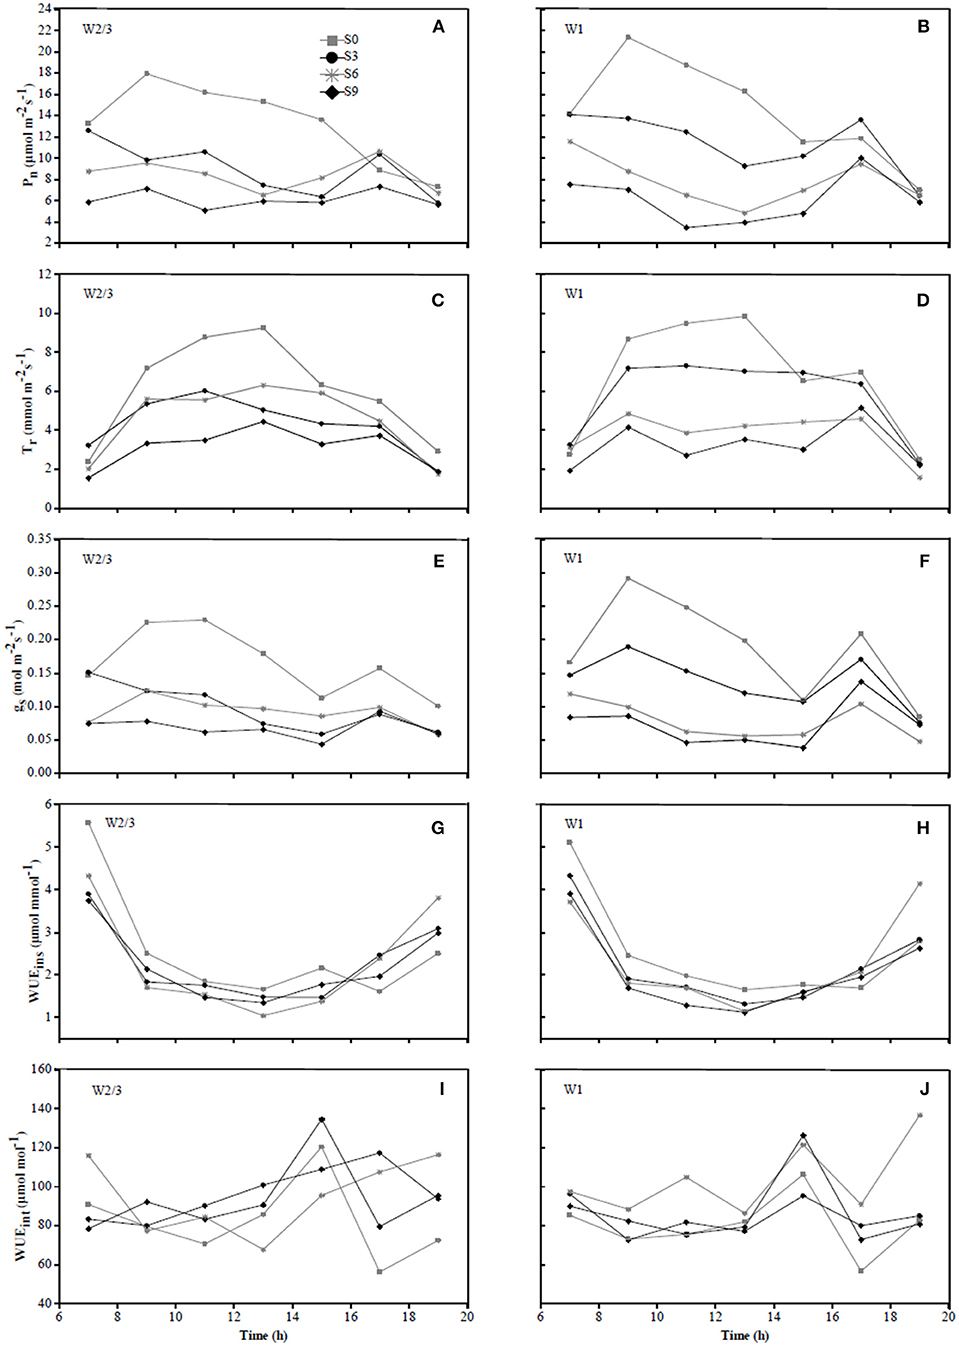
Figure 4. Diurnal variations in photosynthetic rate (Pn) (A,B), transpiration rate (Tr) (C,D), stomatal conductance (gs) (E,F), instantaneous water use efficiency (WUEins) (G,H), and intrinsic water use efficiency (WUEint) (I,J) of tomato under different water treatments at fruit ripening stage (date 07/22) in 2016.
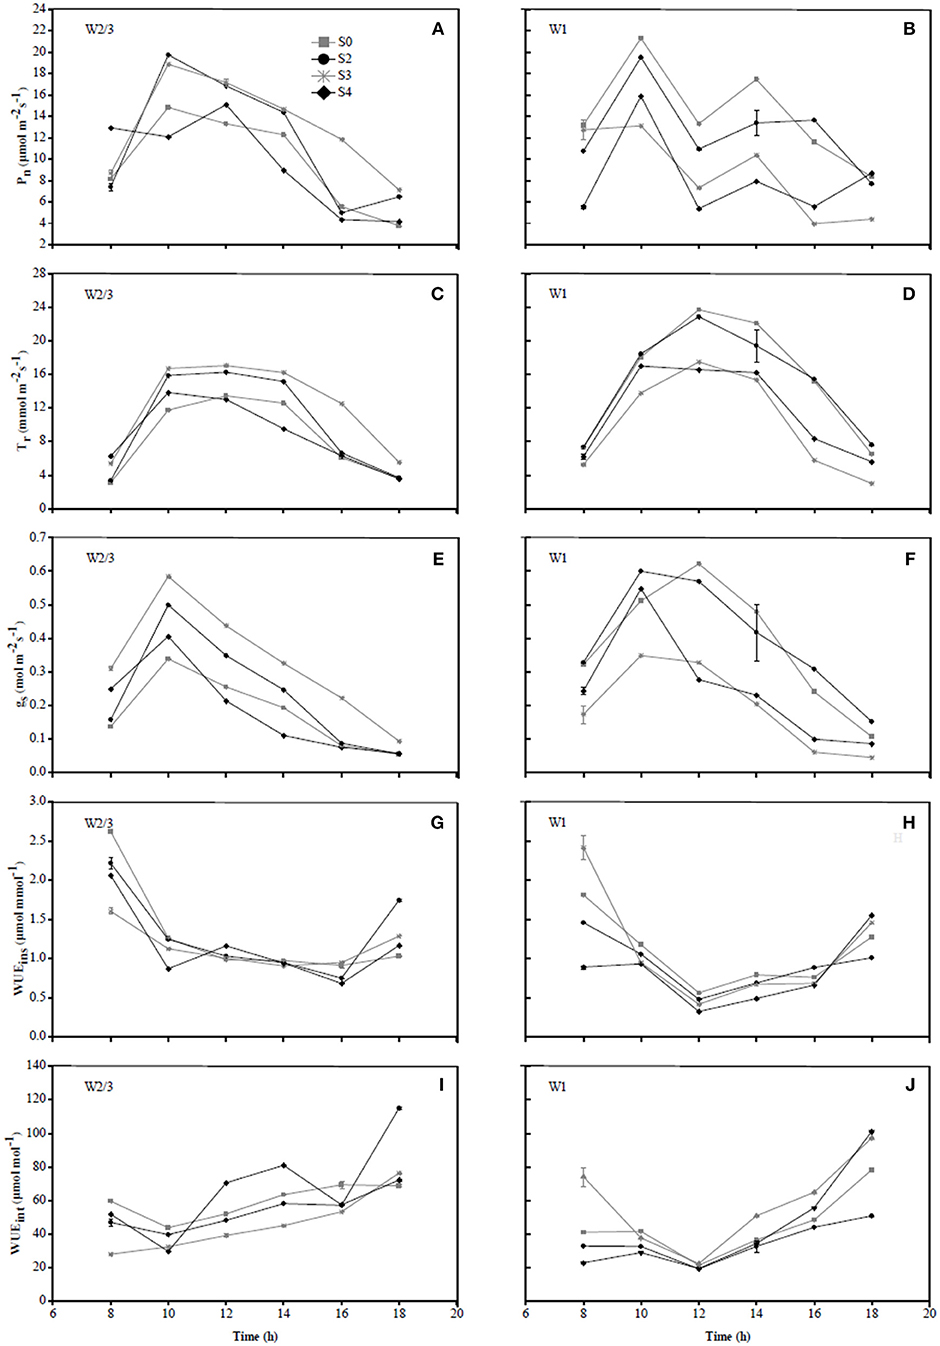
Figure 5. Diurnal variations in photosynthetic rate (Pn) (A,B), transpiration rate (Tr) (C,D), stomatal conductance (gs) (E,F), instantaneous water use efficiency (WUEins) (G,H), and intrinsic water use efficiency (WUEint) (I,J) of tomato under different water treatments at fruit ripening stage (date 07/11) in 2017.
The daily variations of sap flow rate per plant under irrigation and salt treatments varied diurnally. Sap flow increased significantly from early morning (7:00 a.m.), reached the maximum around noon, but notably decreased after 4:00 p.m., with no sap flow measured at 9:00 p.m. (Figures 6, 7) in both experiments. In the field experiment, increases in sap flow in the morning were significantly delayed with increasing soil salt content, maximum sap flow was much lower than that in S0, and sap flow stopped earlier in the night (Figures 6C,D). The diurnal variations in sap flow under various water and salt treatments showed a single-peak curve, and sap flow rate was smaller throughout the day with increasing soil salt content under both W2/3 and W1 treatments (Figures 6C,D,G,H). In the greenhouse experiment, however, diurnal variations in sap flow showed a peak around noon, and another small peak was observed at 6:00 p.m. W1S2 treatment showed a relatively higher sap flow throughout the day, following the W1S3 and W2/3S0 treatments. Soil salt content significantly decreased daily sap flow (Table 4). The daily variation of sap flow rate per plant ranged from 7.96 to 31.37 g h−1 in the field experiment and from 12.52 to 36.02 g h−1 in the greenhouse experiment among various salt stresses.
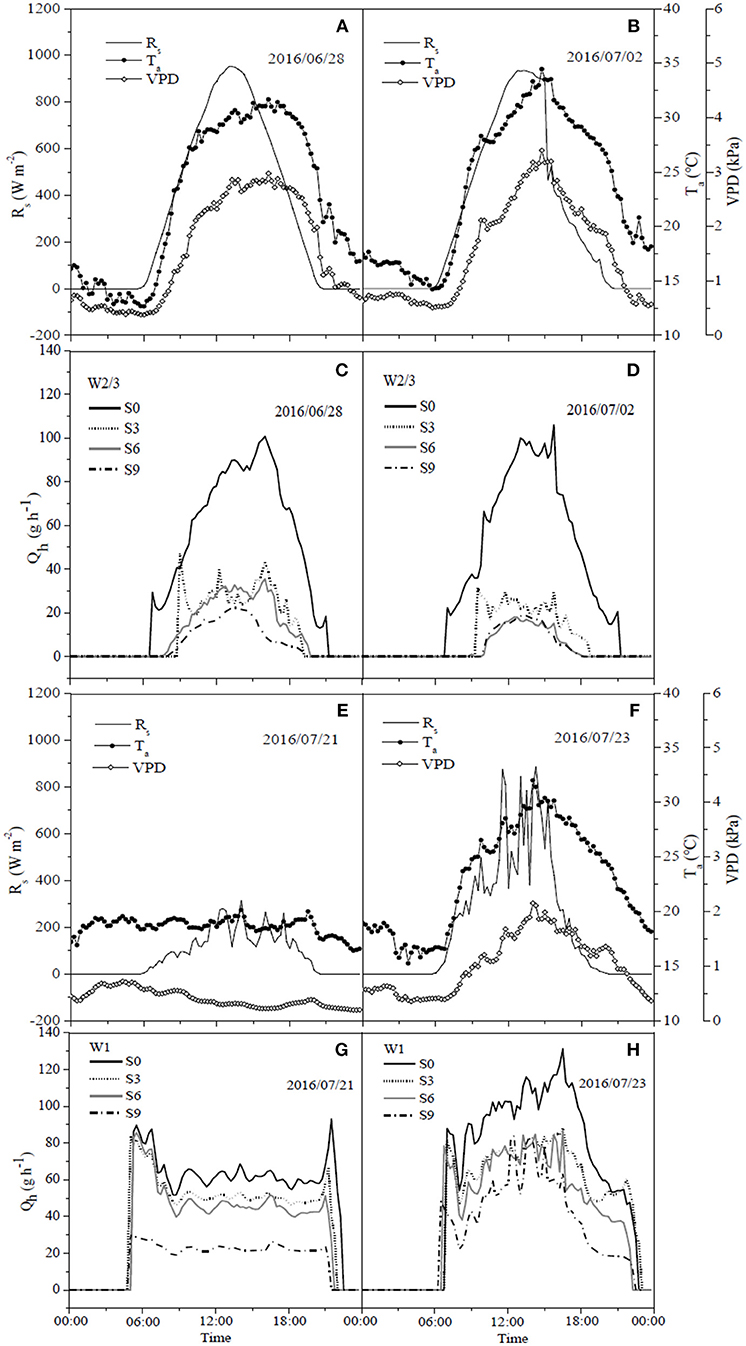
Figure 6. Diurnal dynamics of hourly sap flow rate per plant (Qh) (C,D,G,H) in tomato and corresponding solar radiation (Rs), air temperature (Ta) and vapor pressure deficit (VPD) (A,B,E,F) under different water and salt treatments in 2016.
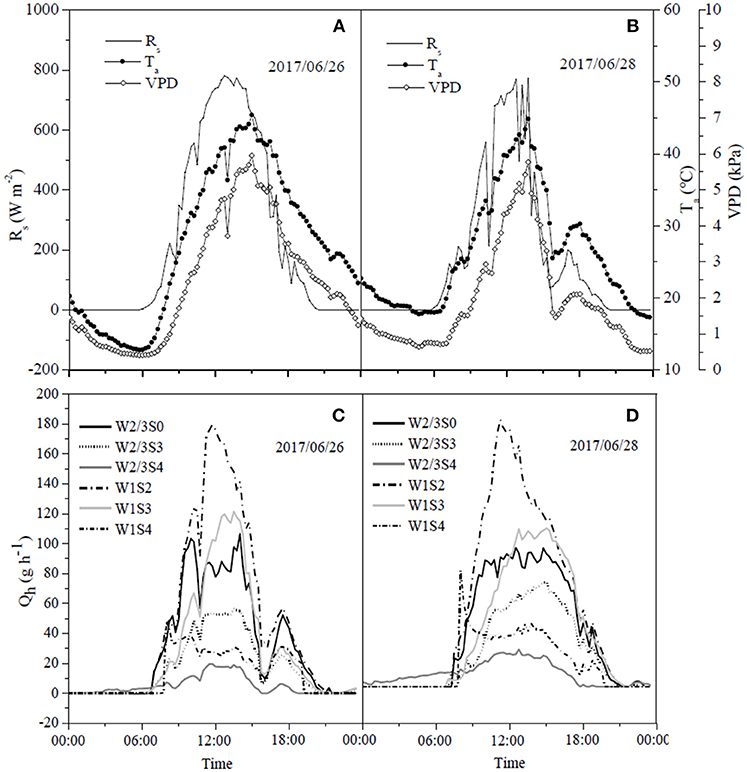
Figure 7. Diurnal dynamics of hourly sap flow rate per plant (Qh) (C,D) in tomato and corresponding solar radiation (Rs), air temperature (Ta), and vapor pressure deficit (VPD) (A,B) under different water and salt treatments in 2017.
The relationships between sap flow rates and climate variables under different irrigation and salt treatments at fruit development and ripening stage were established in the field and greenhouse experiments. The significant level of regression coefficients was less than 0.01, and the most of correlation coefficients (R2) were higher than 0.5 (Table 5). In 2016, sap flow rate under W2/3 treatments increased linearly with increasing Rs, Ta, and VPD (R2 > 0.5). In 2017, sap flow also showed a positive correlation with Rs, Ta, and VPD under various water and salt treatments except W2/3S4 treatment (R2 = 0.41 for Ta and 0.46 for VPD) (Table 5). The different regression equations indicated that the sensitivity of sap flow rates to climate variables varied with the irrigation regimes and salt treatments. In both experiments, the slopes of regression equations in no salt treatments (W2/3S0 and W1S0) were higher than those in salt stress treatments. The average R2 between Ta and VPD were lower due to the lagging effects on sap flow rates (Figures 6, 7). The climate variables affecting sap flow rates were ranked as Rs > VPD>Ta.
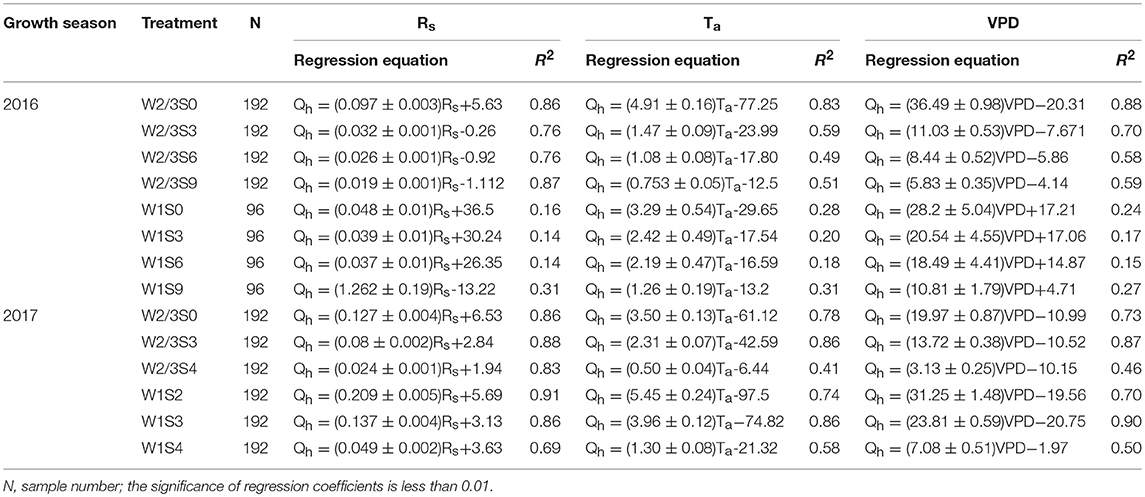
Table 5. Relationships between sap flow rates (Qh, g h−1) every 15 min and corresponding solar radiation (Rs, W m−2), air temperature (Ta, °C), and vapor pressure (VPD, kPa) deficit under different irrigation and salt stress treatments during 2016 and 2017 seasons.
Irrigation and soil salt treatments, and their interactive effects on tomato WUEins and WUEint at leaf scale, were significant during both field and greenhouse experiments (Table 4). In the field experiment of 2016, WUEins ranged from 1.50 to 1.95 μmol mmol−1, while WUEint ranged from 74.5 to 98.9 μmol mol−1 under different water and salt treatments. Under full and reduced irrigation, increasing salt stress decreased Pn and Tr and led to the reductions in WUEins at the leaf scale. However, compared to full irrigation, reduced irrigation (W2/3) improved WUEins with a significant decline in gs and Tr under no salt and 0.3% soil salt treatments. Under soil salt content of 0.6% and 0.9%, a slight increase in Pn and decline in Tr resulted in higher WUEins in the full irrigation treatment. Significant reduction in gs led to increasing WUEint under S3 and S6 treatments compared to S0 treatment under both irrigations; however, further increases in soil salt content to 0.9% decreased the WUEint.
In the greenhouse experiment of 2017, WUEins and WUEint varied from 0.95 to 1.28 μmol mmol−1 and from 30.3 to 46.7 μmol mol−1, respectively. Compared to full irrigation, WUEint under reduced irrigation was higher under no salt and 0.2% soil salt treatment in 2016, and WUEDM and WUEY of tomato at whole plant scale were also significantly affected by irrigation regime, soil salt content, and their interaction in 2016 (Table 4), while in 2017, the effect of irrigation regime on WUEDM was not significant. In the field experiment of 2016, increasing soil salt content decreased plant dry biomass and yield, and resulted in greater decreases in whole plant WUEDM and WUEY under both irrigation treatments. Compared to full irrigation, reduced irrigation increased both WUEDM and WUEY under 0 and 0.3% soil salt treatments. In the greenhouse experiment of 2017, WUEDM in W2/3S4 treatment was significantly lower than that in W2/3S0 treatment. WUEY decreased with increasing soil salt content under both irrigation treatments. WUEY under reduced irrigation was higher compared to full irrigation under 0, 0.2, 0.3, and 0.4% soil salt treatments.
The results of PCA evaluation of tomato WUE at leaf and plant scales among all the treatments in the field and greenhouse experiments are shown in Figure 8. The index y represents closeness of principal component of the treatment to the maximum principal; the larger the index value, the better the performance of the treatment. The PCA analysis showed that plants grown under both full and reduced irrigation with zero soil salt content (W2/3S0 and W1S0) had optimal comprehensive WUE with the highest y values of 0.743 and 0.569 in the field experiment of 2016. W2/3S0 and W2/3S2 treatments ranked first and second in the greenhouse experiment of 2017, with y values of 0.953 and 0.670, respectively.
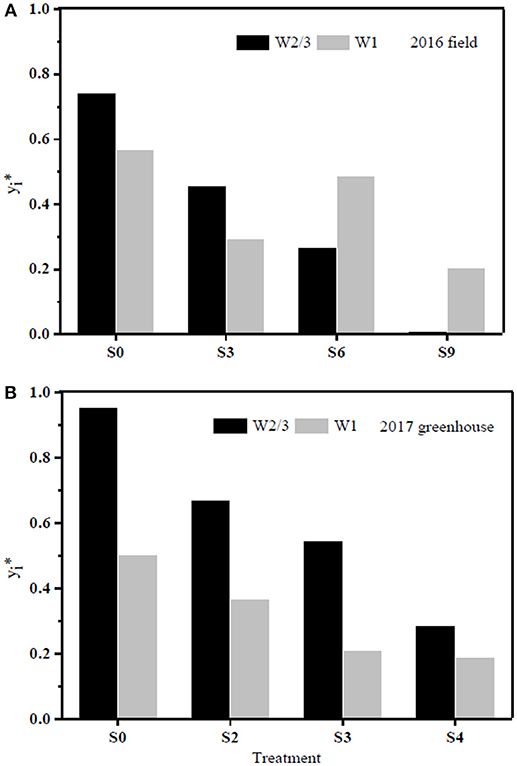
Figure 8. PCA evaluation of tomato water use efficiency (WUE) at leaf and plant scales (four parameters: WUEins, WUEint, WUEDM, and WUEY) among all the treatments during 2016 (A) and 2017 (B), respectively. y represents closeness of principal component of each treatment to the maximum principal.
It has been suggested that high soil salt content reduces plant water uptake (Reina-Sánchez et al., 2005; Machado and Serralheiro, 2017; Phogat et al., 2018), which supported our result where root zone soil water content remained higher in containers with higher soil salt content in both reduced and full irrigation treatments during both years (Figure 2). Our results were also consistent with Reina-Sánchez et al. (2005) who reported that tomato plants grown under 75 mM NaCl consumed 40% less water than plants under non-saline condition. Several mechanisms are responsible for this decrease, including modulation of underlying growth mechanisms. Saline growth medium adversely affects plant growth due to low soil osmotic potential (high osmotic stress), resulting in lower leaf and root water potentials, relative water content, and plant dehydration (Ashraf, 2004; Maggio et al., 2004). Salinity-induced ion toxicity, macro and micro nutrient deficiency (such as N, Ca, K, P, Fe, and Zn), as well as oxidative stresses on plants also limit water uptake from soil (Shrivastava and Kumar, 2015).
In this study, dry aboveground tomato biomass per plant was prominently affected by soil salt content, while the effect of irrigation was non-significant in both field and greenhouse experiments (Table 3). These results contrasted with those of Álvarez et al. (2018). A likely explanation is that the Álvarez et al. (2018) experiments were conducted under simulated conditions of soil cultivation and were irrigated with different levels of saline solutions. Uptake and transport rates of saline ions from root to shoot differ when plants are subjected to nutritive solution and multiple salts (Albaladejo et al., 2017) due to the competition among ions (i.e., K+, Ca2+, NO Na+, Cl−, and SO) (Hu and Schmidhalter, 2005; Hussain et al., 2016). Most vegetable crops, including tomato, had a salinity threshold of 2.5 dS m−1 (Machado and Serralheiro, 2017). However, in this study, 32.9 and 20.7% yield reductions were observed at the EC of 1.03 dS m−1 for soil salt content of 0.3% under 2/3 of full irrigation and full irrigation, respectively, in the field experiment, and 23.6 and 26.7% at the EC of 0.81 dS m−1 for soil salt content of 0.2% under 2/3 of full irrigation and full irrigation, respectively, in the greenhouse experiment. Thus, the salinity threshold in this study was at or below 0.81 dS m−1. This difference could result from species and different saline ions in solution and in the soil, suggesting that multiple salts in soil could further aggravate the adverse effect of salt stress on plants.
Previous studies have observed that reduced irrigation could enhance plant water use efficiency because of only slight decreases in yield but moderate declines in water application as compared to full irrigation (Kang et al., 2002, 2017; Du et al., 2010; Patanè et al., 2011; Yang et al., 2017). This study clearly illustrated that reduced irrigation improved plant yield and dry biomass WUE (WUEY and WUEDM) under low soil salt content (SSC ≤ 0.3%) in both experiments (Table 3). However, in 2016, WUEY and WUEDM decreased with further increases in soil salt content (SSC ≥ 0.9%) due to the significant reduction of yield and dry biomass. Khataar et al. (2018) results for wheat WUE were similar to this study under low salinities (EC ≤ 8 dS m−1). However, Khataar et al. (2018) reported that bean WUE increased with increasing water and salt stresses and contradicted our results for tomato at higher soil salt content.
Tomato Pn, yield, dry biomass, WUEY, and WUEDM decreased with increasing soil salt content under both full and reduced irrigation during the field experiment (Table 3), indicating the source-sink relationships in which the source organ (leaves) gained the assimilation product through photosynthesis and delivered it to the sink organ (fruits) (Liu et al., 2017). Inverse relationships between Pn and increasing salt stress are also reported by other researchers (Netondo et al., 2004; Chaves et al., 2009; Senguttuvel et al., 2014; Das et al., 2015; Negrão et al., 2017).
Stomata control, both water losses and CO2 assimilation, is a vital mechnism for plant acclimation to varying environments. Abiotic stress could suppress cell growth and photosynthesis (Wilkinson and Davies, 2002; Liu et al., 2006; Zhang et al., 2015; Álvarez et al., 2018). On the other hand, Galmés et al. (2007) reported that limited recovery of leaf hydraulic conductivity of some species after re-watering could also cause down-regulation of stomatal conductance. In addition, sodium, which was added to soil in this study, disturbs stomatal regulation by interfering with potassium uptake and transport (Farooq et al., 2015). Photosynthesis is affected by changes in stomatal conductance through the pathways noted above. All these are in good agreement with the present study, which found that gs was significantly positively correlated to Pn as well as Tr (Table 4) under various water and salinity conditions.
Wei et al. (2018) reported that reduced irrigation improved WUEins and WUEint of tomato with significant decrease in gs and Tr at leaf scale. However, the effects of salt stress and the interaction of water and salt stresses on tomato WUE at leaf scale are still unknown. In the present study, salt stress reduced WUEins under both irrigation treatments; WUEins and WUEint improved under reduced irrigation compared to full ittigation when soil salt content was less than 0.4%. Both water and salt treatments together with their interaction had significant effects on WUEins and WUEint in both experiments (Table 3). In the field experiment of 2016, WUEins and WUEint of tomato increased under S6 and S9 salt treatments compared to S0 and S3 treatments only when full irrigation was applied, indicating that gs and Tr were more sensitive to drought and salinity than Pn. Diurnal variation of WUEins in Figures 4, 5 showed that WUEins in various water regimes and soil salt contents were relatively high in the morning and late afternoon, while it remained low from 10:00 a.m. until 4:00 p.m. during both years. In contrast, diurnal variation of WUEint remained inconsistent during 2016 as well as 2017. The ratio of Ci to Ca is characteristically near 0.7 for non-stressed C3 plants (Farquhar et al., 1989). Lower Ci:Ca ratios resulting from either lower stomatal conductance or higher photosynthetic capacity could improve plant WUEint (Condon et al., 2002). Our study found that the value of Ci:Ca ranged from 0.5 to 0.6 in 2016, whereas it was near 0.7 in 2017 (except W2/3S0 treatment) (Table 3). Lower Ci:Ca ratios were in accord with positive correlations with Tr and gs.
Liu et al. (2010) reported that on sunny days sap flow showed a single-peaked curve starting at 6:00 a.m., rapidly increased to the maximum at 1:00 p.m. with increasing Rs and VPD, and decreased after 2:00 p.m. On cloudy days, sap flow exhibited a multimodal curve corresponding to the variation of Rs, and there was no flow during the night. In our field experiment, the sap flow also began at 6:00 a.m., but the maximum was reached at around 3:00 p.m. (Figures 6C,D). Differences in these studies are mostly due to the different atmospheric conditions (Rs, VPD, and Ta). In the greenhouse experiment, sap flow exhibited a double-peaked curve with the maximum around 12:00 a.m., and the second small peak appeared at 5:30 p.m. (Figures 7C,D), which was affected by the variation of daily Rs, Ta, and VPD (Figures 7A,B). Rs, VPD, and Ta had positive linear relationships with sap flow, and the three variables affecting sap flow were ranked as Rs >VPD>Ta (Table 5) in both experiments, which was in good agreement with Liu et al. (2010) for tomato and Jiang et al. (2016) for maize.
The sap flow in our study also showed a multimodal curve on cloudy days (Figure 6G). It has been reported that reduced irrigation restricted tomato sap flow (Liu et al., 2010; Qiu et al., 2015; Mao et al., 2017), whereas our study found that sap flow was significantly related to soil salt content, and salt stress prominently decreased sap flow rate and delayed start in the morning (Table 4 and Figures 6C,D). The daily variation of sap flow was possibly caused by decreasing plant size and leaf area with increasing salt stress. This result was supported by the significant positive Pearson correlation between daily sap flow rate, dry matter, and fresh yield per plant (Table 4). PCA approach is an effective tool for simplifying data sources, which can realize the accurate and comprehensive assessment of variance source after the feature extraction and dimensionality reduction. In the present study, the PCA appraisement of integrated WUE attributes of tomato grown under water and salt stress included four parameters (WUEins and WUEint at leaf level and WUEY and WUEDM at plant level). Reduced irrigation in the absence of salt stress (W2/3S0 treatments) achieved the highest comprehensive WUE among all the treatments both in 2016 and 2017; in addition, 2/3 of full irrigation combined with mild salt stress (soil salt content of 0.2%) showed a relative higher integrated WUE in 2017 (Figure 8).
This study is important for regulating water-saving strategies for saline soil environments and improving water use efficiency at various scales 2/3 of full irrigation coupled with low soil salt contents (SSC ≤ 0.3%) improved WUEY and WUEDM at the plant level, but WUEY and WUEDM decreased under the salt stress of 0.6 and 0.9%. Plants irrigated with full irrigation compensated for salt stress and maintained yield and dry biomass. 2/3 of full irrigation in the absence of salt stress improved Pn and reduced Tr, leading to the highest WUEins at leaf level. Moderate salt stress (SSC ≤ 0.6%) improved WUEint at leaf level under both irrigation regimes. The PCA analysis showed that 2/3 of full irrigation without salt stress possessed the highest integrated WUE among all the treatments in both years; reduced irrigation coupled with mild salt stress (SSC = 0.2%) also achieved a relative higher comprehensive WUE in 2017. Soil salt content threshold for tomato caused by multiple salts was found to be below 0.2% and is lower than thresholds reported for nutrient solution.
HY carried out the experiments and finished the first manuscript. MS and TD supervised the work. XM and SK helped to edit the manuscript.
This research received grants from the National Natural Science Foundation of China (51725904, 51621061, 51861125103), and the Discipline Innovative Engineering Plan (111 Program, B14002).
The authors declare that the research was conducted in the absence of any commercial or financial relationships that could be construed as a potential conflict of interest.
The authors thank New Mexico State University Agricultural Experiment Station. The authors also thank Mr. Franklin Sholedice of New Mexico State University for editing the manuscript.
Ahmed, I. M., Dai, H., Zheng, W., Cao, F., Zhang, G., Sun, D., et al. (2013). Genotypic differences in physiological characteristics in the tolerance to drought and salinity combined stress between Tibetan wild and cultivated barley. Plant Physiol. Biochem. 63, 49–60. doi: 10.1016/j.plaphy.2012.11.004
Albaladejo, I., Meco, V., Plasencia, F., Flores, F. B., Bolarin, M. C., and Egea, I. (2017). Unravelling the strategies used by the wild tomato species Solanum pennellii to confront salt stress: from leaf anatomical adaptations to molecular responses. Environ. Exp. Bot. 135, 1–12. doi: 10.1016/j.envexpbot.2016.12.003
Álvarez, S., Rodríguez, P., Broetto, F., and Sánchez-Blanco, M. J. (2018). Long term response and adaptive strategies of Pistacia Lentiscus under moderate and severe deficit irrigation and salinity: osmotic and elastic adjustment, growth, ion uptake and photosynthetic activity. Agric. Water Manage. 202, 253–262. doi: 10.1016/j.agwat.2018.01.006
Ashraf, M. (2004). Some important physiological selection criteria for salt tolerance in plants. Flora 199, 361–376. doi: 10.1078/0367-2530-00165
Baath, G. S., Shukla, M. K., Bosland, P. W., Steiner, R. L., and Walker, S. J. (2017). Irrigation water salinity influences at various growth stages of Capsicum annuum. Agric. Water Manage. 179, 246–253. doi: 10.1016/j.agwat.2016.05.028
Bierhuizen, J. F., and Slatyer, R. O. (1965). Effect of atmospheric concentration of water vapour and CO2 in determining transpiration-photosynthesis relationships of cotton leaves. Agric. Meteorol. 2, 259–270. doi: 10.1016/0002-1571(65)90012-9
Chaves, M. M., Flexas, J., and Pinheiro, C. (2009). Photosynthesis under drought and salt stress: regulation mechanisms from whole plant to cell. Ann. Bot. 103, 551–560. doi: 10.1093/aob/mcn125
Chen, J. L., Kang, S. Z., Du, T. S., Qiu, R. J., Guo, P., and Chen, R. Q. (2013). Quantitative response of greenhouse tomato yield and quality to water deficit at different growth stages. Agric. Water Manage. 129, 152–162. doi: 10.1016/j.agwat.2013.07.011
Condon, A. G., Richards, R. A., Rebetzke, G. J., and Farquhar, G. D. (2002). Improving intrinsic water use efficiency and crop yield. Crop Sci. 42, 122–131. doi: 10.2135/cropsci2002.1220
Cosić, M., Djurović, N., Todorović, M., Maletić, R., Zećević, B., and Strićević, R. (2015). Effect of irrigation regime and application of kaolin on yield, quality and water use efficiency of sweet pepper. Agric. Water Manage. 159, 139–147. doi: 10.1016/j.agwat.2015.05.014
Das, P., Nutan, K. K., Singla-Pareek, S. L., and Pareek, A. (2015). Understanding salinity responses and adopting ‘omics-based' approaches to generate salinity tolerant cultivars of rice. Front. Plant Sci. 6:712. doi: 10.3389/fpls.2015.00712
De Swaef, T., and Steppe, K. (2010). Linking stem diameter variations to sap flow, turgor and water potential in tomato. Funct. Plant Biol. 37, 429–438. doi: 10.1071/FP09233
Deb, S. K., Sharma, P., Shukla, M. K., and Sammis, T. W. (2013). Drip-irrigated pecan seedling response to irrigation water salinity. Hortscience 48, 1548–1555. doi: 10.21273/HORTSCI.48.12.1548
Du, T. S., Kang, S. Z., Sun, J. S., Zhang, X. Y., and Zhang, J. H. (2010). An improved water use efficiency of cereals under temporal and spatial deficit irrigation in north China. Agric. Water Manage. 97, 66–74. doi: 10.1016/j.agwat.2009.08.011
Du, T. S., Kang, S. Z., Zhang, J. H., and Davies, W. (2015). Deficit irrigation and sustainable water-resource strategies in agriculture for China's food security. J. Exp. Bot. 66, 2253–2269. doi: 10.1093/jxb/erv034
Farooq, M., Hussain, M., Wakeel, A., and Siddique, K. H. M. (2015). Salt stress in maize: effects, resistance mechanisms, and management. A review. Agron. Sustain. Dev. 35, 461–4811. doi: 10.1007/s13593-015-0287-0
Farquhar, G. D., Ehleringer, J. R., and Hubick, K. T. (1989). Carbon isotope discrimination and photosynthesis. Annu. Rev. Plant Physiol. Plant Mol. Biol. 40, 503–537. doi: 10.1146/annurev.pp.40.060189.002443
Farquhar, G. D., and Sharkey, T. D. (1982). Stomatal conductance and photosynthesis. Annu. Rev. Plant Physiol. 33, 317–345. doi: 10.1146/annurev.pp.33.060182.001533
Flores, A., Shukla, M. K., Daniel, D., Ulery, A., Schutte, B., Pichionni, G., et al. (2016). Evapotranspiration changes with irrigation using saline groundwater and RO concentrate. J. Arid Environ. 131, 35–45. doi: 10.1016/j.jaridenv.2016.04.003
Flores, A., Shukla, M. K., Schutte, B., Picchioni, G., and Daniel, D. (2017). Physiologic response of six plant species grown in two contrasting soils and irrigated with brackish groundwater and RO concentrate. Arid Land Res. Manage. 31, 182–203. doi: 10.1080/15324982.2016.1275068
Galli, V., Messias, R. D. S., Perin, E. C., Borowski, J. M., Bamberg, A. L., and Rombaldi, C. V. (2016). Mild salt stress improves strawberry fruit quality. LWT 73, 693–699. doi: 10.1016/j.lwt.2016.07.001
Galmés, J., Flexas, J., Savé, R., and Medrano, H. (2007). Water relations and stomatal characteristics of Mediterranean plants with different growth forms and leaf habits: responses to water stress and recovery. Plant Soil 290, 139–155. doi: 10.1007/s11104-006-9148-6
Hu, Y., and Schmidhalter, U. (2005). Drought and salinity: a comparison of their effects on mineral nutrition of plants. J. Plant Nutr. Soil Sci. 168, 541–549. doi: 10.1002/jpln.200420516
Hussain, M. I., Lyra, D. A., Farooq, M., Nikoloudakis, N., and Khalid, N. (2016). Salt and drought stresses in safflower: a review. Agron. Sustain. Dev. 36:4. doi: 10.1007/s13593-015-0344-8
Jiang, X. L., Kang, S. Z., Li, F. S., Du, T. S., Tong, L., and Comas, L. (2016). Evapotranspiration partitioning and variation of sap flow in female and male parents of maize for hybrid seed production in arid region. Agric. Water Manage. 176, 132–141. doi: 10.1016/j.agwat.2016.05.022
Kang, S. Z., Hao, X. M., Du, T. S., Tong, L., Su, X. L., Lu, H. N., et al. (2017). Improved agricultural water productivity to ensure food security in China under changing environment: from research to practice. Agric. Water Manage. 179, 5–17. doi: 10.1016/j.agwat.2016.05.007
Kang, S. Z., Zhang, L., Liang, Y. L., Hu, X. T., Cai, H. J., and Gu, B. J. (2002). Effects of limited irrigation on yield and water use efficiency of water wheat in the Loess Plateau of China. Agric. Water Manage. 55, 203–216. doi: 10.1016/S0378-3774(01)00180-9
Katerji, N., Mastrorilli, M., Lahmer, F. Z., Maalouf, F., and Oweis, T. (2011). Faba bean productivity in saline-drought conditions. Eur. J. Agron. 35, 2–12. doi: 10.1016/j.eja.2011.03.001
Khataar, M., Mohhamadi, M. H., and Shabani, F. (2018). Soil salinity and matric potential interaction on water use, water use efficiency and yield response factor of bean and wheat. Sci. Rep. 8:2679. doi: 10.1038/s41598-018-20968-z
Liu, F. L., Shahnazari, A., Andersen, M. N., Jacobsen, S. E., and Jensen, C. R. (2006). Physiological response of potato (Solanum tuberosum L.) to partial root-zone drying: ABA signaling, leaf gas exchange, and water use efficiency. J. Exp. Bot. 57, 3727–3735. doi: 10.1093/jxb/erl131
Liu, H., Sun, J. S., Duan, A. W., Liu, Z. G., and Liang, Y. Y. (2010). Experiments on variation of tomato sap flow under drip irrigation conditions in greenhouse. Trans. CSAE 26, 77–82. doi: 10.3969/j.issn.1002-6819.2010.10.012
Liu, Y., Li, P., Xu, G. C., Xiao, L., Ren, Z. P., and Li, Z. B. (2017). Growth, morphological, and physiological responses to drought stress in bothriochloa ischaemum. Front. Plant Sci. 8:230. doi: 10.3389/fpls.2017.00230
Machado, R. M. A., and Serralheiro, R. P. (2017). Soil Salinity: effect on vegetable crop growth. Management practices to prevent and mitigate soil salinization. Horticulturae 3:30. doi: 10.3390/horticulturae3020030
Maggio, A., De Pascale, S., Angelino, G., Ruggiero, C., and Barbieri, G. (2004). Physiological response of tomato to saline irrigation in long-term salinized soils. Eur. J. Agron. 21, 149–159. doi: 10.1016/S1161-0301(03)00092-3
Mao, H. P., Ikram, U., Ni, J. H., Qaiser, J., and Ahmad, A. (2017). Estimating tomato water consumption by sap flow measurement in response to water stress under greenhouse conditions. J. Plant Interact. 12, 402–413. doi: 10.1080/17429145.2017.1373869
Martínez, J. P., Silva, H., Ledent, J. F., and Pinto, M. (2007). Effect of drought stress on the osmotic adjustment, cell wall elasticity and cell volume of six cultivars of common beans (Phaseolus vulgaris L.). Eur. J. Agron. 26, 30–38. doi: 10.1016/j.eja.2006.08.003
Mittler, R. (2006). Abiotic stress, the field environment and stress combination. Trends Plant Sci. 11, 15–19. doi: 10.1016/j.tplants.2005.11.002
Munns, R. (2002). Comparative physiology of salt and water stress. Plant Cell Environ. 25, 239–250. doi: 10.1046/j.0016-8025.2001.00808.x
Negrão, S., Schmöckel, S. M., and Tester, M. (2017). Evaluating physiological response of plants to salinity. Ann. Bot. 119, 1–11. doi: 10.1093/aob/mcw191
Netondo, G. W., Onyango, J. C., and Beck, E. (2004). Sorghum and Salinity: II. Gas exchange and chlorophyll fluorescence of sorghum under salt stress. Crop Sci. 44, 806–811. doi: 10.2135/cropsci2004.8060
Niu, S. L., Xing, X. R., Zhang, Z., Xia, J. Y., Zhou, X. H., Song, B., et al. (2011). Water use efficiency in response to climate change: from leaf to ecosystem in a temperate steppe. Glob. Change Biol. 17, 1073–1082. doi: 10.1111/j.1365-2486.2010.02280. x
Patanè, C., Tringali, S., and Sortino, O. (2011). Effects of deficit irrigation on biomass, yield, water productivity and fruit quality of processing tomato under semi-arid Mediterranean climate conditions. Sci. Hortic. 129, 590–596. doi: 10.1016/j.scienta.2011.04.030
Patil, N. M. (2012). Adaptations in response to salinity in Safflower Cv. Bhima. Asian J. Crop Sci. 4, 50–62. doi: 10.3923/ajcs.2012.50.62
Phogat, V., Pitt, T., Cox, J. W., Šimunek, J., and Skewes, M. A. (2018). Soil water and salinity dynamics under sprinkler irrigated almond exposed to a varied salinity stress at different growth stages. Agric. Water Manage. 201, 70–82. doi: 10.1016/j.agwat.2018.01.018
Qadir, M., Quillérou, E., Nangia, V., Murtaza, G., Singh, M., Thomas, R. J., et al. (2014). Economics of salt-induced land degradation and restoration. Nat. Resour. Forum 38, 282–295. doi: 10.1111/1477-8947.12054
Qiu, R. J., Du, T. S., Kang, S. Z., Chen, R. Q., and Wu, L. S. (2015). Influence of water and nitrogen stress on stem sap flow of tomato grown in a solar greenhouse. J. Am. Soc. Hortic. Sci. 140, 111–119. doi: 10.21273/JASHS.140.2.111
Reina-Sánchez, A., Romero-Aranda, R., and Cuartero, J. (2005). Plant water uptake and water use efficiency of greenhouse tomato cultivars irrigated with saline water. Agric. Water Manage. 78, 54–66. doi: 10.1016/j.agwat.2005.04.021
Romero-Aranda, R., Soria, T., and Cuartero, J. (2001). Tomato plant-water uptake and plant-water relationships under saline growth conditions. Plant Sci. 160, 265–272. doi: 10.1016/S0168-9452(00)00388-5
Schiattone, M. I., Candido, V., Cantore, V., Montesano, F. F., and Boari, F. (2017). Water use and crop performance of two wild rocket genotypes under salinity conditions. Agric. Water Manage. 194, 214–221. doi: 10.1016/j.agwat.2017.09.009
Senguttuvel, P., Vijayalakshmi, C., Thiyagarajan, K., Kannanbapu, J. R., Kota, S., Padmavathi, G., et al. (2014). Changes in photosynthesis, chlorophyll fluorescence, gas exchange parameters and osmotic potential to salt stress during early seedling stage in rice (Oryza sativa L.). SABRAO J. Breed. Genet. 46, 120–135.
Shrivastava, P., and Kumar, R. (2015). Soil Salinity: a serious environmental issue and plant growth promoting bacteria as one of the tools for its alleviation. Saudi J. Biol. Sci. 22, 123–131. doi: 10.1016/j.sjbs.2014.12.001
Shukla, M. K., Lal, R., and Ebinger, M. (2006). Determining soil quality indicators by factor analysis. Soil Tillage Res. 87, 194–204. doi: 10.1016/j.still.2005.03.011
Siddiqi, E. H., Ashraf, M., Al-Qurainy, F., and Akram, N. A. (2011). Salt-induced modulation in inorganic nutrients, antioxidant enzymes, proline content and seed oil composition in safflower (Carthamus tinctorius L.). J. Sci. Food Agric. 91, 2785–2793. doi: 10.1002/jsfa.4522
Sinclair, T. R., Tanner, C. B., and Bennett, J. M. (1984). Water use efficiency in crop production. AIBS 34, 36–40. doi: 10.2307/1309424
Trambouze, W., and Voltz, M. (2001). Measurement and modeling of the transpiration of a Mediterranean vineyard. Agric. Water Manage. 107, 153–166. doi: 10.1016/S0168-1923(00)00226-4
Unesco Water Portal (2007). Available online at: http://www.unesco.org/water (Accessed October 25, 2007).
Wang, C. X., Gu, F., Chen, J. L., Yang, H., Jiang, J. J., Du, T. S., et al. (2015). Assessing the response of yield and comprehensive fruit quality of tomato grown in greenhouse to deficit irrigation and nitrogen application strategies. Agric. Water Manage. 161, 9–19. doi: 10.1016/j.agwat.2015.07.010
Wang, Y. S., Liu, F. L., Andersen, M. N., and Jensen, C. R. (2010). Improved plant nitrogen nutrition contributes to higher water use efficiency in tomatoes under alternate partial root-zone irrigation. Funct. Plant Biol. 37, 175–182. doi: 10.1071/FP09181
Wei, Z. H., Du, T. S., Li, X. N., Fang, L., and Liu, F. L. (2018). Interactive effects of CO2 concentration elevation and nitrogen fertilization on water and nitrogen use efficiency of tomato grown under reduced irrigation regimes. Agric. Water Manage. 202, 174–182. doi: 10.1016/j.agwat.2018.02.027
Wei, Z. H., Du, T. S., Zhang, J., Xu, S. J., Cambre, P. J., and Davies, W. J. (2016). Carbon isotope discrimination shows a higher water use efficiency under alternate partial root-zone irrigation of field-grown tomato. Agric. Water Manage. 165, 33–43. doi: 10.1016/j.agwat.2015.11.009
Wilkinson, S., and Davies, W. J. (2002). ABA-based chemical signaling: the co-ordination of responses to stress in plants. Plant Cell Environ. 25, 195–210. doi: 10.1046/j.0016-8025.200.00824.x
Yang, H., Du, T. S., Qiu, R. J., Chen, J. L., Li, Y., Wang, C. X., et al. (2017). Improved water use efficiency and fruit quality of greenhouse crops under regulated deficit irrigation in northwest China. Agric. Water Manage. 179, 193–204. doi: 10.1016/j.agwat.2016.05.029
Zhang, P., Senge, M., and Dai, Y. (2016). Effects of salinity stress on growth, yield, fruit quality and water use efficiency of tomato under hydroponics system. Rev. Agric. Sci. 4, 46–55. doi: 10.7831/ras.4.46
Zhang, X. Z., Ervin, E. H., Liu, Y. M., Hu, G. F., Shang, C., Fukao, T., et al. (2015). Differential response of antioxidants, abscisic acid, and auxin to deficit irrigation in two perennial ryegrass cultivars contrasting in drought tolerance. J. Am. Soc. Hortic. Sci. 140, 562–572. doi: 10.21273/JASHS.140.6.562
Keywords: reduced irrigation, salt stress, tomato, water use efficiency, sap flow, soil moisture
Citation: Yang H, Shukla MK, Mao X, Kang S and Du T (2019) Interactive Regimes of Reduced Irrigation and Salt Stress Depressed Tomato Water Use Efficiency at Leaf and Plant Scales by Affecting Leaf Physiology and Stem Sap Flow. Front. Plant Sci. 10:160. doi: 10.3389/fpls.2019.00160
Received: 25 September 2018; Accepted: 29 January 2019;
Published: 28 February 2019.
Edited by:
Bhabani S. Das, Indian Institute of Technology Kharagpur, IndiaReviewed by:
Alejandra Navarro, Council for Agricultural and Economics Research, ItalyCopyright © 2019 Yang, Shukla, Mao, Kang and Du. This is an open-access article distributed under the terms of the Creative Commons Attribution License (CC BY). The use, distribution or reproduction in other forums is permitted, provided the original author(s) and the copyright owner(s) are credited and that the original publication in this journal is cited, in accordance with accepted academic practice. No use, distribution or reproduction is permitted which does not comply with these terms.
*Correspondence: Taisheng Du, ZHV0YWlzaGVuZ0BjYXUuZWR1LmNu
Disclaimer: All claims expressed in this article are solely those of the authors and do not necessarily represent those of their affiliated organizations, or those of the publisher, the editors and the reviewers. Any product that may be evaluated in this article or claim that may be made by its manufacturer is not guaranteed or endorsed by the publisher.
Research integrity at Frontiers
Learn more about the work of our research integrity team to safeguard the quality of each article we publish.