 Tiago Vieira Sousa1
 Eveline Teixeira Caixeta2*
 Emilly Ruas Alkimim3
 Antonio Carlos Baião Oliveira4Antonio Alves Pereira5Ney Sussumu Sakiyama6Laércio Zambolim7Marcos Deon Vilela Resende8
- 1BIOAGRO, BioCafé, Universidade Federal de Viçosa, Viçosa, Brazil
- 2Empresa Brasileira de Pesquisa Agropecuária–Embrapa Café, BIOAGRO, BioCafé, Universidade Federal de Viçosa, Viçosa, Brazil
- 3Universidade Federal do Triângulo Mineiro, Iturama, Brazil
- 4Empresa Brasileira de Pesquisa Agropecuária–Embrapa Café, Viçosa, Brazil
- 5Empresa de Pesquisa Agropecuária de Minas Gerais–Epamig, Viçosa, Brazil
- 6Departamento de Fitotecnia, Universidade Federal de Viçosa, Viçosa, Brazil
- 7Departamento de Fitopatologia, Universidade Federal de Viçosa, Viçosa, Brazil
- 8Empresa Brasileira de Pesquisa Agropecuária–Embrapa Florestas, Viçosa, Brazil
Genomic Selection (GS) has allowed the maximization of genetic gains per unit time in several annual and perennial plant species. However, no GS studies have addressed Coffea arabica, the most economically important species of the genus Coffea. Therefore, this study aimed (i) to evaluate the applicability and accuracy of GS in the prediction of the genomic estimated breeding value (GEBV); (ii) to estimate the genetic parameters; and (iii) to evaluate the time reduction of the selection cycle by GS in Arabica coffee breeding. A total of 195 Arabica coffee individuals, belonging to 13 families in generation of F2, susceptible backcross and resistant backcross, were phenotyped for 18 agronomic traits, and genotyped with 21,211 SNP molecular markers. Phenotypic data, measured in 2014, 2015, and 2016, were analyzed by mixed models. GS analyses were performed by the G-BLUP method, using the RKHS (Reproducing Kernel Hilbert Spaces) procedure, with a Bayesian algorithm. Heritabilities and selective accuracies were estimated, revealing moderate to high magnitude for most of the traits evaluated. Results of GS analyses showed the possibility of reducing the cycle time by 50%, maximizing selection gains per unit time. The effect of marker density on GS analyses was evaluated. Genomic selection proved to be promising for C. arabica breeding. The agronomic traits presented high complexity for they are controlled by several QTL and showed low genomic heritabilities, evidencing the need to incorporate genomic selection methodologies to the breeding programs of this species.
Introduction
Genetic plant breeding started with the phenotypic selection of individuals that positively stood out in the segregating populations. In the 1980s, molecular markers were developed and used as an auxiliary tool to phenotypic information (Soller and Beckmann, 1983). With the evolution of molecular biology, in the 1990s, the Molecular Marker Assisted Selection (MAS) was proposed (Lande and Thompson, 1990), which enabled selecting individuals with specific alleles. However, MAS has shown to be inefficient in polygenic and/or low heritability traits (Bernardo, 2008). This limitation is mainly because molecular markers, on significant associations with QTL (Quantitative Trait Loci), are unable to capture genes of lesser effect (Hayes et al., 2009; Heffner et al., 2009; Xu et al., 2012).
Due to its potential and importance, genome-wide selection (GS) was developed by Meuwissen et al. (2001), being currently used in animal and plant studies (Crossa et al., 2010; de los Campos et al., 2010; Heffner et al., 2010; Jannink et al., 2010; Ornella et al., 2012; Azevedo Peixoto et al., 2017). The rapid adoption of this selective technique is due, among other factors, to the combination of expressive numbers of molecular markers, widely distributed throughout the species genome, and robust and accurate statistical methodologies. Therefore, the genetic value of individuals can be estimated (Longin et al., 2015), which allows increasing selection gain per unit time (Heffner et al., 2010). Several studies have demonstrated the high selective accuracy of GS [Bernardo and Yu, 2007; Wong and Bernardo, 2008; Heffner et al., 2009; Crossa et al., 2010; Davey et al., 2011; Garcia et al., 2011; Grattapaglia and de Resende, 2011; (Iwata et al., 2011; Resende et al., 2012b,c; de los Campos et al., 2013; Gianola, 2013)]. Moreover, GS has been reported as efficient for polygenic traits and traits with low heritability, high evaluation cost, and of difficult measurement (Heslot et al., 2015; Poland, 2015).
With the development of NGS (Next Generation Sequencing) platforms, GS has become a reality for several economically important species, including annual and perennial plants. The use of the NGS platforms has made SNP markers (Single Nucleotide Polymorphisms) economically feasible (Patel et al., 2015). SNP is the most abundant genetic variation in the genome (Kwok and Gu, 1999; Ganal et al., 2009) and allows the identification of polymorphism distributed throughout the species genome.
The use of SNP molecular markers in GS studies has been shown to be advantageous for several species. However, the procedure requires special care for polyploid species, which have subgenomes with duplicate regions or with high similarity, such as Coffea arabica species. These species originate from the natural cross from non-reduced gametes between the diploid species Coffea canephora and Coffea eugenioides (Lashermes et al., 1999), whose genomes have highly similar regions (Cenci et al., 2012). Although C. arabica is a true allotetraploid (Clarindo and Carvalho, 2008), its meiotic behavior is similar to that of a diploid with the bivalent formation (Lashermes et al., 2016). Thus, if the polymorphism detected by the SNP occurs between these regions of the sub genomes, this marker will not explain the phenotypic variation observed between individuals, being not informative (false SNP) (Vidal et al., 2010). Therefore, this SNP must be eliminated from the data set (Sant'Ana et al., 2018). Moreover, the objective must be to achieve the optimal number of molecular markers used to predict the genetic value of individuals. Excess markers associated with reduced number of observations (genotypes) can lead to multicollinearity problems. Thus, the analyses must use an optimal set of informative SNPs, maximizing the predictive accuracy estimates.
GS has an essential role in perennial plants (Resende et al., 2012a; Azevedo Peixoto et al., 2017). Despite the economic importance of C. arabica, no GS work has addressed this species. Coffee trees have been selected based on biometric analyses that use mainly phenotypic data of yield and resistance to diseases. Experiments with perennial species, such as C. arabica, usually present unbalanced data due to adversities in the field over time. Therefore, the use of the mixed models methodology, Residual or Restricted Maximum Likelihood/Best Linear Unbiased Prediction (REML/BLUP) (Patterson and Thompson, 1971; Henderson, 1975) has allowed, from phenotypic information, the accurate, and unbiased prediction of genetic values of individuals (Resende and Thompson, 2004; Viana et al., 2011; Barbosa et al., 2012; Ferreira et al., 2012; Pereira et al., 2013; Corrêa et al., 2015; Spinelli et al., 2015). For coffee, genetic gains have also been reported using molecular markers in studies on genetic diversity (Sousa et al., 2017), genetic maps (Pestana et al., 2015; Moncada et al., 2016), and assisted selection (Alkimim et al., 2017; Favoretto et al., 2017). However, due to the complexity and number of genes that control most of the agronomic traits of this species, GS studies are promising for they allow estimating the effects of all loci that explain the genetic variation (Heffner et al., 2009) and the genomic estimated breeding value (GEBV) (Meuwissen et al., 2001).
Given the above, this study aimed (i) to evaluate the applicability and accuracy of GS in the prediction of the GEBV; (ii) to estimate the genetic parameters; and (iii) to evaluate the time reduction of the selective cycle by GS in an Arabica coffee breeding.
Materials and Methods
Experimental Conduction
In the experimental area, soil liming and planting fertilization were performed according to the crop requirement. The genotypes were planted on February 11, 2011. Plants were arranged at spacing of 3.0 m between rows and 0.7 m between plants. No phytosanitary control method was used against rust, cercosporiosis, and leaf miner. The experiment was evaluated in the experimental area of the Department of Plant Pathology of the Universidade Federal de Viçosa, Brazil (lat. 20°44′25" S, long. 42°50′52" W), in 2014, 2015, and 2016.
Genetic Material
From the cross between three parents of the Catuaí group and three parents of Híbrido de Timor (HdT), which contrast in relation to resistance to coffee rust, 13 progenies were obtained from the C. arabica breeding program of Epamig/UFV/Embrapa (Figure 1). These progenies are resistant backcrosses (BCr), susceptible backcrosses (BCs), and F2 (Figure 1 and Table 1) generations. In each progeny, 15 genotypes (repetitions) were analyzed, totaling 195 individuals.
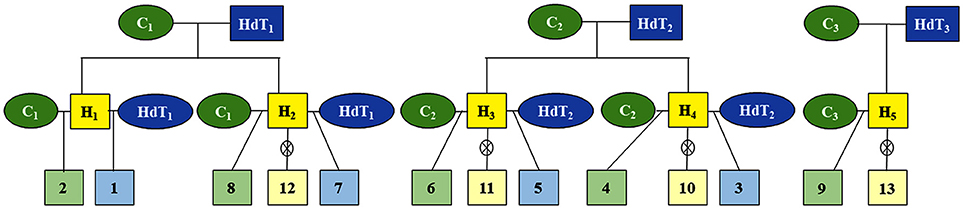
Figure 1. Heredogram of the 13 progenies of Coffea arabica from crosses between parents of the Catuaí group and Híbrido de Timor (HdT); C1, C2, and C3, genotypes Catuaí amarelo IAC 30, IAC 86, and IAC 64, respectively; HdT1, HdT2, and HdT3, genotypes Híbrido de Timor UFV 445-46, UFV 440-10, and UFV 530, respectively; H1, H2, H3, H4, and H5, hybrids from crosses between the parents Catuaí amarelo and Híbrido de Timor; 1, 3, 5, and 7, progenies of first rust-resistant backcross generation; 2, 4, 6, 8, and 9, progenies of first rust-resistance backcross generation; 10, 11, 12, and 13, progenies in the F2 generation.
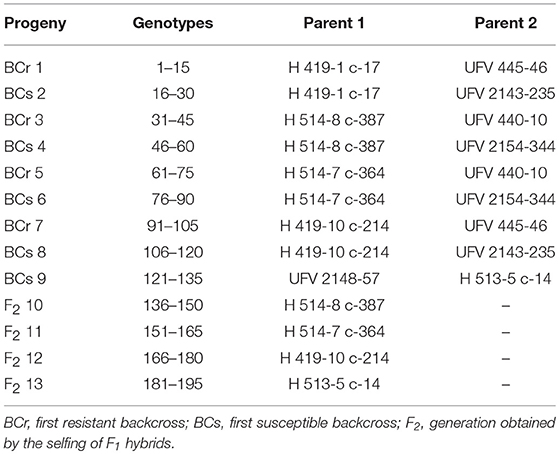
Table 1. Coffea arabica progenies evaluated in 2014, 2015, and 2016 in Viçosa (Brazil).
Phenotypic Evaluations
The phenotypic evaluations of 18 agronomic traits (11 continuous and seven categorical traits) were performed (Table 2) in the 195 C. arabica genotypes listed in Table 1, in 2014, 2015, and 2016.
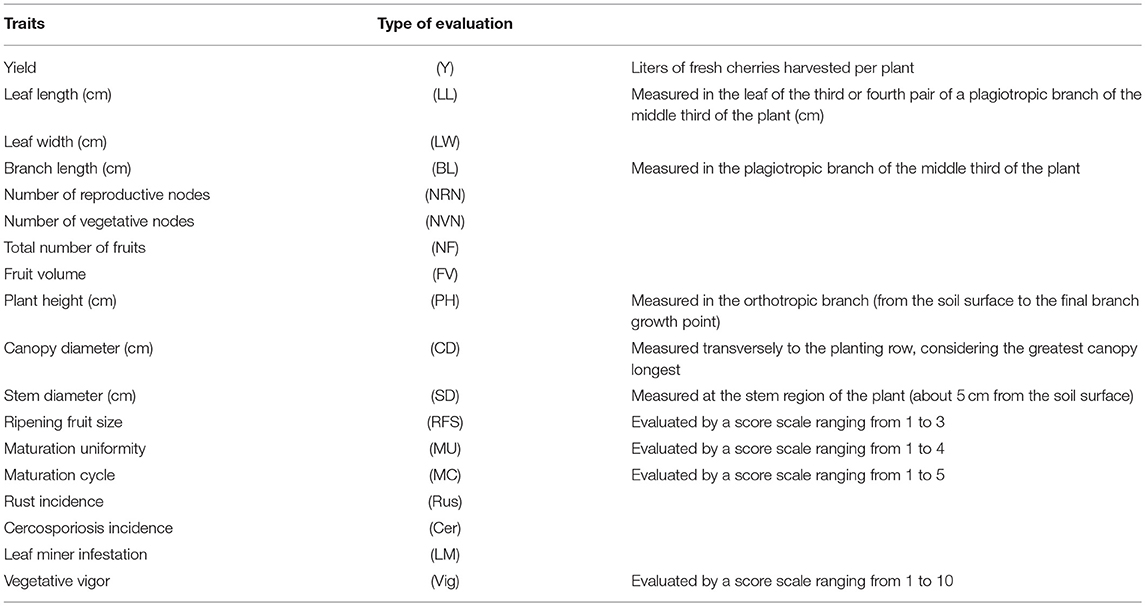
Table 2. Phenotypic traits evaluated in 2014, 2015, and 2016 in Viçosa (MG).
The continuous traits were measured as described in Table 2. The categorical traits were evaluated by score scales. Ripening fruit size was evaluated by a score scale ranging from 1 to 3 (1: small; 2: medium; and 3: large fruits). Maturation uniformity was evaluated by a score scale ranging from 1 to 4 (1: uniform; 2: semi-uniform; 3: semi non-uniform; and 4: non-uniform maturation). Maturation cycle was evaluated by a score scale ranging from 1 to 5 (1: early; 2: semi-early; 3: intermediate; 4: semi-late; 5: late cycle). The incidence of coffee rust, cercosporiosis, and leaf miner was evaluated using a score scale ranging from 1 to 5, in which 1 corresponded to genotypes without symptoms and 5 referred to highly susceptible genotypes. Vegetative vigor was evaluated by a score scale ranging from 1 to 10, in which 1 was attributed to fully depauperate (depleted) plants and 10 was assigned to plants with maximum vegetative vigor.
Genetic Parameters From Phenotypic Data
Thirteen progenies, which were composed of 15 plants (repetitions), totaling 195 genotypes were evaluated. Phenotypic data were corrected for years, plots, and years × plots interactions, from which the selective accuracies (ryy) and phenotypic heritabilities () of the 18 agronomic traits were estimated. Analyses were performed considering the linear mixed models (REML/BLUP procedure), implemented in the Selegen-REML/BLUP software (Resende, 2016). Genetic parameters were estimated by the individual analysis of the 18 traits, using the following statistical model:
Where:
y is the data vector;
u is the vector of the overall mean in each evaluation year;
g is the vector of progeny effects (random effect);
p is the permanent effects between plants (random effect);
r is the effects between population types (random effect);
b is the effects between plot (random effect);
i is the effects of progenies x years interaction (random effect);
e is the residue vector (random effect).
The uppercase letters represent the incidence matrices for these effects.
Genomic DNA Extraction
Young and fully expanded leaves of the 195 genotypes were collected, and the genomic DNA was extracted using the methodology described by Diniz et al. (2005). The DNA concentration was verified in the NanoDrop 2000, and its quality was evaluated in 1% agarose gel.
The DNA concentration of the samples was standardized and sent to RAPiD GENOMICS, Florida/USA, for probes construction, sequencing, and identification of SNP molecular markers (Sousa et al., 2017).
Quality Control of Molecular Markers
From 40,000 probes, 10,000 polymorphic probes were selected, and 21,211 SNP molecular markers were identified. Details on probes construction and SNPs identification can be obtained from Sousa et al. (2017). The SNP set was subject to quality analysis implemented in the Rbio software (Bhering, 2017). The quality parameters used were CR (Call Rate) and MAF (Minor Allele Frequency) equal to or higher than 90 and 5%, respectively. The critical level for MAF was obtained by the equation , where N refers to the number of individuals evaluated. Moreover, to avoid the occurrence of false SNPs (Vidal et al., 2010) resulting from the polyploidy of C. arabica, SNPs that had the same genotype in all individuals, even when polymorphic, were eliminated. Thus, SNPs without genetic variance among the individuals that make up the study population were eliminated from the analysis.
Cross-Validation
Cross-validation is a method used to evaluate the generalization capacity of a predictive model from a dataset. When applying this method, the dataset is partitioned into mutually exclusive subsets. The population, composed of 195 coffee trees, was divided into 13 folds−180 individuals were used for training or estimation of the predictive models and 15 individuals were used for validation. The process was repeated 13 times so that each part was used once as a validation set. In the end, the predictive capacity (rgy) of the GS model obtained by the result of the mean correlation between the GEBV and the observed phenotypic values was estimated.
Genomic Selection
Genomic selection (GS) analyses were performed using the G-BLUP method via the RKHS (Reproducing Kernel Hilbert Spaces) procedure, with the Bayesian algorithm (Gianola, 2006). The BGLR (Bayesian Generalized Linear Regression) package (Perez and de los Campos, 2014), implemented in the software R (R Core Team, 2017), was used.
The general mixed linear model (Resende, 2007, 2008) was adjusted to estimate the effects of markers, according to the expression y = Xb + Wm + e, where y is the vector of phenotypic observations; b is the vector of fixed effects; m is the vector of random effects of markers; and e is the vector of random residue. Uppercase letters represent the incidence matrices for these effects. The incidence matrix X contains the values 0, 1, and 2 for the number of alleles of the marker (or the so-called QTL) in a diploid individual. The genomic mixed model equations for the prediction of m via the G-BLUP method are equivalent to:
The genomic estimated breeding value (GEBV) of individual j is given by , in which Wi is equal to 0, 1, or 2 for the genotypes mm, Mm, and MM, respectively, for the biallelic and codominant marker i (SNP); and Wij is the element i of row j of matrix W, regarding individual j.
Predictive Capacity and Accuracy of GS
The predictive capacity (rgy) is estimated by correlating the predicted genomic values with the corrected phenotypic values, being equivalent to the predictive capacity of the GS to estimate phenotypes (Resende et al., 2014a).
The accuracy was obtained by the estimator , in which rgy is the predictive capacity of the GS, and h2 is the individual heritability (Legarra et al., 2008).
Number of QTL and Individuals
The number of QTL (nQTL) controlling each trait was estimated by the expression , where rggis the accuracy of the GS; N is the number of individuals in the population; and h2 in the individual heritability (Resende et al., 2008). The individual heritability was estimated by: , where is the variance component associated to the i effect.
The number of individuals (Ni) that must be evaluated to obtain the desired accuracy was estimated by the expression , in which rggis the accuracy of the GS; nQTL is the number of QTL controlling each trait; and h2 is the individual heritability (Resende et al., 2014a).
Markers Density
The effect of the number of markers on the selective accuracy was evaluated. Predictive accuracy, with a set of markers composed of different SNP densities, was estimated by the G-BLUP method, using the RKHS (Reproducing Kernel Hilbert Spaces) procedure with a Bayesian algorithm (Gianola, 2006). The BGLR package (Perez and de los Campos, 2014), implemented in the software R (R Core Team, 2017), was used. These analyses were performed with a set of markers composed of 1,000; 4,000; 8,000; 12,000; 16,000; 20,000; and 20,477 SNPs selected to representatively sample the original data set. Cross-validation was performed using 13 folds.
Selective Efficiency of GS
The selective efficiency of GS (Ef), compared with selection based on phenotypes alone, was estimated by the expression , in which rgg is the selective accuracy of GS; Lf is the mean time required for the selection cycle based on phenotypes; ryy is the accuracy of the phenotypic selection; LGS is the mean time required for the selection cycle based on GS (Resende et al., 2012d). Efficiency analyses were estimated considering 24 years to obtain phenotypic accuracies, according to the mean release time of an Arabica coffee cultivar composed of four selection cycles, each cycle lasting 6 years. Conversely, the selective accuracies of GS were estimated considering 12 and 24 years. This 12 year period is the minimum duration for the use of SNPs, considering four selection cycles, each one totaling 3 years. Although the application of SNP allows for the selection at the seed stage, a 3 year cycle was considered since this is the period required for the coffee trees to reproduce.
Results
Genetic Parameters From Phenotypic Data
Eighteen traits of agronomic importance were analyzed in 195 coffee trees. The individuals make up 13 families, which were obtained from crosses between parents of the Catuaí group and Híbrido de Timor (HdT). From the phenotypic data, heritabilities (h2phen) and selective accuracies (ryy) were estimated using the mixed model methodology (REML/BLUP) (Table 3). Stem diameter (SD) had the lowest estimate of h2phen (0.01); conversely, plant height (PH) and canopy diameter (CD) showed the highest values for this parameter (0.90). Most of the evaluated traits presented high magnitude of ryy, with the exception of SD.
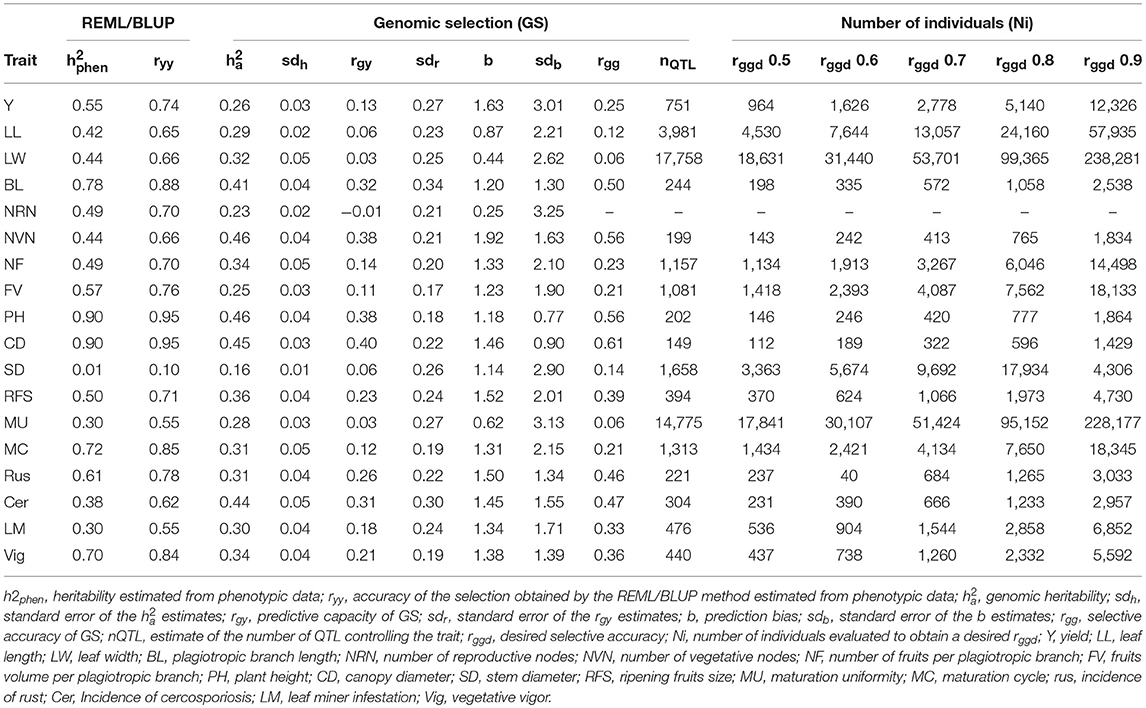
Table 3. Estimate of genetic parameters obtained by mixed model analyses (REML/BLUP), results of the Genome-wide Selection (GS), and estimates of the number of individuals to obtain a desired selective accuracy (Ni) for 18 morpho-agronomic traits in a Coffea arabica breeding population evaluated in 2014, 2015, and 2016.
Quality Control of Molecular Markers
Coffee trees, besides being phenotyped, were genotyped with 21,211 SNP markers. After quality analyses, 20,477 SNPs were selected. The initial set of SNP markers reduced by 3.46% (Figure 2). The most significant reduction (percentage) in the number of markers was observed on chromosome 4, corresponding to 14.21%. Markers were widely distributed, being identified on all chromosomes of coffee. The number of SNPs per chromosome ranged from 49 (UNIGENE) to 2,804 (chromosome 2), with a mean of 1,575 SNPs per chromosome.
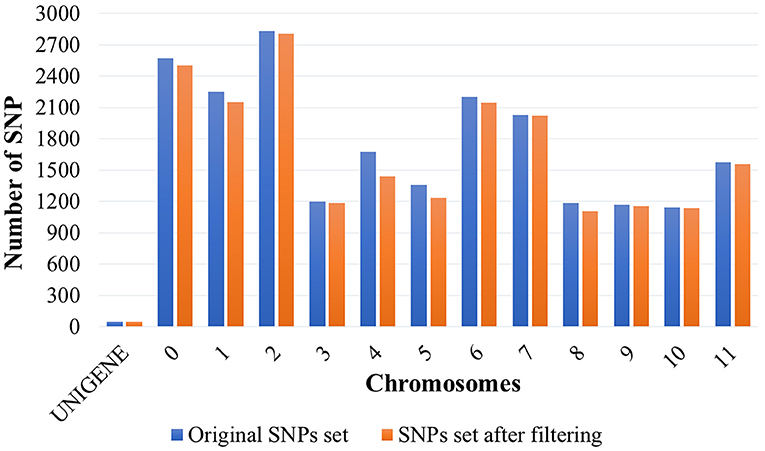
Figure 2. SNP molecular markers distributed throughout the UNIGENES from the EST sequences of Coffea arabica and the 11 chromosomes and the “chromosome 0” of Coffea canephora. “Chromosome 0” consists of a set of non-ordered sequence scaffolds (Denoeud et al., 2014).
Genomic Heritability
Genomic heritabilities () were estimated from the predictive equations of genomic selection. Estimates of ranged from 0.16, for stem diameter (SD), to 0.46, for number of vegetative nodes (NVN) and plant height (PH) (Table 3). For all the evaluated traits, estimates had a standard error equal to or lower than 0.05.
Predictive Capacity and Prediction Bias
Estimates of the predictive capacity (rgy) of the 18 traits ranged from −0.01 to 0.40, for number of reproductive nodes (NRN) and canopy diameter (CD), respectively (Table 3). The standard error of the estimates ranged from 0.17 to 0.34. In addition to CD, the highest estimates of predictive capacity were observed for number of vegetative nodes (NVN) and plant height (PH). Results of and rgy showed a high positive association, with a correlation coefficient of 88%. Prediction bias estimates (b) ranged from 0.25 to 1.92 for number of reproductive nodes (NRN) and number of vegetative nodes (NVN), respectively. Most of the traits evaluated showed a b estimate close to the unit. The standard error of these estimates ranged from 0.77 to 3.25.
Selective Accuracy of GS
Selective accuracy estimates obtained with the GS (rgg) are presented in Table 3. rgg was not estimated for number of reproductive nodes (NRN) since its predictive capacity estimate was negative. The estimated rgg values of the other traits ranged from 0.06, for maturation uniformity (MU) and leaf width (LW), to 0.61, for canopy diameter (CD). A high correlation was observed between the estimates of rgg and (82%) and between rgg and rgy (99%).
Number of QTL
The number of QTL that controlled the trait (nQTL) ranged from 149 to 17,758 for canopy diameter (CD) and leaf width (LW), respectively (Table 3). The agronomic traits showed to be controlled by a large number of QTL. The nQTL estimated for grain yield and coffee rust incidence, which are the main traits in a coffee breeding program, were 751 and 221, respectively. These results showed an inversely proportional relationship between selective accuracy (rgg) and number of QTL.
Number of Individuals to Obtain a Desired Selective Accuracy
The estimate of the number of individuals (Ni) required to obtain a desired selective accuracy (rggd) is presented in Table 3. Results confirm the requirement of the evaluation of more individuals when high rggd estimates are intended. Based on the data, 322–53.701 of individuals should be evaluated for canopy diameter (CD) and leaf width (LW), respectively, to obtain a selective accuracy estimate of 0.7, considered as of high magnitude (Resende and Duarte, 2007). For most of the traits, more than 1,000 individuals must be evaluated to obtain rggd equal to 0.7.
Markers Density
GS predictive analyses using different marker densities, in general, evidenced the increase in selective accuracy (rgg) when using a larger number of SNPs (Table 4). However, when the optimal number of markers was reached, which maximizes the rgg estimates, selective accuracies decreased with the increase in the number of markers.
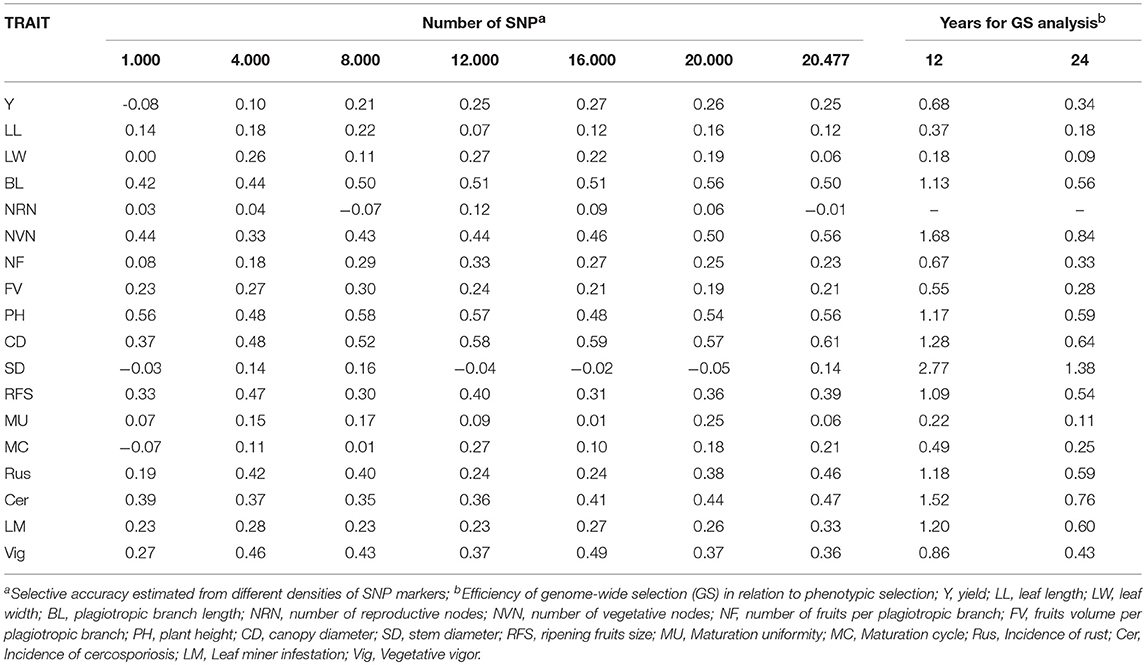
Table 4. Selective accuracy estimated from different densities of SNP markers and efficiency of genome-wide selection (GS) in relation to phenotypic selection in a Coffea arabica breeding population.
Efficiency of GS
The efficiency of GS analysis in relation to phenotypic selection is presented in Table 4. The GS analysis was not performed for number of reproductive nodes (NRN) since the estimate its predictive capacity was close to zero (Table 3). Results demonstrated the possibility of reducing the cycle time by 50%. In nine traits, GS was more efficient than the phenotypic selection when reducing the selection cycle time from 24 to 12 years, including coffee rust incidence (Rus), cercosporiosis incidence (Cer), and leaf miner infestation (LM).
Discussion
Genetic Parameters From Phenotypic Data
Heritabilities () and selective accuracies (ryy) of 18 coffee trees agronomic traits were estimated from phenotypic data. The magnitude of the estimates for most traits was considered as from intermediate to high. Heritability represents how much of the phenotypic variation is due to genetic influences (Krueger et al., 2008). Traits with lower heritability are usually controlled by more genes, and therefore, the selection is more complex. In general, the traits evaluated showed ryy of high magnitude. Accuracy depends mainly on the ratio between the mean residual variation and the genotype variation. In its turn, the mean residual variation depends on the number of replications and the control when conducting the experiments (Resende and Duarte, 2007). Selective accuracy reflects the quality of the information and approaches used in genetic values prediction. This measure is associated with the precision of selection and refers to the correlation between predicted genetic values and true genetic values of individuals. The higher the selective accuracy in the evaluation of an individual, the higher is the evaluation confidence and genetic value predicted for the individual.
For non-normally distributed traits such as Ripening fruit size (evaluated by a score scale ranging from only 1 to 3) or Maturation uniformity (1–4), the technique called Generalized Linear Model should be used. This was done and the results did not differ so much from those got by using the standard procedure of Linear Mixed Model. This is in line with theory, which preconizes that the higher the number of score scale classes, the smaller the benefit from using the Generalized Linear Model technique. For small class numbers, the expected theoretical benefits are below 10%.
Quality Control of Molecular Markers
The coffee trees belonging to breeding populations were genotyped. More than 20,000 SNPs were identified, which were widely distributed in the genome and all coffee chromosomes. This number of identified SNPs is higher than those that have been published so far. From expressed sequence tag (EST) of C. arabica, C. canephora, and C. racemosa, 7,538 SNPs were identified, and 180 were selected for validation in C. arabica and C. canephora accessions from Puerto Rico (Zhou et al., 2016). In another work, 952 SNPs were located on a genetic map of C. arabica (Moncada et al., 2016). From Ethiopian C. arabica collection and some Brazilian cultivars, 6,696 SNPs were identified and 2,587 with quality were selected for Genome-wide association studies (GWAS) (Sant'Ana et al., 2018).
Genomic Heritability
From the information of the GS predictive equations, genomic heritability () were estimated, showing low or moderate magnitudes and a standard error equal to or lower than 0.05. Traits with low heritability are expected to present lower predictive capacity (Legarra et al., 2008). Heritability estimate allows predicting the progress to be obtained with the selection. The lower the heritability of the trait, the more complex is the selection of traits, and consequently, the lower is the capacity to correctly predict phenotypes of individuals not sampled for model computation. This fact was demonstrated in simulations by Grattapaglia and de Resende (2011), who verified that the increase in the heritability of the trait leads to an increase in the accuracy of the GS.
Predictive Capacity
The correlation coefficient or predictive capacity (rgy) and the regression coefficient or prediction bias (b), associated with observed phenotypic values and predicted genetic values, are practical measures of the ability of the methods to make accurate and unbiased predictions, respectively (Resende et al., 2014b). The results for and rgy showed a high positive association, with a correlation coefficient of 88%. As observed in this work, the association between predictive capacity and heritability has been reported by other researchers (Cavalcanti et al., 2012; Gois et al., 2016). Prediction bias for most of the evaluated traits showed a b estimate close to the unit. This result indicates that the prediction was unbiased and therefore effective in predicting the true magnitudes of the differences between individuals (Resende et al., 2012a).
Selective Accuracy of GS
The selective accuracy estimates of GS (rgg) were of low to moderate magnitude (Resende and Duarte, 2007). Selective accuracy (rgg) refers to the correlation between the true genotypic value of the genetic treatment and that estimated or predicted from the phenotypic information (Gois et al., 2016). The adequate rgg values are close to the unit. The lower the absolute deviations between the parametric genetic values and the estimated or predicted genetic values, the higher is the accuracy (Resende and Duarte, 2007). The value of this measure indicates how accurate the model is in estimating the GEBV.
The low magnitudes of rgg observed in some traits can be explained by the reduced population size and, mainly, by the effective population size. However, for being a perennial species with a high maintenance cost, an increase in the population size may hinder the breeding program. In studies with wheat populations, the increase in population size increased the selective accuracies estimates (Heffner et al., 2011a,b).
A high correlation was observed between the estimates of rgg and (82%). A positive correlation between selective accuracy and heritability has also been reported for yellow rust and stem rust in wheat (Ornella et al., 2012).
The success of genomic selection is influenced by several factors, which consequently interfere with the selective accuracy of a GS model, such as the training population size, the actual population size, markers density, trait heritability, and number of QTL controlling the traits (Grattapaglia and de Resende, 2011; Desta and Ortiz, 2014). Among these factors, heritability and number of QTL controlling the trait are inherent to the genetic architecture of the trait (Resende et al., 2014b). Moreover, the genetic structure of the population may influence genomic predictions (Zhang et al., 2010; Li et al., 2014; Wang et al., 2014). In this sense, the different allelic frequencies between subpopulations can produce false associations between molecular and phenotypic data (Price et al., 2010) and thus overestimate heritability and reduce selective accuracy (Riedelsheimer et al., 2012; Wray et al., 2013).
Number of QTL
The traits evaluated presented large numbers of QTL (nQTL). An inversely proportional relation was observed between nQTL and selective accuracy (rgg). This fact can be justified by the increase in the predictive complexity in function of the larger number of genes controlling the trait. When several genes affect a trait, their effects are usually small, and, consequently, the accurate estimation is challenging (Goddard, 2009). This phenomenon evidences the importance of using high-density SNP markers in the predictive analyses, aiming to identify SNP in linkage disequilibrium with all the QTL controlling the traits of interest. Studies with forest species (Grattapaglia and de Resende, 2011; Iwata et al., 2011) and maize (Riedelsheimer et al., 2012) revealed no relationship between the number of QTL and the phenotypic or genotypic accuracy.
Number of Individuals to Obtain a Desired Selective Accuracy
Most of the analyzes traits required the evaluation of more than 1,000 individuals to obtain a selective accuracy of 0.7, considered by Resende and Duarte (2007) as of high magnitude. The larger the number of individuals genotyped, the more reliable estimates of the SNPs effects are obtained since each individual is a is a repetition.
Markers Density
The results of the predictive analyses using different markers densities revealed the increase in the selective accuracy (rgg) with the increase in the number of SNPs. The increase in the markers density guarantees the conservation of marker-QTL associations and allows obtaining high selective accuracies (Desta and Ortiz, 2014). Marker density is determined primarily by the extent of the linkage disequilibrium (LD) and sample size. Therefore, if the number of markers used is reduced, the population size should be increased (Grattapaglia and de Resende, 2011). However, when the optimal number of markers was reached, which maximizes the rgg estimates, the selective accuracy decreased with the increase in the number of markers. Results were similar to those of other researchers (Fernando et al., 2007; Cavalcanti et al., 2012), where the increase in the number of markers did not show a linear relationship with the accuracy of the GS. Studies with simulated data have demonstrated that the use of a large number of markers led to a reduction in the limitation imposed by the small size of the training population (Resende, 2008).
Efficiency of the GS
The results of the efficiency of the GS in relation to phenotypic selection showed the possibility of reducing the selection cycle time by 50% for nine evaluated traits. This reduction allows the breeders to maximize the genetic gains per unit time, besides early selection (Asoro et al., 2013; Simeão Resende et al., 2014; Yabe et al., 2018). By applying this strategy, breeders will be able to eliminate undesirable genotypes and focus efforts on potential genotypes, and therefore reduce maintenance costs for breeding populations in the field. The fact that selection based on phenotypic data is more efficient than genomic selection for some traits can be explained by the number of evaluated genotypes.
Genomic selection uses much more information on parentage than phenotypic selection, which is based on pedigree. Then genomic heritability and accuracy of genomic selection can sometimes be higher than those parameters from phenotypic selection. And this can be explained by the many more genetic relationship in the G (the genomic relationship matrix) than in A (the genetic relationship matrix based on genealogy). This increase in the amount of information by using the genomic matrix G can, sometimes, lead to better and more precise estimations, and predictions. This fact can explain the differences between the results from genomic and phenotypic approaches observed in our paper. Another aspect is referring to the ability of SNPs to capture causal variants associated to the traits. Some markers are more informative for some traits than for others. This can explain the different behaviors presented by the different traits.
Perspectives on the Use of GS in Coffea arabica
With globalization and a significant increase in the world's population, the demand for techniques to assist breeders in the development of new cultivars has intensified. In this sense, the elucidation and use of genomic information, including GS studies, allows the access to genetic information, which is potentially useful for coffee breeding programs. The increased knowledge of the genetic variation in breeding populations will reduce the time and resources intended to development a new cultivar. Moreover, it will enable the selection of breeding lines/cultivars of superior quality, which are more adapted and productive.
Conclusion
Genome-wide selection proved to be promising for C. arabica breeding for reducing the selection cycle time. Agronomic traits are highly complex; they are controlled by several QTL, and present low genomic heritabilities, evidencing the need to incorporate genomic selection methodologies in the breeding programs of this species.
Author Contributions
TS conceived the work, analyzed the data, discussed the different aspects of Genomic Selection, and wrote the first draft of the paper. EC conceived the work, supervised the data analysis, discussed the different aspects of Genomic Selection, and wrote the paper. EA provided technical assistance with DNA extraction, marker analysis, and wrote the paper. AO, AP, NS, and LZ provided phenotypic data from the breeding program and supervised the work. MR analyzed the data and discussed the different aspects of Genomic Selection, while the final manuscript was written in collaboration.
Conflict of Interest Statement
The authors declare that the research was conducted in the absence of any commercial or financial relationships that could be construed as a potential conflict of interest.
Acknowledgments
This work was financially supported by the Brazilian Coffee Research and Development Consortium (Consórcio Brasileiro de Pesquisa e Desenvolvimento do Café – CBP&D/Café), by the Foundation for Research Support of the state of Minas Gerais (FAPEMIG), by the National Council of Scientific and Technological Development (CNPq), by the Coordenação de Aperfeiçoamento de Pessoal de Nível Superior - Brasil (CAPES) - Finance Code 001, and by the National Institutes of Science and Technology of Coffee (INCT/Café).
References
Alkimim, E. R., Caixeta, E. T., Sousa, T. V., Pereira, A. A., de Oliveira, A. C. B., Zambolim, L., et al. (2017). Marker-assisted selection provides arabica coffee with genes from other Coffea species targeting on multiple resistance to rust and coffee berry disease. Mol. Breed. 37:6. doi: 10.1007/s11032-016-0609-1
Asoro, F. G., Newell, M. A., Beavis, W. D., Scott, M. P., Tinker, N. A., and Jannink, J.-L. (2013). Genomic, marker-assisted, and pedigree-BLUP selection methods for β-Glucan concentration in elite oat. Crop Sci. 53, 1894–1906. doi: 10.2135/cropsci2012.09.0526
Azevedo Peixoto, L., de Laviola, B. G., Alves, A. A., Rosado, T. B., and Bhering, L. L. (2017). Breeding Jatropha curcas by genomic selection: a pilot assessment of the accuracy of predictive models. PLoS ONE 12:e0173368. doi: 10.1371/journal.pone.0173368
Barbosa, M. H. P., Resende, M. D. V., Dias, L. A. D. S., de Souza Barbosa, G. V., de Oliveira, R. A., Peternelli, L. A., et al. (2012). Genetic improvement of sugar cane for bioenergy: the brazilian experience in network research with RIDESA. Crop Breed. Appl. Biotechnol. 12, 87–98. doi: 10.1590/S1984-70332012000500010
Bernardo, R. (2008). Molecular markers and selection for complex traits in plants: learning from the last 20 years. Crop Sci. 48, 1649–1664. doi: 10.2135/cropsci2008.03.0131
Bernardo, R., and Yu, J. (2007). Prospects for genomewide selection for quantitative traits in maize. Crop Sci. 47, 1082–1090. doi: 10.2135/cropsci2006.11.0690
Bhering, L. L. (2017). Rbio: a tool for biometric and statistical analysis using the R platform. Crop Breed. Appl. Biotechnol. 17, 187–190. doi: 10.1590/1984-70332017v17n2s29
Cavalcanti, J. J. V., de Resende, M. D. V., dos Santos, F. H. C., and Pinheiro, C. R. (2012). Predição simultânea dos efeitos de marcadores moleculares e seleção genômica ampla em cajueiro. Rev. Bras. Frutic. 34, 840–846. doi: 10.1590/S0100-29452012000300025
Cenci, A., Combes, M.-C., and Lashermes, P. (2012). Genome evolution in diploid and tetraploid Coffea species as revealed by comparative analysis of orthologous genome segments. Plant Mol. Biol. 78, 135–145. doi: 10.1007/s11103-011-9852-3
Clarindo, W. R., and Carvalho, C. R. (2008). First Coffea arabica karyogram showing that this species is a true allotetraploid. Plant Syst. Evol. 274, 237–241. doi: 10.1007/s00606-008-0050-y
Corrêa, T. R., Motoike, S. Y., Coser, S. M., da Silveira, G., de Resende, M. D. V., and Chia, G. S. (2015). Estimation of genetic parameters for in vitro oil palm characteristics (Elaeis guineensis Jacq.) and selection of genotypes for cloning capacity and oil yield. Ind. Crops Prod. 77, 1033–1038. doi: 10.1016/j.indcrop.2015.09.066
Crossa, J., de los Campos, G., Perez, P., Gianola, D., Burgueno, J., Araus, J. L., et al. (2010). Prediction of genetic values of quantitative traits in plant breeding using pedigree and molecular markers. Genetics 186, 713–724. doi: 10.1534/genetics.110.118521
Davey, J. W., Hohenlohe, P. A., Etter, P. D., Boone, J. Q., Catchen, J. M., and Blaxter, M. L. (2011). Genome-wide genetic marker discovery and genotyping using next-generation sequencing. Nat. Rev. Genet. 12, 499–510. doi: 10.1038/nrg3012
de los Campos, G., Gianola, D., Rosa, G. J. M., Weigel, K. A., and Crossa, J. (2010). Semi-parametric genomic-enabled prediction of genetic values using reproducing kernel Hilbert spaces methods. Genet. Res (Camb). 92, 295–308. doi: 10.1017/S0016672310000285
de los Campos, G., Hickey, J. M., Pong-Wong, R., Daetwyler, H. D., and Calus, M. P. L. (2013). Whole-genome regression and prediction methods applied to plant and animal breeding. Genetics 193, 327–345. doi: 10.1534/genetics.112.143313
Denoeud, F., Carretero-Paulet, L., Dereeper, A., Droc, G., Guyot, R., Pietrella, M., et al. (2014). The coffee genome provides insight into the convergent evolution of caffeine biosynthesis. Science 345, 1181–1184. doi: 10.1126/science.1255274
Desta, Z. A., and Ortiz, R. (2014). Genomic selection: genome-wide prediction in plant improvement. Trends Plant Sci. 19, 592–601. doi: 10.1016/j.tplants.2014.05.006
Diniz, L. E. C., Sakiyama, N. S., Lashermes, P., Caixeta, E. T., Oliveira, A. C. B., Zambolim, E. M., et al. (2005). Analysis of AFLP markers associated to the Mex-1 resistance locus in Icatu progenies. Crop. Breed. Appl. Biotechnol. 5, 387–393. doi: 10.12702/1984-7033.v05n04a03
Favoretto, P., da Silva, C. C., Tavares, A. G., Giatti, G., Moraes, P. F., Lobato, M. T. V., et al. (2017). Assisted-selection of naturally caffeine-free coffee cultivars—characterization of SNPs from a methyltransferase gene. Mol. Breed. 37:31. doi: 10.1007/s11032-017-0636-6
Fernando, R. L., Habier, D., Stricker, C., Dekkers, J. C. M., and Totir, L. R. (2007). Genomic selection. Acta Agric. Scand. Sect. A– Anim. Sci. 57, 192–195. doi: 10.1080/09064700801959395
Ferreira, R. T., Viana, A. P., Barroso, D. G., Resende, M. D. V., and de do Amaral, A. T. Jr. (2012). Toona ciliata genotype selection with the use of individual BLUP with repeated measures. Sci. Agric. 69, 210–216. doi: 10.1590/S0103-90162012000300006
Ganal, M. W., Altmann, T., and Röder, M. S. (2009). SNP identification in crop plants. Curr. Opin. Plant Biol. 12, 211–217. doi: 10.1016/j.pbi.2008.12.009
Garcia, C., Lima, B., Almeida, A., Marques, W., Resende, M., Vencovsky, R., et al. (2011). Genome wide selection for Eucalyptus improvement at international paper in Brazil. BMC Proc. 5:44. doi: 10.1186/1753-6561-5-S7-P44
Gianola, D. (2006). Genomic-assisted prediction of genetic value with semiparametric procedures. Genetics 173, 1761–1776. doi: 10.1534/genetics.105.049510
Gianola, D. (2013). Priors in whole-genome regression: the bayesian alphabet returns. Genetics 194, 573–596. doi: 10.1534/genetics.113.151753
Goddard, M. (2009). Genomic selection: prediction of accuracy and maximisation of long term response. Genetica 136, 245–257. doi: 10.1007/s10709-008-9308-0
Gois, I. B., Borém, A., Cristofani-Yaly, M., de Resende, M. D. V., Azevedo, C. F., Bastianel, M., et al. (2016). Genome wide selection in Citrus breeding. Genet. Mol. Res. 15:gmr15048863. doi: 10.4238/gmr15048863
Grattapaglia, D., and de Resende, M. D. V. (2011). Genomic selection in forest tree breeding. Tree Genet. Genomes 7, 241–255. doi: 10.1007/s11295-010-0328-4
Hayes, B. J., Bowman, P. J., Chamberlain, A. J., and Goddard, M. E. (2009). Invited review: genomic selection in dairy cattle: progress and challenges. J. Dairy Sci. 92, 433–443. doi: 10.3168/jds.2008-1646
Heffner, E. L., Jannink, J.-L., Iwata, H., Souza, E., and Sorrells, M. E. (2011a). Genomic selection accuracy for grain quality traits in biparental wheat populations. Crop Sci. 51, 2597–26056. doi: 10.2135/cropsci2011.05.0253
Heffner, E. L., Jannink, J.-L., and Sorrells, M. E. (2011b). Genomic selection accuracy using multifamily prediction models in a wheat breeding program. Plant Genome J. 4, 65–75. doi: 10.3835/plantgenome2010.12.0029
Heffner, E. L., Lorenz, A. J., Jannink, J.-L., and Sorrells, M. E. (2010). Plant breeding with genomic selection: gain per unit time and cost. Crop Sci. 50, 1681–1690. doi: 10.2135/cropsci2009.11.0662
Heffner, E. L., Sorrells, M. E., and Jannink, J.-L. (2009). Genomic selection for crop improvement. Crop Sci. 49, 1–12. doi: 10.2135/cropsci2008.08.0512
Henderson, C. R. (1975). Best linear unbiased estimation and prediction under a selection model. Biometrics 31, 423–449. doi: 10.2307/2529430
Heslot, N., Jannink, J.-L., and Sorrells, M. E. (2015). Perspectives for genomic selection applications and research in plants. Crop Sci. 55, 1–12. doi: 10.2135/cropsci2014.03.0249
Iwata, H., Hayashi, T., and Tsumura, Y. (2011). Prospects for genomic selection in conifer breeding: a simulation study of Cryptomeria japonica. Tree Genet. Genomes 7, 747–758. doi: 10.1007/s11295-011-0371-9
Jannink, J.-L., Lorenz, A. J., and Iwata, H. (2010). Genomic selection in plant breeding: from theory to practice. Brief. Funct. Genomics 9, 166–177. doi: 10.1093/bfgp/elq001
Krueger, R. F., South, S., Johnson, W., and Iacono, W. (2008). The heritability of personality is not always 50%: gene-environment interactions and correlations between personality and parenting. J. Pers. 76, 1485–1522. doi: 10.1111/j.1467-6494.2008.00529.x
Kwok, P.-Y., and Gu, Z. (1999). Single nucleotide polymorphism libraries: why and how are we building them? Mol. Med. Today 5, 538–543. doi: 10.1016/S1357-4310(99)01601-9
Lande, R., and Thompson, R. (1990). Efficiency of marker-assisted selection in the improvement of quantitative traits. Genetics 124, 743–756.
Lashermes, P., Combes, M.-C., Robert, J., Trouslot, P., D'Hont, A., Anthony, F., et al. (1999). Molecular characterisation and origin of the Coffea arabica L. genome. Mol. Gen. Genet. 261, 259–266.
Lashermes, P., Hueber, Y., Combes, M.-C., Severac, D., and Dereeper, A. (2016). Inter-genomic DNA exchanges and homeologous gene silencing shaped the nascent allopolyploid coffee genome (Coffea arabica L.). G3 (Bethesda) 6, 2937–2948. doi: 10.1534/g3.116.030858
Legarra, A., Robert-Granie, C., Manfredi, E., and Elsen, J.-M. (2008). Performance of genomic selection in mice. Genetics 180, 611–618. doi: 10.1534/genetics.108.088575
Li, M., Liu, X., Bradbury, P., Yu, J., Zhang, Y.-M., Todhunter, R. J., et al. (2014). Enrichment of statistical power for genome-wide association studies. BMC Biol. 12, 73. doi: 10.1186/s12915-014-0073-5
Longin, C. F. H., Mi, X., and Würschum, T. (2015). Genomic selection in wheat: optimum allocation of test resources and comparison of breeding strategies for line and hybrid breeding. Theor. Appl. Genet. 128, 1297–1306. doi: 10.1007/s00122-015-2505-1
Meuwissen, T. H., Hayes, B. J., and Goddard, M. E. (2001). Prediction of total genetic value using genome-wide dense marker maps. Genetics 157, 1819–1829.
Moncada, M. D. P., Tovar, E., Montoya, J. C., González, A., Spindel, J., and McCouch, S. (2016). A genetic linkage map of coffee (Coffea arabica L.) and QTL for yield, plant height, and bean size. Tree Genet. Genomes 12:5. doi: 10.1007/s11295-015-0927-1
Ornella, L., Singh, S., Perez, P., Burgueño, J., Singh, R., Tapia, E., et al. (2012). Genomic prediction of genetic values for resistance to wheat rusts. Plant Genome J. 5:136. doi: 10.3835/plantgenome2012.07.0017
Patel, D. A., Zander, M., and Dalton-Morgan, J. (2015). “Advances in plant genotyping: where the future will take us,” in Plant Genotyping, ed. J. Batley (New York, NY: Springer), 1–11.
Patterson, H. D., and Thompson, R. (1971). Recovery of inter-block information when block sizes are unequal. Biometrika 58, 545–554. doi: 10.1093/biomet/58.3.545
Pereira, T. B., Carvalho, J. P. F., Botelho, C. E., de Resende, M. D. V., de Rezende, J. C., and Mendes, A. N. G. (2013). Eficiência da seleção de progênies de café F4 pela metodologia de modelos mistos (REML/BLUP). Bragantia 72, 230–236. doi: 10.1590/brag.2013.031
Perez, P., and de los Campos, G. (2014). Genome-wide regression and prediction with the bglr statistical package. Genetics 198, 483–495. doi: 10.1534/genetics.114.164442
Pestana, K. N., Capucho, A. S., Caixeta, E. T., de Almeida, D. P., Zambolim, E. M., Cruz, C. D., et al. (2015). Inheritance study and linkage mapping of resistance loci to Hemileia vastatrix in Híbrido de Timor UFV 443-03. Tree Genet. Genomes 11:72. doi: 10.1007/s11295-015-0903-9
Poland, J. (2015). Breeding-assisted genomics. Curr. Opin. Plant Biol. 24, 119–124. doi: 10.1016/j.pbi.2015.02.009
Price, A. L., Zaitlen, N. A., Reich, D., and Patterson, N. (2010). New approaches to population stratification in genome-wide association studies. Nat. Rev. Genet. 11, 459–463. doi: 10.1038/nrg,2813
R Core Team (2017). R: A Language and Environment for Statistical Computing. Available online at: https://www.r-project.org/
Resende, M., Silva, F., Resende Junior, M. F. R., and Azevedo, C. (2014b). “Genome-wide selection,” in Biotechnology and Plant Breeding, eds. A. Borem and R. Fritsche-Neto (San Diego, CA: Elsevier), 105–133.
Resende, M. D. V. (2008). Genômica Quantitativa e Seleção no Melhoramento de Plantas Perenes e Animais. Colombo: E.
de Resende, M. D. V. (2007). Matemática e Estatística na Análise de Experimentos e no Melhoramento Genético. Colombo: Embrapa Florestas Available online at: https://www.bdpa.cnptia.embrapa.br/consulta/busca?b=pc&id=314759&biblioteca=vazio&busca=autoria:%22RESENDE, M. D. V. de%22&qFacets=autoria:%22RESENDE, M. D. V. de%22&sort=&paginacao=t&paginaAtual=1
de Resende, M. D. V. (2016). Software Selegen-REML/BLUP: a useful tool for plant breeding. Crop Breed. Appl. Biotechnol. 16, 330–339. doi: 10.1590/1984-70332016v16n4a49
Resende, M. D. V., de Lopes, P., Silva, R. L., and Da Pires, I. E. (2008). Seleção genômica ampla (GWS) e maximização da eficiência do melhoramento genético. Pesqui. Florest. Bras. 56, 63–77.
Resende, M. D. V., de Resende, M. F. R. J., Sansaloni, C. P., Petroli, C. D., Missiaggia, A. A., Aguiar, A. M., et al. (2012a). Genomic selection for growth and wood quality in Eucalyptus: capturing the missing heritability and accelerating breeding for complex traits in forest trees. New Phytol. 194, 116–128. doi: 10.1111/j.1469-8137.2011.04038.x
Resende, M. D. V., de Silva, F. F., and e Azevedo, C. F. (2014a). Estatística Matemática, Biométrica e Computacional: Modelos Mistos, Multivariados, Categorias e Generalizados (REML/BLUP), Inferência Bayesiana, Regressão Aleatória, Seleção Genômica, QTI-GWAS, Estatística Espacial e Temporal, Competição, Sobrevivência. 1st edn. Viçosa: Suprema Available online at: http://www.editoraufv.com.br/produto/1840466/estatistica-matematica-biometrica-e-computacional
Resende, M. D. V., and Duarte, J. B. (2007). Precisão e controle de qualidade em experimentos de avaliação de cultivares. Pesqui. Agropecuária Trop. 37, 182–194.
Resende, M. D. V., Silva, F. F., Lopes, P. S., and Azevedo, C. F. (2012d). Seleção genômica ampla (GWS) via modelos mistos (REML/BLUP), inferência bayesiana (MCMC), Regressão Aleatória Multivariada e Estatística Espacial. Viçosa.
Resende, M. D. V., and Thompson, R. (2004). Factor analytic multiplicative mixed models in the analysis of multiple experiments. Rev. Matemática e Estatíst. 22, 1–22.
Resende, M. F. R. J., Muñoz, P., Acosta, J. J., Peter, G. F., Davis, J. M., Grattapaglia, D., et al. (2012b). Accelerating the domestication of trees using genomic selection: accuracy of prediction models across ages and environments. New Phytol. 193, 617–624. doi: 10.1111/j.1469-8137.2011.03895.x
Resende, M. F. R. J., Munoz, P., Resende, M. D. V., de Garrick, D. J., Fernando, R. L., Davis, J. M., et al. (2012c). Accuracy of genomic selection methods in a standard data set of loblolly pine (Pinus taeda L.). Genetics 190, 1503–1510. doi: 10.1534/genetics.111.137026
Riedelsheimer, C., Czedik-Eysenberg, A., Grieder, C., Lisec, J., Technow, F., Sulpice, R., et al. (2012). Genomic and metabolic prediction of complex heterotic traits in hybrid maize. Nat. Genet. 44, 217–220. doi: 10.1038/ng.1033
Sant'Ana, G. C., Pereira, L. F. P., Pot, D., Ivamoto, S. T., Domingues, D. S., Ferreira, R. V., et al. (2018). Genome-wide association study reveals candidate genes influencing lipids and diterpenes contents in Coffea arabica L. Sci. Rep. 8:465. doi: 10.1038/s41598-017-18800-1
Simeão Resende, R. M., Casler, M. D., and Vilela de Resende, M. D. (2014). Genomic selection in forage breeding: accuracy and methods. Crop Sci. 54, 143–156. doi: 10.2135/cropsci2013.05.0353
Soller, M., and Beckmann, J. S. (1983). Genetic polymorphism in varietal identification and genetic improvement. Theor. Appl. Genet. 67, 25–33. doi: 10.1007/BF00303917
Sousa, T. V., Caixeta, E. T., Alkimim, E. R., de Oliveira, A. C. B., Pereira, A. A., Sakiyama, N. S., et al. (2017). Population structure and genetic diversity of coffee progenies derived from Catuaí and Híbrido de Timor revealed by genome-wide SNP marker. Tree Genet. Genomes 13:124. doi: 10.1007/s11295-017-1208-y
Spinelli, V. M., Dias, L. A. S., Rocha, R. B., and Resende, M. D. V. (2015). Estimates of genetic parameters with selection within and between half-sib families of Jatropha curcas L. Ind. Crops Prod. 69, 355–361. doi: 10.1016/j.indcrop.2015.02.024
Viana, J. M. S., Faria, V. R., Fonseca e Silva, F., and de Resende, M. D. V. (2011). Best linear unbiased prediction and family selection in crop species. Crop Sci. 51, 2371–2381. doi: 10.2135/cropsci2011.03.0153
Vidal, R. O., Mondego, J. M. C., Pot, D., Ambrosio, A. B., Andrade, A. C., Pereira, L. F. P., et al. (2010). A high-throughput data mining of single nucleotide polymorphisms in coffea species expressed sequence tags suggests differential homeologous gene expression in the allotetraploid Coffea arabica. Plant Physiol. 154, 1053–1066. doi: 10.1104/pp.110.162438
Wang, C., Zhan, X., Bragg-Gresham, J., Kang, H. M., Stambolian, D., Chew, E. Y., et al. (2014). Ancestry estimation and control of population stratification for sequence-based association studies. Nat. Genet. 46, 409–415. doi: 10.1038/ng.2924
Wong, C. K., and Bernardo, R. (2008). Genomewide selection in oil palm: increasing selection gain per unit time and cost with small populations. Theor. Appl. Genet. 116, 815–824. doi: 10.1007/s00122-008-0715-5
Wray, N. R., Yang, J., Hayes, B. J., Price, A. L., Goddard, M. E., and Visscher, P. M. (2013). Pitfalls of predicting complex traits from SNPs. Nat. Rev. Genet. 14, 507–515. doi: 10.1038/nrg3457
Xu, Y., Lu, Y., Xie, C., Gao, S., Wan, J., and Prasanna, B. M. (2012). Whole-genome strategies for marker-assisted plant breeding. Mol. Breed. 29, 833–854. doi: 10.1007/s11032-012-9699-6
Yabe, S., Hara, T., Ueno, M., Enoki, H., Kimura, T., Nishimura, S., et al. (2018). Potential of genomic selection in mass selection breeding of an allogamous crop: an empirical study to increase yield of common buckwheat. Front. Plant Sci. 9:276. doi: 10.3389/fpls.2018.00276
Zhang, Z., Ersoz, E., Lai, C.-Q., Todhunter, R. J., Tiwari, H. K., Gore, M. A., et al. (2010). Mixed linear model approach adapted for genome-wide association studies. Nat. Genet. 42, 355–360. doi: 10.1038/ng.546
Keywords: genetic gains, selective efficiency, genomic-enabled prediction accuracy, plant breeding, SNP molecular marker, complex traits, accelerating improvement
Citation: Sousa TV, Caixeta ET, Alkimim ER, Oliveira ACB, Pereira AA, Sakiyama NS, Zambolim L and Resende MDV (2019) Early Selection Enabled by the Implementation of Genomic Selection in Coffea arabica Breeding. Front. Plant Sci. 9:1934. doi: 10.3389/fpls.2018.01934
Received: 09 August 2018; Accepted: 12 December 2018;
Published: 08 January 2019.
Edited by:
Thomas Miedaner, University of Hohenheim, GermanyReviewed by:
Benoit Bertrand, Centre de Coopération Internationale en Recherche Agronomique pour le Développement (CIRAD), FranceDiego Jarquin, University of Nebraska-Lincoln, United States
Copyright © 2019 Sousa, Caixeta, Alkimim, Oliveira, Pereira, Sakiyama, Zambolim and Resende. This is an open-access article distributed under the terms of the Creative Commons Attribution License (CC BY). The use, distribution or reproduction in other forums is permitted, provided the original author(s) and the copyright owner(s) are credited and that the original publication in this journal is cited, in accordance with accepted academic practice. No use, distribution or reproduction is permitted which does not comply with these terms.
*Correspondence: Eveline Teixeira Caixeta, ZXZlbGluZS5jYWl4ZXRhQGVtYnJhcGEuYnI=