 Hongwei Jiang1,2*†
 Yingying Li1†Hongtao Qin1†Yongliang Li1Huidong Qi1Candong Li1,3Nannan Wang3Ruichao Li1Yuanyuan Zhao1
 Shiyu Huang1Jingyao Yu1Xinyu Wang1Rongsheng Zhu1Chunyan Liu1Zhenbang Hu1
 Zhaoming Qi1
 Dawei Xin1*Xiaoxia Wu1*Qingshan Chen1*
- 1College of Agriculture, Northeast Agricultural University, Harbin, China
- 2Jilin Academy of Agricultural Sciences, Soybean Research Institute, Changchun, China
- 3Heilongjiang Academy of Agricultural Sciences, Jiamusi Branch Institute, Jiamusi, China
First pod height (FPH) is a quantitative trait in soybean [Glycine max (L.) Merr.] that affects mechanized harvesting. A compatible combination of the FPH and the mechanized harvester is required to ensure that the soybean is efficiently harvested. In this study, 147 recombinant inbred lines, which were derived from a cross between ‘Dongnong594’ and ‘Charleston’ over 8 years, were used to identify the major quantitative trait loci (QTLs) associated with FPH. Using a composite interval mapping method with WinQTLCart (version 2.5), 11 major QTLs were identified. They were distributed on five soybean chromosomes, and 90 pairs of QTLs showed significant epistatic associates with FPH. Of these, 3 were main QTL × main QTL interactions, and 12 were main QTL × non-main QTL interactions. A KEGG gene annotation of the 11 major QTL intervals revealed 8 candidate genes related to plant growth, appearing in the pathways K14486 (auxin response factor 9), K14498 (serine/threonine-protein kinase), and K13946 (transmembrane amino acid transporter family protein), and 7 candidate genes had high expression levels in the soybean stems. These results will aid in building a foundation for the fine mapping of the QTLs related to FPH and marker-assisted selection for breeding in soybean.
Introduction
Soybean [Glycine max (L.) Merr.], which is widely grown worldwide, is a main plant oil source and food crop (Li et al., 2017). Traditional soybean cultivation depends on mechanized harvesting, which has restricted its production, and the breeding of suitable mechanized harvest-optimized varieties has become an urgent requirement for breeders (Paixao et al., 2016). First pod height (FPH) is a crucial characteristic of suitable mechanized harvesting varieties. Cultivars with a low FPH may be cut, damaged, or not harvested during mechanical harvesting (Milan et al., 2005). The main effects of planting distance, genotype, and seeding date are significant for FPH (Kang et al., 2017). Additionally, a QTL mapping analysis was applied in soybean, which laid an important foundation for cultivating new varieties suitable for mechanization (Fan et al., 2012). The FPH characteristics influence mechanized harvesting. Milan et al. (2005) investigated a genetic model of high-yield pods and concluded that the genes controlling FPH were recessive. Singh et al. (2013) hypothesized that FPH plays an important role in the economical harvesting of Faba bean. The FPH characteristics in other beans are excellent references for soybean, and the soybean FPH, comparatively, has a lower genetic coefficient of variation and higher heritability and genetic progress. FPH is a quantitative trait in soybean that is controlled by multiple factors, and is positively correlated with the yield.
Quantitative trait loci (QTL) mapping is a standard method for examining the quantitative traits. There are several methods used for QTL mapping, including interval mapping (IM; Korol et al., 1995), composite IM (CIM; Utz and Melchinger, 1996), and multiple IM (Kao et al., 1999). The QTL mapping methods have been used to examine the quantitative traits of many crops, including 100-kernel weight in maize (Raihan et al., 2016), the carotenoids content in potato (Campbell et al., 2014), the ratio of deep rooting in rice (Horii et al., 2006; Lou et al., 2015), and the seed coat surface in soybean (Otobe et al., 2015). The FPH is an important element of yield and has negative correlations with plant density and nitrogen rate in soybean breeding (Mehmet, 2008). Row spacing has no measurable effect on FPH (Grichar, 2007).
The QTLs with epistatic effects play critical roles in quantitative trait mapping (Cockerham and Zeng, 1996; Xing et al., 2002; Zhuang et al., 2002; Zhang et al., 2008). Previous studies of soybean yield and the related agronomic traits were mainly focused on the mapping of QTLs and the interactions among segregants, while paying less attention to the epistatic effects of QTLs, which are influenced by the genetic analysis and analysis limitations. Interactions between the QTLs are meaningful and control large effects (Lark et al., 1995). Wang et al. (1999) used a computer software program (QTL Mapper, version 1.0, Zhejiang University) to investigate the interval mapping of QTLs with additive, and additive × additive epistatic effects. QTL IciMapping is a commonly used software for mapping the QTLs in population (Meng et al., 2015). In the current research, we analyzed the QTLs of a recombinant inbred line (RIL) population using the CIM and ICIM methods, and detected the QTLs with epistatic effects.
Although soybean FPH has been genetically analyzed in a few preliminary studies, the main effects of soybean QTLs associated with the FPH have not been reported over many years. Furthermore, only a few candidate genes for soybean FPH have been reported. In this study, a 147 RIL population was used with a previously constructed high-density genetic map (Qi et al., 2014). The population was planted over 8 consecutive years for phenotypic observations to identify the main-effect QTLs. Epistatic effects were also analyzed to better understand the main-effect QTLs’ interactions. Furthermore, the candidate genes of soybean FPH were annotated, and qRT-PCR validation was conducted. Our results provide new QTLs associated with soybean FPH, which may improve soybean high-yield breeding and the selection of soybean varieties adapted to mechanized harvesting.
Materials and Methods
The FPH in an RIL Population Over 8 Years
The population consisting of 147 RILs was derived from a cross between two ILs, the America cultivar Charleston (♀) and the high protein cultivar Dongnong594 (♂). There were significant differences in FPH-associated traits between parents, and more significant differences in FPH-associated traits among the RILs. In November of each year, the parental materials were selected and 147 RILs, of 5 strains, with generally consistent growing trends were observed. Phenotypic measurements of the FPH were repeated three times during field harvesting. The FPH was recorded in cm from the ground to the bottom of the first pod over the cotyledon node (Grichar, 2007). The total length of the high-density genetic soybean map was 2,655.68 cm and included 5,308 specific-length amplified fragment markers, covering 20 linkage groups (LGs), with an average distance of 0.5 cm between the adjacent markers (Qi et al., 2014).
Planting Conditions and Field Management
From 2006 to 2015, except for 2011 and 2012, soybean was planted in the research field of the Northeast Agricultural University, Harbin, Heilongjiang Province (Harbin, latitude 45°74′N, longitude 126°72′E). A random block design with three replicates was used over the 8 years. The row length was 5 m, where 80 seeds were sown per row, and the fields were under general management. A one-way analysis of variance (ANOVA) and least significance difference test (LSD) multiple comparison of soybean FPH over 8 years were conducted using SPASS 17.0. Based on a variance analysis, the AOV model in QTL IciMapping version 3.2 was used to determine the broad-sense heritability (h2):
where r indicates the number of replications; δg2 indicates the genetic variance component; and δg2 indicates the environmental variance component.
QTL Analysis of Soybean FPH in the RIL Population
Windows QTL Cartographer version 2.5 was used to analyze the QTLs using a CIM model. Phenotypic data were analyzed using the 1,000 permutation test, and the significance was set at the P = 0.05 level to detect QTL. QTL IciMapping version 3.2 was used for the epistatic effect analysis. Mapping software MapChart version 2.2 was used for constructing the linkage map. The QTL naming was based on the method of McCouch (1997). Briefly, the QTL name was constructed as follows: q + trait name + LG or LG number + “-” + QTL number. The QTLs detected by two methods were used for QTL integration. The chromosome segment substitution line (CSSL) population, produced by the cross between the Chinese cultivar SN14 and wild soybean (Glycine soja Sieb. and Zucc.) line ZYD00006, was used for verifying the consensus QTLs. The genetic map was constructed by Xin et al. (2016). The field management of the CSSL population was the same as used for the RIL plants.
Gene Prediction of Major QTL Intervals
The ‘Williams 82.a2.v1’ genome has enough common genetic information to be defined as the reference genome for predicting the candidate genes. Soybase1 and the previously constructed high-density genetic map provided the genetic distances and physical positions that were used to determine the physical positions of the major QTL intervals. Using the genomic information provided by Phytozome2, and referring to the ‘Williams 82.a2.v1’ genome sequence, the soybean genes in the major QTL intervals were identified and the corresponding gene annotations were performed. Candidate genes involved in the growth and development of soybean were selected from the gene annotation data, which came mainly from the databases listed in Supplementary Table S1.
RT-qPCR Analysis of Soybean FPH Candidate Genes
Five materials were selected, where two (RIL-86 and RIL-101) of the materials were high FPH materials and three others (RIL-2, RIL-112, and RIL-141) were low FPH materials. Lines were chosen that had significant phenotypic differences between the high-value materials and low-value materials at P = 0.05 levels (Supplementary Table S2). Tissues from the stem apices of these five lines were collected at the ternate compound-leaf stage and stored at -80°C for RNA isolation. Experiments were performed by collecting three independent groups of samples, where each replicate was a pooled sample of three individual plants, and three technical repetitions were performed simultaneously.
Total RNA was extracted from plant materials using TRIzol reagent (Invitrogen3) according to the manufacturer’s instructions. cDNA was synthesized using Prime Script TMRT and a reagent reverse transcription kit, GmUKN1 (Genbank ID: 103870138), was used as an internal control. Real-time quantitative PCR (RT-qPCR) was performed using SYBR qPCR Mix (TransGen) on a LightCycler 480 System (Roche). The RT-qPCR reaction conditions were as follows: pre-denaturation cycle at 95°C for 30 s; followed by 40 cycles of 95°C for 5 s and 60°C for 30 s. The relative expression of FPH candidate genes from soybean stems was calculated using the following:
The ‘Williams 82’ gene sequences’ 3’UTR-ends from the Phytozome website2 were used with Primer Premier 5.0 to design specific primers (Supplementary Table S3).
Results
FPH Phenotypic Information Over 8 Years
The phenotypic information of RILs from 2006 to 2015 (except 2011 and 2012) are shown in Table 1. Over the 8 years, the average FPH of ‘Charleston’ was 2.21 cm less than that of ‘Dongnong594,’ except in 2007, 2008, and 2013. The FPH of the RIL population was significantly different in every year, ranging from 5.21 to 39.21 cm. In 2008, the phenotypic information had a maximum standard deviation (SD) and a coefficient of variation (CV) of 5.59 and 31.22%, respectively. The minimum SD and CV occurred in 2010, at 2.46 and 6.03%, respectively. The maximum and minimum kurtosis were 15.55 in 2006 and 0.08 in 2008, respectively. The maximum and minimum skewness were 2.75 in 2006 and 0.34 in 2013, respectively. The traits revealed large quantitative variability levels and fairly normal frequency distributions in different years (Figure 1). The RILs showed a general shift in distributions toward lower trait values. Thus, this population was suitable for QTL mapping analysis.
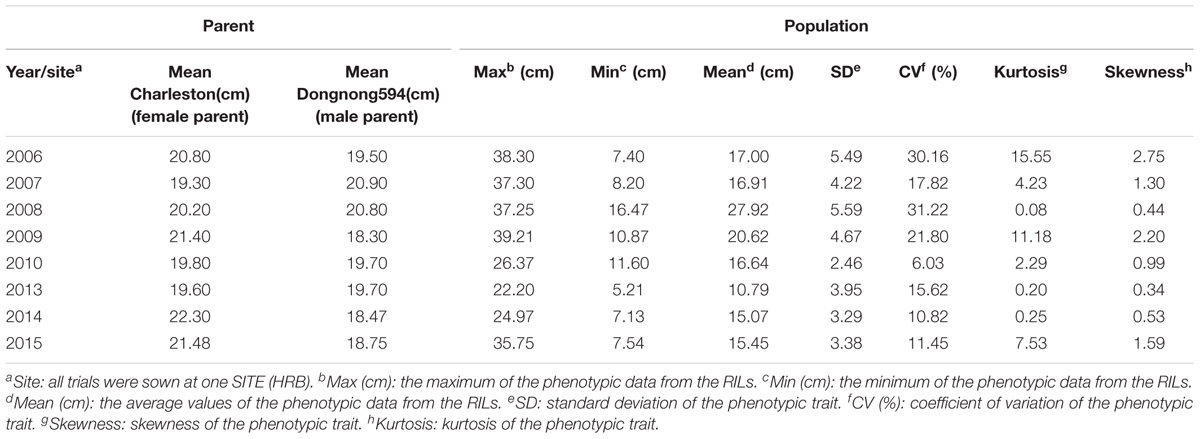
TABLE 1. The soybean FPH per parental cultivar and RIL population plants from 2006 to 2015 (except 2011 and 2012).
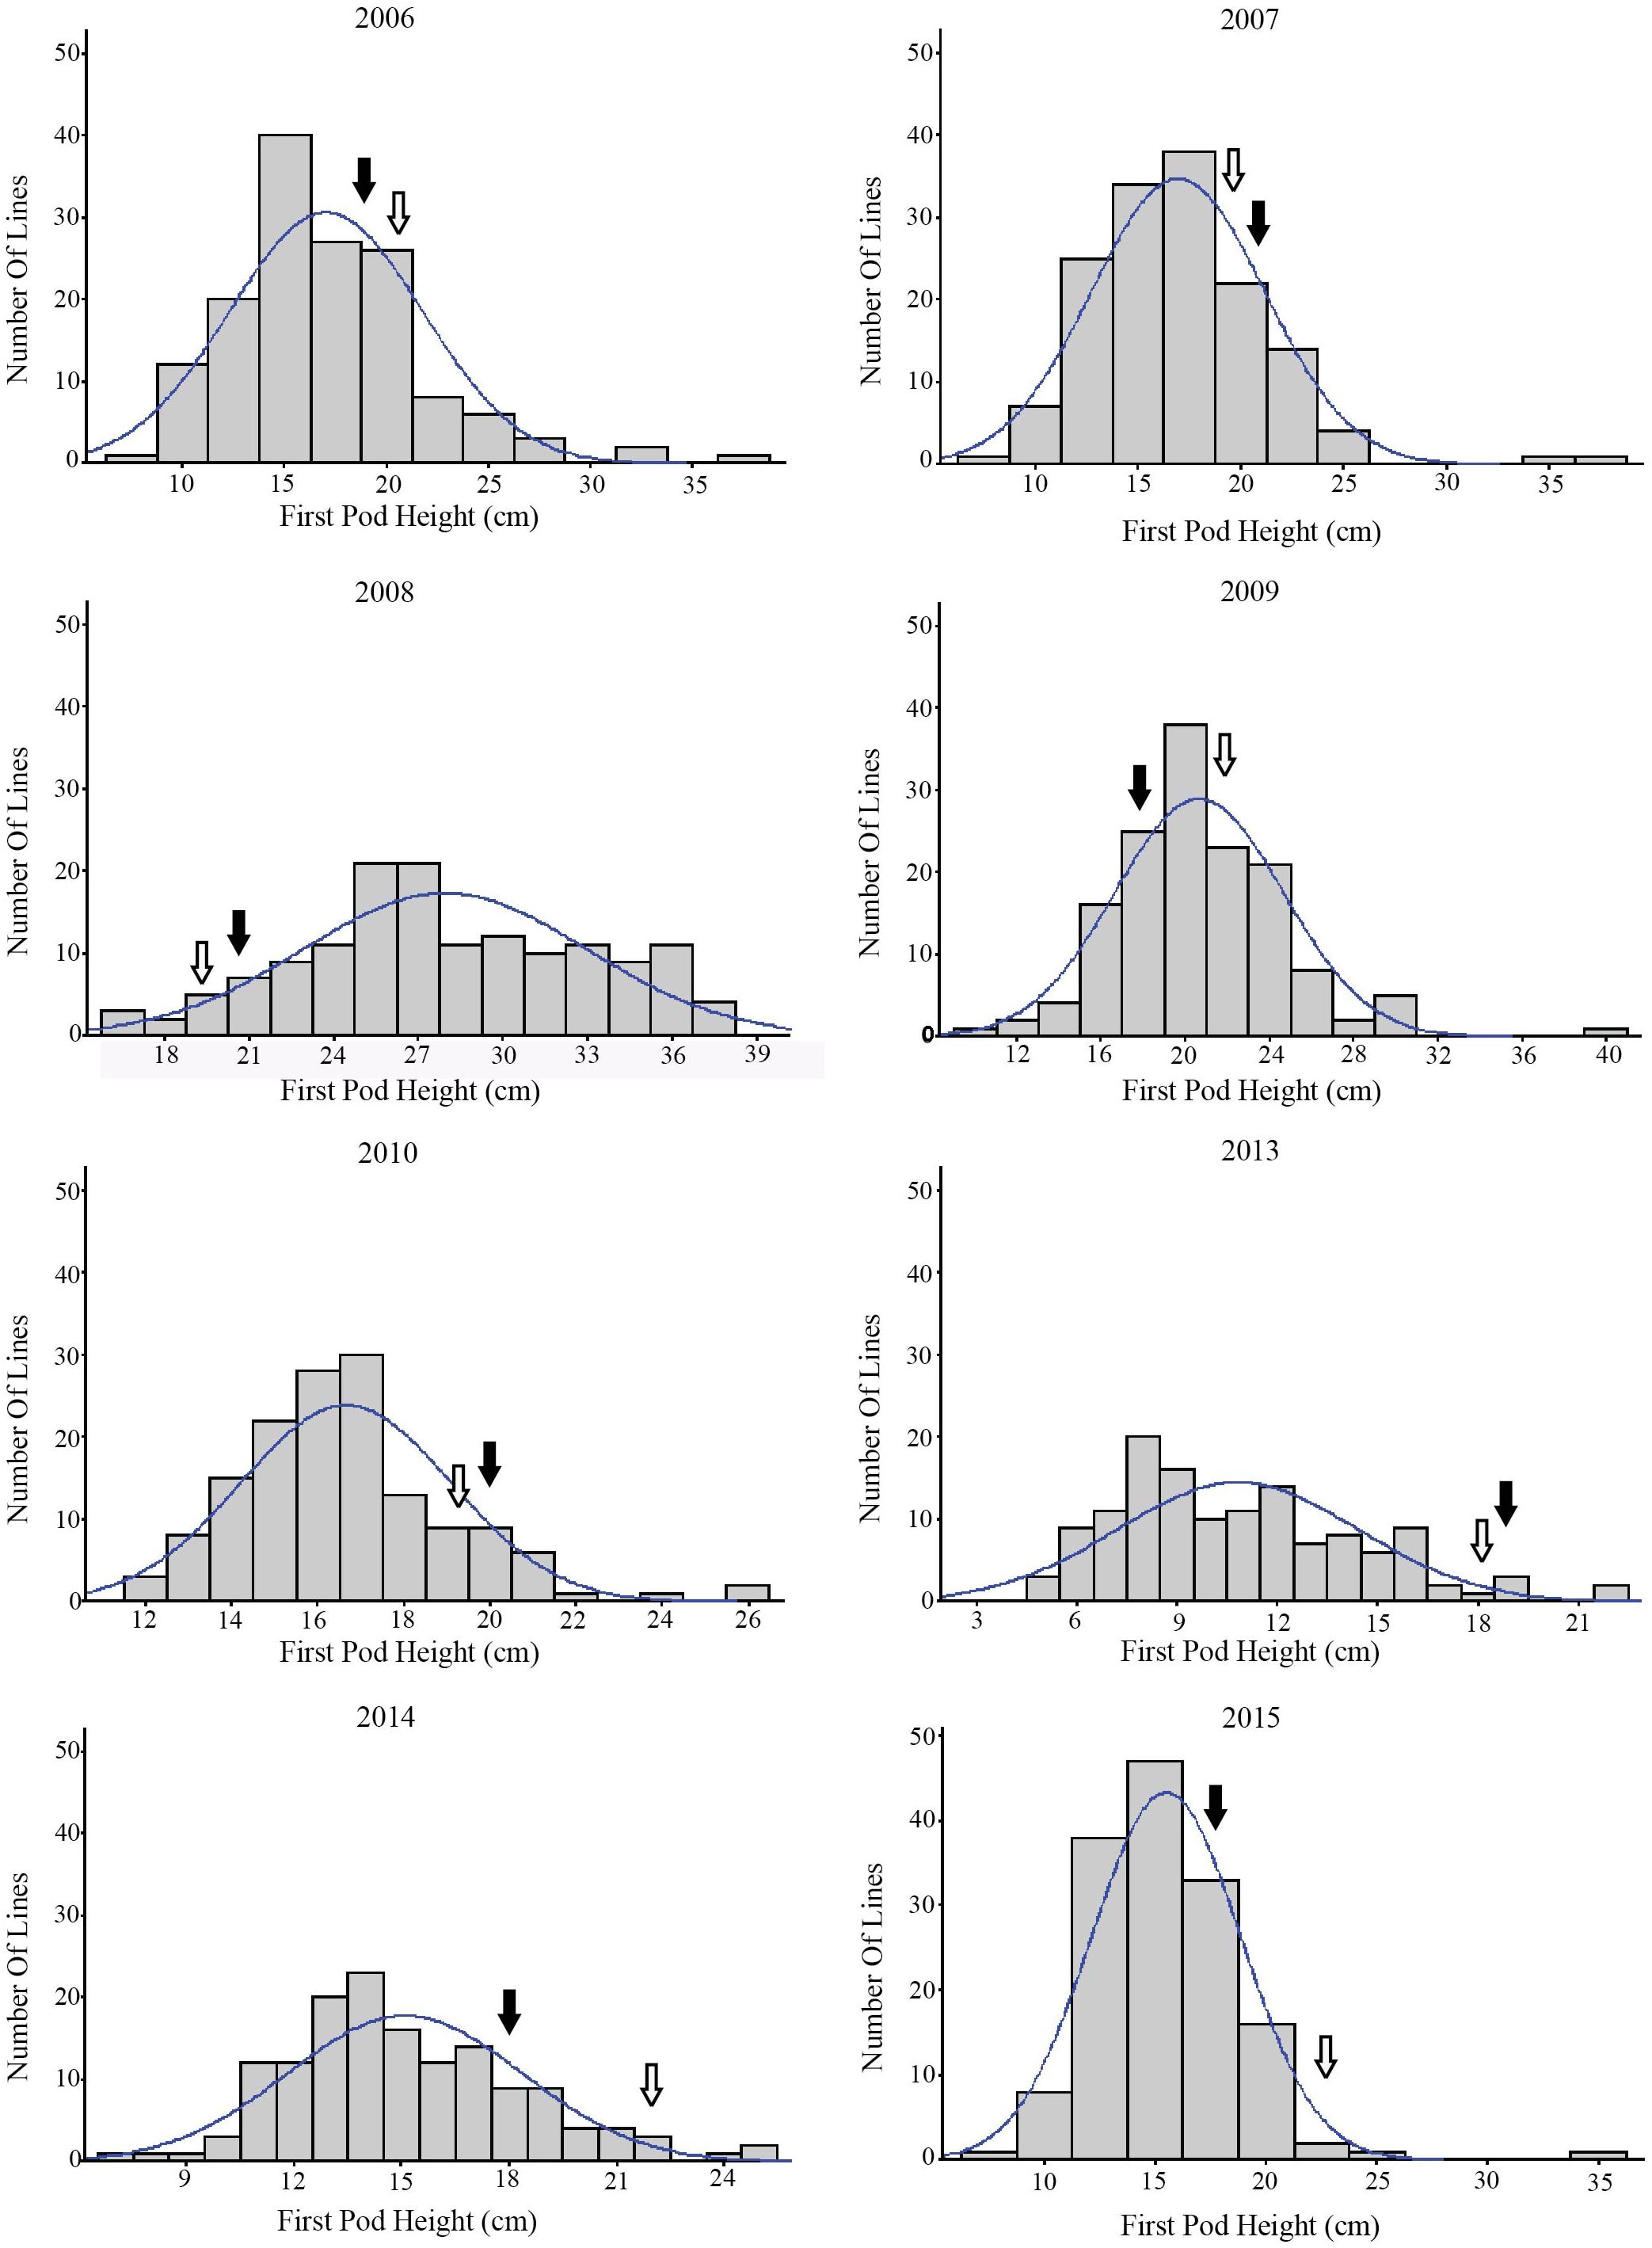
FIGURE 1. The frequency distribution of the soybean FPH in the RIL population over 8 years.
Environmental Conditions and Multiple Comparisons Analysis
The meteorological data over 8 years in Harbin are shown in Supplementary Tables S4–S6. The minimum and maximum annual average precipitation levels were 415.8 mm in 2014 and 633.5 mm in 2013, respectively (Supplementary Table S4). The minimum mean temperature in Harbin was 4.3°C in 2013, and the maximum mean temperature was 6.6°C in 2007 and 2008 (Supplementary Table S5). The maximum sunshine period was 2,379.2 h, in 2007, and the minimum sunshine period was 2,023.5 h in 2013 (Supplementary Table S6). The mean differences were significant at the 0.05 level, and the mean FPH values in 2008, 2009, and 2013 were significantly different from the mean FPH values in other years. Additionally, the mean FPH data in 2006 and 2007 were not significantly different from that of 2010, and the mean FPH data from 2006 was not significantly different from that of 2007. The mean FPH data from 2014 was not significantly different from that of 2015 (Supplementary Table S7). The h2 from 2006 to 2015 is 0.797, 0.778, 0857,0.800, 0.799, 0.897, 0.823, and 0.833, respectively (Table 2), and the overall broad heritability across 8 years is 0.160. The broad heritability per year is higher than the whole. The results also show that the FPH is greatly affected by the environmental factors.
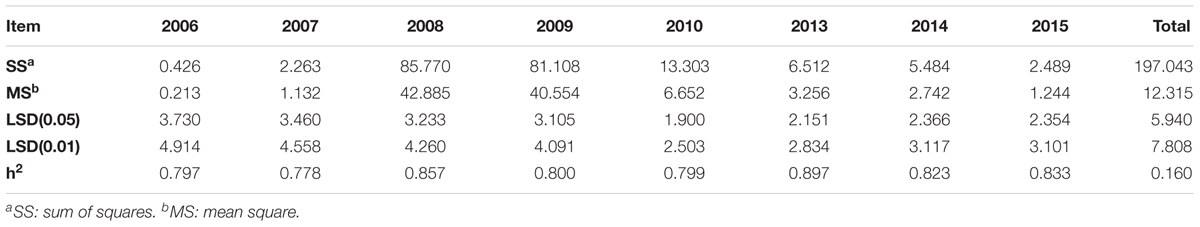
TABLE 2. The broad-sense heritability for soybean FPH.
QTL Mapping Analysis for FPH in the RIL Population
The FPH data were analyzed using the CIM method of Windows QTL Cartographer version 2.5. The results of the QTL analysis are presented in Table 3.
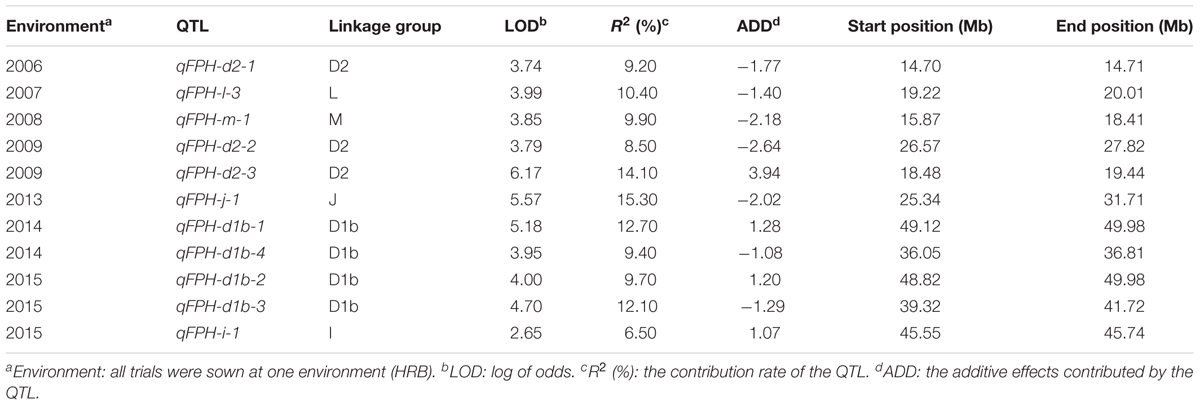
TABLE 3. QTL mapping of soybean FPH using the CIM method over 8 years.
In total, 11 QTLs associated with the FPH were detected during 2006 to 2015 (except 2011 and 2012). Four, three, one, one and one QTLs were located on LGs D1b, D2, L, M and J, respectively. The R2 (the contribution rate of the QTL) for all of the QTLs ranged from 6.50 to 15.30%, with the log of odds (LOD) values between 2.65 and 6.17. qPH-j-1 had the maximum R2 of 15.30% with an LOD value of 5.57, while qPH-i-1 had the minimum R2 of 6.5% with an LOD value of 2.65. On LG D2, qPH-d2-1, which had the minimum map distance of 0.001 Mb, was mapped between 14.70 and 14.71 Mb, thereby explaining ∼9.20% of the variation and having an additive effect of -1.77. On LGM, qPH-m-1, which had the maximum map distance of 2.54 Mb, was mapped between 15.87 and 18.41 Mb, thereby explaining ∼9.90% of the variation and having an additive effect of -2.18.
The major QTLs, qPH-d1b-1 and qPH-d1b-2, were detected in both 2014 and 2015 at the same time and were distributed on LG D1b. Their LOD scores were 5.18 and 4.00, respectively, and their R2 values were 12.70 and 9.70, respectively. They had additive effects of 1.28 and 1.20, respectively, and physical distances of 0.86 and 1.16 Mb, respectively.
QTL Analysis With Genetic Main and Epistatic Effects of the FPH in the RIL
The IciMapping method was used to analyze the epistatic effects of FPH over 8 years, and 90 QTL pairs showed epistatic effects (Table 4, Figure 2, and Supplementary Table S8).
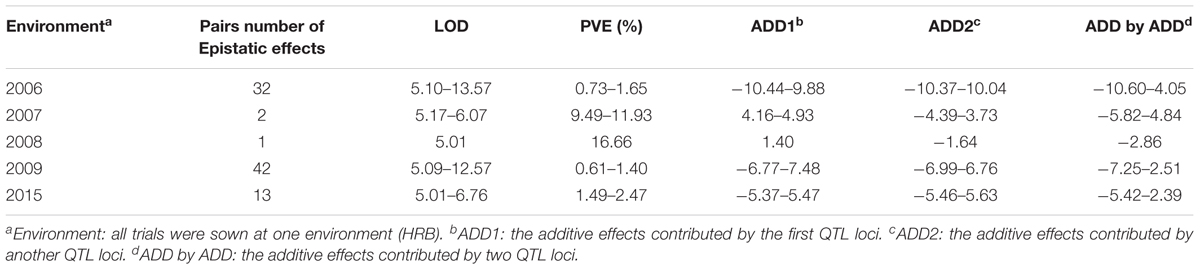
TABLE 4. Summary of the epistatic effect analysis of soybean FPH.
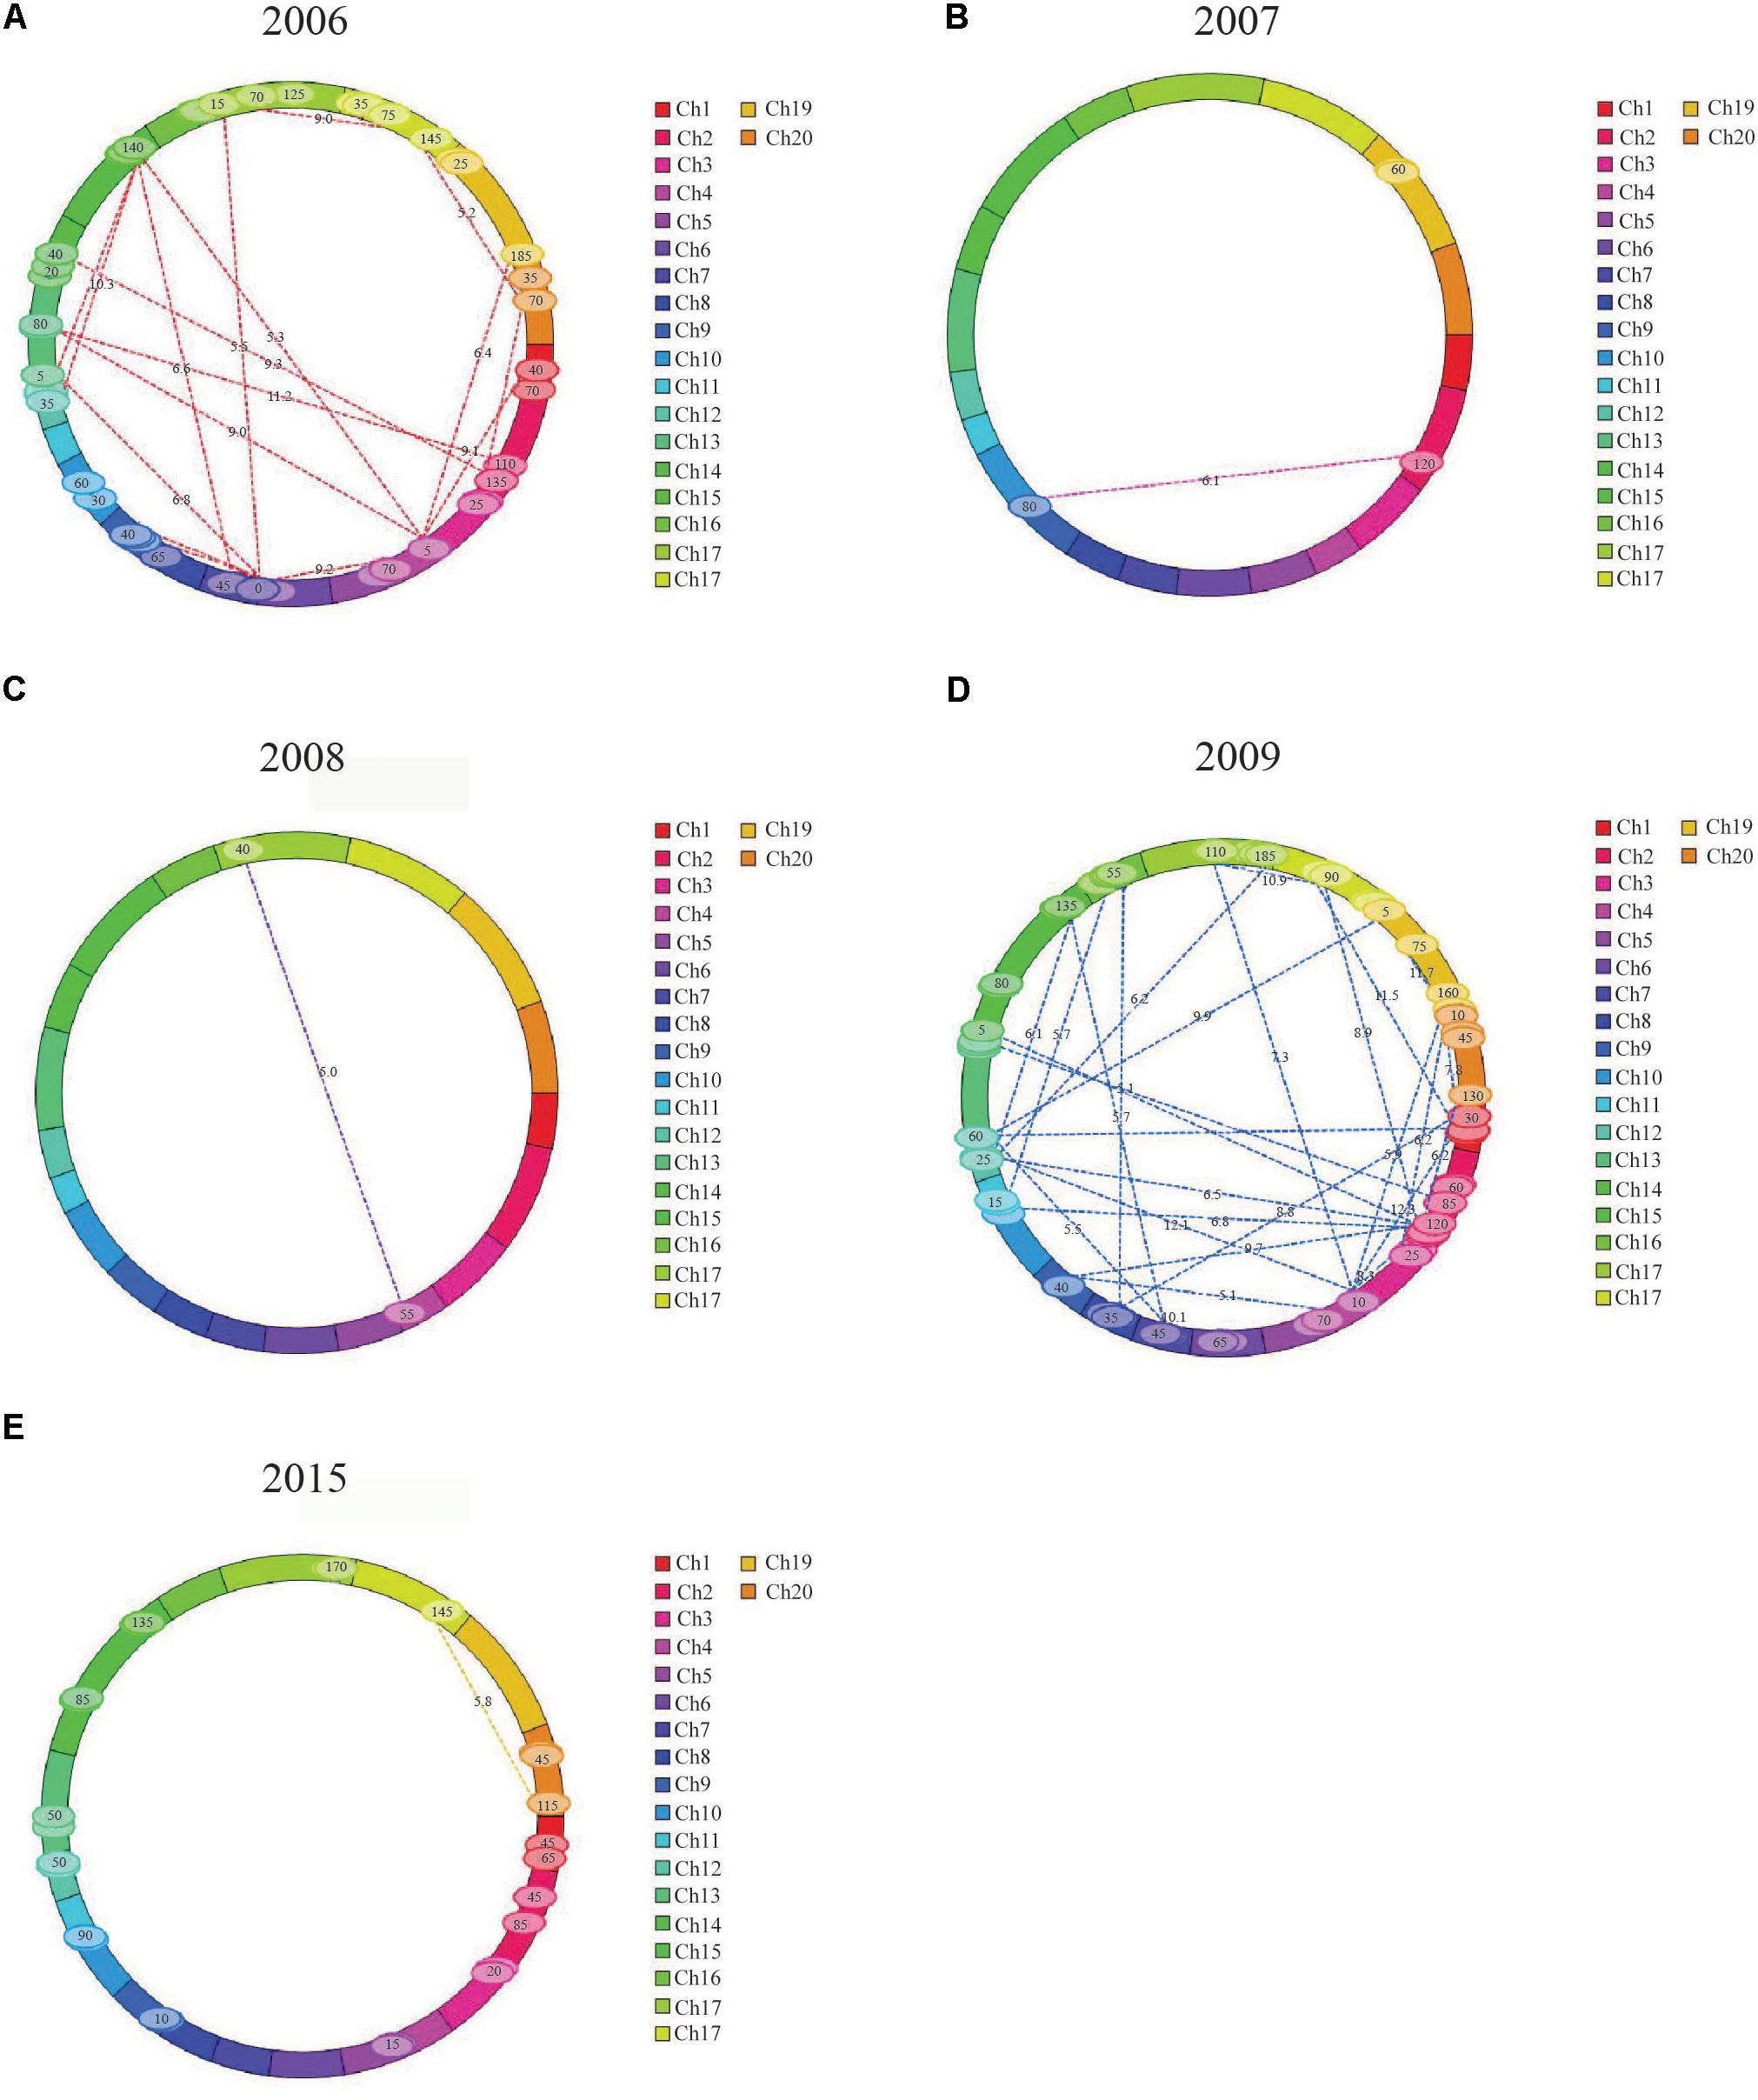
FIGURE 2. Pairs of QTLs showing significant additive × additive epistatic effects for FPH in the RIL population. (A) Thirty-two pairs of QTLs showing significant additive × additive epistatic effects for FPH in 2006. (B) One pair of QTLs showing significant additive × additive epistatic effects for FPH in 2007. (C) One pair of QTLs showing significant additive × additive epistatic effects for FPH in 2008. (D) Forty-two pairs of QTLs showing significant additive × additive epistatic effects for FPH in 2009. (E) Eleven pairs of QTLs showing significant additive × additive epistatic effects for FPH in 2015.
In 2006, 32 pairs of loci with epistatic effects were detected, and the phenotypic variation explained (PVE) ranged from 0.73 to 1.65%, with the LOD values between 5.10 and 13.57. The pair between qPH-g-5 and qPH-i-5 had the maximum additive × additive value of -4.05. The pair between qPH-c1-4 and qPH-c2-3 had the minimum additive × additive value of -10.60. There were no significant interaction effects between the epistasis and the environment.
In 2007, two pairs of loci with epistatic effects were detected, and the PVE ranged from 9.49 to 11.93%, with the LOD values between 5.17 and 6.07. The pair between qPH-d1b-6 and qPH-k-6 had the maximum additive × additive value of -4.84, and the pair between qPH-l-4 and qPH-l-5 had the minimum additive × additive value of -5.82. There were no significant interaction effects between the epistasis and the environment.
In 2008, one pair of loci with epistatic effects were detected, and the PVE was 16.66, with an LOD value of 5.01. The pair between qPH-c1-3 and qPH-d2-2 had an additive × additive value of -2.86. There was no significant interaction effect between the epistasis and the environment.
In 2009, 42 pairs of loci with epistatic effects were detected, and the PVE ranged from 0.61 to 1.40%, with the LOD values between 5.09 and 12.07. The pair between qPH-m-4 and qPH-h-6 had the maximum additive × additive value of -2.51. The pair between qPH-d1b-2 and qPH-d1b-3 had the minimum additive × additive value of -7.25. There were no significant interaction effects between the epistasis and the environment.
In 2015, 13 pairs of loci with epistatic effects were detected, and the PVE ranged from 1.49 to 2.47%, with the LOD values between 5.01 and 6.76. The pair between qPH-g-5 and qPH-i-6 had the maximum additive × additive value of -2.39, and the pair between qPH-o-3 and qPH-o-4 had the minimum additive × additive value of -5.42. There were no significant interaction effects between the epistasis and the environment.
Summary of the QTL and Epistatic Effect Analyses
Among the 90 pairs of loci with epistatic effects, three pairs revealed epistatic effects between the major QTLs, having PVEs of 1.07, 1.33, and 2.46%, with the LOD values of 5.45, 9.88, and 5.01, respectively. They were located on LGs M, D1b, and D2, respectively, and appeared in 2006, 2009, and 2015, respectively. In total, 12 pairs of loci revealed epistatic effects between the major QTLs and non-major QTLs, having PVEs ranging from 1.08 to 16.66%, and with the LOD values ranging from 5.01 to 9.88. They occurred in 2006, 2008, 2009, and 2015. Other pairs of loci revealed epistatic effects between the non-major QTLs, having PVEs ranging from 0.61 to 11.93%, and with the LOD values ranging from 5.09 to 13.57. They had additive × additive values ranging from -10.29 to -2.39.
Validation of Consensus QTLs
In comparing the positions of the 11 consensus QTL intervals, four were found to be in the same region of the CSSL gene map (Xin et al., 2016). Using Soybase1 and the major QTL intervals of the RIL population, the corresponding markers were filtered and the fragments were screened to verify the CSSL population by polyacrylamide gel electrophoresis, and the consensus QTLs associated with FPH on GM16 (24.56–31.71 Mbp) had a corresponding region in the substituted wild soybean chromosomal segment in CSSL-654, CSSL-640, and CSSL-1760 (Satt529–Satt547) (Xin et al., 2016; Figure 3A). However, there was no corresponding region in the substituted wild soybean chromosomal segment in CSSL-580, CSSL-503, and CSSL-695. The phenotypic data for the FPH of CSSL-654, CSSL-640, and CSSL-1760 were greater than the corresponding data for the recurrent parent ‘SN14’ (Figure 3A). However, the phenotypic data for the FPH of CSSL-580, CSSL-503, and CSSL-695 were lower than the corresponding data for ‘SN14.’ Thus, the substituted wild soybean chromosomal segment had an important influence on the FPH in soybean. The other three consensus QTLs associated with the FPH on GM17 (9.95–36.74 Mb) had a corresponding region in the substituted wild soybean chromosomal segment in CSSL-570, CSSL-631, and CSSL-537 (Satt582–Sat_001) (Xin et al., 2016; Figure 3B). However, there was no corresponding region in the substituted wild soybean chromosomal segment in CSSL-592, CSSL-671, and CSSL-695. The phenotypic data for the FPH of CSSL-570, CSSL-631, and CSSL-537 were greater than the corresponding data for the recurrent parent ‘SN14’ (Figure 3B). The phenotypic data for the FPH of CSSL-592, CSSL-671, and CSSL-695 were lower than the corresponding data for ‘SN14.’ Thus, the additive effects of the consensus QTLs had different directions, which corroborated the phenotypes of the CSSLs.
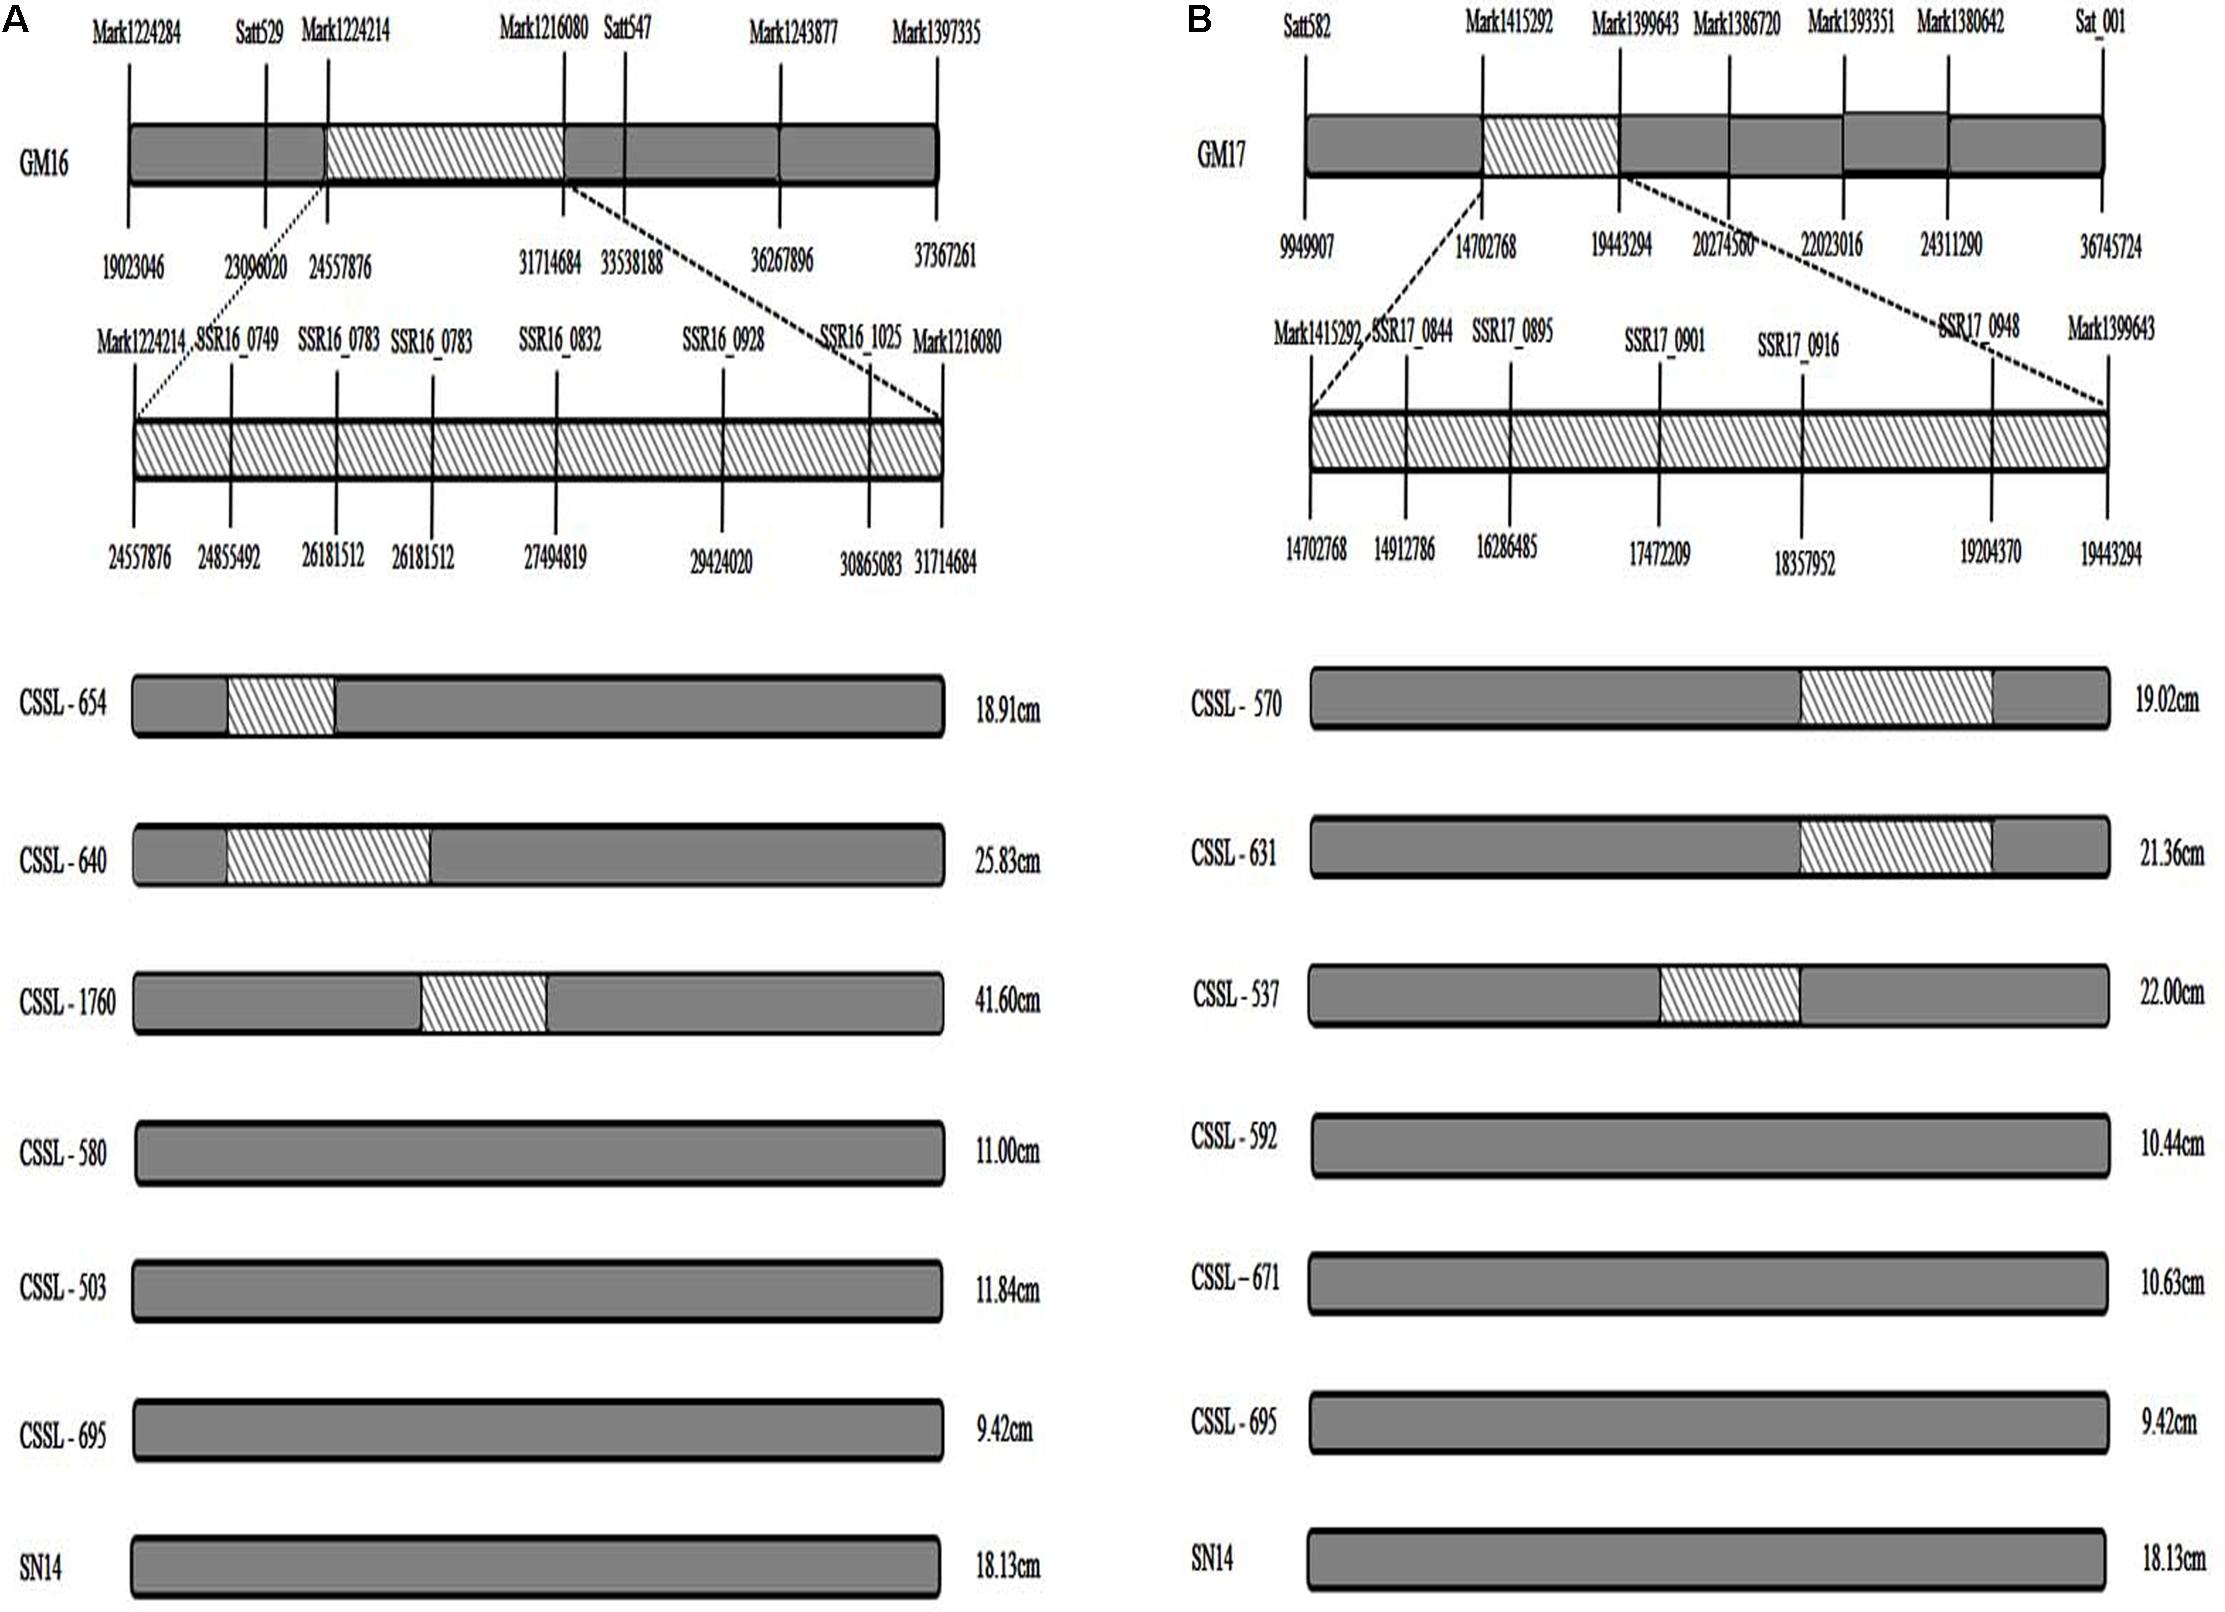
FIGURE 3. The distribution of substituted wild soybean chromosomal segments in CSSLs. (A) The distribution of substituted wild soybean chromosomal segments in CSSLs on GM16. (B) The distribution of substituted wild soybean chromosomal segments in CSSLs on GM17. Substituted wild soybean chromosomal segment.
Candidate Gene Mining in Major QTL Intervals for Soybean FPH
Among the 11 major QTL intervals, 3 of them, qFPH-d2-1, qFPH-d1b-1, and qFPH-d1b-2, contained no genes. In total, 1,526 candidate genes were screened from the gene annotation data set (Supplementary Table S9) and 8 were involved in the soybean FPH growth pathway according to the gene ontology (GO) and annotation information (Supplementary Table S10). The major QTL intervals in which these related genes are located, the homologous genes in Arabidopsis, and the related GO annotations are shown (Figure 4 and Supplementary Tables S3, S6). Ko04075 is involved in the plant hormone signal transduction pathway (Miao et al., 2016), which includes K14486 (auxin response factor 9), K14488 [small auxin (AUX) up RNA (SAUR) family protein], K14498 (serine/threonine-protein kinase SRK2), and K13946 (transmembrane amino acid transporter family protein). Four homologous genes were predicted in Arabidopsis and associated with the pathway. Glyma.07G134800 occurred in the KEGG pathway (pathway_id K14486) associated with the AUX response factor, which participates in the generation of AUX/indole acetic acid and SAUR, to promote cell enlargement and plant growth. The Arabidopsis homolog of Glyma.07G134800 is AT4G23980, which contains the AUX-responsive family protein domain, and participates in changing the state or activity of a cell or an organism as a result of a hormone stimuli. Glyma.16G129600 occurred in a KEGG pathway (pathway_id K14488), and the Arabidopsis homolog of Glyma.16G129600 is AT4G34760, which contains an AUX-responsive family protein domain. Lavy et al. (2016) revealed that the AUX/indole acetic acid functions and the AUX responses are related to plant growth. Glyma.17G178800 occurred in a KEGG pathway (pathway_id K14498) that participates in carotenoid biosynthesis, and SNF1-related protein kinase (SnRK2) promotes abscisic acid-responsive element binding-factor generation and then stomatal closure and seed dormancy. The Arabidopsis homolog of Glyma.17G178800 is AT5G66880, which contains a STKc_SnRK2-3 domain, and plays a role in plant tolerance to salinity and abscisic acid (Yang et al., 2012). Glyma.07G147000 occurred in a KEGG pathway (pathway_id K13946) that participates in tryptophan metabolism, catalytic transport inhibitor responses, and ubiquitin-mediated proteolysis. The Arabidopsis homolog of Glyma.07G147000 is AT2G38120. GO:0004722, which is involved in protein serine/threonine phosphatase activity, including protein serine phosphate and H2O-generated protein serine and phosphate, as well as protein threonine phosphate and H2O-generated protein threonine and phosphate. Two homologous genes were predicted in Arabidopsis and associated with the pathway. Glyma.16G122200 and Glyma.02G228200 occurred in this pathway, and the Arabidopsis homolog of Glyma.16G122200 is AT3G51370. They contain protein phosphatase – 2Cc superfamily domains, and related research shows that the domain promotes cell expansion (Spartz et al., 2014). The Arabidopsis homolog of Glyma.02G228200 is AT2G30020. They contain an AUX influx permease, PLN03074, domain. AT2G30020 plays a role in plant hormone signal transduction pathways (Dong et al., 2015). GO:0016787 is involved in the hydrolase activity pathway, including C-O, C-N, C–C, and phosphoric anhydride bonds. The Glyma.20G222500 gene occurs in this pathway, and the Arabidopsis homolog of Glyma.20G222500 is AT2G39840, which contains a metallophosphatase–protein phosphatase type 1–kelch-like domain, which is related to continuous cell division in the meristem (Ogawa et al., 2011). The Arabidopsis homolog of Glyma.02G211800 is AT5G49980. They contain the AMN1 super family domain, and AT5G49980 participates in the AUX synthesis pathway (Prigge et al., 2016).
FIGURE 4. Soybean FPH-associated QTLs and candidate gene distribution. (A) Glyma.02G211800 and Glyma.02G228200 distributed in GM02. (B) Glyma.07G134800 and Glyma.07G147000 distributed in GM07. (C) Glyma.17G178800 distributed in GM17. (D) Glyma.16G129600 and Glyma.16G122200 distributed in GM16. (E) Glyma.20G222500 distributed in GM20.
Expression Analysis of Candidate Genes for Soybean FPH
Glyma.16G129600 was not expressed in soybean stems, while Glyma.02G211800, Glyma.16G122200, Glyma.17G178800, Glyma.07G134800, Glyma.20G222500, Glyma.07G147000, and Glyma.02G228200 were expressed in soybean stems, suggesting that they have essential roles during the plant growth and development stage (Figures 5A–G). The eight-year average FPH from the five copies of the experimental materials is shown in Figure 5H. The FPH values of the RIL-86 and RIL-101 were greater than those of the other three experimental materials. RIL-101 had the most prominent phenotypic traits, and seven candidate genes had their greatest expression levels in RIL-101 compared with that in the other experimental materials. The experimental material of RIL-2 had the lowest FPH, and the relative expression levels of the seven candidate genes were the smallest compared with that in the other experimental materials. The variations in the seven genes’ expression levels were generally consistent with the variations in the FPH. The soybean FPH was greater in the experimental materials having greater candidate gene expression levels compared and vice versa (Figures 5A–G). The expression of Glyma.07G134800 and Glyma.17G178800 were not as obvious as those of the other six genes, and the difference in the total expression of Glyma.07G134800 and Glyma.17G178800 were weaker in RIL-86, RIL-101, RIL-112, and RIL-141, but the expression level was generally consistent with the variation in FPH. Thus, the qRT-PCR results indicated that the greater expression levels of the seven candidate genes may be involved in soybean growth and development, and contribute to increases in FPH during this stage.
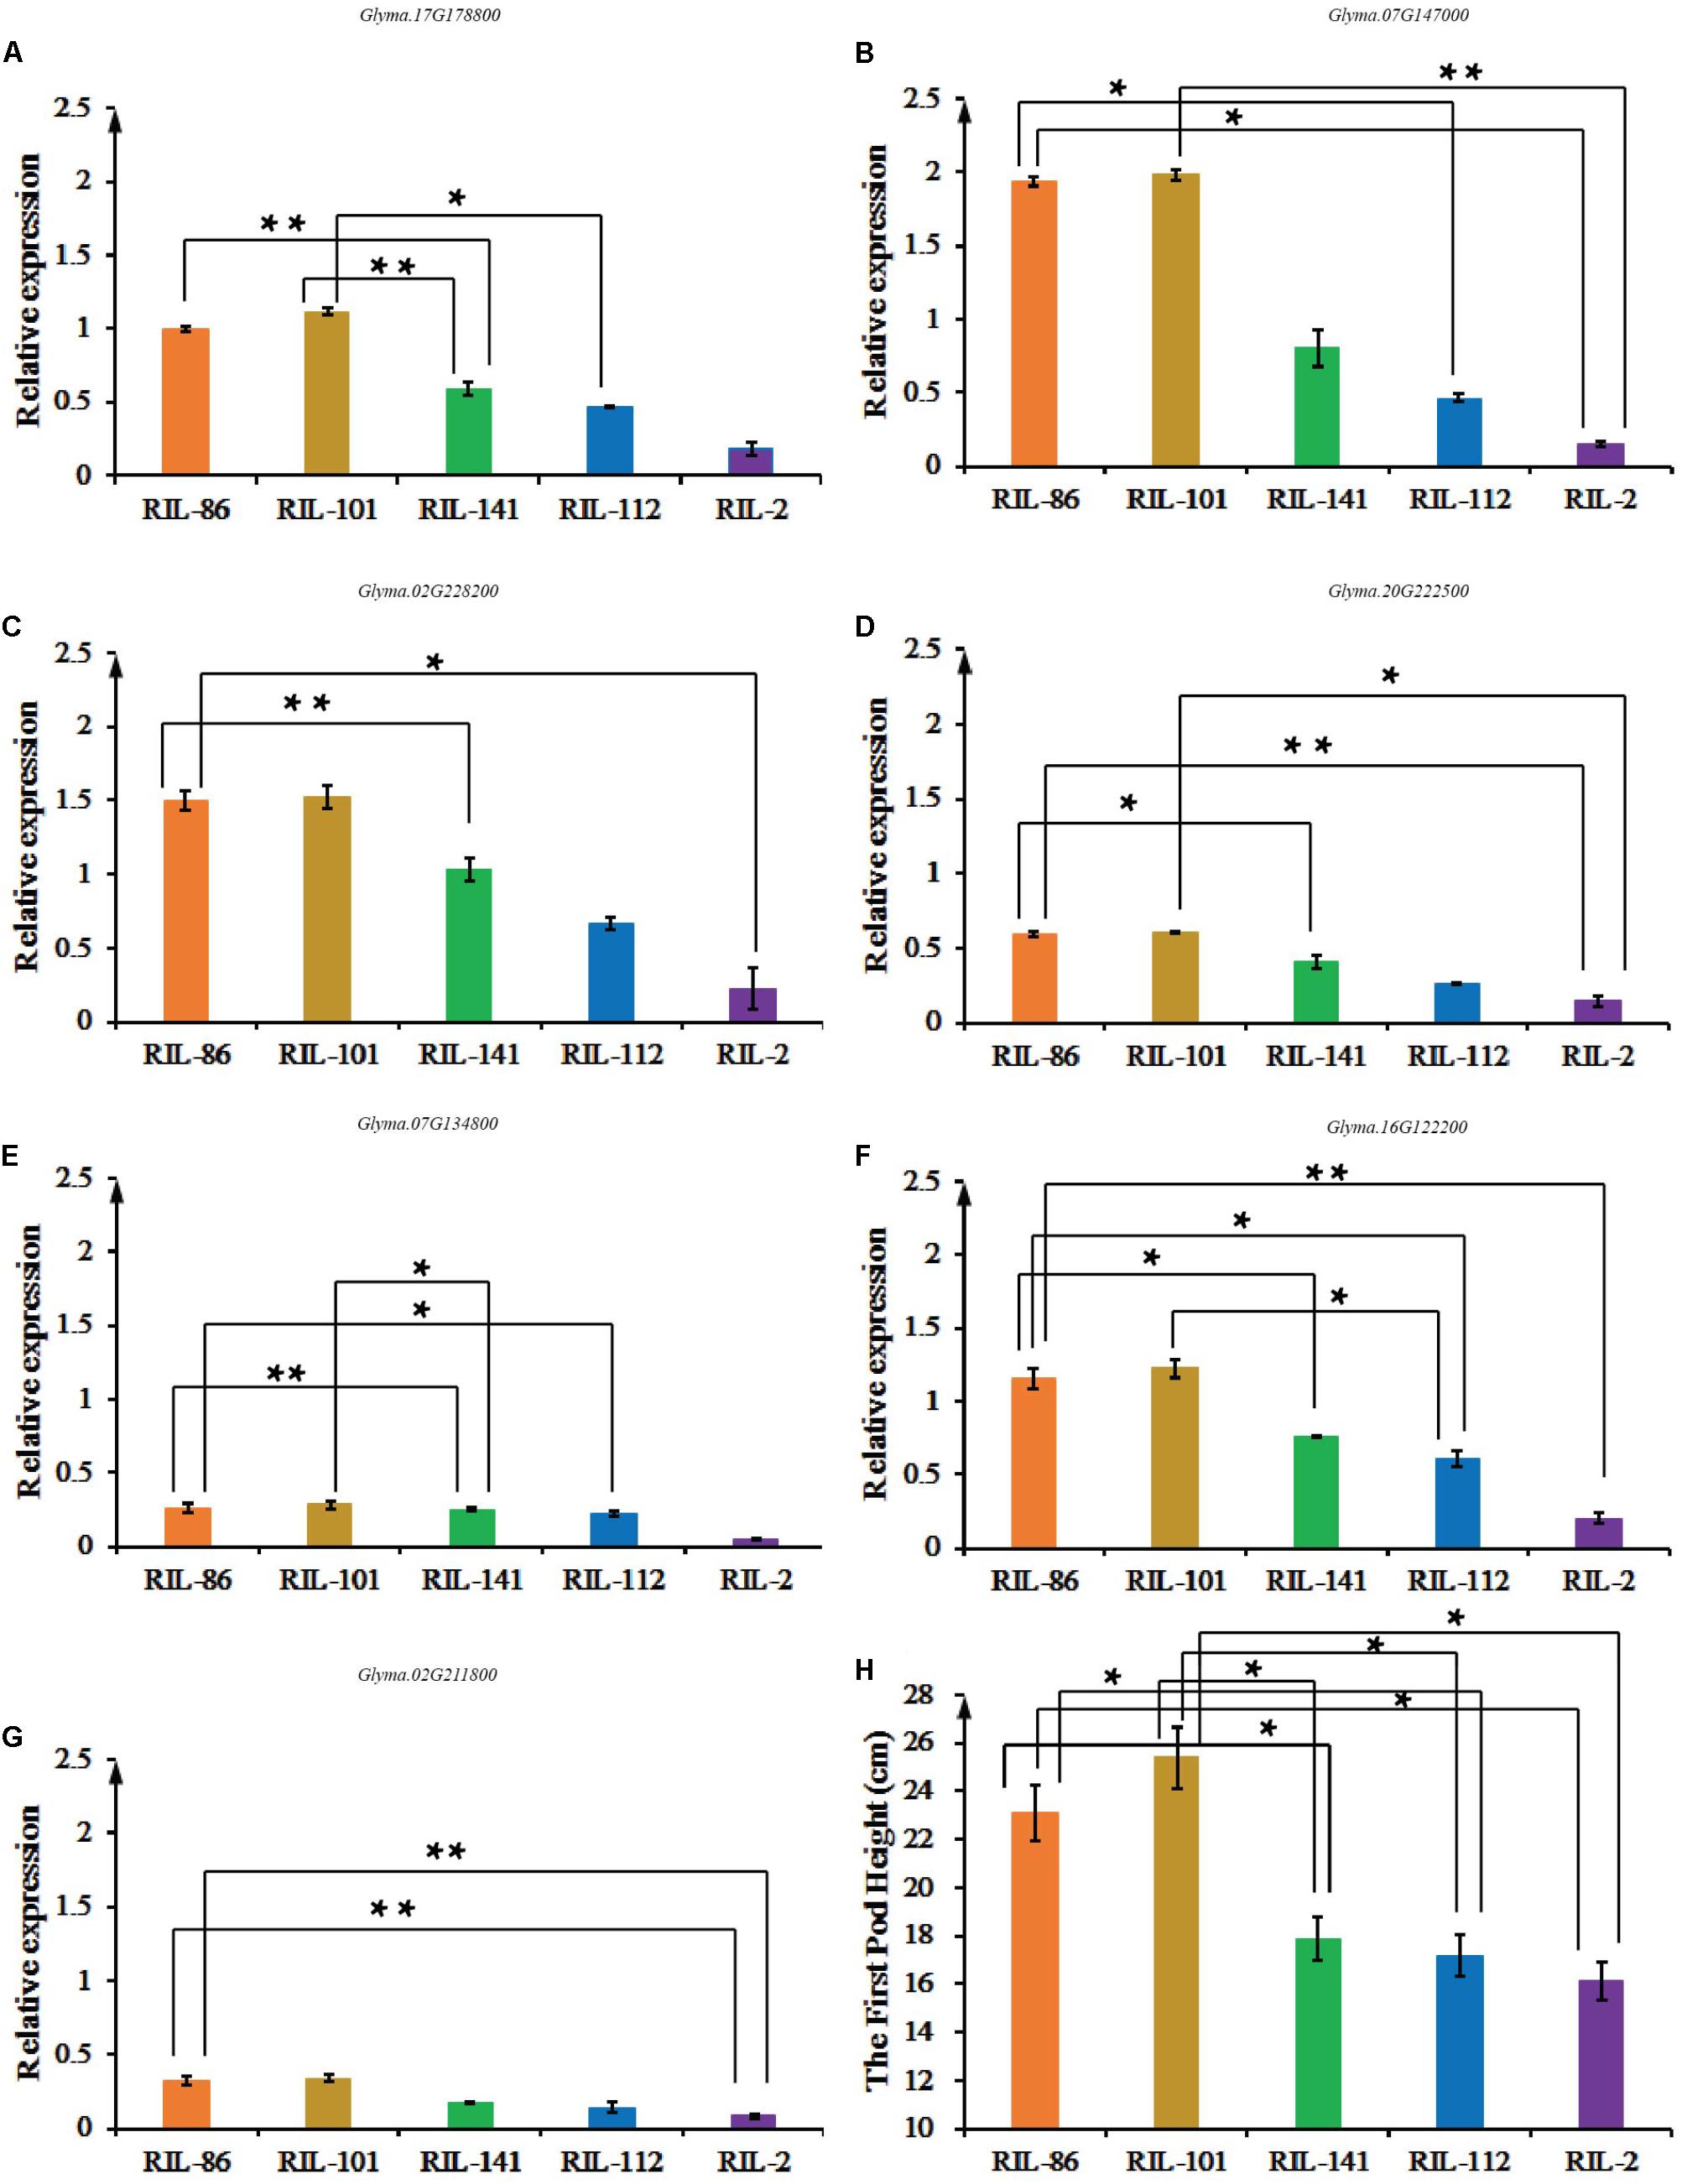
FIGURE 5. The expression levels of Glyma.02G211800, Glyma.16G122200, Glyma.17G178800, Glyma.20G222500, Glyma.07G134800, Glyma.07G147000, and Glyma.02G228200 among ‘Charleston,’ ‘Dongnong594,’ RIL-2, RIL-22, RIL-75, RIL-112, and RIL-141, and the FPH-associated phenotypic data. (A) RT-qPCR analysis of Glyma.02G211800 expression. (B) RT-qPCR analysis of Glyma.16G122200. (C) RT-qPCR analysis of Glyma.07G134800. (D) RT-qPCR analysis of Glyma.20G222500. (E) RT-qPCR analysis of Glyma.07G134800. (F) RT-qPCR analysis of Glyma.07G147000. (G) RT-qPCR analysis of Glyma.02G228200. Three independent groups of samples were collected, and each replicate is a pooled sample of three individual plants. Three technical repetitions were performed. (H) The FPH was measured in cm from the ground to the bottom of the first pod over the cotyledon node. Significant differences in comparison with the FPH of ‘Charleston’ are indicated with asterisks. ∗0.05 > P ≥ 0.01, ∗∗0.01 > P ≥ 0.001.
Discussion
Soybean FPH is a significant component of yield and plays an important role in the efficiency of mechanical harvesting. It is of great significance to find an FPH-associated QTL to help guide molecular-assisted breeding of soybean that increases the efficiency of mechanical harvesting and, thereby, soybean yield.
The agronomic traits of the RIL population showed a normal distribution, and the QTL mapping of the population will improve the mapping accuracy (Chen et al., 2005). Main-effect QTLs are important for studying the soybean agronomic traits, and they can be used for molecular-assisted breeding. At present, most researches focus on how to obtain the main-effect QTLs. In the current study, 11 major QTLs associated with soybean FPH were detected over 8 years and were located on LGs D1b, D2, L, M, and J. Additionally, 90 QTL pairs that were detected revealed additive × additive epistatic effects. Liang et al. (2014) detected two QTLs associated with the soybean FPH in an RIL population that were located on the LGs, J and M. There is an overlap for both qFPH-j-1 and qFPH-m-1, which indicates the reliability of the research. To further verify the reliability of our results, CSSLs were used. Four of them (qFPH-d2-1, qFPH-d2-2, qFPH-d2-3, and qFPH-j-1) were found in the same region of the CSSL map (Xin et al., 2016). The phenotypes differ significantly between materials depending on whether these four loci from the wild soybean chromosome fragments are present separately and on the recurrent parent. The substituted wild soybean chromosomal segment has an important influence on the FPH in soybean. Thus, these QTLs are highly likely to affect the FPH. In many studies, the FPH was positively associated with plant height (Ramteke et al., 2012). In the current study, 5 of the 11 QTLs, qFPH-d1b-3, qFPH-d1b-4, qFPH-d2-2, qFPH-l-3, and qFPH-m-1, correspond to the previously reported soybean plant height QTL (Lark et al., 1995; Wang et al., 2004; Reinprecht et al., 2006; Kim et al., 2012). The increase in plant density may increase the FPH and plant height, which then increases the harvest index and seed yield (Mehmet, 2008). On the LG D1b, four QTLs, namely qFPH-d1b-1, qFPH-d1b-4, qFPH-d1b-2, and qFPH-d1b-3, were found in the near region in 2014 and 2015, indicating that this region should have pivotal genes (or gene clusters) that affect the FPH. In this region, QTLs underlying plant height and lodging were also found (Kabelka et al., 2004). As there is a correlation between plant height, FPH, and lodging, this region may contain important gene(s) that control these three traits.
Epistatic effects are the main factors that affect the soybean agronomic traits. They are an important genetic component of quantitative trait variation, being determined by the specificity of the QTL locus. Recently, several complicated traits with epistatic effects have been analyzed (Hayman, 1958; Martin et al., 2002; Xing et al., 2002). In this study, 90 pairs of epistatic-effect loci were detected. The epistatic interactions between qFPH-m-1 and qFPH-m-3, qFPH-m-1 and qFPH-f-1, and qFPH-l-3 and qFPH-l-2 were identified for the first time. In the region containing qFPH-m-3, qFPH-f-1, and qFPH-l-2, QTLs underlying plant high had been found in other genetic populations (Mansur et al., 1993; Lark et al., 1995; Specht et al., 2001; Gai et al., 2007; Pathan et al., 2013). Although these three QTLs were not the major main-effect QTLs, they have epistatic effects on the major main-effect QTLs. Thus, the FPH is controlled by many genes, even though some genes have small effects. However, these small-effect loci may be unstable in different environments or years. Here, there were no visible epistatic loci detected in 2010, 2013, and 2014.
Until now, there have been few reports on soybean genes associated with FPH. Based on the physical positions of the 11 major QTL intervals, 1,526 candidate genes were screened from the gene annotation data. The pathways associated with plant growth are K14486 (AUX response factor), K14488 (SAUR family protein), K06269 (serine/threonine-protein phosphatase PP1 catalytic subunit; EC:3.1.3.16), K14498 (serine/threonine-protein kinase SRK2; EC:2.7.11.1), and K13946 (AUX influx carrier). The Arabidopsis homologs of the eight candidate genes (Glyma.02G211800, Glyma.16G122200, Glyma.17G178800, Glyma.07G134800, Glyma.20G222500, Glyma.07G147000, Glyma.16G129600, and Glyma.02G228200) are associated with the plant growth pathway. National Center for Biotechnology Information (NCBI) indicated that these homologous genes mainly regulate important AUX response factors associated with the plant growth pathway, such as AT4G23980, which is annotated as an AUX response factor, and they may participate in the expression of negative regulators of AUX signaling in Arabidopsis (Kowalczuk, 1999; Cluis et al., 2004). AUX has an inhibitory effect on plant height, stem diameter, and root length (Zhang et al., 2018). Basnet et al. (1972) showed that the antiAUX triiodobenzoic acid reduced the node number subtending first pod. The AUX concentration could negatively regulate the pod setting of soybean (Nonokawa et al., 2007). Node and internode development are also regulated by AUX (Wilson et al., 1999). The stem elongation in some plant species is affected by AUX through the gibberellin, GA3-associated pathway (King et al., 2000; Leite et al., 2003; Walsh et al., 2006). Most of the genes identified in this study were involved in the AUX pathway; therefore, we propose that the soybean FPH is regulated by AUX. Additionally, Glyma.02G211800, Glyma.07G134800, Glyma.07G147000, Glyma.16G129600, and Glyma.02G228200 are involved in the AUX pathway. While Glyma.16G122200, Glyma.17G178800, and Glyma.20G222500 are not involved in the AUX pathway, they are involved in hormone network regulation and cell expansion. Thus, the FPH might be regulated by a complicated hormone regulatory pathway. Here, we identified the candidate genes underlying FPH. These high-expression genes may be involved in the FPH regulatory pathway, and further work is required to elucidate the molecular mechanisms of the candidate genes.
Author Contributions
QC, XXW, ZQ, and DX designed the study. HJ, YYL, and HTQ analyzed the data and wrote the paper. YLL, HDQ, CDL, NW, RL, YZ, SH, JY, XYW, RZ, CYL, and ZH participated in correcting the manuscript. All authors have read and approved the final manuscript.
Funding
This study was financially supported by the National Key R&D Program of China (2016YFD0100300, 2016YFD0100500, and 2016YFD0100201-21), the National Natural Science Foundation of China (31701449, 31771882, 31471516, 31400074, and 31501332), the Natural Science Foundation of Heilongjiang (QC2017013), the Young Innovative Talent Training Plan of Undergraduate Colleges and Universities in Heilongjiang Province (UNPYSCT-2016144), Special Financial Aid to Post-doctoral Research Fellows in Heilongjiang (to ZQ), the Heilongjiang Funds for Distinguished Young Scientists (JC2016004), the Outstanding Academic Leaders Projects of Harbin, China (2015RQXXJ018), the China Post-Doctoral Project (2015M581419), the Dongnongxuezhe Project (to QC), the Young Talent Project of Northeast Agricultural University (to ZQ, 518062), and the SIPT Project of Northeast Agriculture University (2018-171 and 2018-172).
Conflict of Interest Statement
The authors declare that the research was conducted in the absence of any commercial or financial relationships that could be construed as a potential conflict of interest.
Acknowledgments
We thank Lesley Benyon, Ph.D., from Liwen Bianji, Edanz Group China (www.liwenbianji.cn/ac), for editing the English text of a draft of this manuscript.
Supplementary Material
The Supplementary Material for this article can be found online at: https://www.frontiersin.org/articles/10.3389/fpls.2018.01280/full#supplementary-material
Footnotes
- ^ https://www.soybase.org/
- ^ https://phytozome.jgi.doe.gov/pz/portal.html#
- ^ http://www.invitrogen.com
References
Basnet, B., Paulsen, G., and Nickell, C. (1972). Growth and composition responses of soybeans to some growth regulators 1. Agron. J. 64, 550–552. doi: 10.2134/agronj1972.00021962006400040041x
Campbell, R., Pont, S. D., Morris, J. A., Mckenzie, G., Sharma, S. K., Hedley, P. E., et al. (2014). Genome-wide QTL and bulked transcriptomic analysis reveals new candidate genes for the control of tuber carotenoid content in potato (Solanum tuberosum L.). Theor. Appl. Genet. 127, 1917–1933. doi: 10.1007/s00122-014-2349-0
Chen, Q. S., Zhongchen, Z., and Chunyan, L. (2005). Construction and analysis of soybean genetic map using recombinant inbred line of Charleston × Dongnong 594. Sci. Agric. Sin. 12, 13–18.
Cluis, C. P., Mouchel, C. F., and Hardtke, C. S. (2004). The Arabidopsis transcription factor HY5 integrates light and hormone signaling pathways. Plant J. 38, 332–347. doi: 10.1111/j.1365-313X.2004.02052.x
Dong, P., Xiong, F., Que, Y., Wang, K., Yu, L., Li, Z., et al. (2015). Expression profiling and functional analysis reveals that TOR is a key player in regulating photosynthesis and phytohormone signaling pathways in Arabidopsis. Front. Plant Sci. 6:677. doi: 10.3389/fpls.2015.00677
Fan, D. M., Yang, Z., Ma, Z., Zeng, Q., Zeng, X., Jiang, H., et al. (2012). QTL analysis of lodging-resistance related traits in soybean in different environtmens. Sci. Agric. Sin. 45, 3029–3039. doi: 10.3864/j.issn.0578-1752.2012.15.003
Gai, J., Wang, Y., Wu, X., and Chen, S. (2007). A comparative study on segregation analysis and QTL mapping of quantitative traits in plants–with a case in soybean. Front. Agric. China 1, 1–7. doi: 10.1007/s11703-007-0001-3
Grichar, W. J. (2007). Row spacing, plant populations, and cultivar effects on soybean production along the Texas Gulf Coast. Crop. Manage. 6, 1–6. doi: 10.1094/CM-2007-0615-01-RS
Hayman, B. (1958). The separation of epistatic from additive and dominance variation in generation means. Heredity 12:371. doi: 10.1038/hdy.1958.36
Horii, H., Nemoto, K., Miyamoto, N., and Harada, J. (2006). Quantitative trait loci for adventitious and lateral roots in rice. Plant Breed. 125, 198–200. doi: 10.1111/j.1439-0523.2006.01124.x
Kabelka, E.-A., Diersa, B.-W., Fehrd, W. R., LeRoye, A. R., Baianub, I. C., Youb, T., et al. (2004). Putative alleles for increased yield from soybean plant introductions. Crop Sci. 44, 784–791. doi: 10.2135/cropsci2004.7840
Kang, B.-K., Kim, H.-T., Choi, M.-S., Koo, S.-C., Seo, J.-H., Kim, H.-S., et al. (2017). Genetic and environmental variation of first pod height in soybean [Glycine max (L.) Merr.]. Plant Breed. Biotechnol. 5, 36–44. doi: 10.9787/PBB.2017.5.1.36
Kao, C.-H., Zeng, Z.-B., and Teasdale, R. D. (1999). Multiple interval mapping for quantitative trait loci. Genetics 152, 1203–1216. doi: 10.1534/genetics.108.099028
Kim, K. S., Diers, B. W., Hyten, D. L., Rouf Mian, M. A., Shannon, J. G., and Nelson, R. L. (2012). Identification of positive yield qtl alleles from exotic soybean germplasm in two backcross populations. Theor. Appl. Genet. 125, 1353–1369. doi: 10.1007/s00122-012-1944-1
King, R. W., Seto, H., and Sachs, R. M. (2000). Response to gibberellin structural variants shows that ability to inhibit flowering correlates with effectiveness for promoting stem elongation of some plant species. J. Plant Growth Regul. 19, 437–444. doi: 10.1007/s003440000015
Korol, A. B., Ronin, Y. I., and Kirzhner, V. M. (1995). Interval mapping of quantitative trait loci employing correlated trait complexes. Genetics 140, 1137–1147.
Kowalczuk, J. (1999). Pattern of seed losses and damage during soybean harvest with grain combine harvesters. Int. Agrophys. 13, 103–107.
Lark, K. G., Chase, K., Adler, F., Mansur, L. M., and Orf, J. H. (1995). Interactions between quantitative trait loci in soybean in which trait variation at one locus is conditional upon a specific allele at another. Proc. Natl. Acad. Sci. U.S.A. 92, 4656–4660. doi: 10.1073/pnas.92.10.4656
Lavy, M., Prigge, M. J., Tao, S., Shain, S., Kuo, A., Kirchsteiger, K., et al. (2016). Constitutive auxin response in Physcomitrella reveals complex interactions between Aux/IAA and ARF proteins. Elife 5, 1–22. doi: 10.7554/eLife.13325
Lee, S., Sundaram, S., Armitage, L., Evans, J. P., Hawkes, T., Kepinski, S., et al. (2013). Defining binding efficiency and specificity of auxins for SCFTIR1/AFB-Aux/IAA co-receptor complex formation. ACS Chem. Biol. 9, 673–682. doi: 10.1021/cb400618m
Leite, V. M., Rosolem, C. A., and Rodrigues, J. D. (2003). Gibberellin and cytokinin effects on soybean growth. Sci. Agric. 60, 537–541. doi: 10.1590/S0103-90162003000300019
Li, J., Wang, X.-Q., Watson, M. B., and Assmann, S. M. (2000). Regulation of abscisic acid-induced stomatal closure and anion channels by guard cell AAPK kinase. Science 287, 300–303. doi: 10.1126/science.287.5451.300
Li, J., Xu, H.-H., Liu, W.-C., Zhang, X.-W., and Lu, Y.-T. (2015). Ethylene inhibits root elongation during alkaline stress through AUXIN1 and associated changes in auxin accumulation. Plant Physiol. 168, 1777–1791. doi: 10.1104/pp.15.00523
Li, Y. H., Reif, J. C., Hong, H. L., Li, H. H., Liu, Z. X., Ma, Y. S., et al. (2017). Genome-wide association mapping of QTL underlying seed oil and protein contents of a diverse panel of soybean accessions. Plant Sci. 266, 95–101. doi: 10.1016/j.plantsci.2017.04.013
Liang, H. Z., Yu, Y., Yang, H., Dong, W., Li, C., Du, H., et al. (2014). Analysis of epistasis and environmental interactions of QTL for soybean yield and major agronomic traits. Crop J. 40, 37–44.
Lou, Q., Chen, L., Mei, H., Wei, H., Feng, F., Wang, P., et al. (2015). Quantitative trait locus mapping of deep rooting by linkage and association analysis in rice. J. Exp. Bot. 66, 4749–4757. doi: 10.1093/jxb/erv246
Mansur, L. M., Lark, K. G., Kross, H., and Oliveira, A. (1993). Interval mapping of quantitative trait loci for reproductive, morphological, and seed traits of soybean (Glycine max L.). Theor. Appl. Genet. 86, 907–913. doi: 10.1007/BF00211040
Martin, M. P., Gao, X., Lee, J. H., Nelson, G. W., Detels, R., Goedert, J. J., et al. (2002). Epistatic interaction between KIR3DS1 and HLA-B delays the progression to AIDS. Nat. Genet. 31:429. doi: 10.1038/ng934
Mayer, K., Schüller, C., Wambutt, R., Murphy, G., Volckaert, G., Pohl, T., et al. (1999). Sequence and analysis of chromosome 4 of the plant Arabidopsis thaliana. Nature 402:769. doi: 10.1038/47134
McCouch, S. (1997). Report on QTL nomenclature. Rice Genet. Newsl. 14, 11–13. doi: 10.1007/s10142-013-0328-1
Mehmet, O. (2008). Nitrogen rate and plant population effects on yield and yield components in soybean. Afr. J. Biotechnol. 7, 4464–4470.
Meng, L., Li, H., Zhang, L., and Wang, J. (2015). QTL IciMapping: Integrated software for genetic linkage map construction and quantitative trait locus mapping in biparental populations. Crop J. 3, 269–283. doi: 10.1016/j.cj.2015.01.001
Miao, L., Zhang, L., Raboanatahiry, N., Lu, G., Zhang, X., Xiang, J., et al. (2016). Transcriptome analysis of stem and globally comparison with other tissues in Brassica napus. Front. Plant Sci. 7:1403. doi: 10.3389/fpls.2016.01403
Milan, Z., Jasmina, Z., Ljiljana, S., and Nenad, P. (2005). Combining abilities of inheriting first pod height of some French bean lines -Phaseolus vulgaris L. Genetika 37, 65–70. doi: 10.2298/GENSR0501065Z
Nonokawa, K., Kokubun, M., Nakajima, T., Nakamura, T., and Yoshida, R. (2007). Roles of auxin and cytokinin in soybean pod setting. Plant Product. Sci. 10, 199–206. doi: 10.1626/pps.10.199
Ogawa, D., Abe, K., Miyao, A., Kojima, M., Sakakibara, H., Mizutani, M., et al. (2011). RSS1 regulates the cell cycle and maintains meristematic activity under stress conditions in rice. Nat. Commun. 2, 121–132. doi: 10.1038/ncomms1279
Otobe, K., Watanabe, S., and Harada, K. (2015). Analysis of QTLs for the micromorphology on the seed coat surface of soybean using recombinant inbred lines. Seed Sci. Res. 25, 409–415. doi: 10.1017/S0960258515000318
Paixao, C. S. S., Da Silva, R. P., Voltarelli, M. A., Cassia, M. T., and De Oliveira Tavares, T. (2016). Efficiency and losses in mechanical harvesting of soybeans due to the plots format. Austr. J. Crop Sci. 10:765. doi: 10.21475/ajcs.2016.10.06.p6678
Pathan, S. M., Vuong, T., Clark, K., Lee, J. D., Shannon, J. G., Roberts, C. A., et al. (2013). Genetic mapping and confirmation of quantitative trait loci for seed protein and oil contents and seed weight in soybean. Crop Sci. 53, 765–774. doi: 10.2135/cropsci2012.03.0153
Prigge, M. J., Greenham, K., Zhang, Y., Santner, A., Castillejo, C., Mutka, A. M., et al. (2016). The Arabidopsis auxin receptor F-box proteins AFB4 and AFB5 are required for response to the synthetic auxin picloram. G3 6, 1383–1390. doi: 10.1534/g3.115.025585
Qi, Z., Huang, L., Zhu, R., Xin, D., Liu, C., Han, X., et al. (2014). A high-density genetic map for soybean based on specific length amplified fragment sequencing. PLoS One 9:e104871. doi: 10.1371/journal.pone.0104871
Raihan, M. S., Liu, J., Huang, J., Guo, H., Pan, Q., and Yan, J. (2016). Multi-environment QTL analysis of grain morphology traits and fine mapping of a kernel-width QTL in Zheng58 × SK maize population. Theor. Appl. Genet. 129, 1465–1477. doi: 10.1007/s00122-016-2717-z
Ramteke, R., Singh, D., and Murlidharan, P. (2012). Selecting soybean (Glycine max) genotypes for insertion height of the lowest pod, the useful trait for combine harvester. Ind. J. Agric. Sci. 82:511.
Reinprecht, Y., Poysa, V. W., Yu, K., Rajcan, I., Ablett, G. R., and Pauls, K. P. (2006). Seed and agronomic qtl in low linolenic acid, lipoxygenase-free soybean (Glycine max (l.) merrill) germplasm. Genome 49, 1510–1527. doi: 10.1139/g06-112
Shubchynskyy, V., Boniecka, J., Schweighofer, A., Simulis, J., Kvederaviciute, K., Stumpe, M., et al. (2017). Protein phosphatase AP2C1 negatively regulates basal resistance and defense responses to Pseudomonas syringae. J. Exp. Bot. 68, 1169–1183. doi: 10.1093/jxb/erw485
Singh, A., Bhatt, B., Sundaram, P., Gupta, A., and Singh, D. (2013). Planting geometry to optimize growth and productivity in faba bean (Vicia faba L.) and soil fertility. J. Environ. Biol. 34:117.
Spartz, A. K., Ren, H., Park, M. Y., Grandt, K. N., Lee, S. H., Murphy, A. S., et al. (2014). SAUR inhibition of PP2C-D phosphatases activates plasma membrane H + -ATPases to promote cell expansion in Arabidopsis. Plant Cell 26, 2129–2142. doi: 10.1105/tpc.114.126037
Specht, J. E., Chase, K., Macrander, M., Graef, G. L., Chung, J., Markwell, J. P., et al. (2001). Soybean response to water. Crop Sci. 41, 493–509. doi: 10.2135/cropsci2001.412493x
Ulmasov, T., Hagen, G., and Guilfoyle, T. J. (1999). Activation and repression of transcription by auxin-response factors. Proc. Natl. Acad. Sci. U.S.A. 96, 5844–5849. doi: 10.1073/pnas.96.10.5844
Utz, H., and Melchinger, A. (1996). PLABQTL: a program for composite interval mapping of QTL. J. Quant. Trait Loci 2, 1–5. doi: 10.1094/PHYTO.2004.94.8.862
Walsh, T. A., Neal, R., Merlo, A. O., Honma, M., Hicks, G. R., Wolff, K., et al. (2006). Mutations in an auxin receptor homolog AFB5 and in SGT1b confer resistance to synthetic picolinate auxins and not to 2, 4-dichlorophenoxyacetic acid or indole-3-acetic acid in Arabidopsis. Plant Physiol. 142, 542–552. doi: 10.1104/pp.106.085969
Wang, D., Graef, G. L., Procopiuk, A. M., and Diers, B. W. (2004). Identification of putative qtl that underlie yield in interspecific soybean backcross populations. Theor. Appl. Genet. 108, 458–467. doi: 10.1007/s00122-003-1449-z
Wang, D., Zhu, J., Li, Z., and Paterson, A. (1999). Mapping QTLs with epistatic effects and QTL × environment interactions by mixed linear model approaches. Theor. Appl. Genet. 99, 1255–1264. doi: 10.1007/s001220051331
Wilson, P. A., Hanan, J. S., Room, P. M., Chakraborty, S., and Doley, D. (1999). Using lindenmayer systems to model morphogenesis in a tropical pasture legume Stylosanthes scabra. Can. J. Bot. 77, 394–403. doi: 10.1139/b98-217
Xin, D., Qi, Z., Jiang, H., Zhang, Z., Zhu, R., Hu, J., et al. (2016). QTL location and epistatic effect analysis of 100-seed weight using wild soybean (Glycine soja Sieb. & Zucc.) chromosome segment substitution lines. PLoS One 3:e0149380. doi: 10.1371/journal.pone.0149380
Xing, Y., Tan, Y., Hua, J., Sun, X., Xu, C., and Zhang, Q. (2002). Characterization of the main effects, epistatic effects and their environmental interactions of QTLs on the genetic basis of yield traits in rice. Theor. Appl. Genet. 105, 248–257. doi: 10.1007/s00122-002-0952-y
Yang, L., Ji, W., Gao, P., Li, Y., Cai, H., Bai, X., et al. (2012). GsAPK, an ABA-activated and calcium-independent SnRK2-type kinase from G. soja, mediates the regulation of plant tolerance to salinity and ABA stress. PLoS One 7:e33838. doi: 10.1371/journal.pone.0033838
Yue, J., Qin, Q., Meng, S., Jing, H., Gou, X., Li, J., et al. (2016). TOPP4 regulates the stability of Phytochrome Interacting factor5 during photomorphogenesis in Arabidopsis. Plant Physiol. 170, 1381–1397. doi: 10.1104/pp.15.01729
Zhang, K., Tian, J., Zhao, L., and Wang, S. (2008). Mapping QTLs with epistatic effects and QTL x environment interactions for plant height using a doubled haploid population in cultivated wheat. J. Genet. Genom. 35, 119–127. doi: 10.1016/S1673-8527(08)60017-X
Zhang, K. K., Zhao, S., Chen, H. J., Ni, J. Q., Jiang, X. F., Chen, F. D., et al. (2018). Effects of crude toxin from Alternaria alternata on the growth and physiological metabolism of chrysanthemum ‘Jinba’ seedlings. Ying Yong Sheng Tai Xue Bao. 29, 1190–1196. doi: 10.13287/j.1001-9332.201804.040
Keywords: soybean, first pod height, QTL mapping, candidate genes, mechanized harvest
Citation: Jiang H, Li Y, Qin H, Li Y, Qi H, Li C, Wang N, Li R, Zhao Y, Huang S, Yu J, Wang X, Zhu R, Liu C, Hu Z, Qi Z, Xin D, Wu X and Chen Q (2018) Identification of Major QTLs Associated With First Pod Height and Candidate Gene Mining in Soybean. Front. Plant Sci. 9:1280. doi: 10.3389/fpls.2018.01280
Received: 09 April 2018; Accepted: 15 August 2018;
Published: 19 September 2018.
Edited by:
Maoteng Li, Huazhong University of Science and Technology, ChinaReviewed by:
Yan Long, Chinese Academy of Agricultural Sciences, ChinaLiezhao Liu, Southwest University, China
Harsh Raman, NSW Department of Primary Industries, Australia
Copyright © 2018 Jiang, Li, Qin, Li, Qi, Li, Wang, Li, Zhao, Huang, Yu, Wang, Zhu, Liu, Hu, Qi, Xin, Wu and Chen. This is an open-access article distributed under the terms of the Creative Commons Attribution License (CC BY). The use, distribution or reproduction in other forums is permitted, provided the original author(s) and the copyright owner(s) are credited and that the original publication in this journal is cited, in accordance with accepted academic practice. No use, distribution or reproduction is permitted which does not comply with these terms.
*Correspondence: Hongwei Jiang, ajM5OTQxMDJAMTI2LmNvbQ== Dawei Xin, eGluZHdAMTI2LmNvbQ==; eGRhd2VpQDE2My5jb20= Xiaoxia Wu, WHh3dTIwMTJAMTYzLmNvbQ== Qingshan Chen, cXNoY2hlbkAxMjYuY29t
†These authors have contributed equally to this work