 Binghao Bao1†Hongbo Chao1†Hao Wang2
 Weiguo Zhao1,2Lina Zhang1
 Nadia Raboanatahiry1
 Xiaodong Wang3
 Baoshan Wang4Haibo Jia1*
 Maoteng Li1,5*
- 1College of Life Science and Technology, Huazhong University of Science and Technology, Wuhan, China
- 2Hybrid Rapeseed Research Center of Shaanxi Province, Shaanxi Rapeseed Branch of National Centre for Oil Crops Genetic Improvement, Yangling, China
- 3Provincial Key Laboratory of Agrobiology, Key Laboratory of Cotton and Rapeseed, Ministry of Agriculture, Institute of Industrial Crops, Jiangsu Academy of Agricultural Sciences, Nanjing, China
- 4College of Life Science, Shandong Normal University, Jinan, China
- 5Hubei Collaborative Innovation Center for the Characteristic Resources Exploitation of Dabie Mountains, Huanggang Normal University, Huanggang, China
Fatty acid (FA) composition is the typical quantitative trait in oil seed crops, of which study is not only closely related to oil content, but is also more critical for the quality improvement of seed oil. The double haploid (DH) population named KN with a high density SNP linkage map was applied for quantitative trait loci (QTL) analysis of FA composition in this study. A total of 406 identified QTL were detected for eight FA components with an average confidence interval (CI) of 2.92 cM, the explained phenotypic variation (PV) value ranged from 1.49 to 45.05%. Totally, 204 consensus and 91 unique QTL were further obtained via meta-analysis method for the purpose of detecting multiple environment expressed and pleiotropic QTL, respectively. Of which, 74 stable expressed and 22 environmental specific QTL were also revealed, respectively. In order to make clear the genetic mechanism of FA metabolism at individual QTL level, conditional QTL analysis was also conducted and more than two thousand conditional QTL which could not be detected under the unconditional mapping were detected, which indicated the complex interrelationship of the QTL controlling FA content in rapeseed. Through comparative genomic analysis and homologous gene annotation, 61 candidates related to acyl lipid metabolism were identified underlying the CI of FA QTL. To further visualize the genetic mechanism of FA metabolism, an intuitive and meticulous network about acyl lipid metabolism was constructed and some closely related candidates were positioned. This study provided a more accurate localization for stable and pleiotropic QTL, and a deeper dissection of the molecular regulatory mechanism of FA metabolism in rapeseed.
Introduction
Rapeseed (Brassica napus L., genome AACC, 2n = 38) is the second largest oil crop in the world, which can provide affluent edible oil for diet and valuable source for industrial biodiesel (Kimber and Mcgregor, 1995). High oil cultivars undoubtedly could increase the oil production, and high quality property is more important for the seed oil in rapeseed. Although possessing the high level of unsaturated FA, such as oleic acid (about 60% proportion), which is a tangible advantage, some disadvantages such as the high level of erucic acid is also one of the limitations for the utilization of rapeseed oil (Zhao et al., 2008). Thus, revealing the genetic mechanism of FA biosynthesis, increasing the production and improving the quality of seed oil, are the main purpose of breeding program in B. napus.
FA in B. napus mainly includes palmitic acid (C16:0), stearic acid (C18:0), oleic acid (C18:1), linoleic acid (C18:2), linolenic acid (C18:3), eicosenoic acid (C20:1), erocic acid (C22:1), and this FA profile has been frequently influenced by the breeding environment (Si et al., 2003). QTL mapping has been applied in detecting the QTL of enormous and important agronomic traits among various crops, such as rice (McCouch and Doerge, 1995), wheat (Sourdille et al., 2000), and B. napus (Burns et al., 2003). Despite several studies have been performed for the QTL analysis of FA in rapeseed, the deficiencies of lower resolution and credibility, poor precision of the detected QTL still exist due to few years and sites of field trial, low marker density, and smaller size of the mapping populations were used (Burns et al., 2003; Hu et al., 2006; Zhao et al., 2008; Smooker et al., 2011; Yan et al., 2011; Wang et al., 2015), and finally obtained results were hardly applied to practical breeding program due to lower credibility and large CI. With the development of sequencing technologies and the advances in analytical methods (Chalhoub et al., 2014; Wang et al., 2015), these defections can be made up by using higher marker density in mapping population. More importantly, the effort for identification of environmental stable and specific QTL to meet the actual demand of breeding program in B. napus is also profound and the field trials with multiple breeding sites, as well as multiyear can facilitate goal achievement.
Seed oil of B. napus commonly contains seven FA components (Velasco and Becker, 1998). Previous QTL studies showed that except for C22:1 which was controlled by two major QTL, other traits were genetically controlled by enormous QTL and meanwhile displayed complex interaction with the environment (Burns et al., 2003; Qiu et al., 2006; Zhao et al., 2008; Smooker et al., 2011; Yan et al., 2011). Burns et al. (2003) identified 27 QTL that were distributed across nine linkage groups of the genome and involved seven FA compositions in B. napus, 19 out of the 27 QTL were also related to the trait of oil content. 38 and 34 QTL were revealed by Zhao et al. (2008) and Smooker et al. (2011), respectively, and both of them were related to the seven main FA compositions and were located in sixteen linkage groups of B. napus except for A4, A5 and A10. Yan et al. (2011) used a mapping population with 183 lines and 40 QTL controlling six FA compositions were detected, of which 21 QTL were located in N8 and N13 linkage groups. By increasing the marker density and population size, Wang et al. (2015) utilized a population with 202 lines and a middle density linkage map containing 932 markers to identify 72 QTL, which were associated to 10 FA compositions and distributed in 17 linkage groups of B. napus except for C2 and C4. Despite lots of FA QTL analyses were carried out, more elaborate effort associating with the reliable and practical QTL detection is still indispensable for the QTL fine mapping analysis of FA in B. napus.
As the classical and reliable analytical method, conventional linkage analysis for detecting QTL of various corps has been utilized for decades despite its requirement of artificial population construction and multiyear field trials. In recent years, Genome-wide associated analysis (GWAS) was also widely used for QTL revealing associated with diverse traits in rapeseed (Gacek et al., 2016; Qu et al., 2017; Wan et al., 2017). On account of the disadvantages of the poor ability in false positive controlling and in rare allele detection (El-Soda et al., 2015), the traditional linkage analysis is still an invaluable method for QTL detection especially accompanied by other advanced analytical methods.
B. napus was originated from natural hybridization between B. rapa and B. oleracea about 7500 years ago, the outcome of this event is that the allotetraploid B. napus possessed the larger size and more complex architecture of genome and many genes with multiple replicas (Gacek et al., 2016). The biological process of acyl-lipid metabolism in plants were complex and hierarchical, more than 120 different reactions and 600 genes involved in this process were revealed in Arabidopsis (Li-Beisson et al., 2013). Although many efforts for exploring QTL and genes related to acyl-lipid metabolism in Arabidopsis were implemented (Li-Beisson et al., 2013), few knowledge are clear in this process in B. napus. The close genetic relationship between Arabidopsis and B. napus as well as the release of their genome sequence (Parkin et al., 2003; Chalhoub et al., 2014) enable us to carry out gene function prediction of acyl-lipid metabolism based on QTL fine-mapping in B. napus. De novo biosynthesis pathway of acyl-lipid in rapeseed is a complicated process that contains many significant procedures, such as the synthesis of long chain FA from acetyl-CoA, lipid trafficking, desaturation and elongation reaction of the synthesized FA and finally the production of TAG along with its storage in seeds (Ohlrogge and Browse, 1995; Li-Beisson et al., 2013). Generally, these metabolic processes involved diverse genes and were genetically controlled by various regulators; furthermore, the crosstalk among these genes could also be observed regularly. Actually, acyl-lipid metabolism related genes were generally regulated in a coordinated manner during the seed development in plants (Baud and Lepiniec, 2009).
Besides studies of complex metabolic regulatory network at the whole level, and the genetic mechanism investigation at individual trait level of FA composition in rapeseed have been seldom implemented so far. In addition, despite the phenomenon of high correlation of the PV for different FA compositions could be attributed to the QTL co-localization among them (Burns et al., 2003; Hu et al., 2006; Zhao et al., 2008; Smooker et al., 2011; Yan et al., 2011; Wang et al., 2015), but it insufficiently provides detailed genetic explanation for this phenomenon, as two basic facts for some loci with multiple effect and/or some genes closely linked and located in the same locus contributed largely to the correlation of PV for different traits are difficult to distinguish by common QTL analysis method (Shi et al., 2009). So, in order to solve this confusion, the method of conditional QTL mapping was used to explore the genetic relationships between two closely correlated traits at individual QTL level (Wen and Zhu, 2005). This method enables us to study the phenotypic variation of one FA trait under the condition of excluding the influence from another related trait. Hence, for the aim to get a more profound understanding of the genetic mechanism for FA content accumulation, it is necessary for us to carry out QTL analysis at the level of individual trait in rapeseed.
In recent years, many key genes involved in FA biosynthesis were positioned and identified in plants. Several FA biosynthetic initiation and elongation enzymes were well characterized. For example, the A. thaliana gene fatty acid biosynthesis 1 (FAB1), which responses for the elongation of C16:0-ACP to C18:0-ACP, the key step for FA synthesis process (Chapman and Burke, 2012), was positioned in two linkage groups of A2 and C1 of B. napus by genome-wide association mapping method (Qu et al., 2017). Another A. thaliana gene long-chain acyl-CoA synthetase 9 (LACS9), which catalyzes the formation of acyl-CoA that involved in Arabidopsis seed oil biosynthesis (Zhao et al., 2010), was also detected and positioned in A2 linkage group in this study. Two important FA desaturation enzymes FAD2 and FAD3 were mapped in the linkage groups of A1, A3, A5, C1, and C5 (Scheffler et al., 1997; Schierholt et al., 2000; Yang et al., 2012; Wang et al., 2015), and linkage groups of A3, A4, A5, A8, A10, C3, C4, and C5 (Hu et al., 2006; Smooker et al., 2011; Wang et al., 2015), respectively. The functional study revealed that these two genes produced C18:1 and C18:3 using plastidial FAs through a desaturation modification, respectively (Okuley et al., 1994; Yang et al., 2012). Basnet et al. (2016) reported another two FAD family genes BrFAD5 and BrFAD7 that could interact with one same family gene BrFAD2 to affect the content of oleic and linoleic in B. rapa. A multifunctional gene FAE1 (FA elongation 1), which was responsible for the formation of C22:1 and TAG from FA (James et al., 1995), was positioned in five linkage groups of A1-A4 and A8 in B. napus (Wang et al., 2015). Lately, Shi et al. (2017) reported that depressing the expression of FAD2 and FAE1 led to the increased content of oleic acid while significantly decreased the content of erucic acid and slightly reduced the oil content of seed in B. napus. Although pathways and many genes involved acyl-lipid metabolism have been well-characterized, the genetic regulatory mechanisms of FA biosynthesis network are still largely unknown. Due to the complicated genome structure of rapeseed, solving of this subject is challenging as usual.
The PV of FA trait in oil corps was not only directly controlled by a large amount of genes, but also was affected by the digenic interaction among them, such as epistatic effect (Jourdren et al., 1996). Previous studies showed that the epistatic interaction effect between the alleles was a basic genetic component for the quantitative trait and always played a vital role in the quantitative trait for the genetic variation and evolution of crops (Li et al., 2001). Lü et al. (2011) reported the epistatic association mapping in homozygous crop cultivars. Singh et al. (2013) studied the genetic factors involved in stem rust resistance and explored the epistatic interaction among them in spring wheat. Li et al. (2012) also conducted the QTL and epistatic analyses related to the seed yield trait in rapeseed. Though many epistatic effect studies were conducted in crops, few of them were about this effect in rapeseed up to now. In view of the importance of the formation on the genetic basis of QTL, the study of epistatic effect should be taken into consideration in QTL analysis process.
In this study, the unconditional and conditional QTL mapping analysis of FA traits were performed based on a high density linkage map, and a plenty of potential candidate genes involving acyl-lipid metabolism were revealed. The aims of the present study were: (1) revealing the stable and environmental specific FA related QTL and candidate genes of rapeseed with higher precision and credibility; (2) providing deeper understanding of the genetic basis of FA metabolism during the seed development in rapeseed; (3) giving better guidance for breeding high quality rapeseed varieties.
Materials and Methods
Plant Material, Field Planting, Concentration Determination, and Correlation Analysis for FA Compositions
The segregating double haploid (DH) population with 348 lines used in this study was derived from the cross of “KenC-8” × “N53-2” and was initially constructed by Wang et al. (2015), here it was named KN DH population. The DH lines and the parents were planted in three independent macroenvironments associated with three Provinces in China and 14 microenvironments were involved. Briefly, the breeding sites of Dali (DL) and Yangling (YL) associate with Shanxi Province and seven microenvironments of 08DL, 09DL, 10DL, 11DL, 12DL, 13DL, and 14YL (7 years from 2008 to 2014, planting in the areas) were tested and all of them belong to winter type environment. Gansu (GS) associates with Gansu Province and two microenvironments of 10GS and 11GS were tested and two of them belong to spring environment. Wuhan (WH) and Huanggang (HG) associate with Hubei Province and five microenvironmets of 11WH, 12WH, 13WH, 14WH, and 11HG were tested and all of them belong to semi-winter environment. Wuhan and Huanggang were the experiment bases of Huazhong University of Science and Technology of Hubei Province, and Dali, Yangling and Gansu were the experiment bases of Hybrid Rapeseed Research Center of Shanxi Province. The field trails were complemented as the same as reported by (Wang et al., 2015) that all lines were planted in a randomized complete-block designed with three replicates and no specific permissions were required. A total of seven traits were studied and the total amount of all saturated FA compositions was called one trait of FAS. The content for each trait was measured by near-infrared reflectance spectroscopy method (Mika et al., 2003) and take the average of 3 replicates. Pearson correlation analysis among traits was performed by using SPSS 19.0 software (SPSS Inc., Chicago, IL, USA).
QTL Mapping and Epistasis Analysis
A high density SNP-based linkage map that included more than 3000 markers with an average genetic distance of 0.96 cM was constructed for KN DH population (Chao et al., 2017). The map was used for QTL mapping and epistasis analysis for FAs together with phenotype data in the current study.
QTL and epistasis analyses were performed by using WinQTLCart_2.5 and QTLNetwork_2.0 software as (Chao et al., 2017) descripted, respectively. QTLs detected via unconditional analysis and integrated QTL after two rounds of meta-analysis were directly called identified, consensus and unique QTL and then were named with initial prefix of “uq,” “ucq,” and “uuq,” respectively. The naming patterns of identified QTL and consensus QTL were similar as consisting of the prefix plus the trait and followed by the linkage group. For example, “uqLA-A8-1” and “ucqLA-A8-1” represented the first identified and consensus QTL for trait LA and located in A8 linkage, respectively. The naming pattern of unique QTL was similar to that of identified and consensus QTL which just not contained the trait. For example, the unique QTL of uuqC3-2 represented the second unique QTL of C3 linkage group. The identified QTLs with overlapping CI for the same trait and repeatedly detected in different microenvironments were integrated into consensus QTL through meta-analysis by using BioMercator 2.1 software with default parameters (Arcade et al., 2004). Consensus QTLs detected in one microenvironment and with PV>20% or detected in more than one microenvironment with PV>10% were considered as the major QTLs. Consensus QTLs controlling the same traits and with the overlapping CI were further integrated into unique QTLs and the ones that had no overlapping CI with others were also considered as unique QTLs.
The conditional phenotypic values of y(T1|T2) were predicted by using QGAStation1.0 software (Zhao et al., 2006), where T1|T2 indicating the meaning of trait 1 conditioned on trait 2. For example, y(PA|SA) was the conditional phenotypic value of PA conditioned on SA, it means that the obtained phenotypic value for PA without the influence from the trait of SA. The QTL detected from the conditional analysis were called conditional identified and consensus QTL and then were named with the initial prefix of “cq” and “ccq,” respectively. The naming pattern for the conditional QTL was identical to that of unconditional analysis.
Identification of the Potential Candidates Related to acyl Lipid Metabolism, and Genetic Interaction Analysis of the Candidate Genes
On account of the collinearity relationship of B. napus and its reference genome together with the massive different alleles obtained from the re-sequencing for the parents of “KenC-8” and “N53-2” (Chao et al., 2017), the alleles which existed within the unique region and had SNP or InDel variation in intron, exon or within 1 kb up and down stream between the two parents were regarded as candidate genes.
The visualized interaction network was constructed by String software (http://string-db.org/) and exhibited by Cytoscape V-3.5.0 software (Shannon et al., 2003). Nodes represent the potential candidates and edges represent the interaction of them. Node size represented “Degree” and edge size represented “Combined-score,” the color for nodes and edges represented the “Betweenness centrality” and “Edge Betweenness,” respectively. All the value for these four parameters was calculated by Network Analyzer that included in Cytoscape V-3.5.0 software.
Quantitative PCR (qPCR) Analysis for Five acyl Lipid Metabolism Related Potential Candidates
The silicles for qPCR analysis were obtained at 15, 30, and 45 days after flowing (DAF) within two lines of materials and with the high C18:1 content (mean 55.22% for the all measured microenvironments) and the low C18:1 content (mean 18.87% for the all measured microenvironments), respectively. For each different developmental stage, three biological replicate samples from were used for expression analysis of each candidate. Seed were stripped from the silicles of the three plants for the next total Procedure of RNA extraction experiment followed the manufacturer's protocol of RNAprep Pure Plant Kit (TIANGEN, DP441, China). cDNA was synthesized from 2 mg total RNA using HiScript II Q RT SuperMix for qPCR (+gDNA wiper) (Vazyme, R223-01, China), RNA expression level analysis was performed using AceQ qPCR SYBR Green Master Mix (Vazyme, Q141-02/03, China) using StepOnePlus™ Real-Time PCR System (ThermoFisher Scientific, USA). For each reaction, three technical replicates were validated. p values were calculated through Student's t-test by using SPSS 19.0 software (SPSS Inc., Chicago, IL, USA). The primer pairs of the five candidate genes and reference gene Actin are listed in (Table S9).
Construction of Potential Regulatory Pathway of FA Metabolism in B. napus
The Kyoto Encyclopedia of Genes and Genomes (KEGG) database (http://www.kegg.jp/) was applied to construct the regulatory pathways in which the FA metabolism related candidates revealed in this study were involved. The potential regulatory pathways of FAs metabolism were inferred based on that of Arabidopsis. Six major processes of plastidial FA synthesis and elongation, TAG synthesis and degradation, β-oxidation, phospholipid and choline metabolism and lipoic aicd metabolism were integrated and included in this pathway.
Results
Phenotypic Variation and Correlation Analysis of FA Compositions in B. napus
The mean concentration for the single FA composition varied a lot with the range of 1.3–34.05% and showed transgressive segregation performance compared with that of the parents (Figure 1). The three most abundant compositions, C18:1, C22:1 and C18:2, possessed the mean content of 34.05, 26.48, and 15.53%, and the variation coefficient was 9.07, 8.57, and 9.08%, respectively (Table 1). The three monounsaturated FAs (MUFAs) C18:1, C20:1, and C22:1 displayed bi-modal distribution pattern, which indicated that these compositions might be controlled by a few major genes with a relatively large effect. The frequency distribution of the remaining five FA compositions displayed normal or near-normal distribution, which implied that these compositions were typical for the quantitative composition and were controlled by various loci with small genetic effect (Figure 1). Different compositions in the oilseed generally have the overt positive or negative correlation with each other. The Pearson correlation analysis showed that the two MUFAs C20:1 and C22:1 had significant negative correlation with the other six compositions, with the mean correlation coefficient of −0.696 and −0.803, respectively. However, a high positive correlation between these two compositions was observed with correlation coefficient of 0.857 (P < 0.01). Besides C20:1 and C22:1, the remaining six compositions have totally positive correlation with each other (Table S1). For example, the correlation coefficient between C16:0 and C18:2 upped to a high value of 0.917, this suggested a close relationship in the two compositions during the acyl lipid metabolism process.
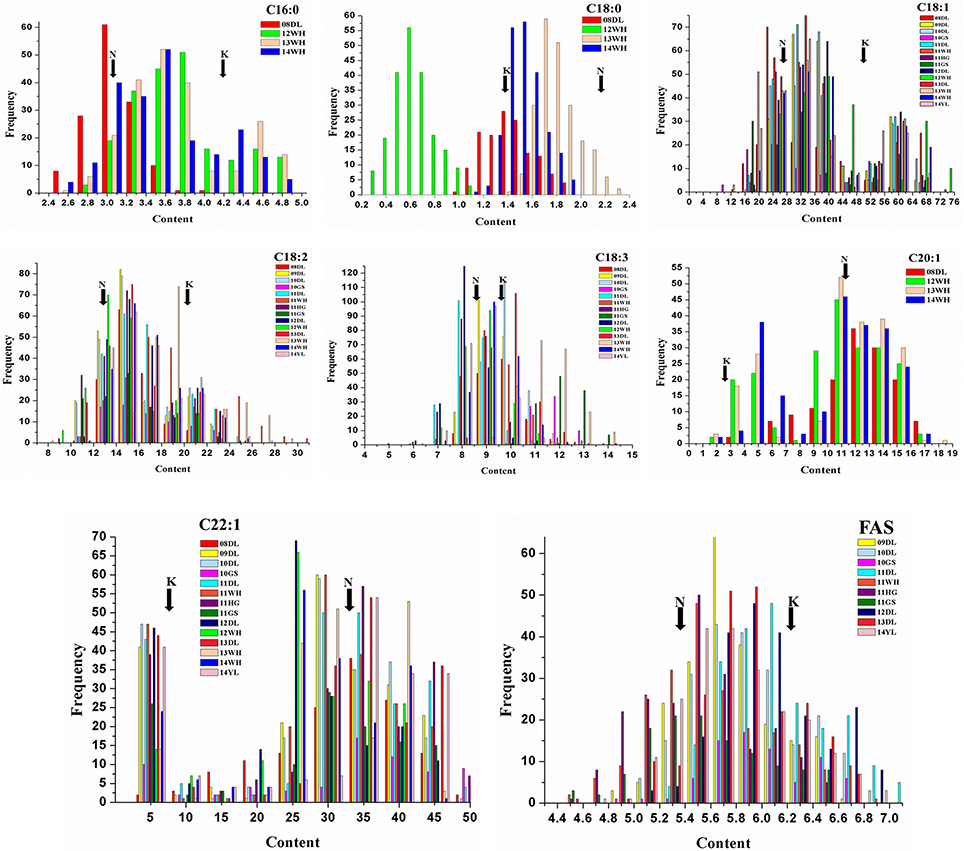
Figure 1. Distribution of FA concentrations of KN DH population in multiple environments. The unit of x-axis represents the percentage of each FA composition in the sum of all FAs. The unit of y-axis represents the number of lines. K represents the male parent of “KenC-8” and N represents the female parent of “N53-2” of the KN-DH population.
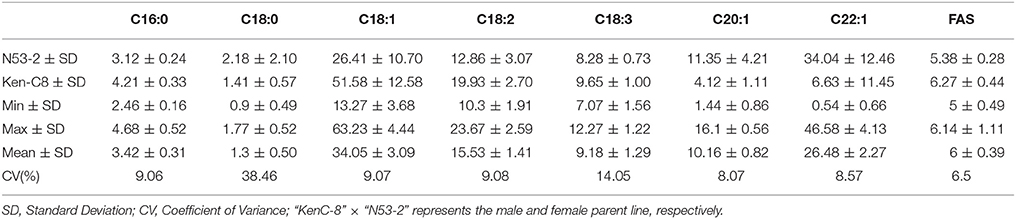
Table 1. The mean and range of content for each fatty aicd composition in KN DH population with 14 microenvironments field trial.
Stable and Environmental Specific QTL Analysis for FA Composition
A total of 406 identified QTL were detected, it was revealed that 211 and 195 QTL were distributed in the A and C genome, respectively. The number of identified QTL for the single component varied from 9 (C20:1) to 111 (C18:3) and these QTL explain the maximum PV of 45.05% for uqEA-12DL8-1. Further analysis showed that 67.73% of these identified QTL were located on A8 and C3 linkage groups, two of which respectively contains 137 and 138 QTL and they formed the distribution clusters (Figure 2; Figures S1, S2; Table S2).
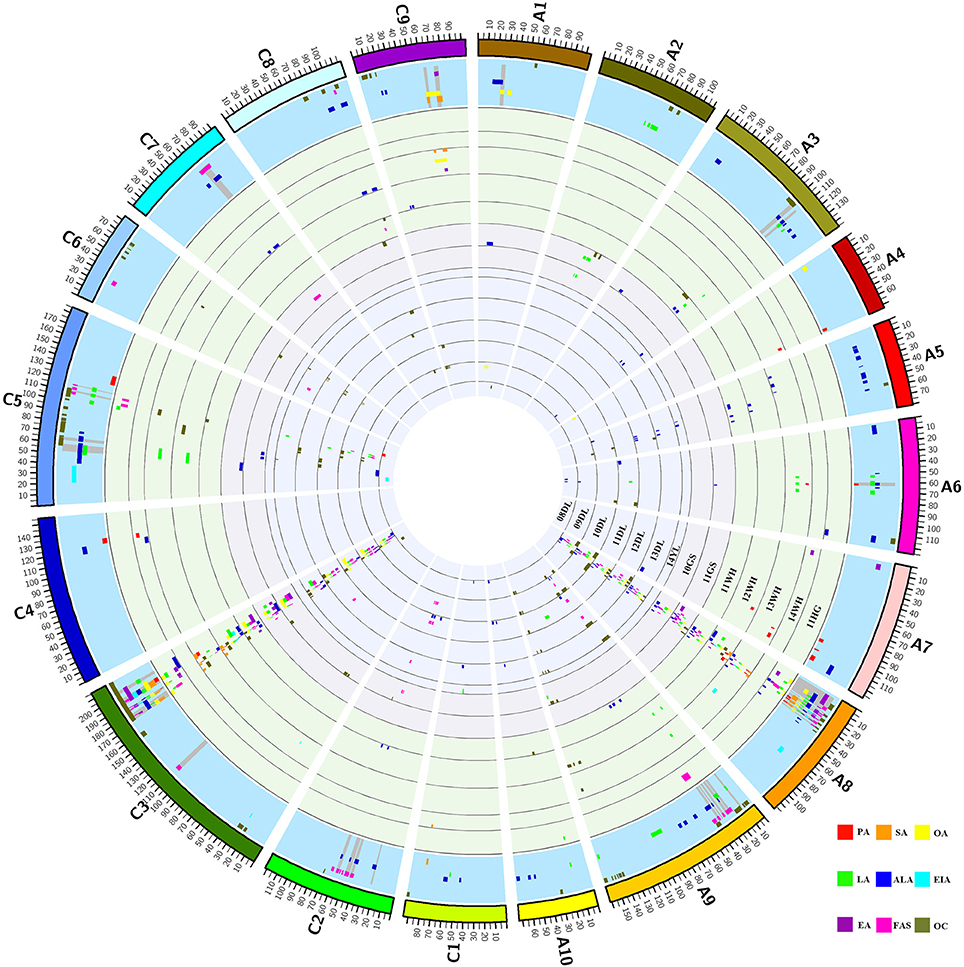
Figure 2. Distribution of QTL for each FA and oil content in each linkage group. The entire graph consists of 16 circles. From the inside to outside, the first 14 circles represent the 14 breeding microenvironments, it contains seven winter type of 08DL to 14YL, two spring type of 10GS and 11GS and five semi-winter type of 11WH to 11 HG, identified QTL for the nine traits located in each circle and indicated by different colors. The fifteenth circle with blue background represents the region includes consensus QTL for each trait and the gray spokes highlight the region of unique QTL. The outermost circle represents the 19 linkage groups of B. napus and they also distinguished by different colors. The abbreviation of PA, SA, OA, LA, ALA, EIA, EA, FAS, and OC represents the traits of C16:0, C18:0, C18:1, C18:2, C18:3, C20:1, C22:1, FAS, and oil content, respectively.
The 406 identified QTL were integrated into 204 consensus QTL through meta-analysis for the purpose of detecting multiple environment expressed QTL (Table 2). The number of consensus QTL for single composition ranged from 9 (C20:1) to 63 (C18:3) and the single QTL explaining PV varied from 1.49 to 40.53%. A total of 81 major QTL were identified, the largest PV value upped to 45.05% explained by ucqEA-A8-6. For the single composition, there were 5, 5, 14, 13, 11, 7, 14, and 12 major QTL for C16:0, C18:0, C18:1, C18:2, C18:3, C20:0, C22:1, and FAS were obtained, respectively. Majority of these major QTL (94, accounting for 46.08%) were located on A8 and C3 linkage groups (Figure S1). For the entire 204 consensus QTL, 52 QTL were detected in at least two macroenvironments and 74 QTL were detected in at least two microenvironments. For example, ucqOA-A8-3, ucqOA-C3-4, ucqLA-A8-4, ucqLA-C3-6, ucqALA-A8-3, ucqEA-A8-9, ucqEA-C3-5, ucqFAS-A8-4 and ucqFAS-C3-2 were observed simultaneously in three macroenvironments. Especially, two QTL of ucqOA-C3-7 and ucqALA-C3-4 were detected in eight microenvironments of the three macroenvironments. These QTL, also represent the major ones, which were constantly detected in at least two years for one or more macroenvironments could be defined as “environmental stable QTL” and it's also indicated that they were slightly affected by the breeding environments. More importantly, a total of 22 environmental specific QTL were revealed, all of which were expressed only in specific macroenvironments. In addition, a few novel QTL, such as ucqPA-C5, were also discovered based on the utilization of the high-resolution DH population here (Table 2).
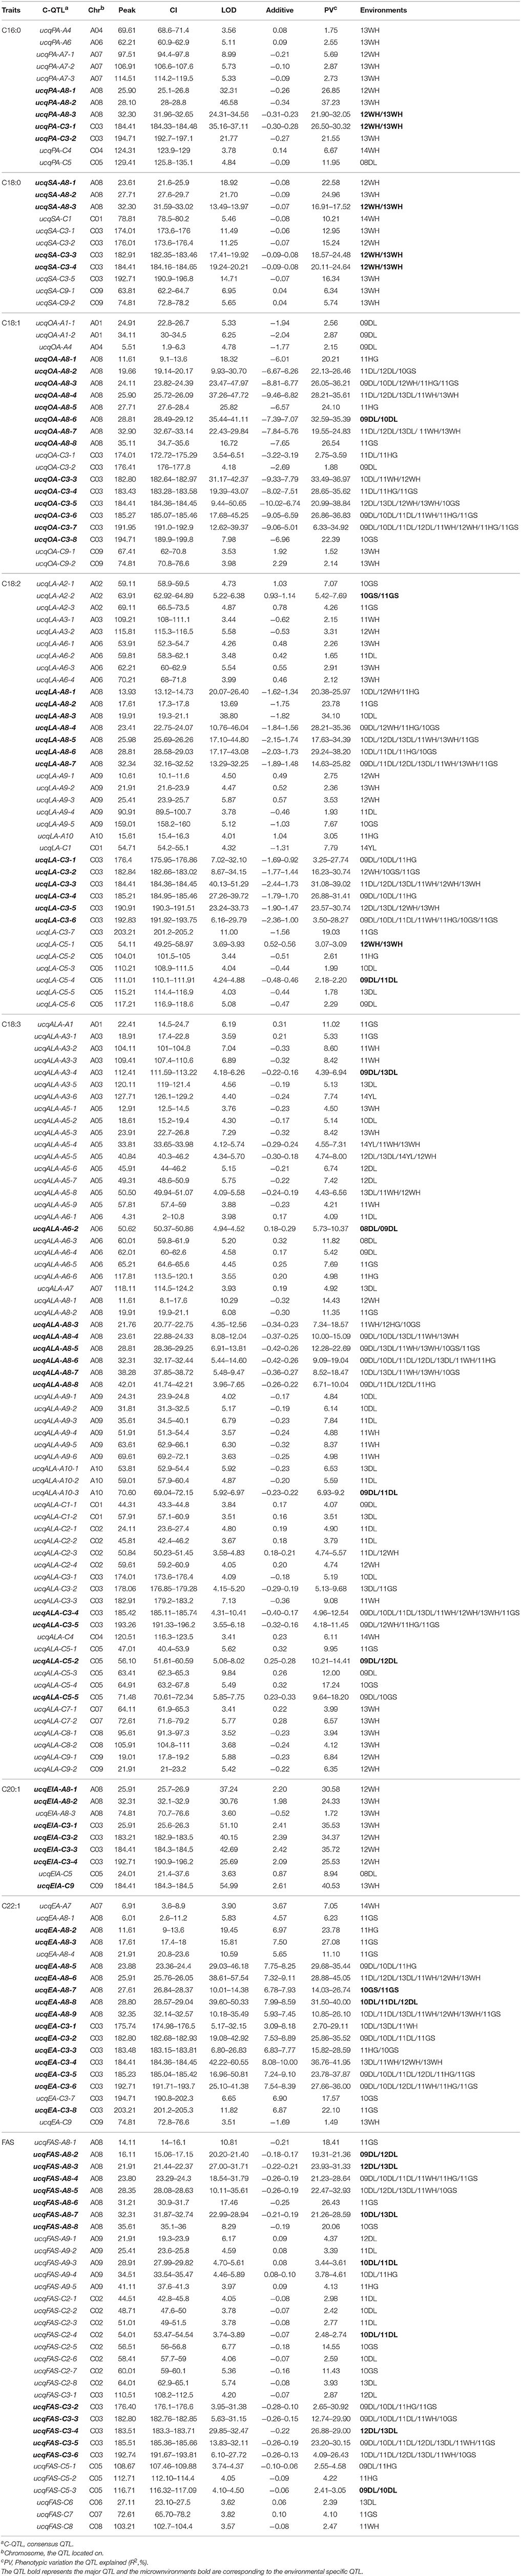
Table 2. The consensus QTL revealed in KN DH population for fatty acid compositions.
In order to explore the pleiotropic QTL that simultaneously control multiple FA compositions, the 204 consensus QTL were then integrated into 127 unique QTL (Table 3). In the result, 2 unique QTL each simultaneously control 5, 6, and 7 different compositions, respectively. There were 20 QTL that simultaneously control two distinct compositions, 12 QTL simultaneously control three distinct compositions, and one QTL simultaneously control four different compositions, the rest of the unique QTL were composition-special and just control one composition for each.
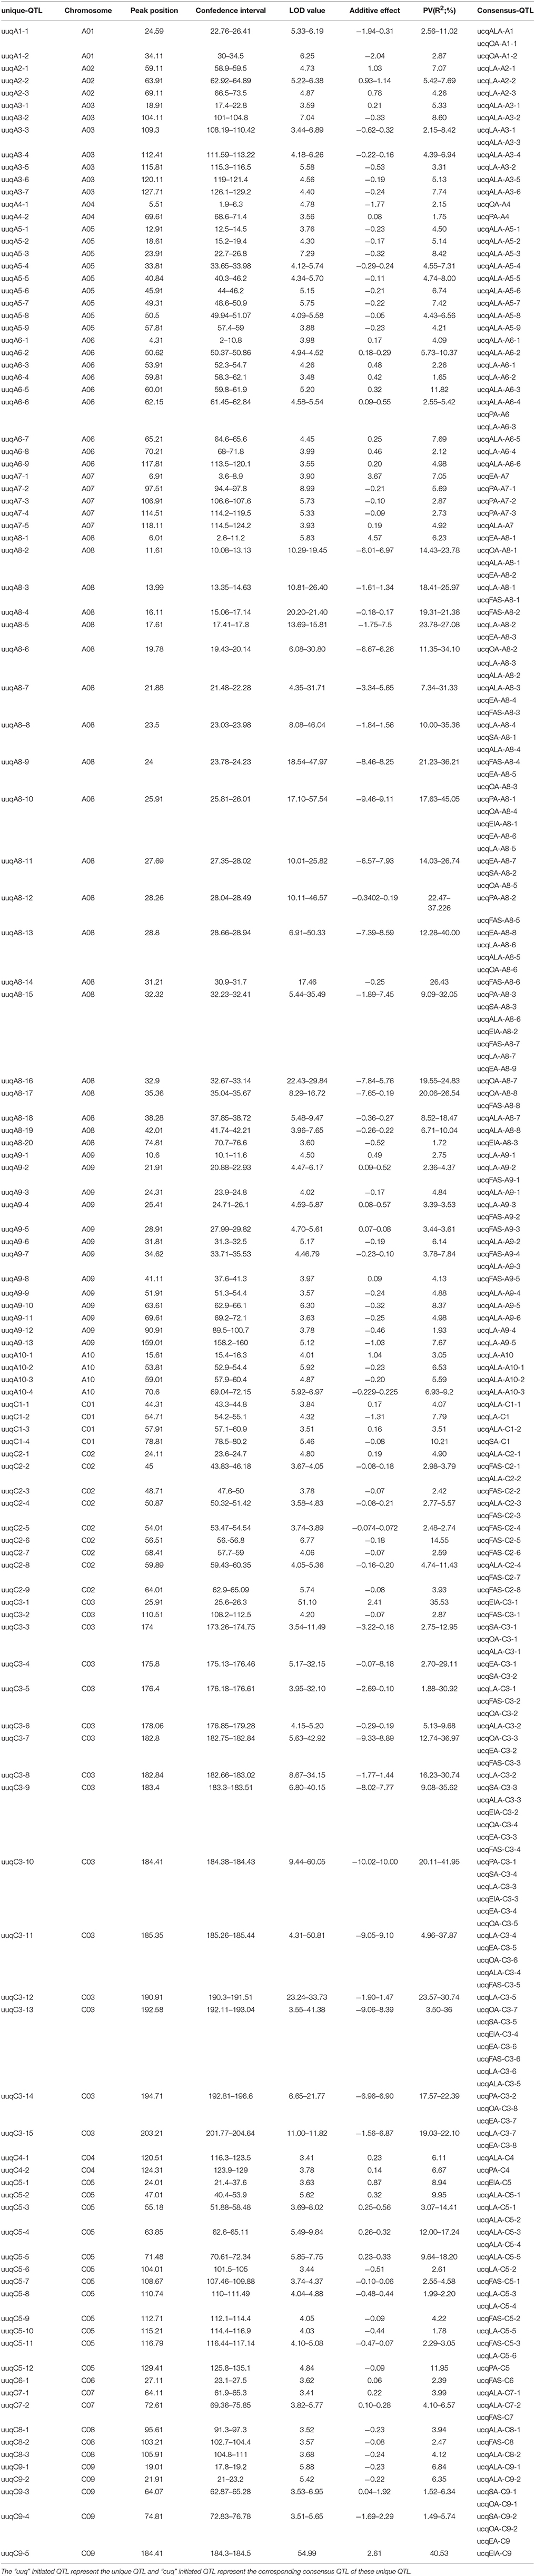
Table 3. The revealed unique QTL in KN DH population for fatty aicd compositions.
Conditional QTL Analysis for FA Composition
To further explore the genetic relationship of closely correlated compositions at individual QTL level, the conditional QTL analysis was also carried out. When the phenotypic data of the eight compositions were conditioned with each other, a total of 3037 conditional identified QTL were found, and the PV value ranged from 1.32 to 39.75%, the average value were significantly reduced to 7.40% compared to 17.99% of the unconditional analysis (Table S7). Unlike the unconditional result, these conditional identified QTL were more evenly distributed on the 19 linkage groups of rapeseed and the total occupied a proportion on A8 and C3 linkage groups that reduced to about 22.13% [(266 + 406)/3,037] compared to 67.73% of proportion under unconditional analysis. For the single composition, there were 152, 147, 507, 522, 528, 132, 546, and 503 QTL, respectively for C16:0, C18:0, C18:1, C18:2, C18:3, C20:1, C22:1, and FAS (Table S7).
These conditional identified QTL were subsequently integrated into 2241 conditional consensus QTL by meta-analysis (Table S8). Of the 2241 conditional consensus QTL, 288 were detected to be expressed in two microenvironments, 105 were simultaneously expressed in three microenvironments, 40 could be detected to be expressed in four microenvironments. Additionally, 14, 11, 13, 1, 1, and 2 QTL were respectively expressed in 5, 6, 7, 8, 9, and 10 microenvironments, and the remaining were specially expressed in only one microenvironment. For each composition, there were 145, 136, and 124 conditional consensus QTL revealed for the three compositions of C16:0, C18:0, and C20:1, respectively. Furthermore, there were more than 300 consensus QTL each for five compositions (C18:1, C18:2, C18:3, C22:1, and FAS), the most was 395 for C22:1 (Table S8). In addition, remarkable different detection of the major QTL for each composition was discovered after the conditional analyses. There were 4, 18, 42, and 27 novel major QTL revealed respectively for C18:0, C18:1, C18:3, and FAS, and the others contained the overlapped confidence with the QTL of unconditional results. Surprisingly, although there were 3, 30, 5, and 35 novel discovered major QTL respectively for C16:0, C18:2, C20:1, and C22:1, the major QTL that was detected in the unconditional analyses for the four compositions was absent within the conditional analyses. These results suggested that many unconditional QTL for some traits were contributed by other traits rather than attributed directly to themselves.
Epistatic Interaction Analysis for the Metabolic Processes of FA Composition
In addition to additive QTL, epistatic interaction was also considered as an important contributor for the genetic basis of PV in crops (Jourdren et al., 1996). FA components of oil seed crops typically showed the quantitative composition feature and the complex epistatic interaction usually played a vital role in the metabolic processes and finally determined the quality of the edible oil (Wang et al., 2015). A total of 69 pairs of additive × additive (AA) type epistatic QTL interaction were observed, the additive effect value ranged from −4.56 to 4.36 and the number of the epistatic QTL pairs for single composition varied from 2 of C16:0 to 17 of FAS (Table S3). Notably, the distribution of these epistatic QTL displayed a large uneven distribution pattern among the 19 linkage groups. In general, for the 69 interaction pairs, 49 pairs of QTL interaction (accounting for 71% of the proportion) were obtained from the interaction between A8 and C3, and for each linkage group contained 56 and 54 involved QTL, respectively. There were 8, 5, 3, and 2 QTL interaction loci detected for the linkage group of C5, A9, C2, and A6, respectively. In addition, only one QTL interaction loci was observed on A3, A5, A10, C1, C7, and C9. As for the environmental distribution of these epistatic interaction QTL, 31 pairs of epistatic QTL were detected in the winter type, 30 pairs were detected in the semi-winter type and the remaining 8 epistatic pairs belong to the spring type (Table S3).
Detection of Lipid Metabolism Related Genes in CI of QTL
Using the comparative genomics approach together with the released genome sequence of B. napus (Chalhoub et al., 2014), more than thirteen thousand homologous genes of Arabdopsis underlying the CI of the 91 unique QTL were observed (Table S4). 68 genes were further filtered out relate to the acyl-lipid metabolism. Exclusion of seven genes that had no sequence difference in the parents, 61 orthologous genes were left and these potential candidates were involved in several main processes of FA metabolism, including Plastidial FA Synthesis, FA Elongation, Lipid Trafficking, TAG Synthesis/Degradation, β-Oxidation and oilbody formation (Table S5). Noteworthy, seven genes (including DGAT3, ATTLL1, ECI2, LIP2, DGT2, and KCS17/18) that located in the major QTL region with large PV were also identified. For example, the FA elongation related gene KCS18 were simultaneously involved in seven major QTL of ucqEA-A8-6, ucqEA-C3-3, ucqOA-A8-4, ucqPA-A8-1, ucqEIA-A8-1, ucq-EIA-C3-2, and ucqFAS-C3-4, with the largest explained phenotypic variation value of 45.05%. In order to validate the potential essential role of these seven major QTL located genes, five of them which respectively belonged to the five different processes of acyl lipid metabolism, were selected for the qPCR analysis (Figure 3). The embryo of three developmental stages after flowering time, with low and high content of C18:1, were used for qPCR assay. It was revealed that with the development of the seed, the expression level of two genes LIP2 and KCS18, which respectively belonged to the processes of plasitdial FA synthesis and FA elongation, became more and more stronger in the material with high content of C18:1 compared with the material with low C18:1 content. The expression level of DGAT3 (the TAG synthesis related gene) in the material with high C18:1 content was higher than that of the material with low C18:1 content, while with the development of the seeds went on, its expression level tended to be identical in the two different types of materials. In addition, the expression levels of two TAG degradation and β-Oxidation related genes, ATTLL1 and ECI2, became gradually weaker in the material with higher C18:1 content than that of the material with lower C18:1 content. Together, these results suggested that these candidates closely related to FA metabolism during the seed development of rapeseed.
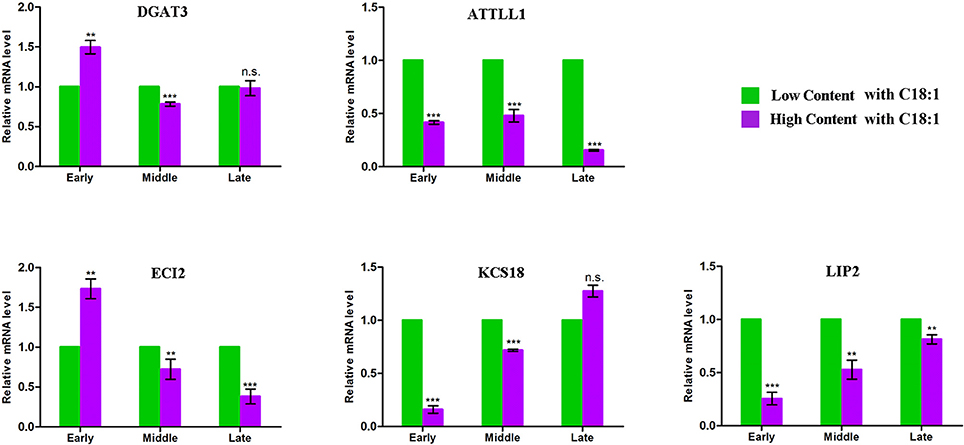
Figure 3. qPCR analysis for the five acyl lipid metabolism related candidates. The x-axis indicates the three different developmental stages of seed and y-axis indicates the mRNA expression level of each candidate gene. The green represents the material contains low C18:1 concentration and the purple represents the material contains high concentration of C18:1. Early indicates that the materials were collected at the stage of 15 days after flowering, middle indicates the stage of 30 days after flowering and late indicates the stage of 45 days after flowering. The expression of each gene were calculated based on three biological replicates. Bar represent the standard deviation calculated by ΔΔ Ct method. **Significant at p < 0.01, *** Significant at p < 0.001, n.s. No significance p > 0.05.
Implementation of Network Interaction Analysis Among Candidates and Construction of Potential Regulatory Network Involving Metabolic Processes of FA in B. napus
To further dissect the genetic mechanism of acyl lipid metabolism, 54 of the 61 candidates were linked and an interaction network based on the ortholog annotation in A. thaliana was constructed. The network contained 54 nodes and 221 edges and involved five lipid metabolic processes of TAG synthesis/degradation, FA elongation, Plastidial FA synthesis and β-Oxidation (Figure 4). The network result showed that despite these interacted candidates attributed to different metabolic processes, the complex interaction, direct or in direct, still closely existed among them. Some predominant candidates, such as FAB1, LPAT5 and MFP2 extensively interacted with other genes, this suggested the essential role for them in the process of acyl-lipid metabolism. Although the acyl-lipid metabolism process was characterized in Arabidopsis in detail (Li-Beisson et al., 2013), the similar work was seldom carried out in B. napus owing to its more complex genomic structure. To obtain a better understanding of the genetic basis of the FA formation and accumulation during seed development, the 61 specially selected orthologous candidates were used to construct an elaborated pathway related to the FA metabolism in B. napus (Figure 5). This main pathway contained several associated metabolism processes, including plastidial FA synthesis, FA elongation, TAG synthesis and degradation, phospholipid and sulfolipid synthesis, beta-oxidation, lipid trafficking and oil body formation.
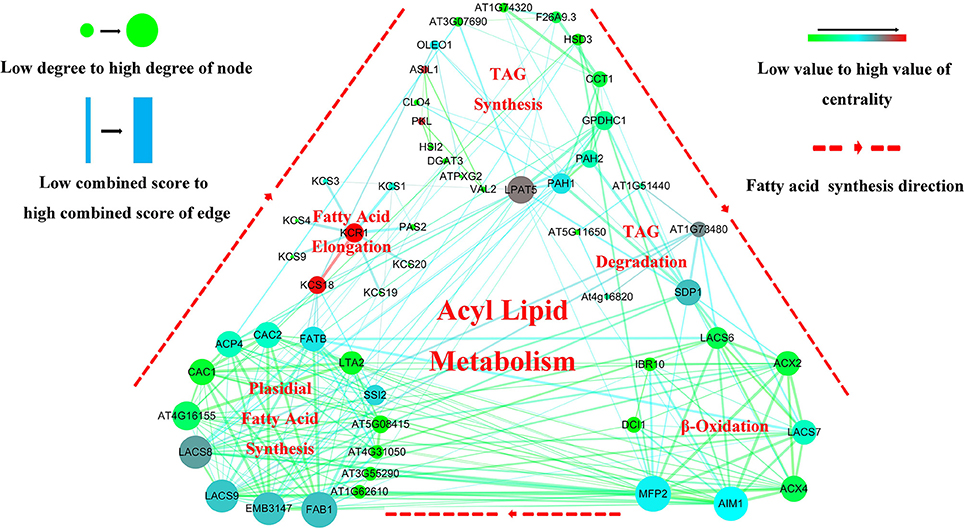
Figure 4. Gene interaction network analysis associated with the acyl lipid metabolism related candidates underlying the CI of unique QTL. The visualized interaction network of 54 candidates was constructed by String software and exhibited by Cytoscape V-3.5.0 software. The five different regions represent different metabolic pathway of acyl lipid metabolism. Nodes represent the potential candidates and edges represent the interaction of them. Node size represents “Degree” and edge size represents “Combined-score,” and the color for nodes and edges represents the “Betweenness certrality” and “Edge Betweenness”, respectively. All the value for these four parameters was calculated by Network Analyzer that included in Cytoscape V-3.5.0 software.
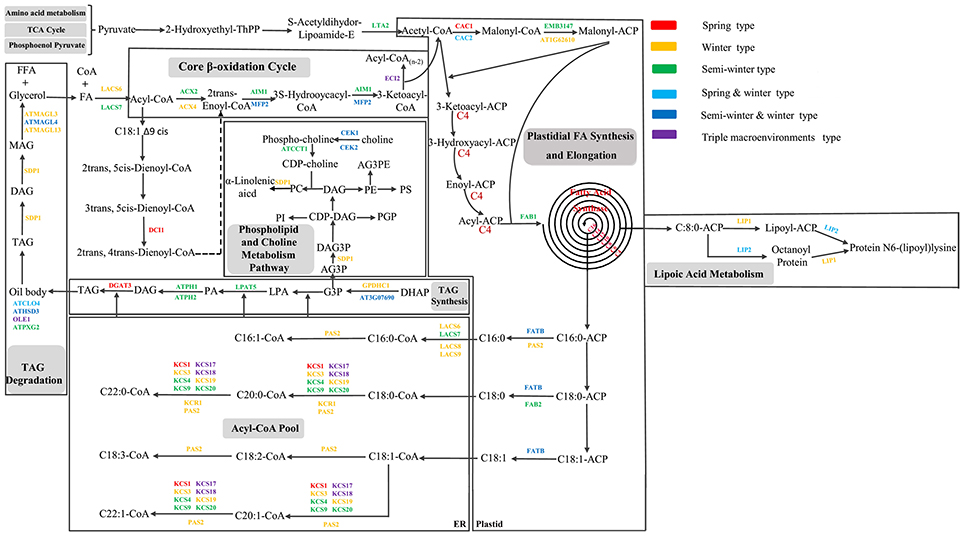
Figure 5. Potential regulatory network and some candidate genes associated with acyl lipid metabolism in B. napus. All the candidate genes used in the network originated from the CI of unique QTL of the seven FA compositions. Different colors with the genes indicated the candidates located in different consensus QTL associated with different breeding environment. The dashed line indicates that multiple reactions in this step might exist.
A total of 15 orthologous genes were detected related to plastidial FA synthesis process. For example, short-chain dehydrogenase/reductase (SDRD) and AT1G62610, two orthologous candidates of Arabidopsis that were respectively involved in the peroxisomes metabolism and the Ketoacyl-ACP Reductase activity, jointly controlled the three FA compositions of C18:2, C18:3 and C16:0 (Quan et al., 2013), which were positioned in the same QTL of ucqLA-A6-2. Long-Chain acyl-CoA synthease, LACS8 and LACS9, two stearyl coenzyme A synthease catalyzing the formation of stearyl Co-A from stearic acid, were detected in ucqALA-A10-2 and ucqALA-A10-1, respectively. As one of the most committed step in the FA biosynthesis process, the conversion of acetyl-CoA to malonyl-CoA is catalyzed by the acetyl carboxylase (ACCase) (Baud et al., 2003). Two ACCase subunits of BCCP1 and CAC2 were detected in the CI of ucqALA-A3-1, ucqLA-A9-5 and ucqEIA-C5 respectively, and probably control the biosynthesis of three FA compositions of C18:2, C18:3, and C20:1. The plastid E2 subunit of pyruvate dehydrogenase of PLE2, which played a great important role in the early embryonic development of Arabidopsis (Lin et al., 2003), was observed in the CI of ucqALA-A9-6 with a negative additive effect.
The de-novo biosynthesis process of FA in plastid is sequentially accompanied by the elongation of acyl-CoA in the endoplasmic reticulum (Li-Beisson et al., 2013). In this study, a total of 10 potential candidates involved in FA elongation were identified in the CI of some consensus QTL. Among these candidates, eight KCR family genes were identified containing KCR1/3/4/917/18/19/20. It is noteworthy that KCR17 and KCR18 were respectively located in ten and seven major QTL (Table S5). Additionally, KCR1 and another potential candidate PAS2 that were involved in the FA elongation process were also found in the QTL of ucq-ALA-A7 and ucqALA-A10-1, respectively.
The biosynthesis process of TAG typically contains four main sequential steps and was catalyzed by various functional genes (Ohlrogge and Browse, 1995; Beisson et al., 2003). Six genes participating in this process were revealed. For example, GPDHC1, a gene encodes a protein with NAD-dependent glycerol-3-phosphate (G3P) dehydrogenase activity was found in the conversion step of DHAP to G3P and underlying the CI of ucqALA-A5-2. Lysophosphatidyl acyltransferase (LPAT) family contains five members of LPAT1 to LPAT5, all of which possesses the main function in the conversion of lysophosphatidic acid to phosphatidic acid (Beisson et al., 2003). In this reaction step, LPAT5 was revealed in the CI of ucqSA-C1 with a negative additive effect. The following reaction of the process mentioned above was the dephosphorylation of PA that was catalyzed by phospatidate phosphatase (PP) to form DAG. PP played a pivotal role in this step and its activity was also closely related to two Arabidopsis homologs phosphatidic acid phosphohydrolase of PAH1 and PAH2, both of which possesses Mg2+-dependent PP activity when expressed in yeast and were strongly expressed in the developing seeds (Eastmond et al., 2010) and were detected in the CI of ucqLA-C5-2 and ucqALA-A6-6, respectively. The final step of triacylglycerols biosynthesis was the acylation reaction that utilizing DAG to form TAG. Several important genes involving this step were found in previous studies, such as diacylglycerol acyltransferase (DGAT) family genes of PDAT and PDCT (Lardizabal et al., 2001). Besides the role of forming of TAG, DAG also was used to generate phosphatidylcholine together with CDP-choline, which was generated through a two-step sequential reaction conversion of choline to phospho-choline and phospho-choline to CDP-choline. Two potential candidates of choline kinas, CK1 and CK2, underlying the first conversion process and one candidate of phosphorylcholine cytidylyltransferase 1 (CCT1) underlying the second were revealed and located in the ucq-ALA-A7, ucqPA-A7-3, and ucqALA-C8-1, respectively.
TAG biosynthesis occurs at the ER and once synthesized TAG molecules will coalesce to form the specific structure of oil bodies or lipid droplets. These organelles consist of a TAG core surrounded by a number of different proteins and the most abundant of these proteins are the oleosins (Jolivet et al., 2004). Here, OLE1 and CLO4 were detected in five QTL of ucqALA-A3-5, ucqALA-A7, ucqALA-C7-2, ucqLA-A2-2 and ucqFAS-C7. Besides the ER, the biosynthesis of TGA probably also involves some reactions at the oil body (Huang, 1992). A. thaliana homologous genes of peroxygenase 2 (ATPXG2) and hydroxysteroid dehydrogenadse 3 (HSD3), two genes related to the formation of oil body were found and were associated with three QTL of ucqLA-A10, ucqALA-A3-4 and ucqALA-C7-1.
Seed stored oil mobilization via TAG degradation and β-oxidation processes contain series of sequential reactions and involves various catalyzing genes (Graham, 2008). Triacylglycerol undergoes three successive deacylation reactions to release free FA and glycerol in cells. Several candidates were revealed in these processes, for example, three potential Monoacylglycerol lipase (MAGL) family genes MAGL3, MAGL4, and MAGL13, both of which function in catalyzing the MAG to form free FA and glycerol, were detected in the CI of our QTL analysis.
Free FA and glycerol, both of which derived from the terminal degradation of TAG, were transported by an ABC related transporter of CTS into peroxisome and underlying a series of reactions to form CoA and FAs at first (Footitt et al., 2002). Before the core β-oxidation pathway occurs, CoA and FAs were converted into acyl-CoA by long chain acyl-CoA synthetase (LACS). In this step, two potential candidates LACS6 and LACS7 were found and associated with three QTL of ucqLA-C5-5, ucqFAS-C3-1, and ucqLA-A6-4. FA β-oxidation of high plants is a ubiquitous process that occurs in peroxisome and the core pathway contains four sequential reaction steps. First step is the conversion of Acyl-CoA to 2trans-Enoyl-CoA and catalyzed by acyl-CoA oxidase (ACX). In this step ACX2 and ACX4 were detected and located into ucqALA-C9-2 and ucqLA-A9-4, respectively. The second and third steps involve the conversion of 2trans-Enoyl-CoA to 3S-Hydrooycacyl-CoA next to 3-Ketoacyl-CoA, and these two steps are catalyzed by the same enzyme of multifunctional protein (MPF). The orthologous MPF2 was revealed in this two steps and located in the two QTL of ucqFAS-C3-1 and ucqFAS-C5-2. Additionally, gene abnormal inflorescence meristem 1 (AIM1), which played an essential role in wound-induced jasmonic acid formation in peroxisome via FA β-oxidation pathway (Delker et al., 2007), was also detected in the QTL analysis and mapped into the ucqLA-A6-1.
Besides the potential FA metabolism related genes discussed above, two lipid trafficking genes TGD2 and PTAC4 were also revealed and associated with five QTL of ucqALA-C5-5, ucqFAS-C2-3, ucqFAS-C2-7, ucqALA-C2-3 and ucqALA-C2-4. TGD2, the phosphatidic acid-binding protein, played an important role in the process of polar lipid flipping across the ER and outer and inner chloroplast envelope membranes.
Discussion
Phenotypic Variation and Correlation Analysis Among Different FA Compositions
Quantitative compositions of various crops are genetically controlled by abundance of reciprocal genes and are generally affected by the surrounding environment (Si et al., 2003). The distribution patterns of C16:0, C18:0, C18:2, C18:3, and FAS displayed the typical normal or near-normal distribution, while for the three MUFAs, C18:1, C20:1, and C22:1, they totally showed double main peaks performance. This result was similar to the previous reports (Wang et al., 2015) despite the different populations used and it indicated that a few genes with major effect controlling MUFAs existed. Besides the similar distribution pattern of the composition content among these compositions, they also displayed remarkable correlation with each other. For example, due to the coherent biosynthetic process and the similar required catalytic enzymes, such as the KCS gene family, the two very long-chain FAs of C20:1 and C22:1 showed close positive correlation. This notion also could be considered as the cause for the close positive correlation among the six remaining compositions. While, owing to the competitive relationship of the same substrate for C18:1-CoA or the potential deviational regulation, C20:1 and C22:1 were all negatively correlated with the other six compositions.
Unconditional and Conditional QTL Mapping Analysis of FA
Generally, achievement of detecting accurate and reliable QTL depends on the large mapping population that holds high density genetic linkage map and multiyear and multisite field trials in crops (Asíns, 2002). In this study, a DH population that contained 348 lines and tested in 14 environments was utilized to perform the unconditional and conditional QTL mapping analysis. In total, 406 QTL were detected and unevenly distributed into the entire genome of B. napus, and 67.76% of them were found in two linkage groups of A8 and C3 (Figure S2). The positions for the majority of the detected QTL (99.15% for A8 and 98.55% for C3) of the two linkage groups were revealed into the coherent range of 2.6–42.3 and 171.9–206.9, with the mean CI of 1.5 and 3.0, respectively (Table S2). The feature of clustered distribution suggested abundant variations related to FA metabolism on A8 and C3.
For QTL mapping of FA, KN DH population is a new population that derived from the cross of two parents with a large difference in oil content and FA (Table 1; Wang et al., 2015), and have a big population number. Therefore, in present study, combining the high density linkage map, some novel QTL for some FA compositions were discovered by comparing to the previous studies (Burns et al., 2003; Hu et al., 2006; Zhao et al., 2008; Smooker et al., 2011; Yan et al., 2011; Wang et al., 2015). Three novel consensus QTL of ucqPA-C5, ucqSA-C1 and ucqEIA-C5 were revealed controlling three compositions, C16:0, C18:0 and C20:1, explaining PV value of 11.95, 10.21, and 8.94%, respectively. 12 novel consensus QTL of ucqALA-A3-1/2/3/4/5/6 and ucqALA-A9-1/2/3/4/5/6 were detected responsible for C18:3 with the largest PV value of 8.60%. Furthermore, 10 FAS related novel consensus QTL of ucqFAS-C2-1/2/3/4/5/6/7/8, ucqFAS-C7 and ucqFAS-C8 were also found and distributed in the three linkage groups of C2, C7 and C8 and with the largest PV value of 14.55% (Table S2).
In addition, some QTL reported in previous studies were finely divided into multiple QTL with smaller confidence interval in the present study. For example, Burns et al. (2003) detected some QTL that were distributed in the N8 linkage group respectively controlling six compositions of C16:0, C18:0, C18:1, C18:2, C20:1, and C22:1, both of which were divided into at least two consensus QTL and at most nine QTL for C22:1. In another study, Yan et al. (2011) applied a mapping population contains 451 markers to detect some FA compositions QTL located in the N8 linkage group and were involved in five FA compositions, C16:0, C18:1, C18:2, C20:1, and C22:1, the QTL for each composition were divided into more than one consensus QTL in this study; one N10 located QTL, responsible for the composition of C18:3 was also divided into two regions. Smooker et al. (2011) revealed two QTL that controlled the two compositions of C18:1 and C18:3 and were located in two linkage groups of A1 and C2, both of which were also detected in our result and divided into two consensus QTL. These results demonstrated that genetic linkage map with high marker density could facilitate accurately and meticulously the detection of QTL of interest and this is also prerequisite for the study of candidate detection.
Previous studies reported that the three very long chain unsaturated FA compositions, C22:1, C18:1, and C18:2, mainly composed seed oil in B. napus (Zhao et al., 2008; Smooker et al., 2011). In this study, the co-localization for some QTL which simultaneously controlled two distinct traits were also observed, and which were located on three sets of linkage groups of A8, A9, C3 and C5, A8 and C3, A8 and C3, respectively (Figure 2; Table S6). This indicated that the detection result of FA QTL in this study was reliable and was also consistent with the previous detection of which concentration of the three compositions was positively correlated with oil content in rapeseed (Malosetti et al., 2013).
The field trials that implemented here associated with successive seven years in three distinct breeding macroenvironments of winter type, semi-winter type and spring type. In general, the existence of quantitative trait is easily affected by the surrounding environment of breeding site (Malosetti et al., 2013), and multiple years and sites' field trial is of great significance for detecting the environmental stable and specific QTL. Some major QTL, which were successively detected in multiple macroenvironments, such as ucqEA-A8-9, ucqALA-C3-4, and ucqOA-C3-7, were considered as environment stable ones (Table 2). 22 macroienvironment specific QTL were revealed containing six semi-winter type QTL, two spring type QTL and 14 winter type QTL. The six semi-winter type QTL ucqPA-A8-3, ucqPA-C3-1, ucqSA-A8-3, ucqSA-C3-3/4, and ucqLA-C5-1 were detected in two years of 12WH and 13WH. ucqLA-A2-2 and ucqEA-A8-7 were the two spring type QTL and were detected in the two consecutive years' field trial of 10GS and 11GS. ucqOA-A8-6, ucqLA-C5-4, ucqALA-A3-4, ucqALA-A6-2, ucqALA-A10-3, ucqALA-C5-2, ucqEA-A8-8, ucqFAS-A8-2/3/7, ucqFAS-A9-3, ucqFAS-C2-4, ucqFAS-C3-4, and ucqFAS-C5-3 represented the winter type QTL and expressed in at least two successive years from 09DL to 13DL (Table 2). Majority of these environmental specific QTL were also major ones and will facilitate us to breed the cultivars that grow in specific environment.
In the light of the complicated interaction, using of unconditional QTL mapping method only could not completely dissect the genetic mechanism of quantitative traits in crops because of the direct correlation between two compositions on the individual level (Wen and Zhu, 2005). When the eight compositions were conditioned with each other, a mount of conditional QTL were revealed for each conditioned composition. These conditional QTL, identified or consensus, generally had similar additive effect value compared to the unconditional results, which suggested that the FA compositions were controlled by numerous of QTL with micro genetic effect that could not be detected under the unconditional condition. These conditional QTL were more evenly distributed in the 19 linkage groups of B. napus rather than the cluster distribution pattern on A8 and C3 linkage groups of the unconditional results. Through comparison of the detected QTL between the two different conditions, it was revealed that QTL could be divided into four types. The first type containing these QTL could be detected under the unconditional analysis but not in the conditional result. These types of QTL represented their actual attribution by other correlated composition and it might indicate some genes closely linked in the same loci and control the PV for distinct FA compositions. For example, two major unconditional consensus QTL of ucqPA-A8-3 and ucqALA-A6-2 were detected in two microenvironments respectively but couldn't be detected when conditioned on other seven compositions, which suggested that the two major QTL for the two compositions of C16:0 and C18:3 were in fact attributed by other compositions. The second type of QTL was those that could only be detected in the conditional result rather than the unconditional analysis, this suggested that the expression of some QTL with micro genetic effect were suppressed when simultaneously analyse two distinct traits but they appeared when the related compositions were conditionally eliminated. Taking the conditional consensus QTL of ccqEA/FAS-C2-2 for example, it could be detected in six microenvironments and with a small additive effect value of −0.08–0.05 while couldn't be detected under the unconditional condition. This result indicated that this QTL for C22:1 was covered by other compositions and couldn't be revealed when the unconditional analysis was performed. The third and fourth types of QTL were those that could simultaneously be detected under the two different conditions and the difference was that the former with slight change in the additive effect value and the latter showed that these conditional QTL possessed obvious change in additive effect but still had significant effect compared with the unconditional counterparts. These two types of conditional QTL commonly represent the QTL that with multiple function in controlling more than one compositions of their metabolic mechanism. The third type displayed some compositions controlled by some QTL which were independent of other compositions. For example, the major unconditional consensus QTL ucqSA-C3-3 was detected in two microenvironments of 12WH/13WH and with the additive effect value of−0.09–0.08. Two corresponding conditional QTL of ccqSA/PA-C3-3 and ccqSA/LA-C3-2 were detected when C18:0 was conditionally eliminated on the compositions of C16:0 and C18:2, and with the small additive effect value−0.11 and−1.01, respectively. This result demonstrated that the existence of QTL ucqSA-C3-3 was at least independent from the contribution of C16:0 and C18:2. For the fourth type of these QTL, a proper example was the major QTL ucqALA-C3-4 simultaneously detected in eight microenvironments and with a small additive effect value of−0.40–0.17, but when the composition of C18:3 was conditioned on composition of C22:1, the conditional consensus QTL ccqALA/EA-C3-9, the corresponding QTL of ucqALA-C3-4, was also detected in six microenvironments while the additive effect value increased to 4.13–7.89, this suggested that the composition of C18:3 were controlled not only by the QTL of the individual level but also partly attributed by the influence from C22:1. Another example is the consensus QTL ucqEA-A8-9, which represented a major QTL of C22:1 and was revealed in seven microenvironments with a large additive effect value of 5.93-7.45, while conditioned on the composition of C18:2, the additive effect value for the corresponding conditional QTL of ccqEA/LA-A8-1 greatly reduced to−0.48, this indicated that the genetic effect of ucqEA-A8-9 for C22:1 was largely contributed by C18:2. Together, conditional QTL analysis provides an excellent method to explore the genetic mechanisms for quantative traits, such as FA composition, that generally contain two effects of pleiotropism and close linkage, of crops in future.
Epistasis Analysis and Underlying FA Related Candidate Genes Analysis
QTL mapping was an effective assay method for the functional study of the complex QTL in plants (Maughan et al., 1996). Besides the additive effect QTL, the epistasis interaction usually acted as an influential factor for the PV of some important agronomic traits in crops. Epistasis analysis in plants was reported decades ago and was considered as a genetic interaction at multiple loci (Richey, 1942). To date, analysis of epistatic interaction associated with some agronomic compositions has been extensively performed in rice (Yu et al., 1997), wheat (Singh et al., 2013), soybean (Lü et al., 2011), rapeseed (Li et al., 2012; Wang et al., 2015) as well as other corps. The study on epistatic effect facilitates us to understand if some QTL or genes hold the additive or epistatic effect in some specific environments, involving the case that some genes neutralize or suppress the expression of other genes. In this study, a total of 69 pairs of epistatic interaction loci were detected across three macroenvironments type (winter, semi-winter and spring). From the results we noted that the epistatic interaction pairs for the three FA compositions, C16:0, C18:3, and C20:1, all originated from the A8 and C3 linkage groups. In addition, except for one epistatic interaction pair arised from the interaction of C3 × C3 for C18:1, two epistatic interaction pairs from the interaction of A9 × C3 and one from the interaction of C3 × C3 for C22:1, the remaining interaction pairs were all obtained from the interaction between A8 and C3 for this two compositions. This centralized distribution pattern of these interaction pairs demonstrated that the epistatic interaction effect between A8 and C3 linkage groups played a predominant role in PV of FA concentration in B. napus. More investigations are needed to deepen the understanding of epistatic effect across the two linkage groups in future.
More interestingly, some special interaction pairs were repeatedly detected in multiple different microenvironments. For example, one interaction pair of EI (A8-22.8) and EI (C13-184.4) were detected in five field trials of 10DL, 11DL, 11WH, 12DL, and 12WH responsible for C18:1, C18:2, and C22:1, and for the composition of FAS, two differently distributed interaction loci of EI (A8-25.1) and EI (C13-183.5) were detected for twice in the microenvironment of 11HG and 12DL, respectively. Some interaction hotspot, such as EI (A8-22.8), EI (A8-25.1) and EI (A8-26.9), participated into the interaction process for 16, 10 and 9 times of the total 69 pairs of epistatic interaction loci, respectively. Additionally, some common epistatic interaction loci, such as EI(A8-22.8) and EI(C13-185.2) were also found in four different field compositions of 12DL, 12WH, 11DL, and 09DL for the compositions of C18:2, C18:3, C22:1, and FAS. These discoveries suggested that these epistatic loci were stably expressed and played an assignable role in the FA accumulation of acyl lipid metabolism process.
Apart from the observation of the epistatic interaction pairs, a total of 18 FA metabolism related genes were also revealed and were located near loci of epistatic interaction. The two epistatic interaction loci, EI (A8-25.9), containing two CI of 25.6–26.9, and 25.6–27.6 interacts with EI (C3-182.8) locates in the CI of 182.5-183.6 and two 3-ketoacyl coenzyme A synthase (KCS) family genes of KCS17 and KCS18, were detected in this two QTL loci. Another epistatic locus EI (A8-25.9) located in the CI of 25.6-27.6 and interacted with the locus EI (C3-177.4). The locus of EI (A8-25.9) contained two KCS genes of KCS17 and KCS18 and EI (C3-177.4) contained one long chain acyl-CoA synthetase (LACS) family gene of LACS6 and the multifunctional protein (MPF) orthologous gene MPF2. Two gene of ATTLL1 and ECI2 included locus of EI (A8-22.8) with the CI of 19.9-25.1 interacted with the locus of EI (C3-183.5) with the CI range of 182.0-184.1, which involved the gene of KCS18 and simultaneously and interacted with another locus of EI (C3-192.7) that contained the gene of KCS17. Another locus of EI (A8-22.8) located in the CI with the range of 19.9-24.1 and simultaneously interacted with two loci of EI (C5-109.9) and EI (C3-183.5) locus, the two genes ATTLL1 and ECI2 were also found in the region of EI (A8-22.8), MFP2 and AT3G07690 were revealed in the CI region of EI (C5-109.9) and KCS18 was detected in the CI region of EI (C3-183.5) locus. The two epistatic loci interaction between EI (A8-25.6) and EI (C3-184.4) were also found and two genes of KCS17 and KCS18 were revealed in these two regions. The last gene involving epistatic interaction pair of EI (A8-23.6) and EI (A3-112.4) was found and two gene pairs of KCS17, KCS18, and AT4G16155, HSD3 were discovered in each region.
It is noteworthy that despite KCS17 and KCS18 participated in the most epistatic interaction with other gene (Table S3), while in the analysis result of network interaction KCS18 just directly interacted with one epistatic gene of HSD3 only, and KCS17, similar with ATTLL1, actually did not participate into the network interaction (Figure 4). Among the 18 epistatic candidates, two pairs only existed on direct interaction in the network, except for the interaction pair of KCS18 and HSD3, the other were the pair of ECI2 (IBR10) and MFP2. These results indicated that the weak epistatic interaction effect might exist among this epistasis participated genes for the FA accumulation during the seed development. Collectively, the result of epistasis interaction demonstrated not only the single genes and/or loci underlying the QTL but also the epistatic interactions among them that played essential roles in the processes of FA accumulation and metabolism of rapeseed.
Interaction Analysis and the Potential Metabolic Regulatory Network Provide More Deeply Knowledge for Understanding FA Metabolism in B. napus
Here, more than 13 thousand orthologous candidates of Arabidopsis underlying the CI of the unique QTL were revealed. To further study the genetic mechanism of FA metabolism, 61 acyl lipid metabolism related that were elicited and a complex and interrelated network was constructed. The interaction network showed that some candidates predominantly interacted with others. For example, the two most upstream and main node genes LACS8 and LACS9 in plastidial FA pathway closely interacted with two genes of AIM1 and MFP2, both of them were the main candidates within β-Oxidation process. Additionally, 15 plastidial FA were involved and 8 of β-Oxidation involved genes were also processed in the close interaction with each other, respectively. The two processes of TAG synthesis and β-Oxidation contained the close relationship, mainly mediated by the gene of SDP1, which belonged to TAG degradation pathway. Intriguingly, except for the candidate of KCS18, the remaining eight genes within FA elongation process were relatively independent from other pathway related genes (Figure 4).
In this study, a pyruvate initiated metabolic pathway of FA was constructed, which gave a legible and intuitional direction for the exploration of the genetic mechanism of FA metabolism in B. napus. 47 out of the 61 FA related genes were positioned in the pathway. Generally, marker density and genome coverage level of the genetic map affect the sensitivity of QTL detection (Asíns, 2002) and eventually determine the accuracy of identification of candidate genes. To the best of our knowledge, the majority of the 61 candidates (41 out of 61) were localized for the first time in B. napus of our study (Smooker et al., 2011; Wang et al., 2015; Qu et al., 2017). Fifteen plastid FA biosynthesis involved in orthologous were revealed, seven of which were new localization, containing CAC1, ACP4, LIP1, LTA2, SDRD, LACS8, and AT4G16155 and were wholly located in seven linkage groups of A3, A6, A9, A10, C2, C3, and C7. Ten potential candidates were detected related to the FA elongation. In addition to the three pleiotropic genes of KCS17, KCS18 and KCR1, the other seven genes were all new revelation, relevant to six KCS family genes of KCS1/3/4/9/19/20 and a 3-hydroxyacyl-CoA dehydratase of PAS2 and overall distributed into four linkage groups of A6, A9, C2 and C8. 26 potential candidates were detected here related to the TAG synthesis and degradation, except for the five genes of OLE1, GPDHC1, LPAT5, MAGL13 and AT5G18640, the remaining were the novel localization through our QTL mapping analysis compared to the previous studies (Smooker et al., 2011; Wang et al., 2015; Qu et al., 2017). Furthermore, four FA β-Oxidation involved genes were also detected: the gene AIM1 locating into ucqLA-A6-1, gene DCI1 into ucqALA-A9-5, MFP2 into two QTL of ucqFAS-C3-1 and ucqFAS-C5-2 with negative additive effect, and the gene ECI2 into three QTL of ucqALA-A8-2, ucqOA-A8-2 and ucqLA-A8-3. Two genes, PCAT4 and TGD2 involved in the lipid trafficking process and were not been found in previous QTL mapping analysis of rapeseed, were detected in our study and were located into the consensus QTL of ucqFAS-C2-7, ucqALA-C2-4, ucqFAS-C2-3, ucqALA-C2-3, and ucqALA-C5-5 (Table S5).
Although diverse structural genes that functioned in the complex and hierarchical FA metabolic process were revealed, some regulatory factors, such as WRI1, LEC1, LEC2, also played essential role in the metabolic pathway. For example, WRI1 controlled various genes involving the FA biosynthesis and simultaneously acted downstream of LEC2 (Baud et al., 2007, 2010), it also activated another regulator of PII to modulate the FA composition in seeds of Arabidopsis thaliana (Baud et al., 2010). The two transcriptional activators LEC1 and LEC2 served as the key regulator in the FA biosynthesis process with multiple functional roles. Through interaction with the other regulators of FUS3 and ABI3, LEC1 affected seed maturation (Kagaya et al., 2005; To et al., 2006) as well as extensively affected the seed storage, oil production content in seeds and embryo development (Lotan et al., 1998; Mu et al., 2008; Tan et al., 2011). Similar with LEC1, LEC2 was also correlated to the lipid accumulation and seed maturation (Kim et al., 2015). Surprisingly, these important regulators mentioned above were revealed in CI of the detected QTL in our study. This may result from the possibility that the PV of FA composition in our DH population might not be preferably caused by any transcription factors but the genes directly related to lipid metabolism.
In summary, numerous key genes involve in acyl lipid metabolism were discovered underlying the CI of the QTL detected in our DH population and provided clues for FA metabolism pattern in B. napus. Although the more complicated FA and oil biosynthesis in rapeseed than in Arabidopsis, with the in-depth research, especially the study of the marker-assisted gene mapping, the genetic basis of FA biosynthesis process will become more and more clear.
Conclusion
In the present study, we implemented FA compositions related QTL mapping and identified and analyzed candidate genes based on a high density linkage map in B. napus. A lot of stable, environmental specific as well as many novel QTL were detected. Unconditional and conditional QTL analysis revealed numerous genetic variations and demonstrated the complicated genetic basis of FA metabolism. Through comparative genomic analysis, dozens of acyl lipid metabolism related potential candidates were detected and were positioned to a finely constructed FA metabolism pathway and interaction network of B. napus. Taken together, this study gave a more profound understanding for genetic basis of acyl-lipid metabolism in B. napus and provided a valuable guidance for breeding program of rapeseed in future.
Author Contributions
BB and HC carried out the data analysis and wrote the manuscript. HW and WZ participated in the field experiment. LZ, NR, XW and BW made helpful suggestions to the manuscript. HJ and ML designed, led and coordinated the overall study.
Conflict of Interest Statement
The authors declare that the research was conducted in the absence of any commercial or financial relationships that could be construed as a potential conflict of interest.
Acknowledgments
The work was supported by National Basic Research Program of China (2015CB150205), National Natural Science Foundation of China (31671721) and the New Century Talents Support Program of the Ministry of Education of China (NCET110172).
Supplementary Material
The Supplementary Material for this article can be found online at: https://www.frontiersin.org/articles/10.3389/fpls.2018.01018/full#supplementary-material
Figure S1. Distribution frequency of the three types QTL (identified, consensus and unique) within the entire genome of B. napus in KN DH population. The histogram shows the distribution frequency of QTL that located in each linkage groups and the table exhibits the concrete number of the QTL for each linkage groups.
Figure S2. Overlapping region of the identified QTL hotspots for the eight FA traits on chromosome A8 and C3. The original identified QTL for different traits are showed by colored curves with respective likelihood value above the line of the linkage group (top). The colored curves from the bottom shows the additive effect value for the corresponding QTL above. The threshold equates to the likelihood value of 3.2. Different color indicates different traits and the different form of these lines indicates the different breeding environments.
Table S1. Pearson correlation analysis result for FA trait pairs in the KN DH population. The symbol “–” represents the missed correlation coefficient attributed to the simultaneously measured concentration data for the two traits. The symbol “**” represents the significance level at p < 0.01.
Table S2. The revealed identified QTL for each FA composition in KN DH population of this study.
Table S3. The epistatic QTL interaction pairs detected for each FA composition. EI: epistatic interaction, AA, additive × additive interaction type; SE, standard error; NO, no candidate genes were detected in epistatic region.
Table S4. The total revealed potential candidates underlying the CI of unique QTL of KN DH population.
Table S5. The screened FA metabolism related candidate genes underlying the CI of unique QTL. The candidate genes with bold indicated that they were located in the major QTL region. The involved consensus QTL in bold were the QTL with positive additive effect and the rest with the negative additive effect.
Table S6. The total identified and consensus QTL for the trait of oil content in KN DH population.
Table S7. The detected conditional identified QTL for each FA composition in KN DH population. The PA|SA indicates that the trait of SA conditioned on the trait of SA for the QTL analysis, the others are the same meaning.
Table S8. The detected conditional consensus QTL for each FA composition in KN DH population. The writing format of PA|SA indicates that the trait of SA conditioned on the trait of SA for the QTL analysis, the others are the same meaning.
Table S9. The primer pairs of the five candidates for the experiment of qPCR analysis.
Abbreviations
ATHSD3, Arabidopsis thaliana hydroxysteroid dehydrogenase 3; OLE1, Oleosin 1; ATGRP20, Arabidopsis thaliana glycine-rich protein 20; CLO4, Caleosin 4; PKL, Protein kinase like 1; SL1/2, HSI2-like 1/2; GPDHC1, Glycerol-3-phosphate dehydrogenase, NAD-dependent, C-terminal 1; ASIL1, 6B-interacting protein 1-like 1; CEK1/2, Choline/Ethanolamine Kinase1/ 2; FATB, Fatty acyl-ACP thioesterases B; ACP4, Acyl carrier protein 4; LIP1/2, Lipase1/2; CAC1/2, Chloroplastic acetyl coenzyme carbxylase 1/2; LTA2/PLE2, Plastid E2 subunit of pyruvate decarboxylase 2; FAB1/2, Fatty acid biosynthesis1/2; SDRD, Short-chain dehydrogenase/reductase isoform D; EMB3147, Embryo defective 3147; KCR1, Ketoacyl reductase 1; ATTLL1, Arabidopsis thaliana triacylglycerol lipase-like 1; SDP1, Sugar-dependent 1; DALL1/2, DAD1-like lipase 1/2; AIM1, Abnormal inflorescence meristem 1; ECI2, Enoyl-CoA hydratase/isomerase 2; DCI1, Dienoyl-CoA isomerase 1; TGD2, Trigalactosyldiacylglycerol 2; PTAC4, Plastid transcriptionally active 4; ABI3, Aba insensitive 3; LEC1/2, Leafy cotyledon1; WRI1, WRINKLED 1; AG3P (LPA), Lysophosphatidic acid; AG3PE, Diacylglycerol 3-phosphate ethanolamine; CDP-DAG, CDP- diacylglycerol; CoA, Coenzyme A; DAG, Diacylglycerol; DAG3P (PA), Phasphatidic acid; DHAP, Dihydroxyacetonephosphate; FFA, Free fatty acid; G3P, Glycerol-3-phosphate; MAG, Monoacylglycerol; PC, Phosphatidylcholine; PE, Phosphatidylethanolamine; PGP, Phosphatidyglycerophosphate; PI, Phosphoinositides; PS, Phosphatidylserine; TAG, Triacylglycerol; QTL, Quantitative trait loci; FA, Fatty acid; DH, Doubled haploid; CI, Confidence interval; PV, Phenotypic variation; PA, palmitic acid; SA, stearic acid; OA, oleic acid; LA, linoleic acid; ALA, linolenic acid; EIA, eicosenoic acid; EA, erocic acid; OC, Oil content.
References
Arcade, A., Labourdette, A., Falque, M., Mangin, B., Chardon, F., Charcosset, A., et al. (2004). BioMercator: integrating genetic maps and QTL towards discovery of candidate genes. Bioinformatics 20, 2324–2326. doi: 10.1093/bioinformatics/bth230
Asíns, M. J. (2002). Present and future of quantitative trait locus analysis in plant breeding. Plant Breed 121, 281–291. doi: 10.1046/j.1439-0523.2002.730285.x
Basnet, R. K., Del Carpio, D. P., Xiao, D., Bucher, J., Jin, M., Boyle, K., et al. (2016). A systems genetics approach identifies gene regulatory networks associated with fatty acid composition in Brassica rapa Seed. Plant Physiol. 170, 568–585. doi: 10.1104/pp.15.00853
Baud, S., and Lepiniec, L. (2009). Regulation of de novo fatty acid synthesis in maturing oilseeds of Arabidopsis. Plant Physiol. Biochem. 47, 448–455. doi: 10.1016/j.plaphy.2008.12.006
Baud, S., Bourrellier, A. B. F., Azzopardi, M., Berger, A., Dechorgnat, J., Daniel-Vedele, F., et al. (2010). PII is induced by WRINKLED1 and fine-tunes fatty acid composition in seeds of Arabidopsis thaliana. Plant J. 64, 291–303. doi: 10.1111/j.1365-313X.2010.04332
Baud, S., Guyon, V., Kronenberger, J., Wuilleme, S., Miquel, M., Caboche, M., et al. (2003). Multifunctional acetyl-CoAcarboxylase 1 is essential for very long chain fatty acid elongation and embryo development in Arabidopsis. Plant J. 33, 75–86. doi: 10.1046/j.1365-313X.2003.016010.x
Baud, S., Mendoza, M. S., To, A., Harscoet, E., Lepiniec, L., and Dubreucq, B. (2007). WRINKLED1 specifies the regulatory action of LEAFY COTYLEDON2 towards fatty acid metabolism during seed maturation in Arabidopsis. Plant J. 50, 825–838. doi: 10.1111/j.1365-313X.2007.03092.x
Beisson, F., Koo, A. J., Ruuska, S., Schwender, J., Pollard, M., Thelen, J. J., et al. (2003). Arabidopsis genes involved in acyl lipid metabolism. A 2003 census of the candidates, a study of the distribution of expressed sequence tags in organs, and a web-based database. Plant Physiol. 132, 681–697. doi: 10.1104/pp.103.022988
Burns, M. J., Barnes, S. R., Bowman, J. G., Clarke, M. H., Werner, C. P., and Kearsey, M. J. (2003). QTL analysis of an intervarietal set of substitution lines in Brassica napus: (i) Seed oil content and fatty acid composition. Heredity 90, 39–48. doi: 10.1038/sj.hdy.6800176
Chalhoub, B., Denoeud, F., Liu, S., Parkin, I. A., Tang, H., Wang, X., et al. (2014). Plant genetics. Early allopolyploid evolution in the post-Neolithic Brassica napus oilseed genome. Science 345, 950–953. doi: 10.1126/science.1253435
Chao, H., Wang, H., Wang, X., Guo, L., Gu, J., Zhao, W., et al. (2017). Genetic dissection of seed oil and protein content and identification of networks associated with oil content in Brassica napus. Sci. Rep. 7:46295. doi: 10.1038/srep46295
Chapman, M. A., and Burke, J. M. (2012). Evidence of selection on fatty acid biosynthetic genes during the evolution of cultivated sunflower. Theor. Appl. Genet.125, 897–907. doi: 10.1007/s00122-012-1881-z
Delker, C., Zolman, B. K., Miersch, O., and Wasternack, C. (2007). Jasmonate biosynthesis in Arabidopsis thaliana requires peroxisomal β-oxidation enzymes—additional proof by properties of pex6 and aim1. Phytochemistry 68, 1642–1650. doi: 10.1016/j.phytochem.2007.04.024
Eastmond, P. J., Quettier, A. L., Kroon, J. T., Craddock, C., Adams, N., and Slabas, A. R. (2010). Phosphatidic acid phosphohydrolase 1 and 2 regulate phospholipid synthesis at the endoplasmic reticulum in Arabidopsis. Plant Cell 22, 2796–2811. doi: 10.1105/tpc.109.071423
El-Soda, M., Kruijer, W., Malosetti, M., Koornneef, M., and Aarts, M. G. M. (2015). Quantitative trait loci and candidate genes underlying genotype by environment interaction in the response of Arabidopsis thaliana to drought. Plant Cell Environ. 38, 585–599. doi: 10.1111/pce.12418
Footitt, S., Slocombe, S. P., Larner, V., Kurup, S., Wu, Y. S., Larson, T., et al. (2002). Control of germination and lipid mobilization by COMATOSE, the Arabidopsis homologue of human ALDP. EMBO J. 21, 2912–2922. doi: 10.1093/emboj/cdf300
Gacek, K., Bayer, P. E., Bartkowiak-Broda, I., Szala, L., Bocianowski, J., Edwards, D., et al. (2016). Genome-wide association study of genetic control of seed fatty acid biosynthesis in Brassica napus. Front. Plant Sci. 7:2062. doi: 10.3389/fpls.2016.02062
Graham, I. A. (2008). Seed storage oil mobilization. Ann. Rev. Plant Biol. 59, 115–142. doi: 10.1146/annurev.arplant.59.032607.092938
Hu, X., Sullivan-Gilbert, M., Gupta, M., and Thompson, S. A. (2006). Mapping of the loci controlling oleic and linolenic acid contents and development of fad2 and fad3 allele-specific markers in canola (Brassica napus L.). Theor. Appl. Genet. 113, 497–507. doi: 10.1007/s00122-006-0315-1
Huang, A. H. C. (1992). Oil bodies and oleosins in seeds. Annu. Rev. Plant Phys. 43, 177–200. doi: 10.1146/annurev.pp.43.060192.001141
James, D. W. Jr., Lim, E., Keller, J., Plooy, I., Ralston, E., and Dooner, H. K. (1995). Directed tagging of the Arabidopsis FATTY-ACIDELONGATION-1 (FAE1) gene with the maize transposon activator. Plant Cell 7, 309–319. doi: 10.1105/tpc.7.3.309
Jolivet, P., Roux, E., D'Andrea, S., Davanture, M., Negroni, L., Zivy, M., et al. (2004). Protein composition of oil bodies in Arabidopsis thaliana ecotype WS. Plant Physiol. Biochem. 42, 501–509. doi: 10.1016/j.plaphy.2004.04.006
Jourdren, C., Barret, P., Horvais, R., Foisset, N., Delourme, R., and Renard, M. (1996). Identification of RAPD markers linked to the loci controlling erucic acid level in rapeseed. Mol. Breed. 2, 61–71. doi: 10.1007/BF00171352
Kagaya, Y., Okuda, R., Ban, A., Toyoshima, R., Tsutsumida, K., Usui, H., et al. (2005). Indirect ABA-dependent regulation of seed storage protein genes by FUSCA3 transcription factor in Arabidopsis. Plant Cell Physiol. 46, 300–311. doi: 10.1093/pcp/pci031
Kim, H. U., Lee, K. R., Jung, S. J., Shin, H. A., Go, Y.S., Suh, M.C., et al. (2015). Senescence-inducible LEC2 enhances triacylglycerol accumulation in leaves without negatively affecting plant growth. Plant Biotechnol. J. 13. 1346–1359. doi: 10.1111/pbi.12354
Kimber, D. S., and Mcgregor, D. I. (1995). “The species and their origin, cultivation and world production,” in Brassica Oilseeds-Production and Utilization, eds D. S. Kimber and D. I. McGregor (Oxon, UK: CAB International), 1–8.
Lardizabal, K. D., Mai, J. T., Wagner, N. W., Wyrick, A., Voelker, T., and Hawkins, D. J. (2001). DGAT2 is a new diacylglycerol acyltransferase gene family Purification, cloning, and expression in insect cells of two polypeptides from Mortierella ramanniana with diacylglycerol acyltransferase activity. J. Biol. Chem. 276, 38862–38869. doi: 10.1074/jbc.M106168200
Li, Y., Zhang, X., Ma, C., Shen, J., Chen, Q., Wang, T., et al. (2012). QTL and epistatic analyses of heterosis for seed yield and three yield component traits using molecular markers in rapeseed (Brassica napus L.). Genetika 48, 1171–1178. doi: 10.1134/S1022795412050146
Li, Z. K., Luo, L. J., Mei, H. W., Wang, D. L., Shu, Q. Y., Tabien, R., et al. (2001). Overdominant epistatic loci are the primary genetic basis of inbreeding depression and heterosis in rice. I. Biomass and grain yield. Genetics 158, 1737–1753.
Li-Beisson, Y., Shorrosh, B., Beisson, F., Andersson, M. X., Arondel, V., Bates, P. D., et al. (2013). Acyl-Lipid Metabolism. Arabidopsis Book Am. Soc. Plant Biolog. 11:e0161. doi: 10.1199/tab.0161m
Lin, M., Behal, R., and Oliver, D. J. (2003). Disruption of plE2, the gene for the E2 subunit of the plastid pyruvate dehydrogenase complex, in Arabidopsis causes an early embryo lethal phenotype. Plant Mol. Biol. 52, 865–872. doi: 10.1023/A:1025076805902
Lotan, T., Ohto, M., Yee, K. M., West, M. A., Lo, R., Kwong, R. W., et al. (1998). Arabidopsis LEAFY COTYLEDON1 is sufficient to induce embryo development in vegetative cells. Cell 93, 1195–1205.
Lü, H. Y., Liu, X. F., Wei, S. P., and Zhang, Y. M. (2011). Epistatic association mapping in homozygous crop cultivars. PLoS ONE 6:e17773. doi: 10.1371/journal.pone.0017773
Malosetti, M., Ribaut, J. M., and van Eeuwijk, F. A. (2013). The statistical analysis of multienvironment data: modeling genotype-by-environment interaction and its genetic basis. Front. Physiol. 4:4. doi: 10.3389/fphys.2013.00044
Maughan, P. J., Maroof, M. S., and Buss, G. R. (1996). Molecular-marker analysis of seed-weight: genomic locations, gene action, and evidence for orthologous evolution among three legume species. Theor. Appl. Genet. 93, 574–579. doi: 10.1007/BF00417950
Mika, V., Koprna, R., and Kucera, V. (2003). Fast prediction of quality parameters in whole seeds of oilseed rape (brassica napus). Plant Soil Environ. 49, 141–145.
Mu, J., Tan, H., Zheng, Q., Fu, F., Liang, Y., Zhang, J., et al. (2008). LEAFY COTYLEDON1 is a key regulator of fatty acid biosynthesis in Arabidopsis. Plant Physiol. 148,1042–1054. doi: 10.1104/pp.108.126342
Okuley, J., Lightner, J., Feldmann, K., Yadav, N., Lark, E., and Browse, J. (1994). Arabidopsis FAD2 gene encodes the enzyme that is essential for polyunsaturated lipid synthesis. Plant Cell. 6, 147–158. doi: 10.1105/tpc.6.1.147
Parkin, I. A., Sharpe, A. G., and Lydiate, D. J. (2003). Patterns of genome duplication within the Brassica napus genome. Genome 46, 291–303. doi: 10.1139/g03-006
Qiu, D., Morgan, C., Shi, J., Long, Y., Liu, J., Li, R., et al. (2006). A comparative linkage map of oilseed rape and its use for QTL analysis of seed oil and erucic acid content. Theor. Appl. Genet. 114, 67–80. doi: 10.1007/s00122-006-0411-2
Qu, C., Jia, L., Fu, F., Huiyan, Z., Kun, L., Lijuan, W., et al. (2017). Genome-wide association mapping and Identification of candidate genes for fatty acid composition in Brassica napus L. using SNP markers. BMC Genomics. 18:232. doi: 10.1186/s12864-017-3607-8
Quan, S., Yang, P. F., Cassin-Ross, H., Kaur, N., Switzenberg, R., Aung, K., et al. (2013). Proteome Analysis of Peroxisomes from Etiolated Arabidopsis Seedlings Identifies a Peroxisomal Protease Involved in b-Oxidation and Development. Plant Physiol. 163, 1518–1538. doi: 10.1104/pp.113.223453
Richey, F. D. (1942). Mock-Dominance and Hybrid Vigor. Science. 96, 280–281. doi: 10.1126/science.96.2490.280
Scheffler, J. A., Sharpe, A. G., Schmidt, H., Sperling, P., Parkin, I. A. P., Luhs, W., et al. (1997). Desaturase multi gene families of Brassica napus arose through genome duplication. Theor. Appl. Genet. 94, 583–591. doi: 10.1007/s001220050454
Schierholt, A., Becker, H. C., and Ecke, W. (2000). Mapping a high oleic acid mutation in winter oilseed rape (Brassica napus L.). Theor. Appl. Genet. 101, 897–901. doi: 10.1007/s001220051559
Shannon, P., Markiel, A., Ozier, O., Baliga, N. S., Wang, J. T., Ramage, D., et al. (2003). Cytoscape: a software environment for integrated models of biomolecular interaction networks. Genome Res. 13:2498–2504. doi: 10.1101/gr.1239303
Shi, J., Lang, C., Wang, F., Wu, X., Liu, R., Zheng, T., et al. (2017). Depressed expression of FAE1 and FAD2 genes modifies fatty acid profiles and storage compounds accumulation in Brassica napus seeds. Plant Sci. 263, 177–182 doi: 10.1016/j.plantsci.2017.07.014
Shi, J., Li, R., Qiu, D., Jiang, C., Long, Y., Morgan, C., et al. (2009). Unraveling the complex trait of crop yield with quantitative trait loci mapping in Brassica napus. Genetics 182, 851–861. doi: 10.1534/genetics.109.101642
Si, P., Mailer, R. J., and Galwey, N. (2003). Influence of genotype and environment on oil and protein concentrations of canola (Brassica napus L.) grown across southern Austr. Crop Pasture Sci. 54, 397–407. doi: 10.1071/AR01203
Singh, A., Knox, R. E., DePauw, R. M., Singh, A. K., Cuthbert, R. D., Campbell, H. L., et al. (2013). Identification and mapping in spring wheat of genetic factors controlling stem rust resistance and the study of their epistatic interactions across multiple environments. Theor. Appl. Genet. 126, 1951–1964. doi: 10.1007/s00122-013-2109-6
Smooker, A. M., Wells, R., Morgan, C., Beaudoin, F., Cho, K., Fraser, F., et al. (2011). The identification and mapping of candidate genes and QTL involved in the fatty acid desaturation pathway in Brassica napus. Theor. Appl. Genet. 122, 1075–1090. doi: 10.1007/s00122-010-1512-5
Sourdille, P., Snape, J. W., Cadalen, T., Charmet, G., Nakata, N., Bernard, S., et al. (2000). Detection of QTL for heading time and photoperiod response in wheat using a doubled-haploid population. Genome 43, 487–494. doi: 10.1139/g00-013
Tan, H., Yang, X., Zhang, F., Zheng, X., Qu, C., Mu, J., et al. (2011). Enhanced Seed Oil Production in Canola by Conditional Expression of Brassica napus LEAFY COTYLEDON1 and LEC1-LIKE in Developing Seeds. Plant Physiol. 156, 1577–1588. doi: 10.1104/pp.111.175000
To, A., Valon, C., Savino, G., Guilleminot, J., Devic, M., Giraudat, J., et al. (2006). A network of local and redundant gene regulation governs Arabidopsis seed maturation. Plant Cell 18, 1642–1651. doi: 10.1105/tpc.105.039925
Velasco, L., and Becker, H. C. (1998). Estimating the fatty acid composition of the oil in intact-seed rapeseed (Brassica napus L.) by near-infrared reflectance spectros-copy. Euphytica 101, 221–230. doi: 10.1023/A:101835870
Wan, H., Chen, L., Guo, J., Li, Q., Wen, J., Yi, B., et al. (2017). Genome-Wide Association Study Reveals the Genetic Architecture Underlying Salt Tolerance-Related Traits in Rapeseed (Brassica napus L.). Front. Plant Sci. 8:593. doi: 10.3389/fpls.2017.00593
Wang, X., Long, Y., Yin, Y., Zhang, C., Gan, L., Liu, L., et al. (2015). New insight into the genetic networks affecting seed fatty concentrations in Brassica napus. BMC Plant Biol. 15:91. doi: 10.1186/s12870-015-0475-8
Wen, Y. X., and Zhu, J. (2005). Multivariable conditional analysis for complex trait and its components. Acta Genet. Sin. 32, 289–296.
Yan, X. Y., Li, J. N., Wang, R., Jin, M. Y., Chen, L., Qian, W., et al. (2011). Mapping of QTL controlling content of fatty acid composition in rapeseed (Brassica napus). Genes Genomics 33, 365–371. doi: 10.1007/s13258-010-0149-8
Yang, Q., Fan, C., Guo, Z., Qin, J., Wu, J., Li, Q., et al. (2012). Identification of FAD2 and FAD3 genes in Brassica napus genome and development of allele-specific markers for high oleic and low linolenic acid contents. Theor. Appl. Genet. 125, 715–729. doi: 10.1007/s00122-012-1863-1
Yu, S. B., Li, J. X., Xu, C. G., Tan, Y. F., Gao, Y. J., Li, X. H., et al. (1997). Importance of Epistasis as the Genetic Basis of Heterosis in an Elite Rice Hybrid. Proc. Natl. Acad. Sci. U.S.A. 94. 9226–9231.
Zhao, J., Becker, H. C., Zhang, D., Zhang, Y., and Ecke, W. (2006). Conditional QTL mapping of oil content in rapeseed with respect to protein content and traits related to plant development and grain yield. Theor. Appl. Genet. 113, 33–38. doi: 10.1007/s00122-006-0267-5
Zhao, J., Dimov, Z., Becker, H. C., Ecke, W., and Möllers, C. (2008). Mapping QTL controlling fatty acid composition in a doubled haploid rapeseed population segregating for oil content. Mol. Breed. 21, 115–125. doi: 10.1007/s11032-007-9113-y
Keywords: Brassica napus, fatty acid, QTL mapping, acyl lipid metabolism, genetic dissection
Citation: Bao B, Chao H, Wang H, Zhao W, Zhang L, Raboanatahiry N, Wang X, Wang B, Jia H and Li M (2018) Stable, Environmental Specific and Novel QTL Identification as Well as Genetic Dissection of Fatty Acid Metabolism in Brassica napus. Front. Plant Sci. 9:1018. doi: 10.3389/fpls.2018.01018
Received: 06 March 2018; Accepted: 22 June 2018;
Published: 17 July 2018.
Edited by:
Laurent Gentzbittel, National Polytechnic Institute of Toulouse, FranceReviewed by:
Yan Long, Chinese Academy of Agricultural Sciences, ChinaLiezhao Liu, College of Agronomy and Biotechnology, Southwest University, China
Copyright © 2018 Bao, Chao, Wang, Zhao, Zhang, Raboanatahiry, Wang, Wang, Jia and Li. This is an open-access article distributed under the terms of the Creative Commons Attribution License (CC BY). The use, distribution or reproduction in other forums is permitted, provided the original author(s) and the copyright owner(s) are credited and that the original publication in this journal is cited, in accordance with accepted academic practice. No use, distribution or reproduction is permitted which does not comply with these terms.
*Correspondence: Haibo Jia, haibo.jia@hust.edu.cn
Maoteng Li, limaoteng426@mail.hust.edu.cn
†These authors have contributed equally to this work.