 Huan Wang
 Rong Zhu
 Jia Zhang
 Leyi Ni1
- 1Donghu Experimental Station of Lake Ecosystems, State Key Laboratory of Freshwater Ecology and Biotechnology of China, Institute of Hydrobiology, Chinese Academy of Sciences, Wuhan, China
- 2University of Chinese Academy of Sciences, Beijing, China
- 3State Key Laboratory of Plateau Ecology and Agriculture, Qinghai University, Xining, China
The occurrence of algal blooms in drinking water sources and recreational water bodies have been increasing and causing severe environmental problems worldwide, particularly when blooms dominated by Microcystis spp. Bloom prediction and early warning mechanisms are becoming increasingly important for preventing harmful algal blooms in freshwater ecosystems. Chlorophyll fluorescence parameters (CFpars) have been widely used to evaluate growth scope and photosynthetic efficiency of phytoplankton. According to our 2-year monthly monitor datasets in Lake Erhai, a simple but convenient method was established to predict Microcystis blooms and algal cell densities based on a CFpar representing maximal photochemical quantum yield of Photosystems II (PSII) of algae. Generalized linear mixed models, used to identify the key factors related to the phytoplankton biomass in Lake Erhai, showed significant correlations between Chl a concentration and both the light attenuation coefficient and water temperature. We fitted seasonal trends of CFpars (Fv/Fm and ΔF/Fm′) and algal cell densities into the trigonometric regression to predict their seasonal variations and the autocorrelation function was applied to calculate the time lag between them. We found that the time lag only existed between Fv/Fm from blue channel and algal cell densities even both Fv/Fm and ΔF/Fm′ show the significant non-linear dynamics relationships with algal cell densities. The peak values of total algal cell density, cyanobacteria density and Microcystis density followed the foregoing peak value of Fv/Fm from blue channel with a time lagged around 40 days. Therefore, we could predict the possibilities of Microcystis bloom and estimate the algal cell densities in Lake Erhai ahead of 40 days based on the trends of Fv/Fm values from blue channel. The results from our study implies that the corresponding critical thresholds between Fv/Fm value and bloom occurrence, which might give new insight into prediction of cyanobacteria blooms and provide a convenient and efficient way for establishment of early warning of cyanobacteria bloom in eutrophic aquatic ecosystems.
Introduction
Harmful algal blooms (HABs) in freshwater ecosystems are subject of serious concern for ecosystems and human health because they reduce the quality and quantity of habitat for plants and animals, disrupt food web dynamics, create hypoxic zones, and produce toxins (Paerl et al., 2001; Miller et al., 2017). Changing environmental conditions like drought, increased water temperature and low water levels (Paerl et al., 2001; de Figueiredo et al., 2004; Qin et al., 2010; Watson et al., 2017), can increase the intensity and frequency of algal blooms. Further, through its effects on regional and local climatic patterns, climate change is also modifying patterns of HAB (Michalak et al., 2013). Therefore, predicting the HABs has become increasingly important for environmental and public health management.
Many efforts and resources have been devoted to forecasting algal blooms using mathematical modeling through quantitive indicators and environmental drivers. One of the most extensively applied models of predicting blooms are the parametric models (Wong et al., 2007; Gill et al., 2017). For example, the Baltic Operational Oceanographic System (BOOS) is a real-time oceanic observation system combining ecological forecast models for algal bloom in Baltic sea with annual water forecasts for the Baltic sea1. Artificial neural networks (ANNs) provide an alternative to parametric forecast models, where several environmental factors act as input variables to estimate the evolution of algal bloom and predict cell densities of freshwater phytoplankton species (Recknagel et al., 1997; Lee et al., 2003; Muttil and Chau, 2006). Statistical methods such as cross-correlation (Trimbee and Prepas, 1987), and generalized additive model (Lamon et al., 1996; Tao et al., 2012), as well as the development of satellite remote sensing forecasting techniques (Stumpf, 2001; Kutser, 2004), are also other possible options for predicting the occurrence of HAB. Despite having good predictive accuracy, all these methods have the major drawback of being time and labor consuming as well as complex in their calculation. Accuracy of these methods also rely on selecting a suitable set of parameters and models according to different lake conditions, nutrient status, and different local meteorological and hydrological conditions. Hence, previous studies have highlighted the need for simple, rapid, and geographically non-restricted approaches to predict algae blooms.
All the methods mentioned above are based on the relationships between algal growth and environmental factors, but rarely use physiological parameters of algae for bloom prediction. Chlorophyll fluorescence parameters (CFpars), Fv/Fm and ΔF/Fm′, can be considered as the main indicators for assessment of the photosystem II efficiency and for the photosynthetic capacity of algae (Misra et al., 2012). The fluorescence ratio Fv/Fm refers to the photosynthetic activity and is taken as an algae viability assessment. Similarly,ΔF/Fm′ reflects the actual physiological activity of PS II (Genty et al., 1990). Previous studies have shown that both Fv/Fm and ΔF/Fm′ respond to changes of environmental factors such as nutrients and light intensity and are directly related to the growth of algae (Boyd et al., 1999; Misra et al., 2012; Shi et al., 2016). Therefore, the use of these CFpars may be suitable candidates for simple predictions of algal blooms. To this end, pulse amplitude modulated (PAM) fluorometry is a promising analytical technique that measures the photochemical efficiency of photosystem II in phytoplankton; one of the most common, non-invasive and rapid existing indicators of the viability condition of phytoplankton in a sample irrespective of their size (Schreiber et al., 1995b; White et al., 2011; Kalaji et al., 2014, 2017). Furthermore, Phyto-PAM fluorometry procedure can distinguish the ratios of fluorescence yields of cyanobacteria, green algae and diatoms/dinoflagellates and output as different channels (blue channel, green channel and brown channel, respectively) (Dorigo and Leboulanger, 2001; Schmitt-Jansen and Altenburger, 2008). In the case of cyanobacteria (blue channel), almost no Chl fluorescence is excited by blue light (470 nm), while excitation at 645 nm is particularly strong due to phycocyanin and allophycocyanin absorption.
Highland lakes are distinctive unique ecosystems because they are subjected to extreme environmental conditions, such as strong radiation, low water temperature, relatively low nutrient conditions, and relatively simple food webs with low species abundance (Tolotti et al., 2006). As a result, these lakes have low buffering capacity and are very sensitive to climate change and other anthropogenic influences (Psenner and Schmidt, 1992; Psenner, 2002). Therefore, this sensitivity and responsiveness of the phytoplankton community in plateau lakes to external environmental stress makes them an ideal system for the purpose of this study. Highland lakes are also increasingly exposed to human activity globally. Common impacts include wastewater discharge from farmlands and households, fish introduction, transport and tourism pollution. These impacts are generating increased eutrophication, disappearance of aquatic vegetation, and algae blooms highland aquatic ecosystems (Tolotti et al., 2006; Huang et al., 2014). Notwithstanding these unfolding environmental problems, few studies have examined bloom forecast in highland lakes.
Lake Erhai, a typical high altitude lake in the Chinese Yunnan Province, has suffered increasingly frequent cyanobacterial blooms despite the relative lower nutrients and higher illumination characteristic of highland lakes compared to lowland lakes (Xu, 1996; Paerl et al., 2011). These responses are difficult to model explicitly according to conventional models based on quantitive indicators and environmental drivers. Before 1970s, Lake Erhai was an oligotrophic lake (Jin et al., 2005). Since the 80s, however, the lake has been affected by man-made eutrophication resulting from the growing resident population (Jin et al., 2005). This situation exacerbated after the 90s, as district population and human activities continued to increase, resulting in frequent cyanobacterial blooms (Wu and Wang, 1999). Large scale Anabaena-dominated cyanobacterial bloom firstly appeared during the summer of 1996 (Dong, 1999). However, the dominant cyanobacterial species during summer shifted to Microcystis after 2008 (Wen and Ma, 2011; Wei et al., 2012), coincident with an increase in bloom frequency and intensity. Here, we explore the potential for using multiwavelength Phyto-PAM fluorometry as a simple early warning forecast method for Microcystis blooms based on field data collected monthly over 2 years, with a focus on predictive performance and methodological constraints. Our research should give new insight into prediction of cyanobacteria blooms and provide a convenient and efficient way for the establishment of early warning systems of cyanobacterial blooms in eutrophic aquatic ecosystems.
Materials and Methods
Study Site and Sampling Method
Data presented in this study correspond to a 2-year (June 2013–May 2015) field survey conducted in Lake Erhai (25°36′–25°58′ N, 100°05′–100°17′ E), the second largest high-altitude freshwater lake of the Yunnan Highlands in China with the normal elevation is 1974 m, to trace algal dynamics and Microcystis bloom. Water samples were taken monthly from three water depths (surface, middle, and bottom) at seven sites (Figure 1), then pooled for the measurement of physicochemical parameters, physiological indicators, and algal densities at each site. The water samples were stored in transparent glass bottles of 2.5 L and kept bottles half full. After sampling was completed (within 5 h), we measured the CFpars and physicochemical parameters immediately in the laboratory.
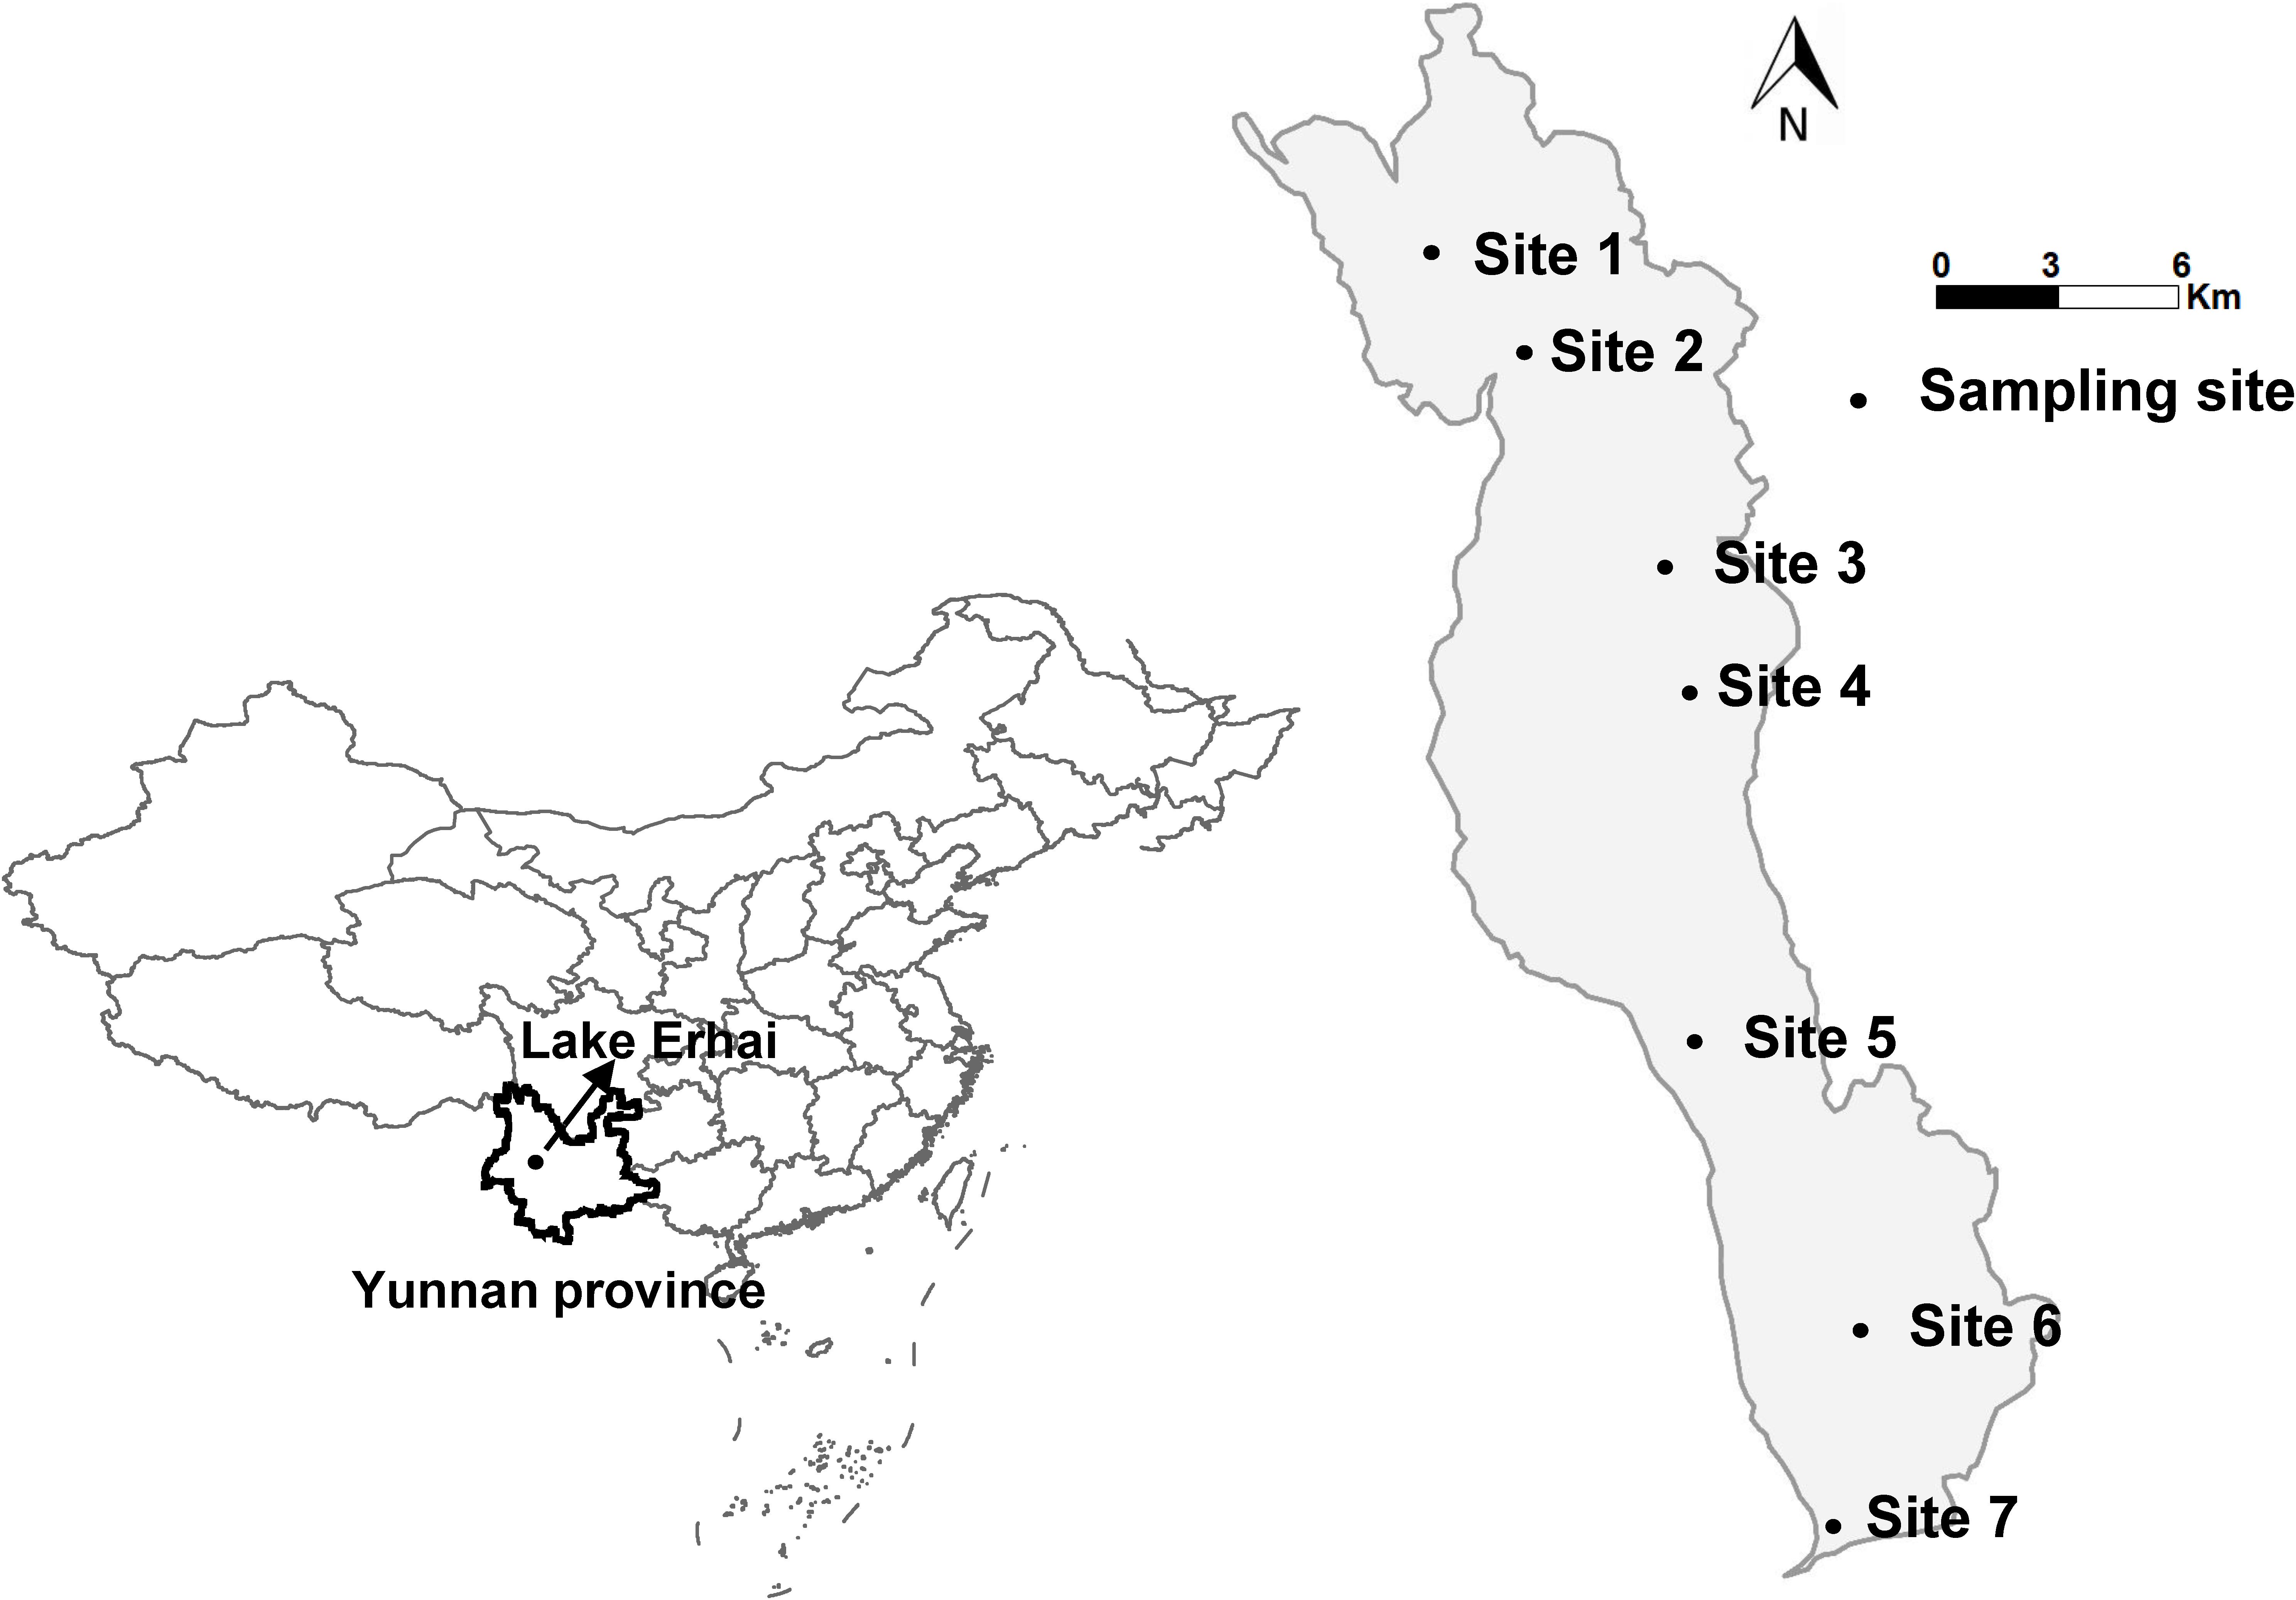
FIGURE 1. A map of Lake Erhai with the location of the sampling sites.
Identification of Phytoplankton
One-L water samples were immobilized by 1% Lugol’s iodine solution and concentrated to 50 ml by a siphon after sedimentation for 48 h in Utermhol chambers to analyze the phytoplankton composition (Huang et al., 1999). Concentrated samples (0.1 ml) were thereafter counted and measured under 400× magnification using an Olympus microscope (Olympus BX21, Tokyo, Japan) after mixing. Colonial Microcystis cells were separated using an ultrasonic device (JY88-II, Scientiz, Ningbo, Zhejiang, China) and their constituent cells counted. Taxonomic identification of the phytoplankton species was performed according to Hu and Wei (Hu, 2006).
Measurements of Physicochemical Parameters
All samples for nutrient and chlorophyll a determination were stored in the portable refrigerator (0°C) in the field and analyzed immediately upon returning to the laboratory. Samples for total phosphorus (TP), dissolved total phosphorus (DTP), dissolved inorganic phosphorus (DIP), total nitrogen (TN), nitrate (), ammonium (), and chlorophyll a (Chl a) concentrations were analyzed following standard preservation and analytical procedures of the Water Environment Federation (Association et al., 1915). The concentrations of Chl a was determined by spectroradiometer (SHIMADZU UV-2550, Japan) after appropriate aliquots (200–1000 ml) were filtered through Whatman GF-C glass microfiber filters and 24 h extraction in 90% acetone at 4°C in the dark. The absorbance of the processed samples was recorded at two different wavelengths (665 and 750 nm) following the protocol of Lorenzen (1967) for calculating Chl a concentration. Water temperature (T), pH value, dissolved oxygen (DO), and conductivity (COND) were measured onsite at 0.5 m below the water surface with a YSI ProPlus multiparameter water quality meter (Yellow Springs, OH, United States). The Secchi depth (SD) was assessed with a black and white Secchi disk (20 cm in diameter) to determine water transparency. PAR was measured at water depths of 0, 0.5, 1.0, 1.5, and 2.0 m using an underwater radiation sensor (UWQ-8342) connected to a data logger (Li-1400; Li-Cor Company, Lincoln, NE, United States). Light attenuation coefficient of water column (K) was calculated based on the equation: Id = Is(1-K)/K, where Id and Is are irradiance at the corresponding water depth and water surface, respectively (Duarte et al., 1986).
Measurements Chlorophyll Fluorescence Parameters
A Phyto-PAM (PHYTO-PAM Phytoplankton Analyzer, Heinz Walz GMBH, Effeltrich, Germany) was used to measure the maximum quantum yield [Fv/Fm = (Fm – F0)/Fm] and the effective quantum yield [ΔF/Fm′ = (Fm′ – F0′)/Fm′] (Kühl et al., 2001). PAM fluorometry sensors estimate photosynthetic activity by comparing fluorescence yield of PSII under ambient irradiance (F) and after application of a saturating pulse (Fm) (Bilger et al., 1995; Schreiber et al., 1995a; Schreiber, 2004). F0 and Fm are the minimum and maximum fluorescence of a dark-adapted sample during a saturating light pulse, respectively. Similarly, F0′ and Fm′ are the minimum and maximum fluorescence of a light-adapted sample during a saturating light pulse. Because emission wavelengths (peaking at 470, 520, 645, and 665 nm) do not correspond to the peak wavelengths of absorption of the relevant pigments, the deconvolution procedure requires the ratios of fluorescence yields of cyanobacteria, green algae, and diatoms/dinoflagellates to show pronounced differences upon excitation with these wavelengths.
Statistics and Inferences
The analytical process is schematically shown in Figure 2. Generalized linear mixed models (GLMMs) (Bolker et al., 2009) were used to detect the key environment drivers (i.e., light, temperature, and nutrient) correlated to phytoplankton biomass (Chl a) during the period of field monitoring. In present study, we used Chl a as a measure of algal biomass according to previous studies in both freshwater and marine ecosystems (Carlson, 1977; Barlow et al., 1993; Schlüter et al., 2000; Chen et al., 2003). Sampling site within the lake was introduced as a random effect in the model to avoid pseudoreplication by introducing correlation among species (Hurlbert, 1984). The random effects might also account for some unknown factors that influence the phytoplankton biomass in the lake, such as differences in flow velocity and nutrient concentration among sampling sites. Variables of environment drivers were transformed using square root to normalize the data for analysis.
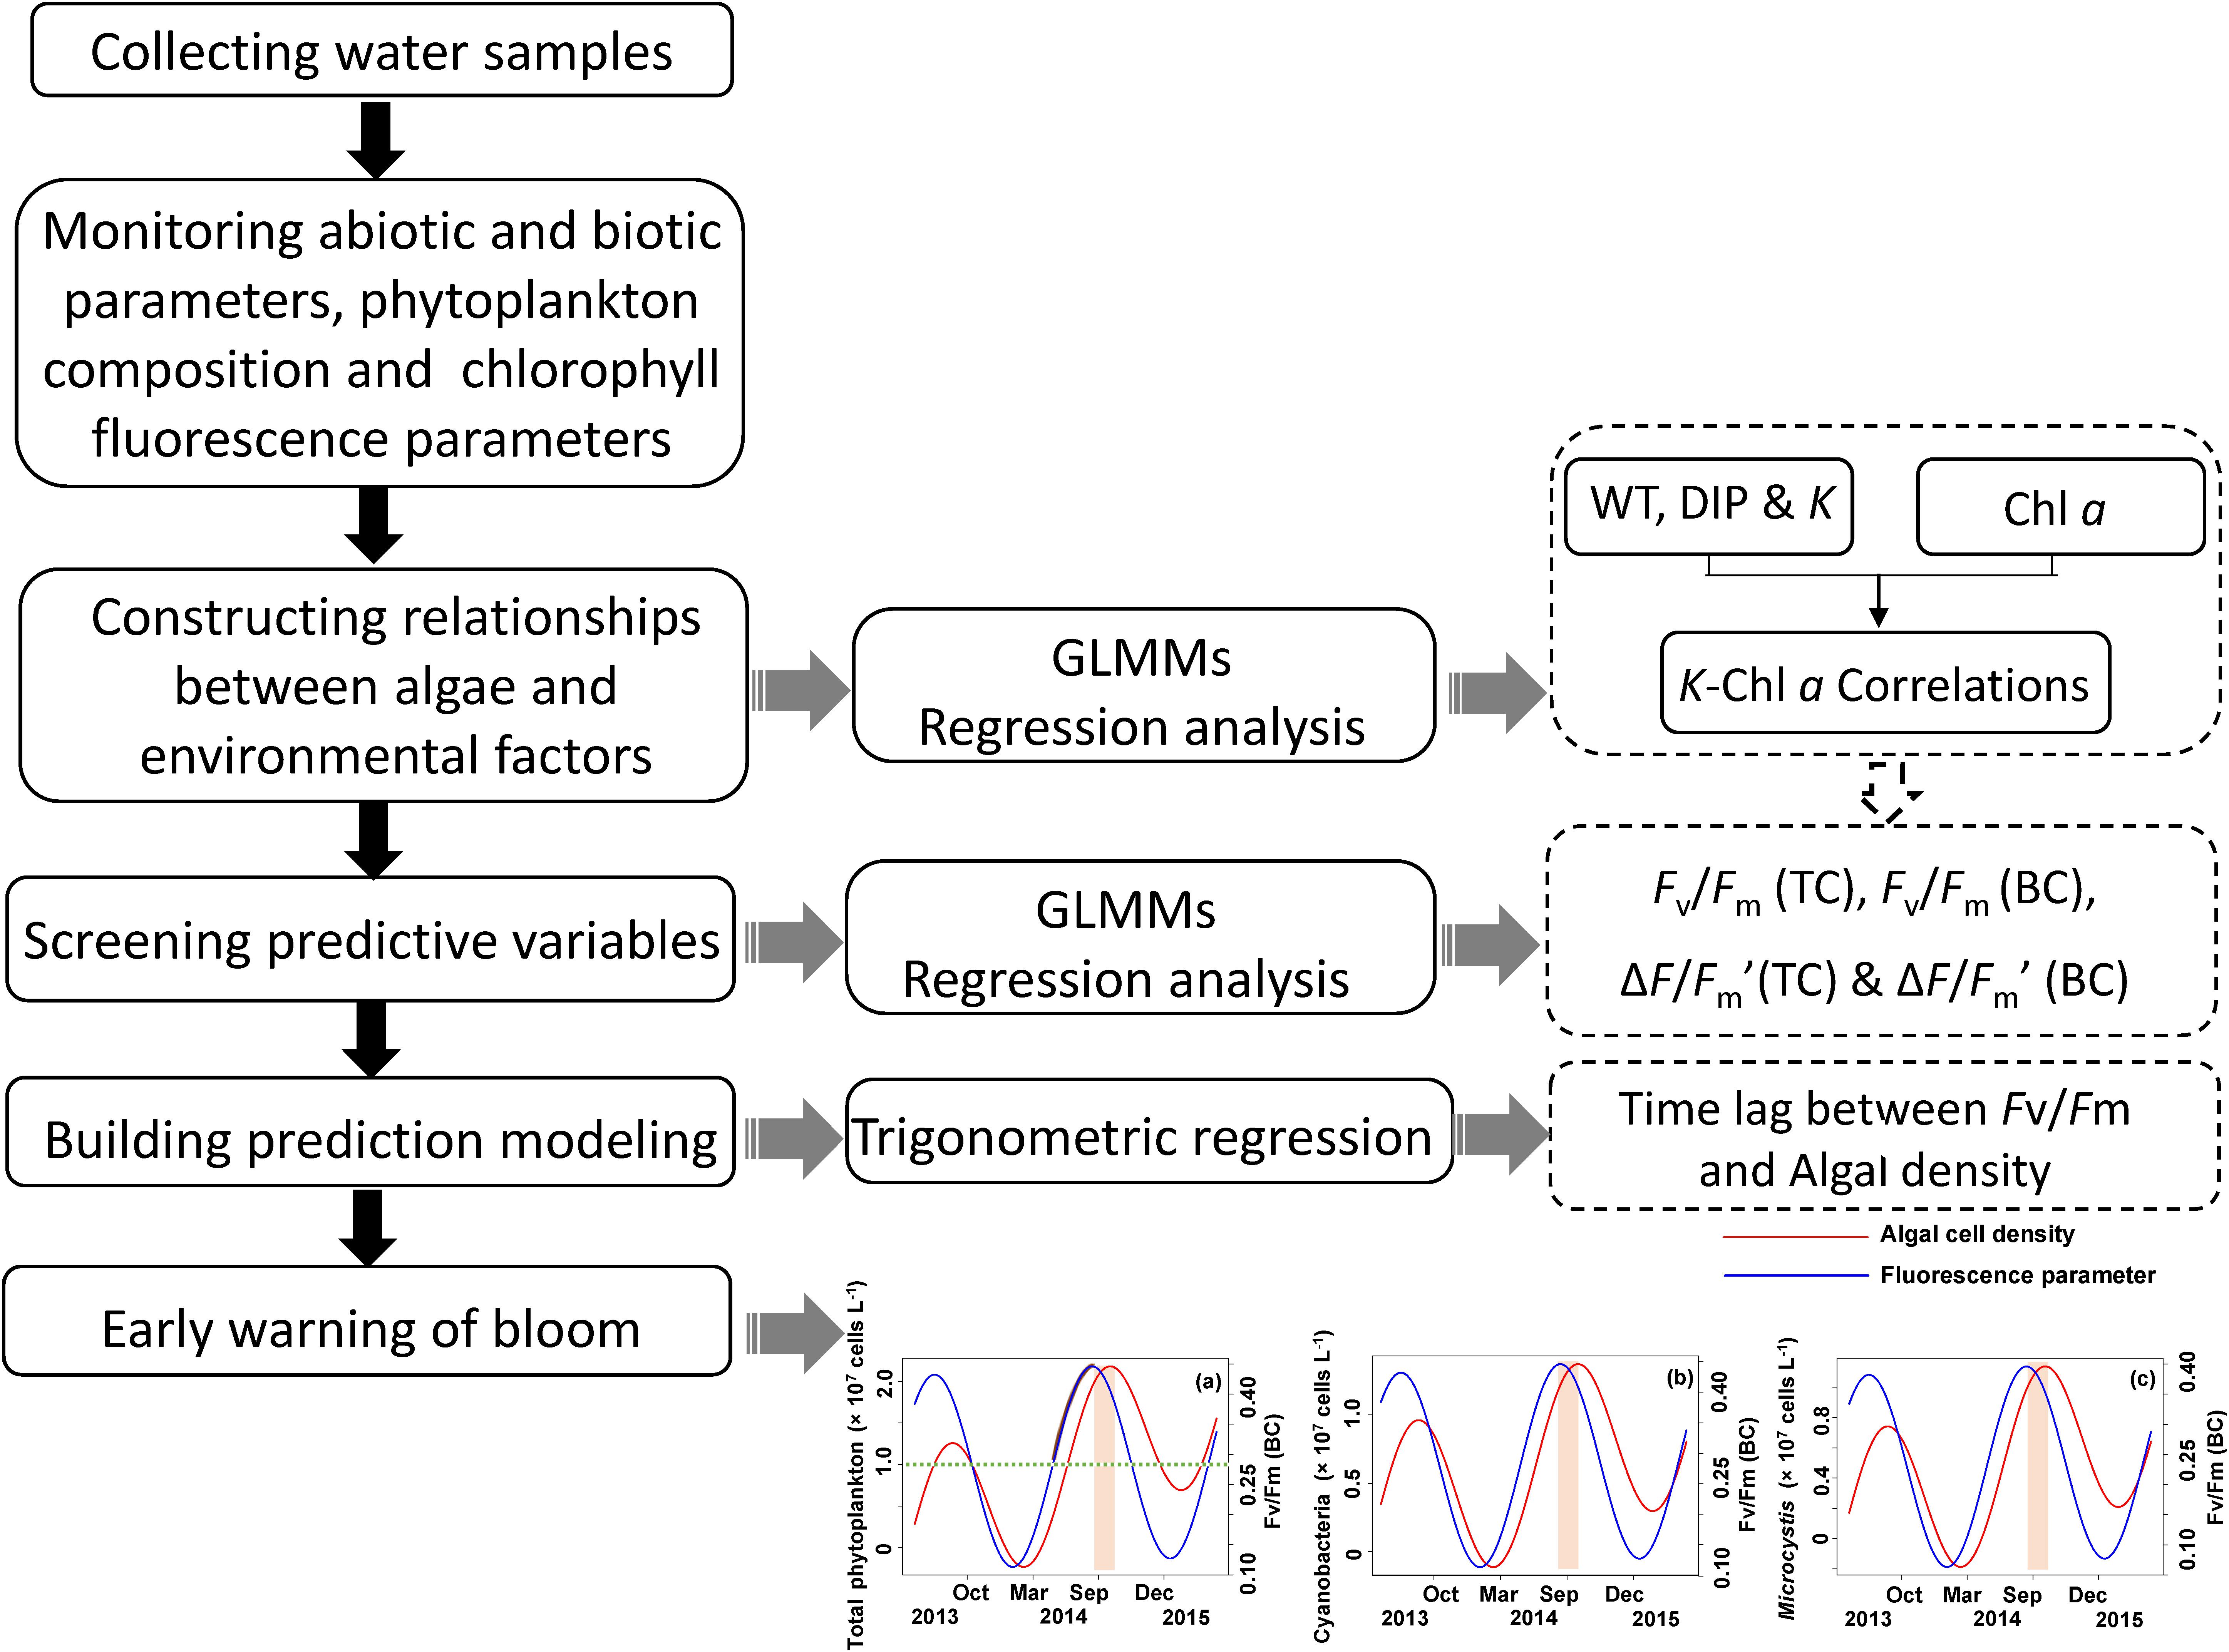
FIGURE 2. Technique flow diagram of the application of method early warning the algal cell density and Microcystis bloom by measuring chlorophyll fluorescence Fv/Fm (BC).
Generalized linear mixed models (Bolker et al., 2009) was also used to test whether CFpars can predict algae density or biomass. The total phytoplankton cell density (Ct), cyanobacteria cell density (Cc), and Microcystis cell density (Cm) were used as response variables. The Fv/Fm from total channel [Fv/Fm (TC)], Fv/Fm from blue channel [Fv/Fm (BC)], ΔF/Fm′ from total channel [ΔF/Fm′ (TC)] and ΔF/Fm′ from blue channel [ΔF/Fm′ (BC)] were used as predictor variables. Site effects were also incorporated as random effect in these models.
Informed by the results from the GLMMs, we built a bloom prediction model by fitting a seasonal trigonometric regression to each cell density parameter (Ct, Cc, and Cm) and the values of Fv/Fm and ΔF/Fm′ according to the following equation (Pollock, 2000):
Where y is cell densities (Ct, Cc, or Cm) or Fv/Fm or ΔF/Fm′, x is time (month), β0 is the intercept and β1 is the slope of the regression, which represent stochastic local trend components; β2 and β3 are the coefficients of the trigonometric (cyclical) seasonal components [sin(2πx) and cos(2πx)]. The error term is represented by ε. The values of x and y were selected at random for running the trigonometric regressions and Each model ran 9999 times for re-randomization tests and the cross correlations between cell density and CFpars were calculated by the autocorrelation function (ACF) with associated confidence intervals at the 0.05 level. Cross-correlation values can be considered as the time lag between cell density and CFpars, which are reported as mean and standard deviation.
All statistical analyses were conducted in R 3.1.0 (R Core Team, 2014) using the packages reshape2 (Wickham, 2007), lme4 (Bates et al., 2011), and ggplot2 (Wickham, 2009).
Results
Phytoplankton Cell Densities
Our sampling campaign lasted 2 years and included two cyanobacteria bloom phases. Cyanophyta was the major phylum of phytoplankton during the whole year with 50% of total phytoplankton cell density, and Microcystis was the overwhelming dominant genus during the periods of cyanobacterial blooms with 78% of total cyanobacterial cell density (Figure 3). At specific bloom phases Microcystis reached up to 80% of all cyanobacterial cell density with the cell densities exceeding 1 × 10⁷ cells L-1, while those of cyanobacterial exceeded 1.5 × 10⁷ cells L-1 comprising 60% of all phytoplankton cell density (Figures 3A,B).
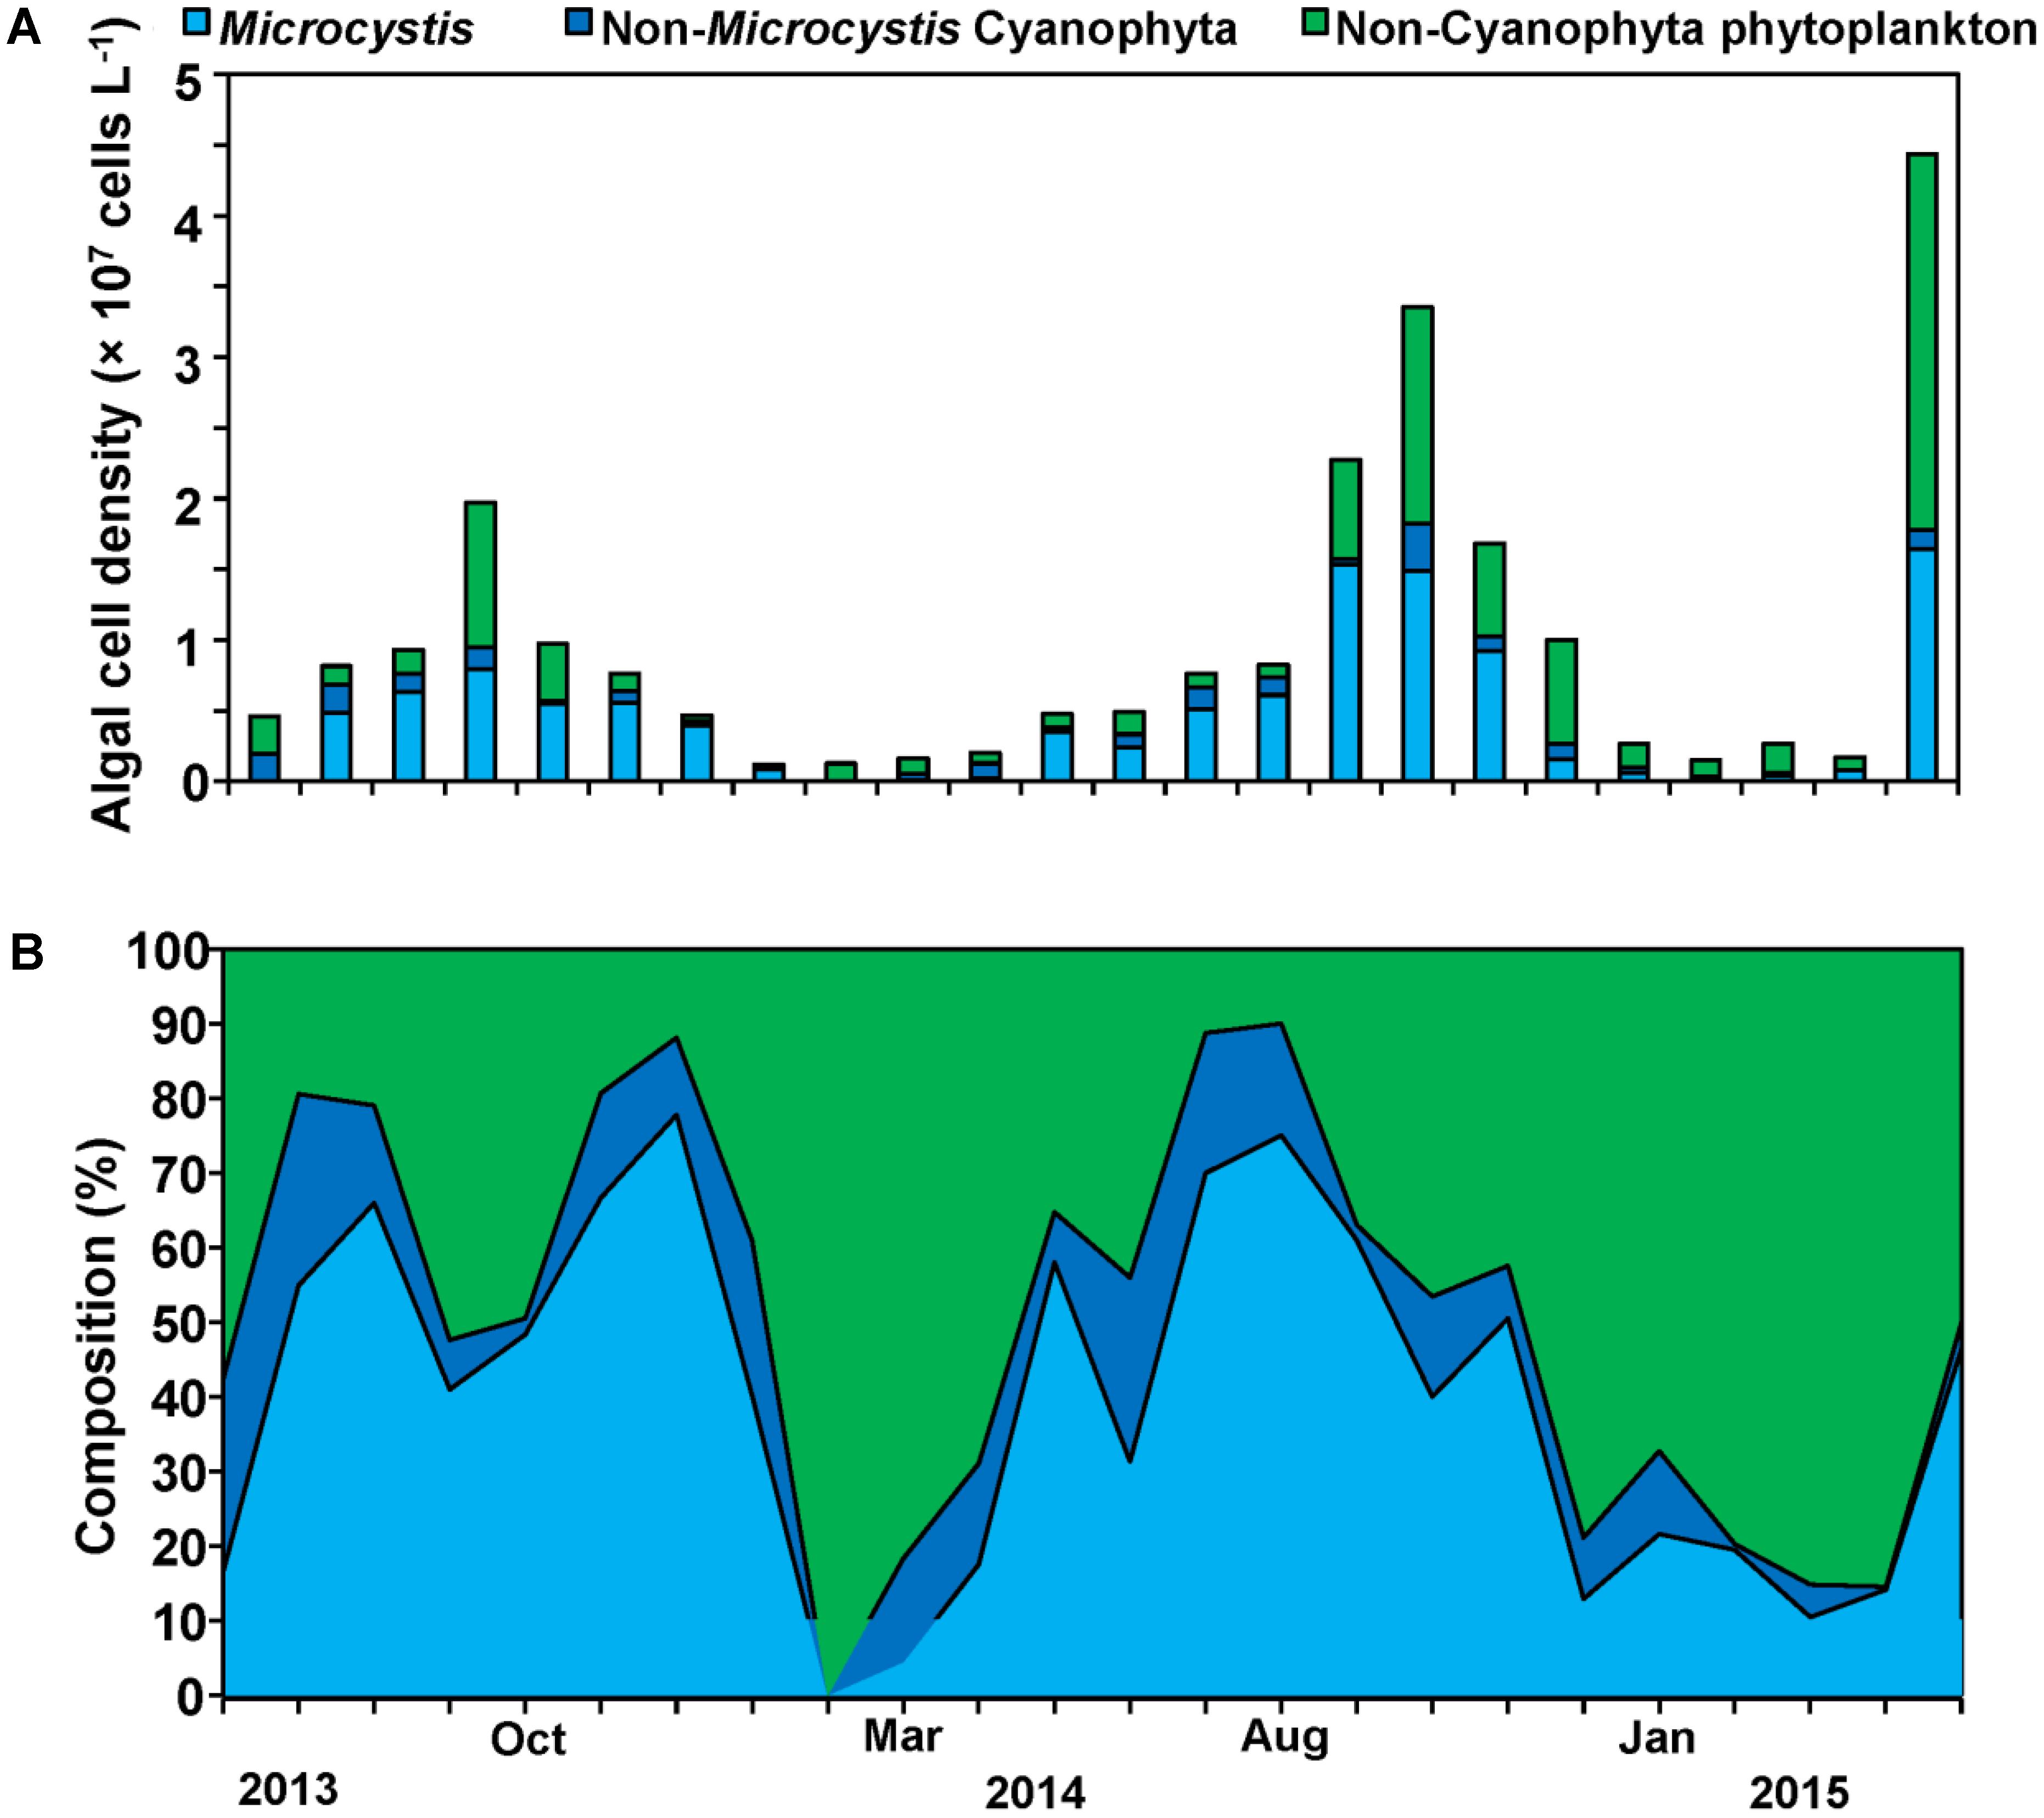
FIGURE 3. Cell density successions (A) and composition successions (B) of Microcystis, Non- Microcystis Cyanophyta and Non-Cyanophyta phytoplankton cell density.
Driving Factors of Phytoplankton Cell Densities
The mean concentration of Chl a during the sampling period (June 2013 to May 2015) was 13.33 ug/L, with a peak value exceeding 30 ug/L. Water temperature and light attenuation coefficient followed similar seasonal variations (Figure 4). The maximum level of water temperature encountered in Lake Erhai was 25.7°C, and the mean water temperature during sampling period was of 18.0°C (Figure 4C). Light attenuation coefficient showed a mean of 0.83 and a maximum of 2.49 (Figure 4D). The results from GLMMs model showed a highly significant relationship (p < 0.0001) of both water temperature and light attenuation coefficient to Chl a concentration (Figure 5). In contrast, all nutrient parameters, pH, DO, SD, and COND showed lower non-significant correlations with Chl a concentration (data not shown). The annual change of water temperature and the light attenuation coefficient in Lake Erhai, characteristic of a highland lake, and their close relationship to Chl a, suggest a potential relationship between algal cell densities, photosynthetic activity and the seasonal succession of algae, which can be predicted directly/indirectly by measuring the fluorescence parameters.
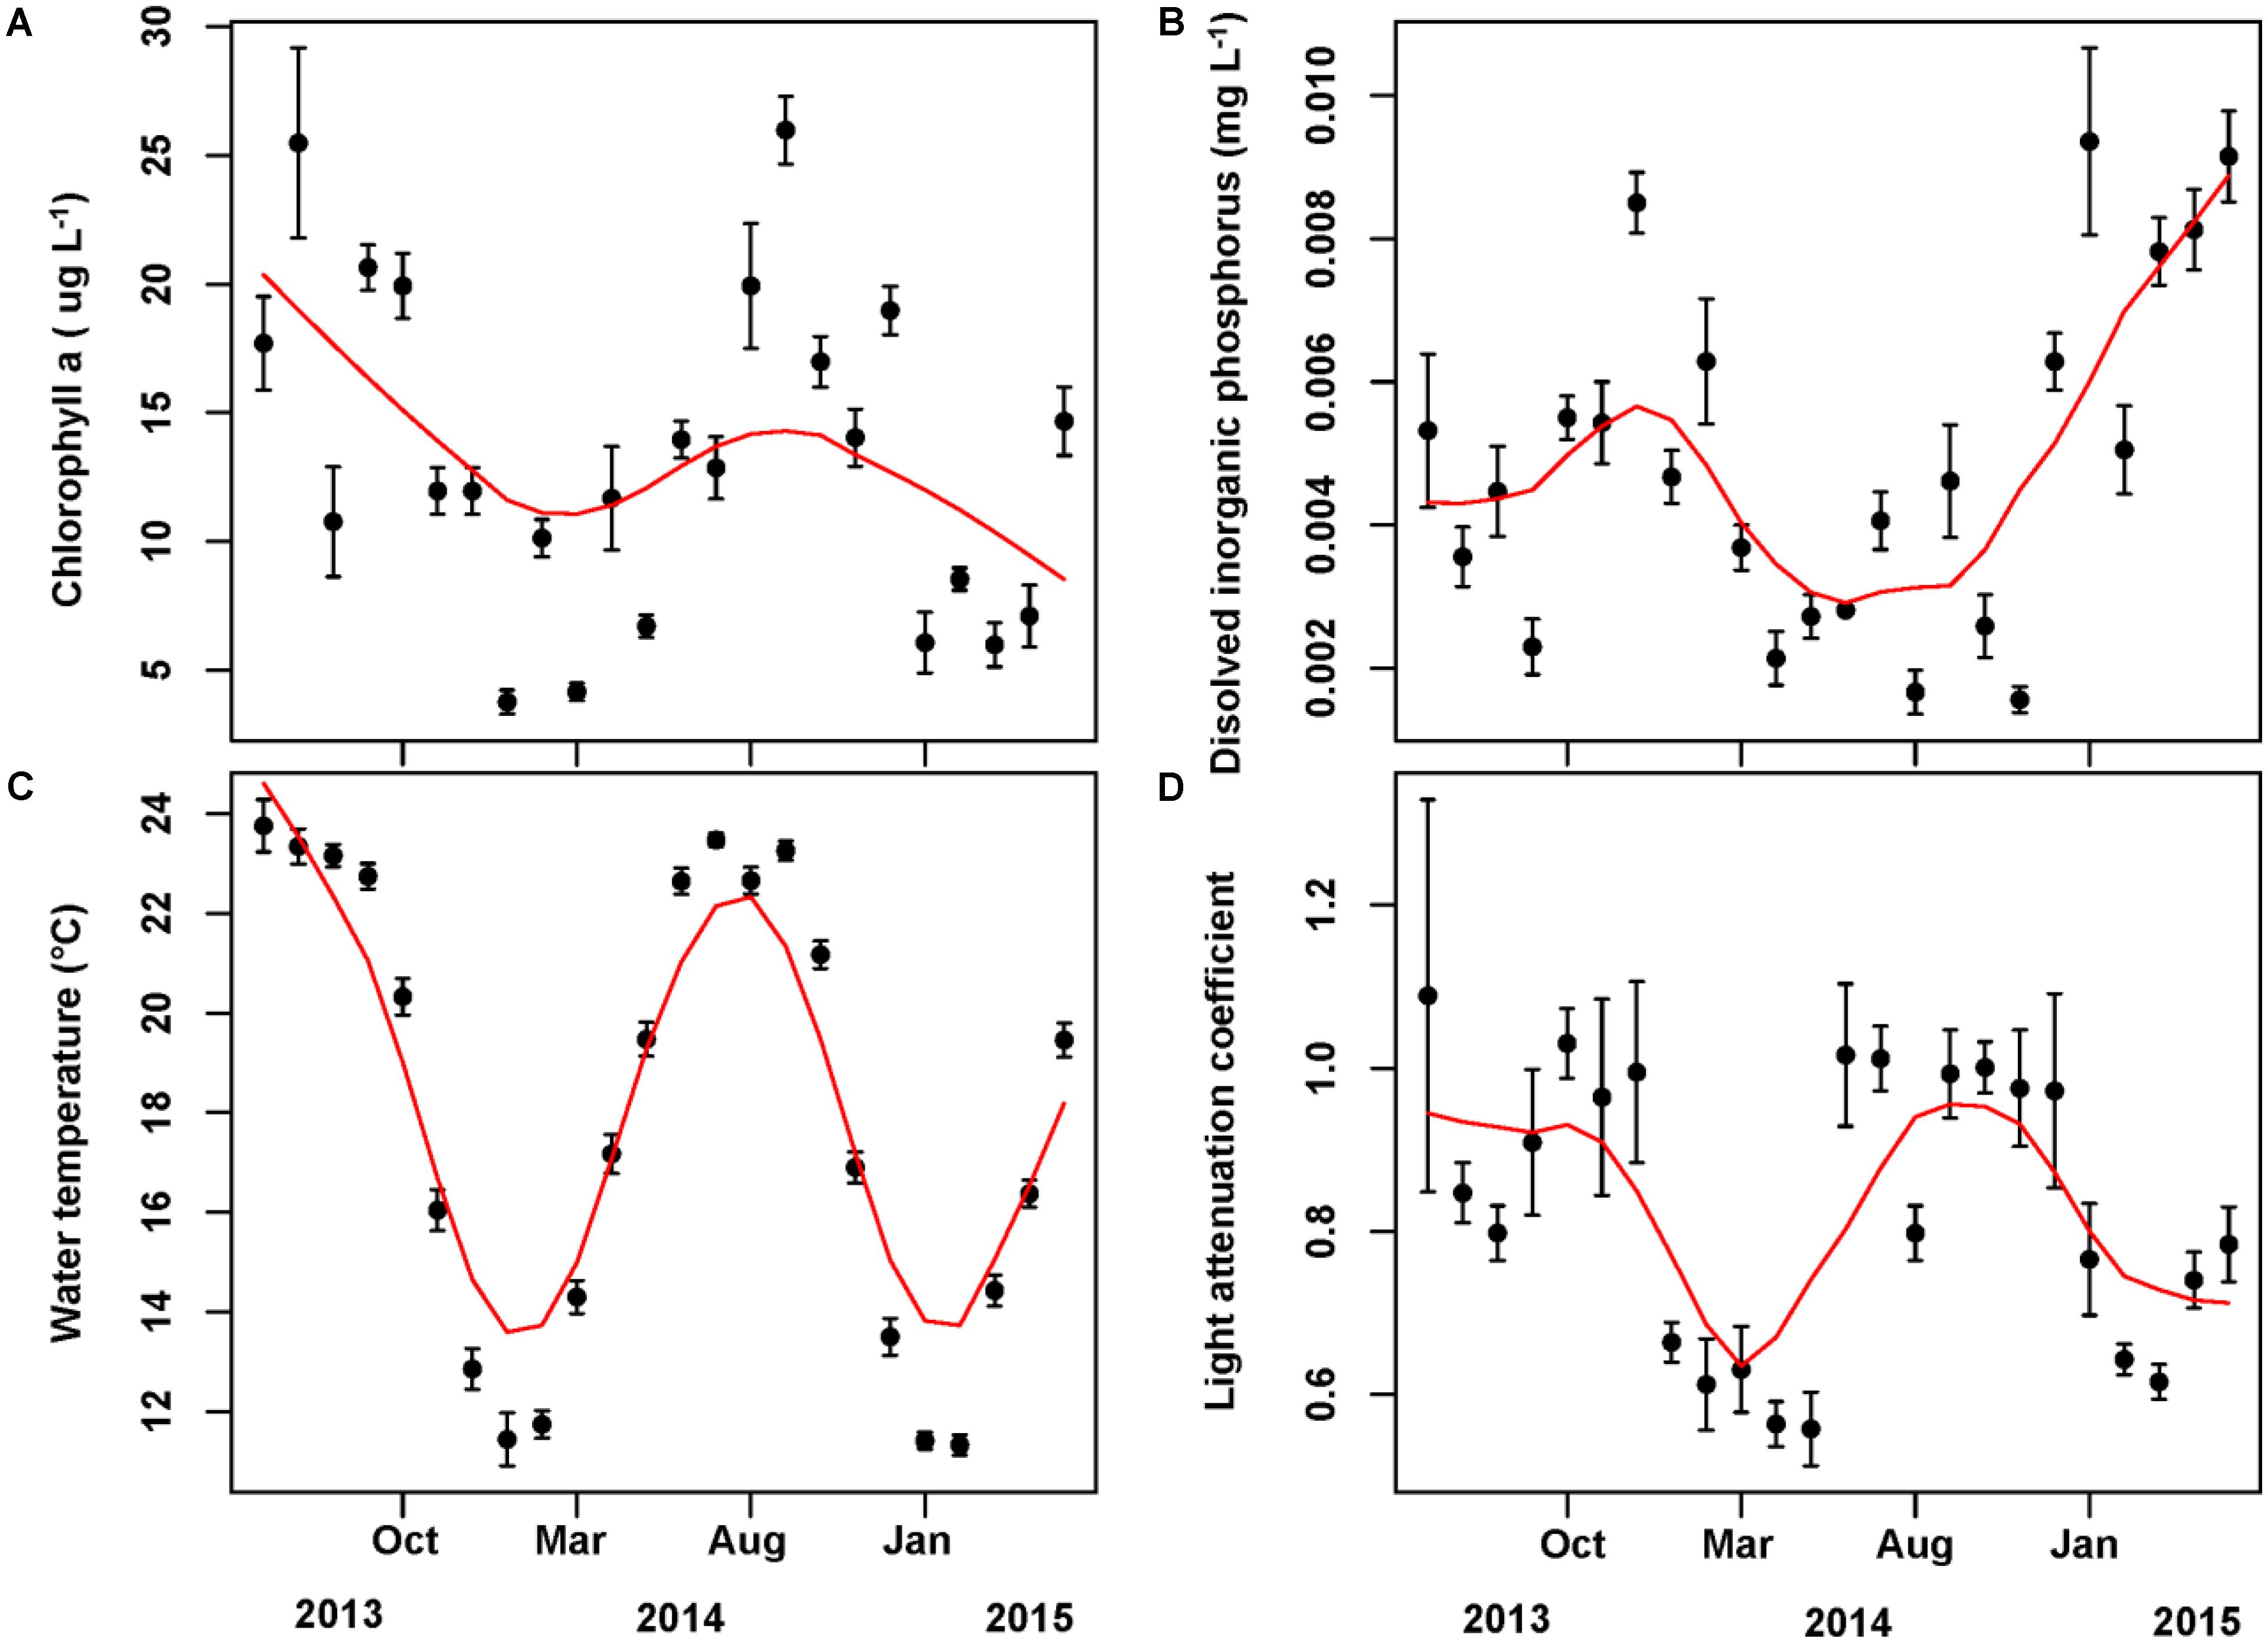
FIGURE 4. Monthly time series of Chlorophyll a (A), dissolved inorganic phosphorus (B), water temperature (C), and light attenuation coefficient (D). The mean value and associated standard deviation among sites is shown in each panel.
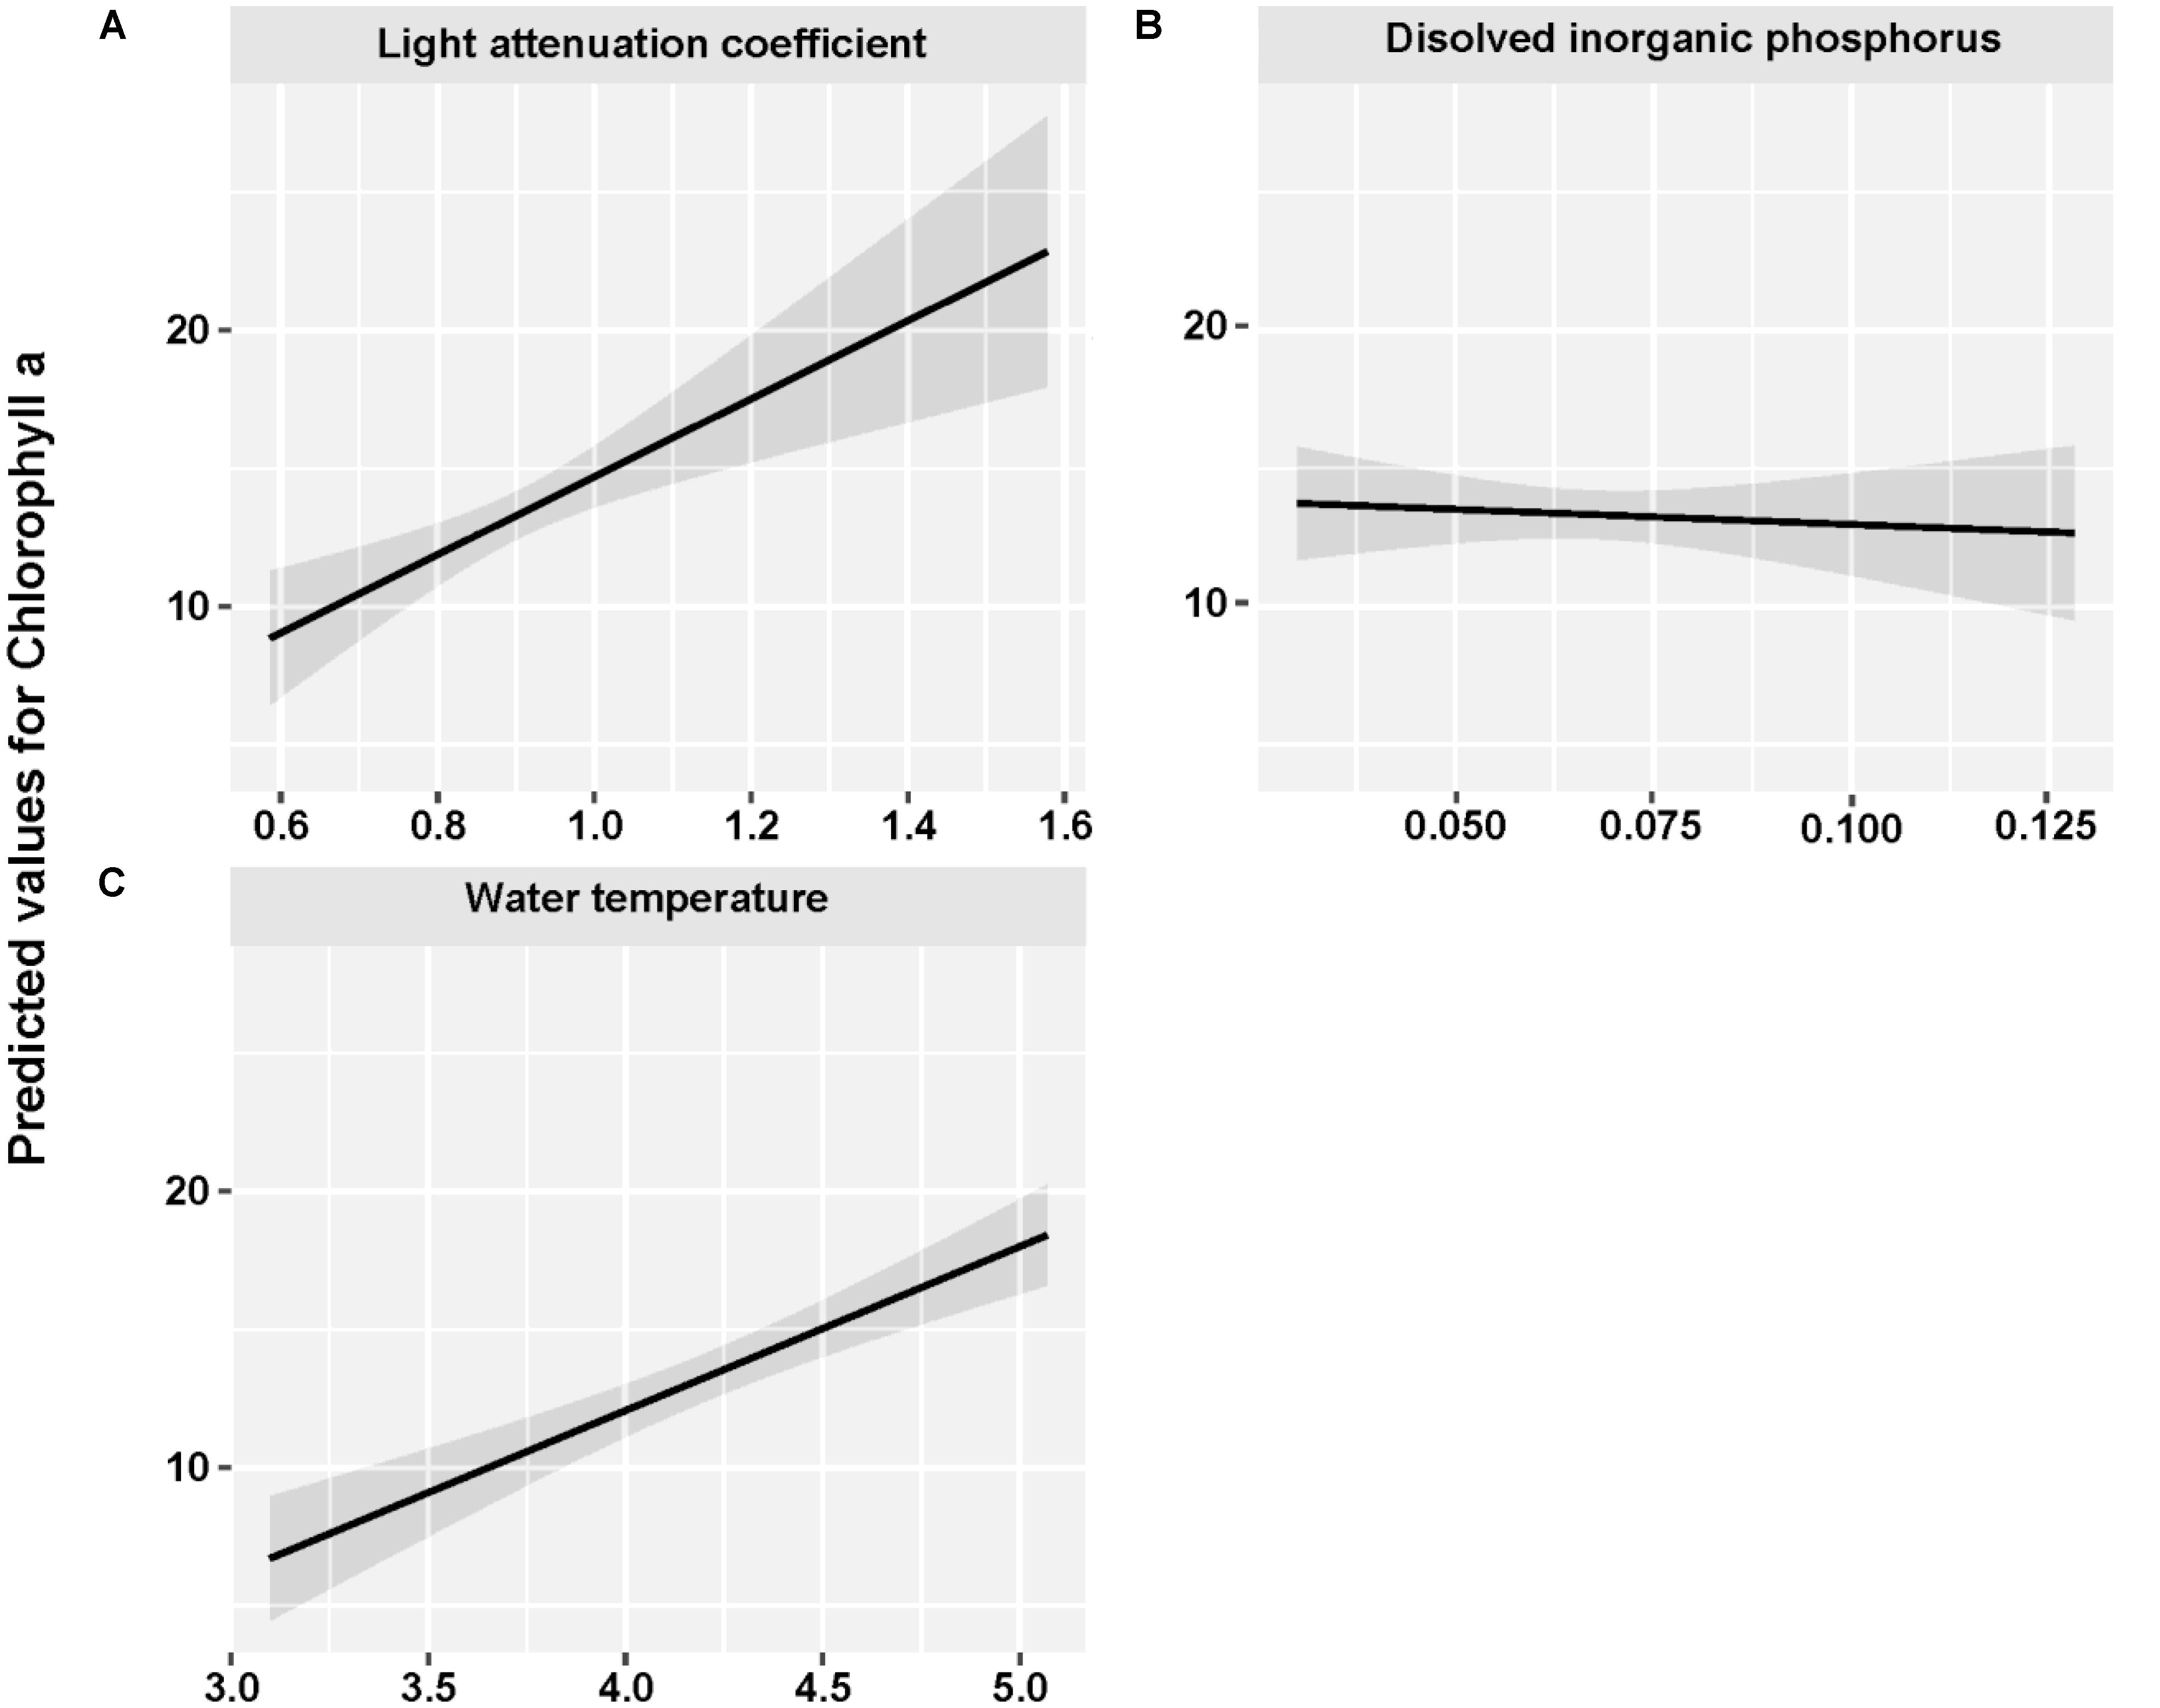
FIGURE 5. Fitted light attenuation coefficient (A), dissolved inorganic phosphorus (B), and water temperature (C) for Chlorophyll a by using GLMMs analysis.
Testing Parameters of GLMMs
To test the practicability of using the CFpars for determining the algal cell density in water columns, we used Fv/Fm (TC), Fv/Fm (BC), ΔF/Fm′ (TC), ΔF/Fm′ (BC), Ct, Cc, and Cm fitting time cycle changes of GLMMs. All parameters were significantly correlated with seasonality (p < 0.05). Further, Fv/Fm (TC), Fv/Fm (BC), and Cm were highly significantly correlated with seasonal variation (p < 0.001) (Table 1). As a result, all these parameters could be potentially selected for model creation to estimate phytoplankton cell density by fluorescence, where model prediction of algal cell density is a function of its Chlorophyll light response.
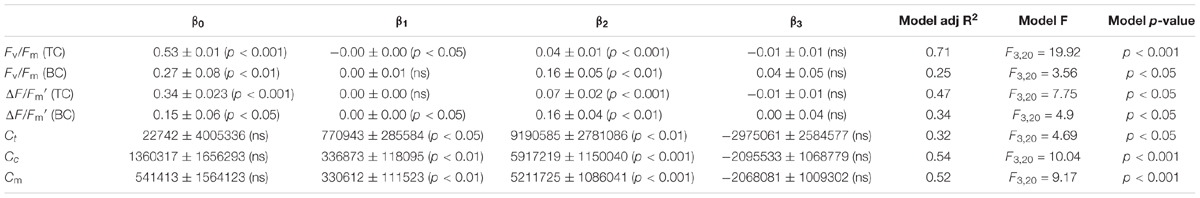
TABLE 1. Values (mean ± SD, ranges in parentheses) of Fv/Fm (TC), Fv/Fm (BC), ΔF/Fm′ (TC), ΔF/Fm′ (BC), Ct, Cc, and Cm using GLMMs with two stochastic (intercept β0 and slope β1) local trend components and two trigonometric (cyclical) seasonal components (sin β2 and cos β3 pairs).
Time Lag Between Algal Cell Density and Fluorescence Parameters
The relationship between the algal cell density and Fv/Fm or ΔF/Fm′ value was also first identified by GLMMs, then fitted using trigonometric regression. We found significant positive non-linear correlations between fluorescence parameters and cell density (Figures 6–8).
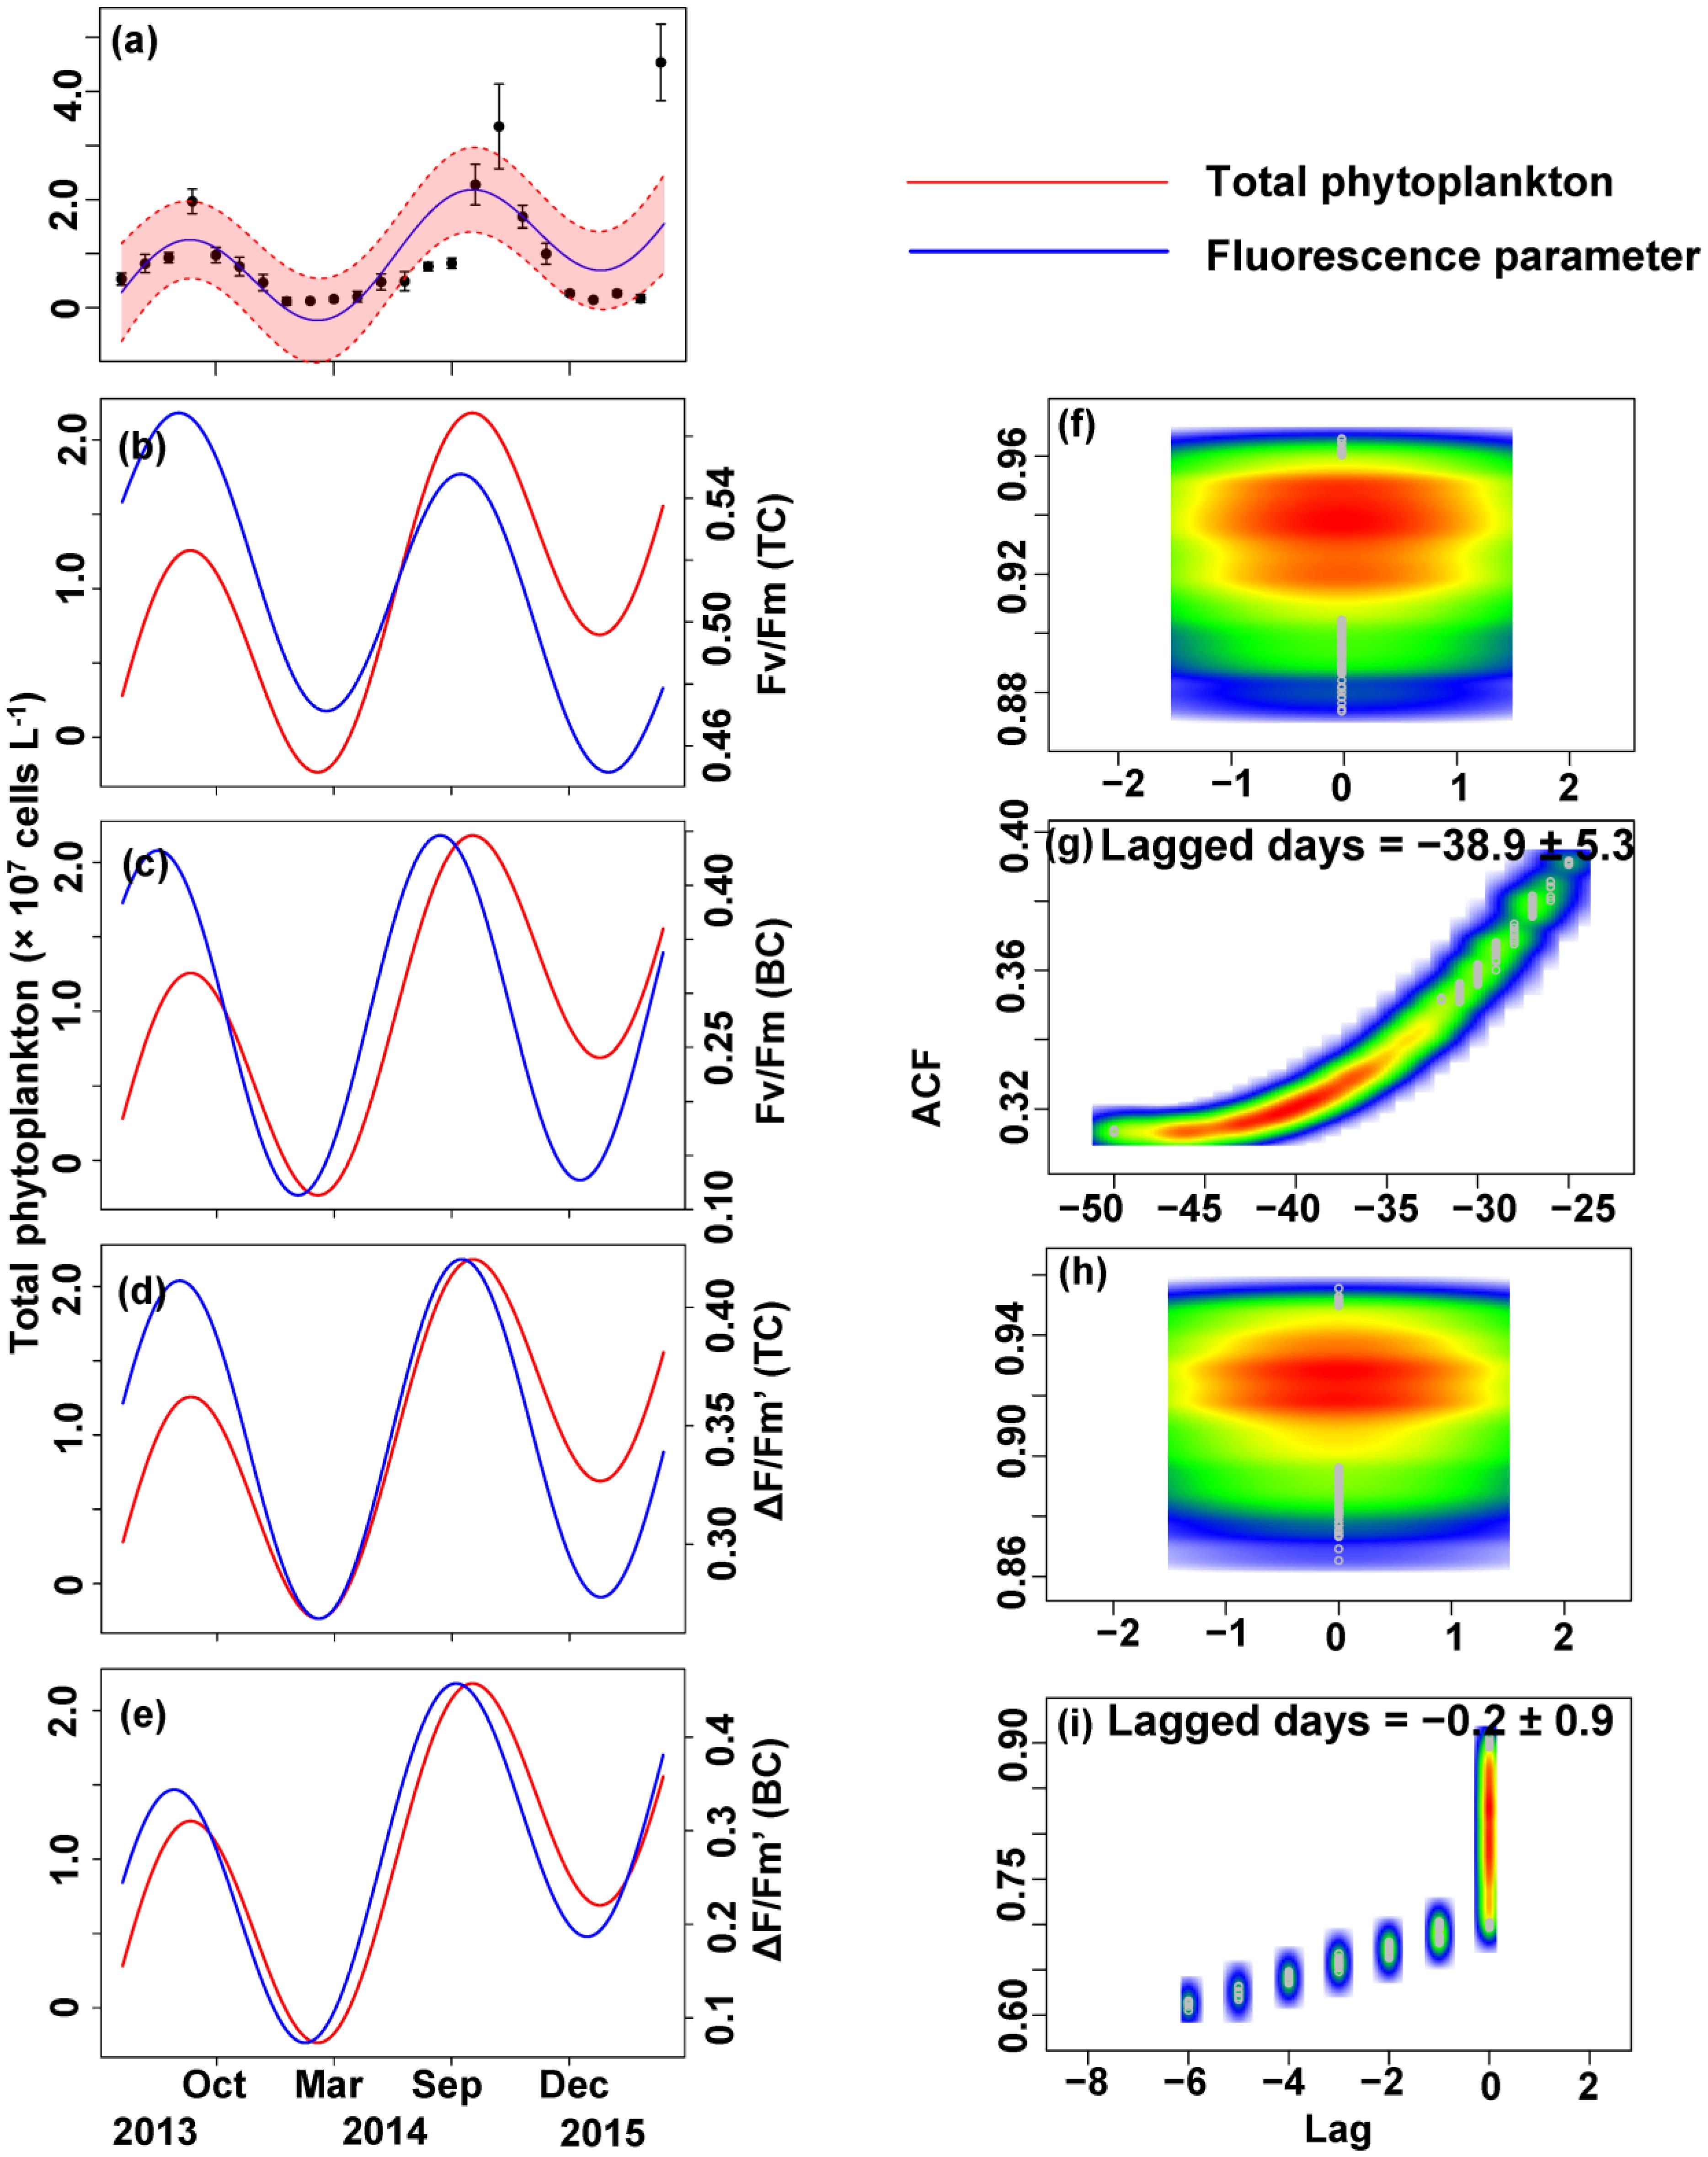
FIGURE 6. Trigonometric regression of the total phytoplankton cell density ( × 107 cells L-1) (a) and fluorescence measurements [Fv/Fm (TC) (b), Fv/Fm (BC) (c), ΔF/Fm′ (TC) (d), and ΔF/Fm′ (BC) (e)]. We fitted these seasonal trends with a time-lag analysis [Fv/Fm (TC) (f), Fv/Fm (BC) (g), ΔF/Fm′ (TC) (h), and ΔF/Fm′ (BC) (i)]. The legged days and associated standard deviation among sites is shown in each panel.
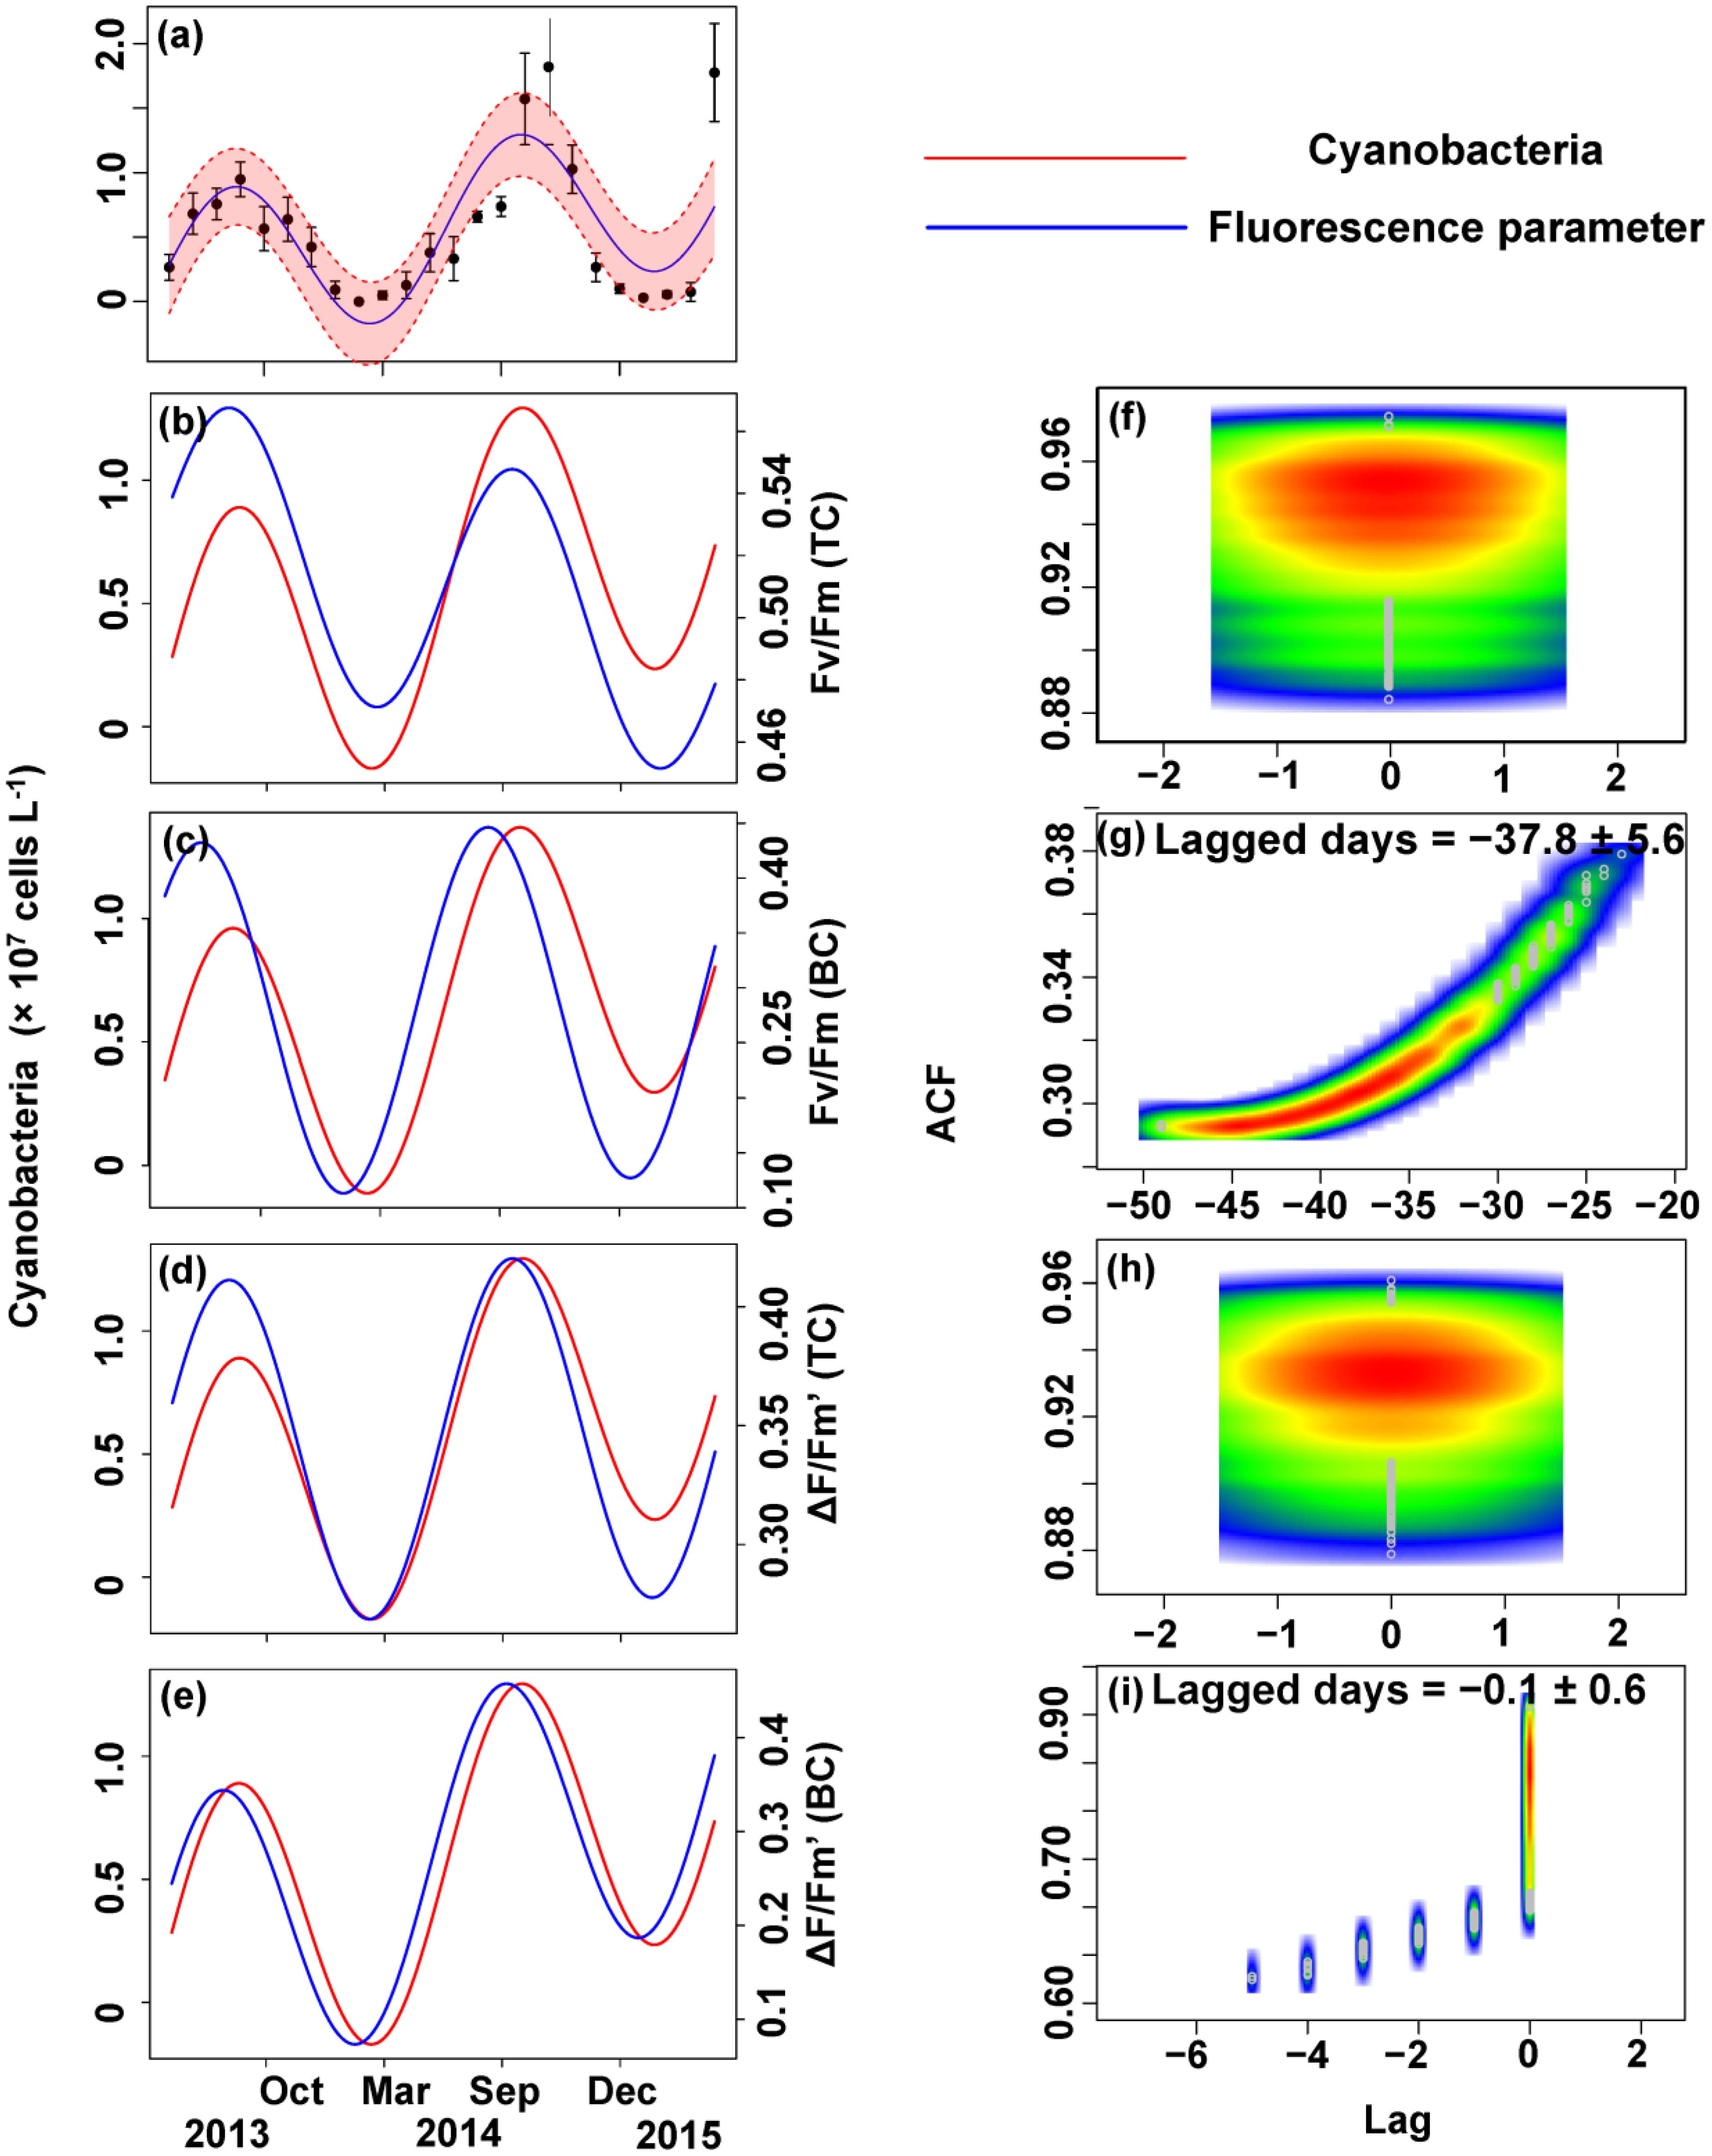
FIGURE 7. Trigonometric regression of the cyanobacteria cell density (a) and fluorescence measurements [Fv/Fm (TC) (b), Fv/Fm (BC) (c), ΔF/Fm′ (TC) (d), and ΔF/Fm′ (BC) (e)]. We fitted these seasonal trends with a time-lag analysis [Fv/Fm (TC) (f), Fv/Fm (BC) (g), ΔF/Fm′ (TC) (h), and ΔF/Fm′ (BC) (i)]. The legged days and associated standard deviation among sites is shown in each panel.
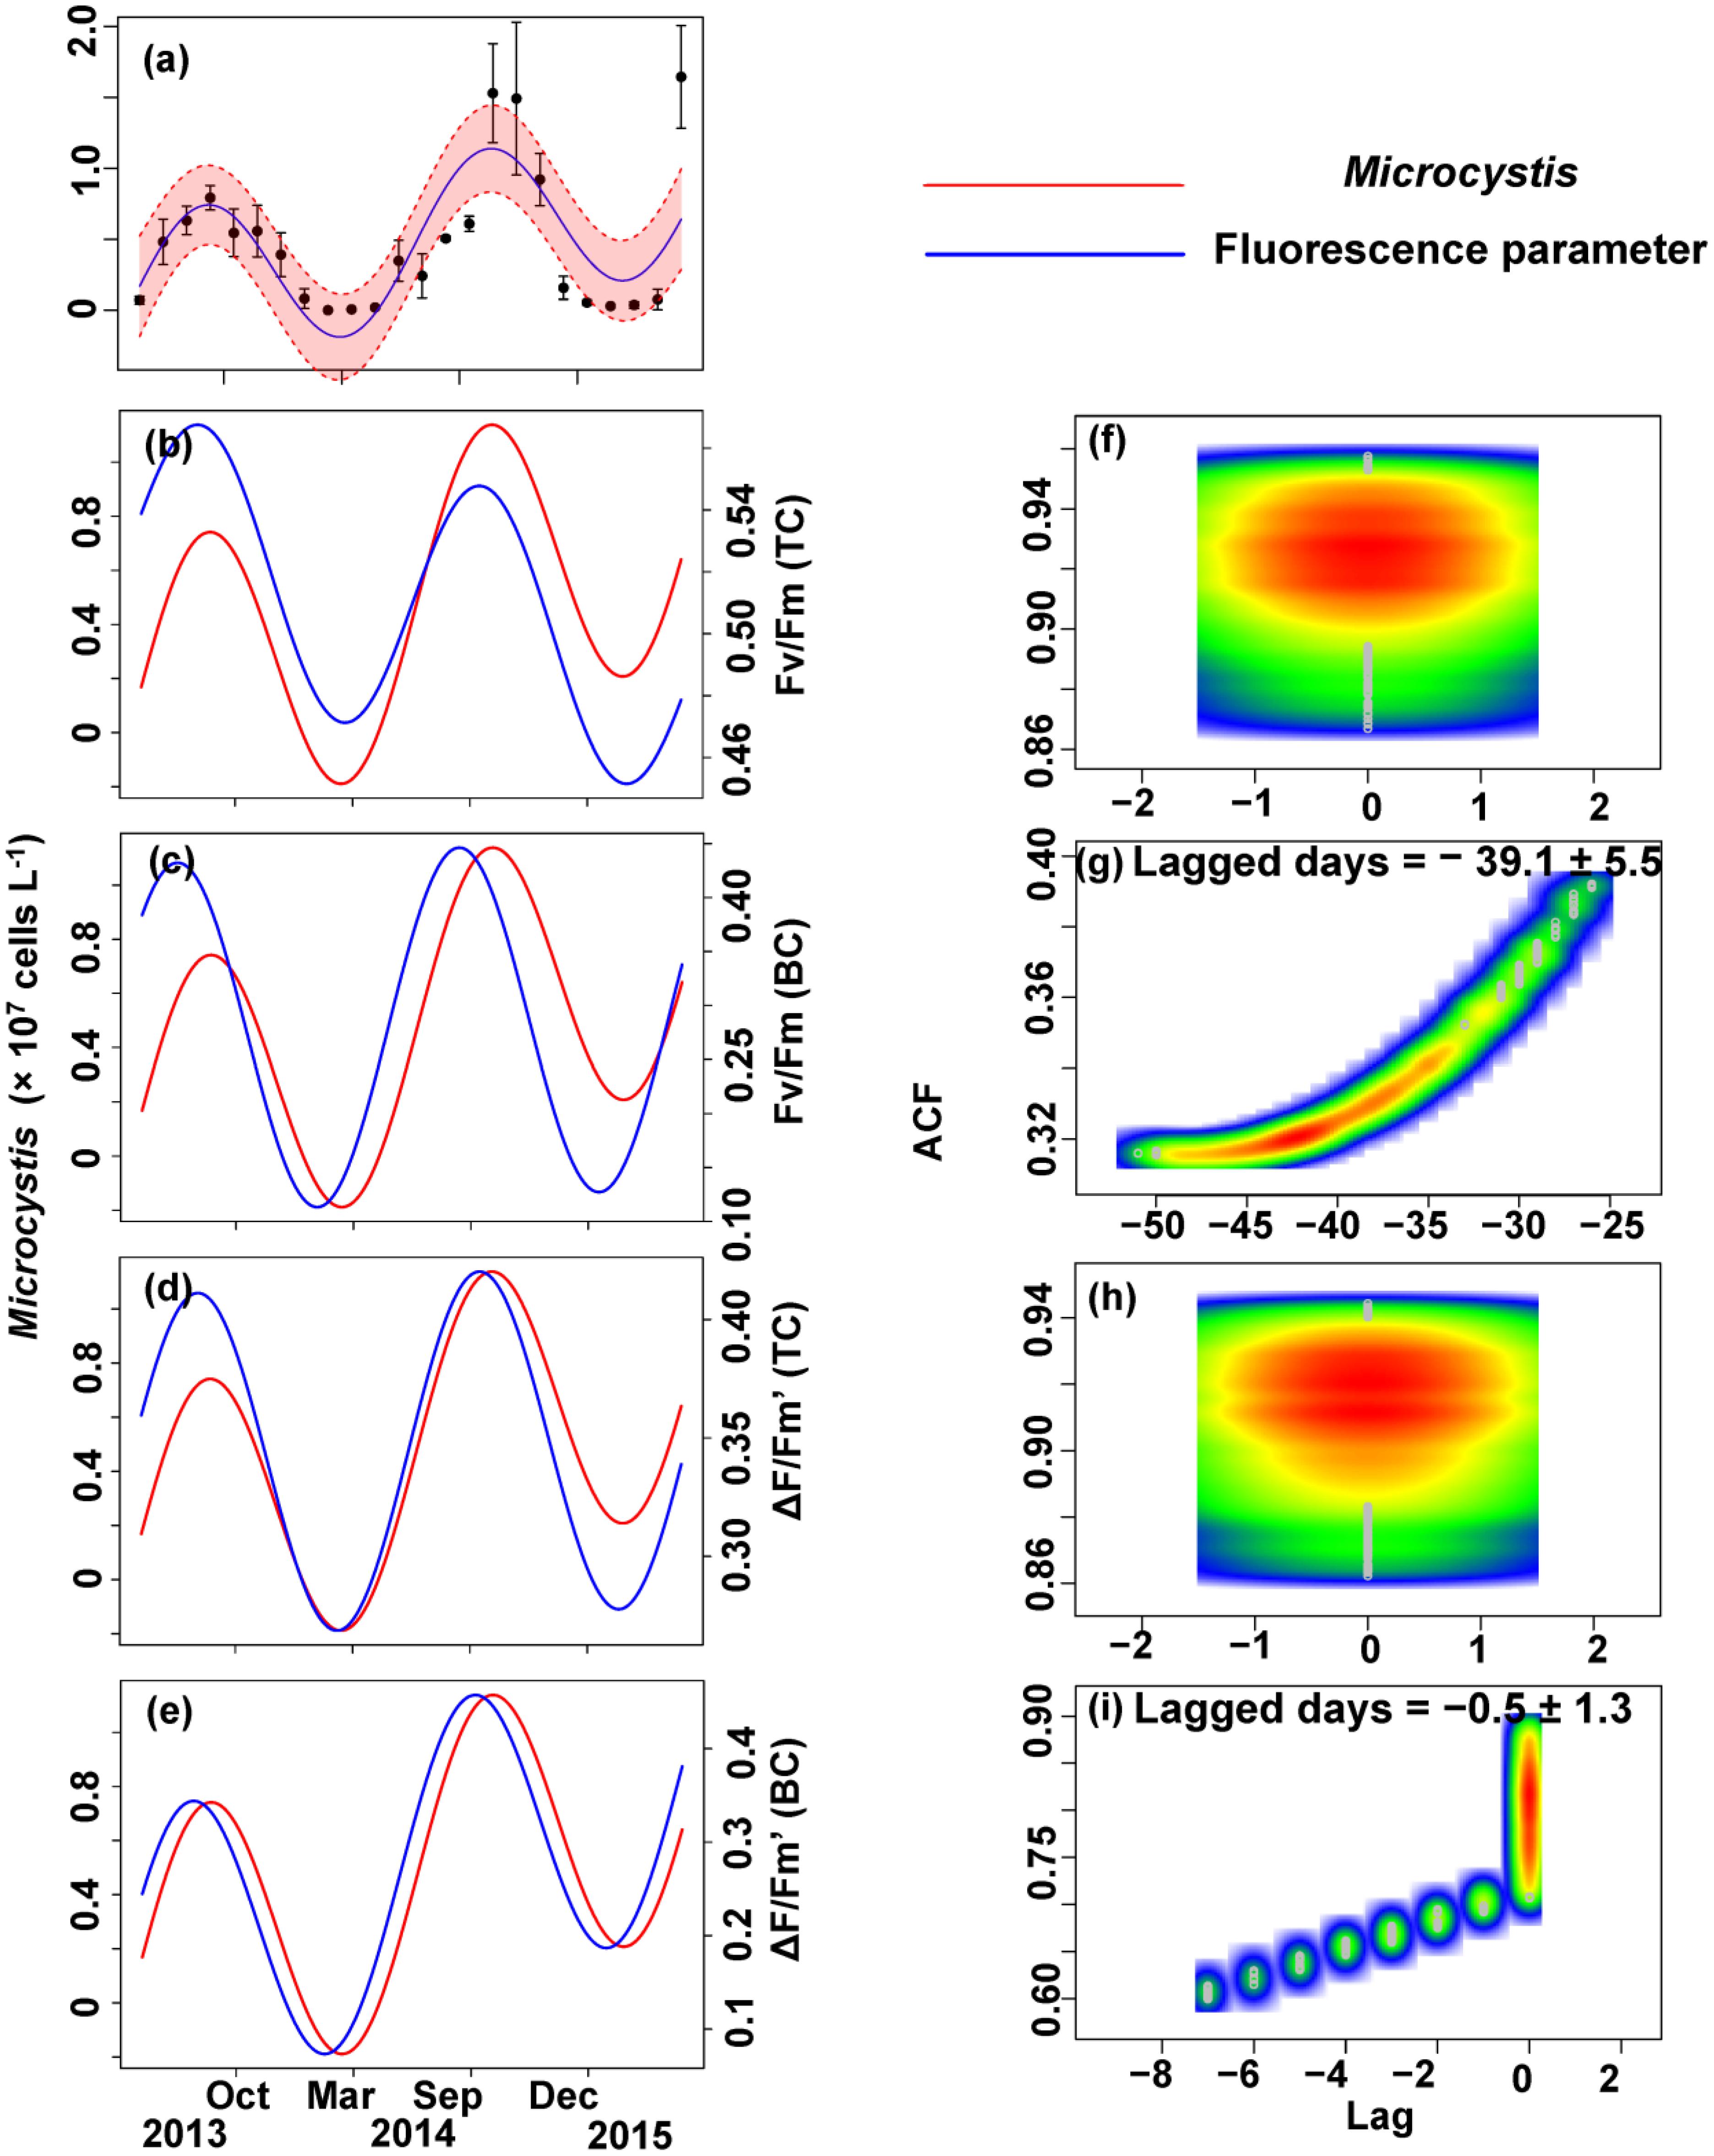
FIGURE 8. Trigonometric regression of the Microcystis cell density (a) and fluorescence measurements [Fv/Fm (TC) (b), Fv/Fm (BC) (c), ΔF/Fm′ (TC) (d), and ΔF/Fm′ (BC) (e)]. We fitted these seasonal trends with a time-lag analysis [Fv/Fm (TC) (f), Fv/Fm (BC) (g), ΔF/Fm′ (TC) (h), and ΔF/Fm′ (BC) (i)]. The legged days and associated standard deviation among sites is shown in each panel.
No apparent time lag was found between Fv/Fm (TC) and Ct (Figures 6b,f) or Cc (Figures 7b,f) or Cm (Figures 8b,f). However, the time lag between Fv/Fm (BC) and Ct (Figures 6b,f) or Cc (Figures 7b,f) or Cm (Figures 8b,f) was almost 40 days. Fv/Fm (BC) lead on average Ct by 38.9 ± 5.3 days (Figures 4C,D). Fv/Fm (BC) lead Cc by 37.8 ± 5.6 days (Figures 7c,g). Fv/Fm (BC) forward lead Cm by 39.1 ± 5.5 (Figures 8c,g). Similarly, no time lag was found betweenΔF/Fm′ (TC) and neither Ct (Figures 6d,h), Cc (Figures 7d,h), or Cm (Figures 8d,h). Time lags were found in the other parameters, with the ΔF/Fm′ (BC) leading total phytoplankton cell density by 0.2 ± 0.9 days (Figures 6e,i); ΔF/Fm′ (BC) leading Cc by 0.1 ± 0.6 days (Figures 7e,i); andΔF/Fm′ (BC) leading Cm by 0.5 ± 1.3 days (Figures 8e,i).
Application of Fv/Fm (BC) to Early Warning of Microcystis Blooms
According to the strong time lag between Fv/Fm and cell density, forecasting Microcystis bloom and the cell density in Lake Erhai should be possible by in lake monitoring of the Fv/Fm (BC) value (Figure 9). The trigonometric regression (Figure 9A) shows that the likelihood of a cyanobacteria bloom can increase when the value of Fv/Fm reach 0.28 and the trend keeps upward. But if the trend decreases, the possibility of cyanobacteria bloom can become low even if the value of Fv/Fm remains higher than 0.28. If the trend of Fv/Fm declines and the Fv/Fm value is lower than 0.28, a cyanobacteria bloom seems unlikely. Here, we define 107 cells L-1 as the threshold value for a cyanobacteria bloom. The peak value of Fv/Fm (BC) is usually followed by a peak value of phytoplankton after approximately 40 days.
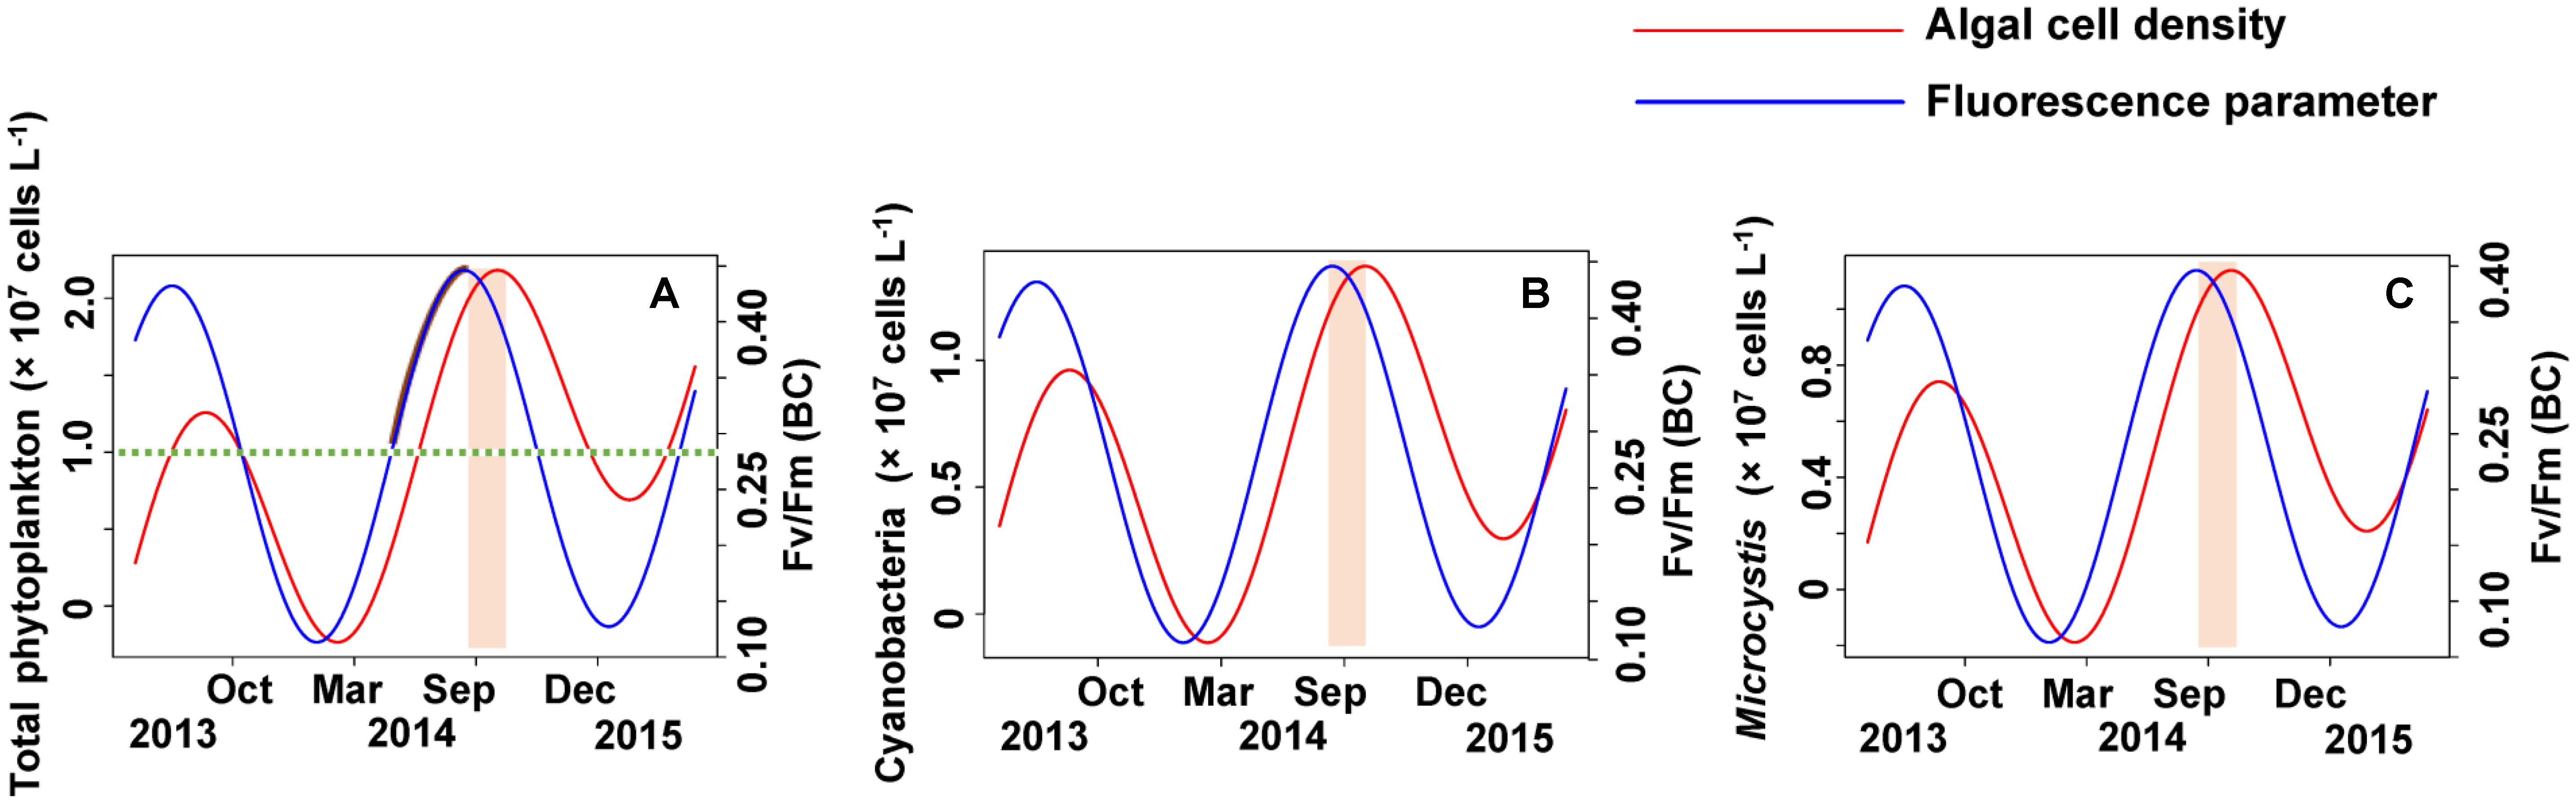
FIGURE 9. The early warning of algal cell density and Microcystis bloom by simulating the time lag between Fv/Fm (BC) and algal cell density. (A) Total phytoplankton, (B) Cyanobacteria, (C) Microcystis.
Discussion
In present study, we developed a novel method to predict Microcystis bloom via physiological parameters of algae and provided a rapid and simple way of early warning for blooms. Compare to the common approaches (direct physicochemical measurements combined with regular monitoring) of bloom forecast (Trimbee and Prepas, 1987; Recknagel et al., 1997; Wong et al., 2007; Winder and Sommer, 2012; Ruiz-de la Torre et al., 2013; Gill et al., 2017), our method could save both time and labor by handling just one forecast factor through a single operation. Compare to the remote sensing approaches, the effective ways which widely used for short-term bloom forecast by using satellite and airborne measurements of spectral reflectance of water color (Wynne et al., 2013; Gill et al., 2017) even sometimes they were limited to the use of cloudless remote-sensing images and constrained by pixels, our method emphasized on chlorophyll fluorescent parameters (Fv/Fm) instead of monitoring Chl a concentrations. A similar method for bloom prediction has not been reported so far. Both abiotic environmental factors (O’neil et al., 2012; Paerl and Paul, 2012; Winder and Sommer, 2012; Ruiz-de la Torre et al., 2013) and biotic factors (Provasoli, 1958; González et al., 2000; Chattopadhayay et al., 2002) could affect the concentrations of Chl a and trigger cyanobacterial blooms. Unlike the effects of environmental factors on phytoplankton, the maximum quantum yield (Fv/Fm) indicates directly photosynthetic activity of phytoplankton (Schreiber et al., 1995b; Shi et al., 2016). Fv/Fm can drop significantly when algae in response to changing environmental conditions (Shen and Song, 2007; Shi et al., 2016). Therefore, Fv/Fm can be considered as a sensitive indicator that can reflect algae viability assessment (Genty et al., 1990; Oxborough and Baker, 1997; Boyd et al., 2000).
The GLMMs, trigonometric regression and ACF are the main analytical models used in our method for prediction of time lag responses in dynamics of phytoplankton. GLMMs model are a popular and widely used method for selecting driving factors in fisheries research (Venables and Dichmont, 2004) and plant litter decomposition (Veen et al., 2015), and seemed to successfully determine the dominant factors in our study. The trigonometric regression can effectively reflect and forecast the time series changes and seasonal trends of electricity demand (Harvey and Koopman, 1993; Zhou et al., 2006), but has not been applied before to algal bloom forecasting. Again, our results show that it can fit to the purpose of reconstructing seasonal patterns of cell density, Fv/Fm and ΔF/Fm′. The combination of results from the GLMMs and trigonometric regressions allowed in turn for the estimation of time lags between algal cell density and the fluorescence parameter using the ACF, and the random error was examined by Permutation test. Given light intensity play an important role in the dynamics of phytoplankton of Lake Erhai, the fluorescence parameters could capture the physiological characteristics of algae. The model created by fluorescence parameters had considerable predictive capacity of early bloom warning.
Our method should be applicable to algal bloom forecasting in other eutrophic lakes, but it might be not suitable for lakes where the diversity of phytoplankton is too high. Due to the complex pigment composition of chloroplast, each species of algae has its own excitation and emission wavelength, resulting in species-specific channel in different water environments through the fluorescence method (Schreiber, 2004). In the present study, cyanophyta was the clear dominant phylum and Microcystis the overwhelming dominant genus of cyanophyta. Thus, the blue channel value of Fv/Fm can reflect the PSII function of Microcystis and infer the possible cell density. The forecasting ability of a model for early warning of algal blooms depends also on the quantity of data and the frequency of sampling (Andersen and Bollerslev, 1998; Ghysels et al., 2006). Whether monthly or higher sampling frequencies (e.g., fortnightly, weekly, or daily) are most appropriate for early warning by time lag analysis deserves further research. At the same time, an in situ measurement might be more helpful for accurate prediction.
Conclusion
We have established a rapid, simple and convenient novel method to estimate the algal cell density in a plateau lake by measuring chlorophyll fluorescence Fv/Fm; a sensitive physiological parameter which directly reflects growth potentiality of algal and forecasts algal further growth rather than early warning of contamination. The traits of Fv/Fm make it more efficient for prediction of algal bloom than using physicochemical parameters. Our study implies that in addition to the parameters of chlorophyll fluorescence, other physiological parameters of algal might also can be applied to the prediction of algal bloom. These results suggest using critical thresholds between Fv/Fm value and bloom occurrence might give new insight into prediction of cyanobacteria blooms and provide a convenient and efficient way for establishment of early warning of cyanobacteria bloom in eutrophic aquatic ecosystems.
Author Contributions
PX and HS designed the study. HW and RZ conducted the experiments. HW analyzed the data and led the manuscript writing. JZ and LN helped perform the analysis. HS revised the manuscript. All authors contributed to the final draft.
Funding
This research was jointly supported by the National Key Research and Development Program of China (2017YFA0605201), the Project of Qinghai Science & Technology Department (2016-ZJ-Y01), the Open Project of State Key Laboratory of Plateau Ecology and Agriculture, Qinghai University (2017-KF-07), and the Major Science and Technology Program for Water Pollution Control and Treatment of China (2012ZX07105-004).
Conflict of Interest Statement
The authors declare that the research was conducted in the absence of any commercial or financial relationships that could be construed as a potential conflict of interest.
Acknowledgments
We thank the three reviewers for their valuable comments and suggestions, Prof. Jun Xu and Prof. Jorge Molinos Garcia for their constructive suggestions and professional editing and Ms. Dandan Zhao and Mr. Changbo Yuan for their help on sample collection.
Footnotes
References
Andersen, T. G., and Bollerslev, T. (1998). Answering the skeptics: yes, standard volatility models do provide accurate forecasts. Int. Econ. Rev. 394, 885–905. doi: 10.2307/2527343
Association, A. P. H., Association, A. W. W., Federation, W. P. C., and Federation, W. E. (1915). Standard Methods for the Examination of Water and Wastewater. Washington, DC: American Public Health Association.
Barlow, R., Mantoura, R., Gough, M., and Fileman, T. (1993). Pigment signatures of the phytoplankton composition in the northeastern Atlantic during the 1990 spring bloom. Deep Sea Research Part II. Top. Stud. Oceanogr. 40, 459–477. doi: 10.1016/0967-0645(93)90027-K
Bates, D., Maechler, M., and Bolker, B. (2011). lme4: Linear Mixed-Effects Models using S4 Classes. Available at: http://lme4.r-forge.r-project.org/
Bilger, W., Schreiber, U., and Bock, M. (1995). Determination of the quantum efficiency of photosystem II and of non-photochemical quenching of chlorophyll fluorescence in the field. Oecologia 102, 425–432. doi: 10.1007/BF00341354
Bolker, B. M., Brooks, M. E., Clark, C. J., Geange, S. W., and Poulsen, J. R. (2009). Generalized linear mixed models: a practical guide for ecology and evolution. Trends Ecol. Evol. 24, 127–135. doi: 10.1016/j.tree.2008.10.008
Boyd, P., Laroche, J., Gall, M., Frew, R., and Mckay, R. M. L. (1999). Role of iron, light, and silicate in controlling algal biomass in subantarctic waters SE of New Zealand. J. Geophys. Res. 104, 13395–13408. doi: 10.1029/1999JC900009
Boyd, R. W., Watson, A. J., Law, C. S., and Abraham, E. R. (2000). A mesoscale phytoplankton bloom in the polar Southern Ocean stimulated by iron fertilization. Nature 407, 695–702. doi: 10.1038/35037500
Carlson, R. E. (1977). A trophic state index for lakes. Limnol. Oceanogr. 22, 361–369. doi: 10.4319/lo.1977.22.2.0361
Chattopadhayay, J., Sarkar, R., and Mandal, S. (2002). Toxin-producing plankton may act as a biological control for planktonic blooms—field study and mathematical modelling. J. Theor. Biol. 215, 333–344. doi: 10.1006/jtbi.2001.2510
Chen, Y., Fan, C., Teubner, K., and Dokulil, M. (2003). Changes of nutrients and phytoplankton chlorophyll-a in a large shallow lake, Taihu, China: an 8-year investigation. Hydrobiologia 506, 273–279. doi: 10.1023/B:HYDR.0000008604.09751.01
de Figueiredo, D. R., Azeiteiro, U. M., Esteves, S. M., Gonçalves, F. J., and Pereira, M. J. (2004). Microcystin-producing blooms—a serious global public health issue. Ecotoxicol. Environ. Saf. 59, 151–163. doi: 10.1016/j.ecoenv.2004.04.006
Dong, Y. (1999). Research on blue algae plakton bloom in Erhai lake. Yunnan Environ. Sci. 4:010. doi: 10.13623/j.cnki.hkdk.1999.04.010
Dorigo, U., and Leboulanger, C. (2001). A pulse-amplitude modulated fluorescence-based method for assessing the effects of photosystem II herbicides on freshwater periphyton. J. Appl. Phycol. 13, 509–515. doi: 10.1023/A:1012598816581
Duarte, C. M., Kalff, J., and Peters, R. H. (1986). Patterns in biomass and cover of aquatic macrophytes in lakes. Can. J. Fish. Aquat. Sci. 43, 1900–1908. doi: 10.1139/f86-235
Genty, B., Harbinson, J., Briantais, J.-M., and Baker, N. R. (1990). The relationship between non-photochemical quenching of chlorophyll fluorescence and the rate of photosystem 2 photochemistry in leaves. Photosynth. Res. 25, 249–257. doi: 10.1007/BF00033166
Ghysels, E., Santa-Clara, P., and Valkanov, R. (2006). Predicting volatility: getting the most out of return data sampled at different frequencies. J. Economet. 131, 59–95. doi: 10.1016/j.jeconom.2005.01.004
Gill, D., Ming, T., and Ouyang, W. (2017). Improving the Lake Erie HAB Tracker: A Forecasting & Decision Support Tool for Harmful Algal Blooms. Available at: http://hdl.handle.net/2027.42/136562
González, J. M., Simó, R., Massana, R., Covert, J. S., and Casamayor, E. O. (2000). Bacterial community structure associated with a dimethylsulfoniopropionate-producing North Atlantic algal bloom. Appl. Environ. Microbiol. 66, 4237–4246. doi: 10.1128/AEM.66.10.4237-4246.2000
Harvey, A., and Koopman, S. J. (1993). Forecasting hourly electricity demand using time-varying splines. J. Am. Statist. Assoc. 88, 1228–1236. doi: 10.2307/2291261
Hu, H. (2006). The Freshwater Algae of China: Systematics, Taxonomy and Ecology. Ottawa, ON: Science Press.
Huang, C., Wang, X., Yang, H., Li, Y., and Wang, Y. (2014). Satellite data regarding the eutrophication response to human activities in the plateau lake Dianchi in China from 1974 to 2009. Sci. Total Environ. 485, 1–11. doi: 10.1016/j.scitotenv.2014.03.031
Huang, X., Chen, W., and Cai, Q. (1999). Survey, Observation and Analysis of Lake Ecology. Beijing: Science Press.
Hurlbert, S. H. (1984). Pseudoreplication and the design of ecological field experiments. Ecol. Monogr. 54, 187–211. doi: 10.2307/1942661
Jin, X., Xu, Q., and Huang, C. (2005). Current status and future tendency of lake eutrophication in China. Sci. China Ser. C 48, 948–954. doi: 10.1360/062005-286
Kalaji, H. M., Schansker, G., Brestic, M., Bussotti, F., and Calatayud, A. (2017). Frequently asked questions about chlorophyll fluorescence, the sequel. Photosynth. Res. 132, 13–66. doi: 10.1007/s11120-016-0318-y
Kalaji, H. M., Schansker, G., Ladle, R. J., Goltsev, V., and Bosa, K. (2014). Frequently asked questions about in vivo chlorophyll fluorescence: practical issues. Photosynth. Res. 122, 121–158. doi: 10.1007/s11120-014-0024-6
Kühl, M., Glud, R. N., Borum, J., Roberts, R., and Rysgaard, S. (2001). Photosynthetic performance of surface-associated algae below sea ice as measured with a pulse amplitude-modulated (PAM) fluorometer and O2 microsensors. Mar. Ecol. Prog. Ser. 223, 1–14. doi: 10.3354/meps223001
Kutser, T. (2004). Quantitative detection of chlorophyll in cyanobacterial blooms by satellite remote sensing. Limnol. Oceanogr. 49, 2179–2189. doi: 10.4319/lo.2004.49.6.2179
Lamon, E. C., Reckhow, K. H., and Havens, K. E. (1996). Using generalized additive models for prediction of chlorophyll a in Lake Okeechobee, Florida. Lakes Reservoirs Res. Manag. 2, 37–46. doi: 10.1111/j.1440-1770.1996.tb00046.x
Lee, J. H., Huang, Y., Dickman, M., and Jayawardena, A. W. (2003). Neural network modelling of coastal algal blooms. Ecol. Model. 159, 179–201. doi: 10.1016/S0304-3800(02)00281-8
Lorenzen, C. J. (1967). Determination of chlorophyll and pheo-pigments: spectrophotometric equations. Limnol. Oceanogr. 12, 343–346. doi: 10.4319/lo.1967.12.2.0343
Michalak, A. M., Anderson, E. J., Beletsky, D., Boland, S., and Bosch, N. S. (2013). Record-setting algal bloom in Lake Erie caused by agricultural and meteorological trends consistent with expected future conditions. Proc. Natl. Acad. Sci. U.S.A. 110, 6448–6452. doi: 10.1073/pnas.1216006110
Miller, T. R., Beversdorf, L. J., Weirich, C. A., and Bartlett, S. L. (2017). Cyanobacterial toxins of the laurentian great lakes, their toxicological effects, and numerical limits in drinking water. Mar. Drugs 15:E160. doi: 10.3390/md15060160
Misra, A. N., Misra, M., and Singh, R. (2012). Chlorophyll Fluorescence in Plant Biology. Available at: http://www.intechopen.com/books/biophysics/chlorophyll-fluorescence-in-plant-biology
Muttil, N., and Chau, K.-W. (2006). Neural network and genetic programming for modelling coastal algal blooms. Int. J. Environ. Pollut. 28, 223–238. doi: 10.1504/IJEP.2006.011208
O’neil, J., Davis, T., Burford, M., and Gobler, C. (2012). The rise of harmful cyanobacteria blooms: the potential roles of eutrophication and climate change. Harm. Algae 14, 313–334. doi: 10.1016/j.hal.2011.10.027
Oxborough, K., and Baker, N. R. (1997). Resolving chlorophyll a fluorescence images of photosynthetic efficiency into photochemical and non-photochemical components–calculation of qP and Fv′/Fm′ without measuring Fo. Photosynth. Res. 54, 135–142. doi: 10.1023/A:1005936823310
Paerl, H. W., Fulton, R. S., Moisander, P. H., and Dyble, J. (2001). Harmful freshwater algal blooms, with an emphasis on cyanobacteria. Sci. World J. 1, 76–113. doi: 10.1100/tsw.2001.16
Paerl, H. W., and Paul, V. J. (2012). Climate change: links to global expansion of harmful cyanobacteria. Water Res. 46, 1349–1363. doi: 10.1016/j.watres.2011.08.002
Paerl, H. W., Xu, H., Mccarthy, M. J., Zhu, G., and Qin, B. (2011). Controlling harmful cyanobacterial blooms in a hyper-eutrophic lake (Lake Taihu, China): the need for a dual nutrient (N & P) management strategy. Water Res. 45, 1973–1983. doi: 10.1016/j.watres.2010.09.018
Pollock, D. (2000). Trend estimation and de-trending via rational square-wave filters. J. Economet. 99, 317–334. doi: 10.1016/S0304-4076(00)00028-2
Provasoli, L. (1958). Nutrition and ecology of protozoa and algae. Annu. Rev. Microbiol. 12, 279–308. doi: 10.1146/annurev.mi.12.100158.001431
Psenner, R. (2002). Alpine waters in the interplay of global change: complex links-simple effects. Moun. Res. Dev. 25, 376–385.
Psenner, R., and Schmidt, R. (1992). Climate-driven pH control of remote alpine lakes and effects of acid deposition. Nature 356:781. doi: 10.1038/356781a0
Qin, B., Zhu, G., Gao, G., Zhang, Y., and Li, W. (2010). A drinking water crisis in Lake Taihu, China: linkage to climatic variability and lake management. Environ. Manag. 45, 105–112. doi: 10.1007/s00267-009-9393-6
R Core Team (2014). R: A Language and Environment for Statistical Computing. Vienna: R Foundation for Statistical Computing.
Recknagel, F., French, M., Harkonen, P., and Yabunaka, K.-I. (1997). Artificial neural network approach for modelling and prediction of algal blooms. Ecol. Model. 96, 11–28. doi: 10.1016/S0304-3800(96)00049-X
Ruiz-de la Torre, M. C., Maske, H., Ochoa, J., and Almeda-Jauregui, C. O. (2013). Maintenance of coastal surface blooms by surface temperature stratification and wind drift. PLoS One 8:e58958. doi: 10.1371/journal.pone.0058958
Schlüter, L., Møhlenberg, F., Havskum, H., and Larsen, S. (2000). The use of phytoplankton pigments for identifying and quantifying phytoplankton groups in coastal areas: testing the influence of light and nutrients on pigment/chlorophyll a ratios. Mar. Ecol. Prog. Ser. 192, 49–63. doi: 10.3354/meps192049
Schmitt-Jansen, M., and Altenburger, R. (2008). Community-level microalgal toxicity assessment by multiwavelength-excitation PAM fluorometry. Aquat. Toxicol. 86, 49–58. doi: 10.1016/j.aquatox.2007.10.001
Schreiber, U. (2004). Pulse-Amplitude-Modulation (PAM) Fluorometry and Saturation Pulse Method: An Overview. Würzburg: University of Wuerzburg. doi: 10.1007/978-1-4020-3218-9_11
Schreiber, U., Bilger, W., and Neubauer, C. (1995a). “Chlorophyll fluorescence as a nonintrusive indicator for rapid assessment of in vivo photosynthesis,” in Ecophysiology of Photosynthesis, ed. M. Martyn (Berlin: Springer), 49–70.
Schreiber, U., Hormann, H., Neubauer, C., and Klughammer, C. (1995b). Assessment of photosystem II photochemical quantum yield by chlorophyll fluorescence quenching analysis. Aust. J. Plant Physiol. 22, 209–220. doi: 10.1071/PP9950209
Shen, H., and Song, L. (2007). Comparative studies on physiological responses to phosphorus in two phenotypes of bloom-forming Microcystis. Hydrobiologia 592, 475–486. doi: 10.1007/s10750-007-0794-3
Shi, P., Shen, H., Wang, W., Yang, Q., and Xie, P. (2016). Habitat-specific differences in adaptation to light in freshwater diatoms. J. Appl. Phycol. 28, 227–239. doi: 10.1007/s10811-015-0531-7
Stumpf, R. P. (2001). Applications of satellite ocean color sensors for monitoring and predicting harmful algal blooms. Hum. Ecol. Risk Assess. 7, 1363–1368. doi: 10.1080/20018091095050
Tao, M., Xie, P., Chen, J., Qin, B., Zhang, D., Niu, Y., et al. (2012). Use of a generalized additive model to investigate key abiotic factors affecting microcystin cellular quotas in heavy bloom areas of Lake Taihu. PLoS One 7:e32020. doi: 10.1371/journal.pone.0032020
Tolotti, M., Manca, M., Angeli, N., Morabito, G., and Thaler, B. (2006). Phytoplankton and zooplankton associations in a set of Alpine high altitude lakes: geographic distribution and ecology. Hydrobiologia 562, 99–122. doi: 10.1007/s10750-005-1807-8
Trimbee, A. M., and Prepas, E. (1987). Evaluation of total phosphorus as a predictor of the relative biomass of blue-green algae with emphasis on Alberta lakes. Can. J. Fish. Aquat. Sci. 44, 1337–1342. doi: 10.1139/f87-158
Veen, G. F., Sundqvist, M. K., and Wardle, D. A. (2015). Environmental factors and traits that drive plant litter decomposition do not determine home-field advantage effects. Funct. Ecol. 29, 981–991. doi: 10.1111/1365-2435.12421
Venables, W. N., and Dichmont, C. M. (2004). GLMs, GAMs and GLMMs: an overview of theory for applications in fisheries research. Fish. Res. 70, 319–337. doi: 10.1016/j.fishres.2004.08.011
Watson, S. B., Zastepa, A., Boyer, G. L., and Matthews, E. (2017). Algal bloom response and risk management: on-site response tools. Toxicon 129, 144–152. doi: 10.1016/j.toxicon.2017.02.005
Wei, Z., Zhang, L., Yang, S., Lv, X., Zhu, J., Dou, J. et al. (2012). Community structure and seasonal succession of Phytoplankton in Erhai Lake. J. Hydroecology 1674–3075. doi: 10.15928/j.1674-3075.2012.04.002
Wen, H., and Ma, G. (2011). Study of water quality and algae in erhai lake during 2008–2010. Env. Sci. Manag. 11, 44–48. doi: 10.3969/j.issn.1673-1212.2011.11.010
White, S., Anandraj, A., and Bux, F. (2011). PAM fluorometry as a tool to assess microalgal nutrient stress and monitor cellular neutral lipids. Bioresour. Technol. 102, 1675–1682. doi: 10.1016/j.biortech.2010.09.097
Wickham, H. (2007). Reshaping Data with the reshape Package. J. Statist. Software 21, 1–20. doi: 10.3978/j.issn.2305-5839.2016.01.33
Wickham, H. (2009). ggplot2: Elegant Graphics for Data Analysis. New York, NY: Springer. doi: 10.1007/978-0-387-98141-3
Winder, M., and Sommer, U. (2012). Phytoplankton response to a changing climate. Hydrobiologia 698, 5–16. doi: 10.1007/s10750-012-1149-2
Wong, K. T., Lee, J. H., and Hodgkiss, I. (2007). A simple model for forecast of coastal algal blooms. Estuar. Coast. Shelf Sci. 74, 175–196. doi: 10.1016/j.ecss.2007.04.012
Wu, Q., and Wang, Y. (1999). On the succession of aquatic communities in Erhai Lake. J. Lake Sci. 11, 273–281. doi: 10.18307/1999.0312
Wynne, T. T., Stumpf, R. P., Tomlinson, M. C., Fahnenstiel, G. L., and Dyble, J. (2013). Evolution of a cyanobacterial bloom forecast system in western Lake Erie: development and initial evaluation. J. Great Lakes Res. 39, 90–99. doi: 10.1016/j.jglr.2012.10.003
Xu, F. (1996). Ecosystem health assessment of Lake Chao, a shallow eutrophic Chinese lake. Lakes Res. 2, 101–109. doi: 10.1016/j.jglr.2012.10.003
Keywords: chlorophyll fluorescence, Microcystis bloom, generalized linear mixed models, trigonometric regression, Phyto-PAM, algal density, the time lag
Citation: Wang H, Zhu R, Zhang J, Ni L, Shen H and Xie P (2018) A Novel and Convenient Method for Early Warning of Algal Cell Density by Chlorophyll Fluorescence Parameters and Its Application in a Highland Lake. Front. Plant Sci. 9:869. doi: 10.3389/fpls.2018.00869
Received: 09 February 2018; Accepted: 04 June 2018;
Published: 28 June 2018.
Edited by:
Jianhua Fan, East China University of Science and Technology, ChinaReviewed by:
Raquel Esteban, University of the Basque Country (UPV/EHU), SpainAmarendra Narayan Misra, Khallikote University, India
Taras P. Pasternak, Albert Ludwigs Universität Freiburg, Germany
Copyright © 2018 Wang, Zhu, Zhang, Ni, Shen and Xie. This is an open-access article distributed under the terms of the Creative Commons Attribution License (CC BY). The use, distribution or reproduction in other forums is permitted, provided the original author(s) and the copyright owner are credited and that the original publication in this journal is cited, in accordance with accepted academic practice. No use, distribution or reproduction is permitted which does not comply with these terms.
*Correspondence: Hong Shen, aG9uZ3NoZW5AaWhiLmFjLmNu Ping Xie, eGllcGluZ0BpaGIuYWMuY24=