 Márcia R. Vagos
 Hermenegild Arevalo
 Jordi Heijman
 Ulrich Schotten
 Joakim Sundnes
- 1Simula Research Laboratory, Computational Physiology Department, Lysaker, Norway
- 2Department of Informatics, University of Oslo, Oslo, Norway
- 3Center for Cardiological Innovation, Rikshospitalet, Oslo, Norway
- 4Faculty of Health, Medicine and Life Sciences, CARIM School for Cardiovascular Diseases, Maastricht University, Maastricht, Netherlands
Models of cardiac electrophysiology are widely used to supplement experimental results and to provide insight into mechanisms of cardiac function and pathology. The rabbit has been a particularly important animal model for studying mechanisms of atrial pathophysiology and atrial fibrillation, which has motivated the development of models for the rabbit atrial cardiomyocyte electrophysiology. Previously developed models include detailed representations of membrane currents and intracellular ionic concentrations, but these so-called “common-pool” models lack a spatially distributed description of the calcium handling system, which reflects the detailed ultrastructure likely found in cells in vivo. Because of the less well-developed T-tubular system in atrial compared to ventricular cardiomyocytes, spatial gradients in intracellular calcium concentrations may play a more significant role in atrial cardiomyocyte pathophysiology, rendering common-pool models less suitable for investigating underlying electrophysiological mechanisms. In this study, we developed a novel computational model of the rabbit atrial cardiomyocyte incorporating detailed compartmentalization of intracellular calcium dynamics, in addition to a description of membrane currents and intracellular processes. The spatial representation of calcium was based on dividing the intracellular space into eighteen different compartments in the transversal direction, each with separate systems for internal calcium storage and release, and tracking ionic fluxes between compartments in addition to the dynamics driven by membrane currents and calcium release. The model was parameterized employing a population-of-models approach using experimental data from different sources. The parameterization of this novel model resulted in a reduced population of models with inherent variability in calcium dynamics and electrophysiological properties, all of which fall within the range of observed experimental values. As such, the population of models may represent natural variability in cardiomyocyte electrophysiology or inherent uncertainty in the underlying experimental data. The ionic model population was also able to reproduce the U-shaped waveform observed in line-scans of triggered calcium waves in atrial cardiomyocytes, characteristic of the absence of T-tubules, resulting in a centripetal calcium wave due to subcellular calcium diffusion. This novel spatial model of the rabbit atrial cardiomyocyte can be used to integrate experimental findings, offering the potential to enhance our understanding of the pathophysiological role of calcium-handling abnormalities under diseased conditions, such as atrial fibrillation.
1. Introduction
Mathematical models of cardiac electrophysiology (EP) have advanced significantly over the past decades, and are valuable tools for gaining physiological insight from the expanding pool of experimental data (Heijman et al., 2016; Vagos et al., 2018). While animal models remain the primary source of experimental data on ion channels and electrical activity in the heart, computational models of different animal species constitute an important tool for knowledge extraction and translation between species. The rabbit has been a particularly useful animal model to study different aspects of cardiac electrophysiology and arrhythmia, given the similarities of their electrophysiological properties to the human (Ravelli and Allessie, 1997; Eijsbouts et al., 2003; Rouge et al., 2006; Greiser et al., 2014; Li et al., 2014; Wang et al., 2017; Frommeyer et al., 2019). The wide application of the experimental rabbit model has motivated the development of rabbit-specific mathematical models of cardiomyocyte (CM) electrophysiology (see e.g., Hilgemann and Noble, 1987; Demir et al., 1994, 1999; Lindblad et al., 1996; Kurata et al., 2002; Shannon et al., 2004; Mahajan et al., 2008; Aslanidi et al., 2009; Maltsev and Lakatta, 2009), which incorporate rabbit-specific formulations of ionic currents.
One important characteristic of rabbit atrial CMs is the lack of a well-developed T-tubule (TT) system (Tidball et al., 1991; Blatter, 2017), which leads to a characteristic U-shaped wave front in line scans of intracellular calcium, indicating asynchronous Ca2+ release (Smyrnias et al., 2010; Greiser et al., 2014). This shape results from the “fire-diffuse-fire” response (Coombes and Timofeeva, 2003), in which a Ca2+ wave is initiated by L-type Ca2+ channels (LTCC) at the cell periphery and subsequently propagates toward the center of the cell in a saltatory manner through diffusion and Ca2+-induced Ca2+ release (Bootman et al., 2002, 2011). Similar U-shaped Ca2+ propagation patterns have been observed in atrial CMs of other small animal species, such as cat (Hüser et al., 1996; Blatter et al., 2003), and rat (Mackenzie et al., 2004; Bootman et al., 2011). However, it has also been observed in rat atrial CMs that Ca2+ signals originating at the cell periphery typically did not fully propagate to the center (Bootman et al., 2011). This effective truncation of the Ca2+ wave was due to the lack of TTs, increased Ca2+ buffering capacity, and the so-called “diffusion barrier” of the mitochondria and Serca2a in these cells. This lack of regeneration of the Ca2+ signal results in a progressive damping of the centripetal Ca2+ wave with a peak amplitude and rate of Ca2+ rise significantly lower at central regions as compared to the periphery (Mackenzie et al., 2004; Trafford et al., 2013). These observations have also been replicated in a model of Ca2+ propagation in a CM without TTs, demonstrating that Ca2+ propagation or lack thereof results from a complex interplay between different effectors of the Ca2+ handling system (Thul et al., 2012). The reduced systolic Ca2+ levels and delayed Ca2+ signals in central regions associated with the lack of TTs in some atrial CMs, as well as remodeling-induced detubulation, can thus have a profound effect on electrophysiological changes driven by ionic current remodeling or β-adrenergic stimulation (Trafford et al., 2013).
Despite the important role that spatial intracellular Ca2+ dynamics can play in the generation and maintenance of aberrant electrical activity in atrial cells and tissues, previously developed mathematical models of the rabbit atrial CM do not incorporate spatial description of Ca2+ movement within the cell. Therefore, although useful in reproducing whole-cell characteristics of rabbit EP, these models are not able to assess the sub-cellular mechanisms of altered Ca2+ propagation and their role in arrhythmic activity. In contrast, models with spatial Ca2+ description would permit assessment of the effect of sub-cellular structures on intracellular Ca2+ dynamics and Ca2+ wave propagation, but such models have not been developed for rabbit atrial physiology.
In this paper, we describe the development of a novel model of the rabbit atrial CM with spatial description of ionic species and the Ca2+ handling system. The structure of the model allows simulation of the spatial distribution of Ca2+, as well as the propagation of intracellular Ca2+ over time. We parameterized the maximum conductances in the model using a “population of models” approach to reproduce the normal electrophysiological properties of the rabbit, as supported by experimental data reported in the literature. The result is a population of models that all closely approximate the experimental data, but with differences in the models that appropriately reflect individual variability or inherent uncertainty in the data. We shall henceforth refer to this selected population as “control population.” We are aware that the dynamics of Ca2+ wave propagation are most directly affected by parameters that modulate the SR content, and Ca2+ release and uptake kinetics. However, the aim of the present study was not to focus on the role of these parameters in modulating Ca2+ wave propagation, but instead to parameterize the maximum conductances of ionic currents and asses their effect on intracellular Ca2+ dynamics Thus, the motivation to create a spatial model was to study the model's behavior in terms of this radial Ca2+ flux as we changed the maximum conductances of ion currents, and our primary hypothesis was that variations in ion-channel expression and function (in particular of Ca2+ currents) may contribute to alterations in radial Ca2+ flux. We then used the control population to (1) assess if changes in current conductances have an effect on Ca2+ propagation dynamics; (2) to quantify possible correlations between Ca2+ properties at the membrane and at the center of cell; and (3) to query the underlying mechanisms of the differences observed in the Ca2+ propagation patterns across the control population.
2. Methods
2.1. Model Development
The rabbit atrial CM model was developed based on the previously published human atrial CM model by Voigt & Heijman (Voigt et al., 2014), which is a spatial model with the calcium handling system divided into discrete domains. We modified this model to incorporate ion current formulations from the non-spatial rabbit atrial CM model by Lindblad et al. (1996) and Aslanidi et al. (2009) to reflect the rabbit electrophysiology.
The model is structured into discrete segments in the longitudinal direction of the CM, and each segment is further divided into discrete domains in the radial (or transversal) direction. This architecture allows simulating the radial flux of Ca2+ from the membrane toward the center of the CM (i.e., centripetal diffusion) through an implementation of Ca2+ diffusion terms. Thus, a total of 18 domains represent a one-dimensional cross-section of the cell, where the two outermost domains (1 and 18) correspond to the region close to the cell membrane. These domains therefore include the sarcolemmal currents, Ca2+ release units (CRU), and Ca2+ buffers. In contrast, the inner domains (2–17) are not in direct contact with the cell membrane and contain only the CRUs and Ca2+ buffers. The inner domains contain a cytosolic space, the sarcoplasmic reticulum (SR), and a sub-SR space (SRS), while the membrane domains also include a subsarcolemmal (SL) space. In domains 1 and 18 the SRS represents a junctional space in which LTCC and the ryanodine receptors (RyR) interact, which is indicated with “junc.” This corresponds to the dyadic space in other CM models. We used a cell volume of 16 pL based on an estimated cell length of 130 μm (Lindblad et al., 1996) and a radius of 6.3 μm (Greiser et al., 2014). This volume is divided equally across the 18 domains, that the cytosolic, SR and SRS compartments make up 65, 3.5, and 0.1% of each domain, respectively, and that in addition the SL space takes up 2% of the cell volume. The domains and compartments, as well as the ionic fluxes between them, are schematically illustrated in Figure 1.
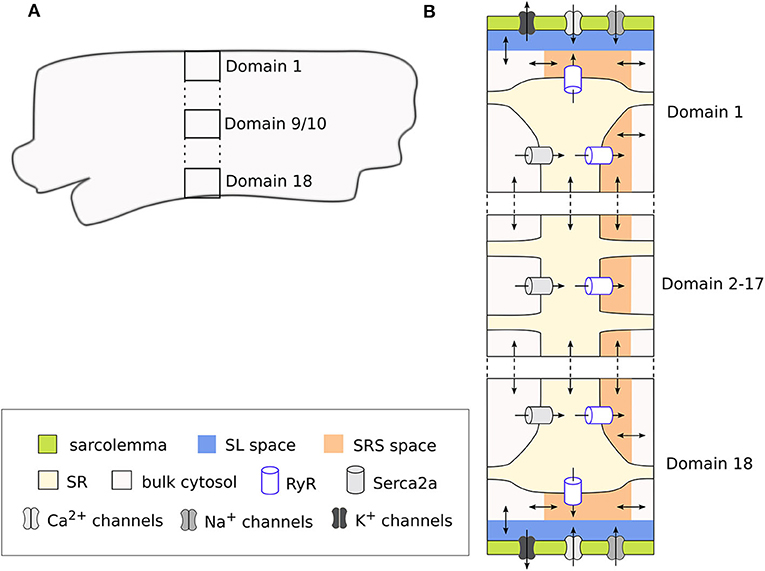
Figure 1. Schematic representation of a segment of the rabbit CM model showing the discrete cell domains and different intracellular compartments. A single segment corresponds to the cross section of the CM (A), and is composed of 18 domains. Here only 3 domains are represented for simplicity, with the vertical dots representing the omitted domains. The membrane domains (1 and 18) contain the sarcolemmal currents and Ca2+ handling system, while the inner domains (2–17) contain only the Ca2+ handling system (B). Each membrane domain contains five different compartments: cytosolic space, sarcoplasmic reticulum (SR), sub-SR (SRS) space, and subsarcolemmal (SL) spaces, which together constitute the cleft space. Ca2+ diffuses between the different compartments in the model, and between adjacent domains and segments. Because we use a deterministic RyR formulation, the model is symmetrical around the two central domains.
Because in this model Ca2+ enters the cell only through the membrane domains, CaTs in the inner domains are dependent on diffusion from the periphery. Thus, the model allows to reproduce radial gradients and possible heterogeneities in CaTs arising from local control mechanisms. The model also includes implementations of both deterministic and a stochastic RyR models. However, for the sake of simplicity, we have employed the deterministic formulation of the RyR, and thus in our simulations only one segment was simulated, since segments are identical when using the deterministic model.
The membrane model includes Ca2+ currents ICaL and ICaT; the fast Na+ current INa; repolarizing K+ currents Ito1, IKr, IKs, and IK1, as well as three background currents ICab, INab, and IClb. Additionally, the model includes the ionic currents of the Na+-Ca2+ exchanger (INCX); the Na+-K+ pump (INaK); and the plasmalemmal Ca2+ pump (ICaP). The total membrane current in the model is the sum of all these currents:
Most of the formulations were adopted from Aslanidi et al. (2009), which in turn are modifications of the formulations in Lindblad et al. (1996). We included the background chloride current (IClb) from the Lindblad et al. model, since a chloride current has been reported in rabbit atrial CMs (Kanaporis and Blatter, 2016). The formulation of INCX was taken from Voigt et al. (2014) (equations provided in the Supplementary Material), originally described in Weber et al. (2001), since we found this current to replicate more realistically the forward and reverse modes of the Na+-Ca2+ exchanger observed in the rabbit Bers (2002), as shown in Figure 2A. We tested this model component specifically by simulating a caffeine-induced Ca2+ release protocol to assess Ca2+ extrusion rate through the NCX, shown in Figure 2B. The caffeine-induced Ca2+ release protocol used was as follows: the model was paced at 0.5 Hz (after being paced to steady state) for 12 s (6 beats), and then caffeine application was simulated by increasing RyR2 activation to 1.0 over the course of 10 ms, and keeping the channels fully open for another 10 s. The effect of the caffeine was then removed by unclamping the RyR activation for 3 s. This protocol is illustrated in Figure 2C. As illustrated in Figure 2D, the normalized CaT and decay time of INCX closely matched experimental data in Greiser et al. (2014).
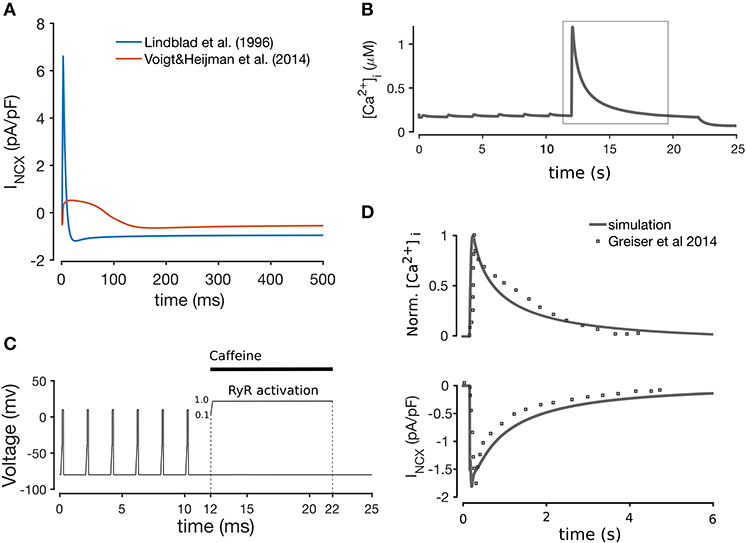
Figure 2. (A) Comparison between the Lindblad et al. (1996) and Voigt et al. (2014) models of the Na+-K+ exchanger, showing that the latter is closer to the INCX shape observed experimentally (Bers, 2002). Simulation of caffeine-induced Ca2+ release (B) using the voltage clamp protocol shown in (C), whereby application of caffeine is simulated through the instant opening of the RyRs for 10 s with subsequent closing. (D) Comparison of INCX and normalized CaT with experimental data from Greiser et al. (2014), after pacing at 0.5 Hz for 12 s, and a 10 s quiescent period.
The model's spatial description of Ca2+ and Na+ allows for these ionic species to vary between domains. Specifically, Ca2+ concentrations in the bulk cytosolic, SL, SR, and SRS spaces are updated independently in each compartment and in each model domain. Similarly, Na+ concentrations are updated separately in the SL, junc (SRS), and bulk cytosolic spaces, but the cytosolic Na+ trace is common to all domains, so that only this is updated in the inner domains. The concentrations and fluxes of Ca2+ and Na+ across the different model compartments in a membrane domain are schematically shown in Supplementary Figure 1. The mass balance equations for Ca2+ can be found in the supplementary material of Voigt et al. (2014), and the equations for Na+ are provided in the Supplementary Material.
The rabbit atrial CM model was implemented in C++, and the state equations were solved using a forward Euler scheme. All simulations were performed on the Abel computer cluster from the University of Oslo, running the Linux Operating system (64 bit CentOS 6). The source code of the model is available at https://github.com/marciavagos/Rabbit_model.git.
2.2. Parameterization of Ionic Currents
We initially implemented the model using the original published parameters from Aslanidi et al., which resulted in an action potential (AP) that was morphologically similar to experimentally measured APs, but did not match in terms of quantifiable metrics. The action potential duration at 90% repolarization (APD90) was 143 ms, which is longer than the reported 120 ms, and the resting membrane potential (RMP) was around −74 mV as compared to the −80 mV reported in literature. Additionally, the CaT amplitude (CaT-A) in the baseline model was only about 0.09 μM, compared to the ~1.0 μM amplitude in simulated CaTs by Lindblad et al. (1996), and Aslanidi et al. (2009). The model also showed a suppression of the Ca2+ signal at the center of cell. Ca2+ measurements of rabbit atrial CMs in Blatter (2017) show a partial suppression of the central CaT compared to the peripheral CaT. In contrast, measurements from Greiser et al. (2014) show a fully regenerative CaT in control rabbit atrial CMs. These differing findings seem to suggest a natural variability in the intracellular regeneration of the Ca2+ signal in rabbit atrial CMs. However, as far we know there is no evidence that complete absence of Ca2+ release in central regions is present in rabbit atrial CMs in the absence of disease-related remodeling, thus we considered this to represent an unphysiological behavior.
In order to adjust the model parameters to match reported experimental CaT and AP data (Qi et al., 1994; Muraki et al., 1995; Wang et al., 1995; Lindblad et al., 1996; Aslanidi et al., 2009; Greiser et al., 2014; Kanaporis and Blatter, 2016; Hou et al., 2018), we employed a population-of-models approach to scale the maximum conductances of the 13 ionic currents in the model. This approach is useful to perform parameter fitting, while at the same time allowing uncertainty and natural variability to be incorporated into the models (Amrita et al., 2012; Sánchez et al., 2014). We note that the populations-of-models approach is used in this work in a somewhat different context than done in previous works. While this approach has more commonly been used to incorporate variability into a “calibrated” model to either test hypotheses, or perform parameter sensitivity analysis (as done in e.g., Sarkar and Sobie, 2010; Amrita et al., 2012; Sánchez et al., 2014; Chang et al., 2015; Johnstone et al., 2016; Morotti and Grandi, 2017), here we have applied the method to parameterize the model in regard to uncertain parameters, in this case the maximum conductances. A population is constructed by randomly sampling the model parameters from specified probability distributions, thereby generating a population of several “baseline” models. For the present population, the 13 maximum conductances were varied over a range between 25 and 400% of their published values, and resampled from uniform distributions using Latin Hypercube sampling. Such a large degree of variation was chosen to incorporate as much variability as possible, allowing for the population to capture the natural variability and uncertainty in the data. The initial population consisted of 3,000 models, which were all paced at 2 Hz pacing for 2 min to ensure approximation to steady state, and then the last five beats were recorded for analysis. The varied maximum conductances and their respective nominal (published) values are listed in Table 1, and the initial ionic concentrations are listed in Supplementary Table 2.
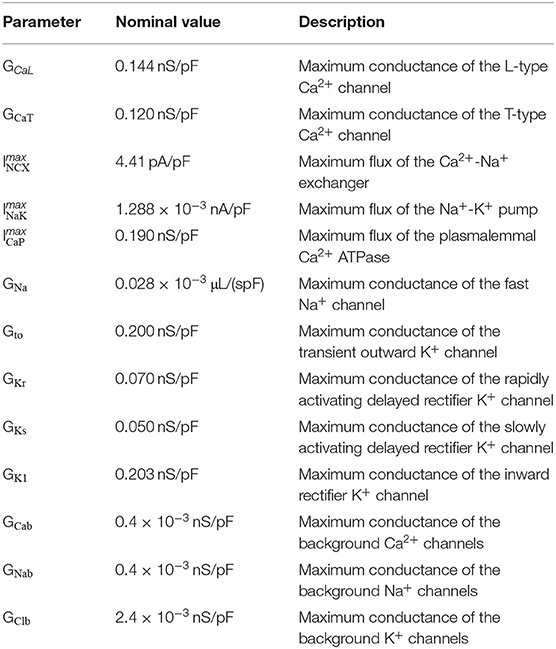
Table 1. List of the maximum conductances of the ionic currents in the model and their nominal values.
Models in the population were then selected against experimental data from measurements of rabbit APs and CaTs to select models whose APs and CaTs represent typical rabbit-like morphology (Qi et al., 1994; Muraki et al., 1995; Wang et al., 1995; Lindblad et al., 1996; Aslanidi et al., 2009; Greiser et al., 2014; Kanaporis and Blatter, 2016; Hou et al., 2018).
Finally, uncertainties of output measures of APs and CaTs were defined through the mean and standard deviation (std).
2.3. Model Selection
Since we allowed a large degree of variation in the model parameters, the initial population included a number of non-physiological models. The second step of the population-of-models approach was to select a subset of models that matched previous experimental recordings, to create a control population. Experimentally measured APs of rabbit atrial CMs reported in literature are rather inconsistent. For instance, Muraki et al. (1995), and Wang et al. (1995) recorded APs with APD90 values of 93 and 103 ms, respectively, while Yamashita et al. (1995) reported 70 ms. Lindblad et al. (1996) reported a similar APD90 of 80 ms at 2 Hz, while more recent studies have reported higher values. Greiser et al. (2014) measured APD90 in rabbit CMs paced at 2 Hz between 100 and 140 ms, in agreement with the 130 ms Hou et al. (2018) at 1 Hz. APD50 measured in Wang et al. (1995) and Hou et al. (2018) was 44 (at 2 Hz) and 55 ms (at 1 Hz), respectively, while in Yamashita et al. (1995) this was about 18 ms in the crista terminalis, and 38 ms in pectinate muscle CMs. Additionally, APD40 in Qi et al. (1994) was 30 ms in left atrium, and 51 ms in right atrium at 1 Hz. APD20 in Hou et al. (2018) was also between 13 to 17 ms. Given this wide range of reported APD50 and APD40 values, we required APD40 to be between of 20 and 60 ms.
AP amplitude (APA) has been reported at around 100 mV (Qi et al., 1994; Muraki et al., 1995; Aslanidi et al., 2009; Hou et al., 2018), and 120 mV (Lindblad et al., 1996; Kanaporis and Blatter, 2016). Reported values of RMP are more consistent across sources, with most reporting around -80 mV (Qi et al., 1994; Muraki et al., 1995; Yamashita et al., 1995; Aslanidi et al., 2009; Greiser et al., 2014; Hou et al., 2018), although Lindblad et al. reported an RMP of -71 mV (Lindblad et al., 1996). Given this heterogeneity of measured electrophysiological properties of CMs, there is no single generic model of an atrial cell, which motivated our choice of a population-of-models approach to parameterize the model.
To our knowledge, absolute values of intracellular Ca2+ levels have only been reported by Kettlewell et al. (2019), who measured an average diastolic and systolic [Ca2+]i, and CaT amplitude of about 0.07, 0.57, and 0.51 μM, respectively. Additionally, Lindblad et al. (1996) assumed a resting Ca2+ of 50 nM, and peak Ca2+ levels in their model simulations were within ~0.1 and ~1.0 μM. CaTs measured from fluorescence imaging of rat (Mackenzie et al., 2001, 2004) and human (Voigt et al., 2012, 2014) atrial CMs also show amplitude values in this range. Therefore, we excluded models whose whole-cell CaT amplitude was outside this range. The rise time of the CaT was also constrained to be no larger than 100 ms at 2 Hz pacing (Greiser et al., 2014). Additionally, [Na+]i was constrained to be between 6.5 and 12.5 mM, which corresponds to reported values in rabbit atrial cells (Hilgemann and Noble, 1987; Greiser et al., 2014). Finally, models showing early after-depolarizations (EAD) and alternans were also manually excluded.
These experimental metrics are compiled in Table 2 for convenience, and the output properties and corresponding value ranges considered in the selection of the models are listed in Table 3. These properties were determined as the average of the values calculated for the five recorded beats.
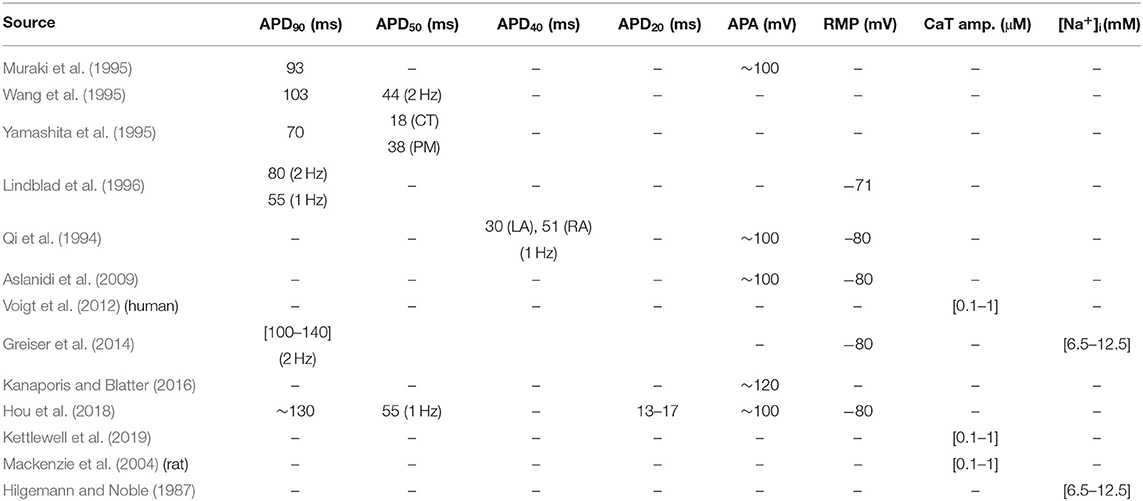
Table 2. Experimental values of electrophysiological parameters obtained from literature.
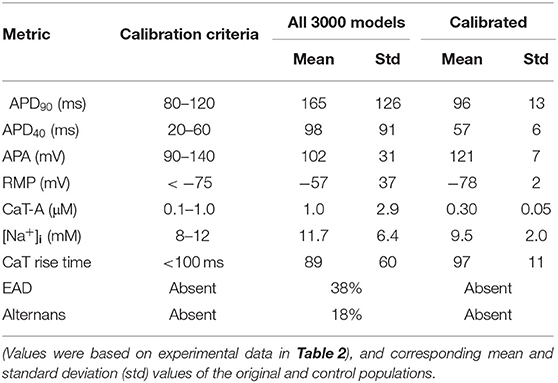
Table 3. Values of electrophysiological parameters used for selecting models in the control population.
2.4. Analysis of Calcium Wave Propagation
The primary focus of this paper is on Ca2+ dynamics, and the Ca2+ signal and wave dynamics were subject to a more extensive analysis than the other output variables. Spatio-temporal plots of Ca2+ dynamics, resembling line-scan plots of Ca2+ fluorescence, were created to asses the radial propagation of Ca2+. More detailed analysis of spatial variations in Ca2+ signal morphology was done by comparing plots of the cytosolic CaTs (Cai) in the membrane domains (domains #1 and #18), and in the central domains (domains #9 and #10). The membrane and central CaTs are denoted as CaTm and CaTc, respectively. When using deterministic RyR formulations, the model is symmetric about the cell center, resulting in identical CaTs in domains 1 and 18, as well as in domains 9 and 10. Whole-cell CaTs were also obtained as the mean bulk cytosolic CaTs of the 18 domains.
Additionally, we extracted and analyzed a number of relevant metrics that characterize CaTm and CaTc traces at steady state (20 min pacing). Specifically, we analyzed the rise time (measured from onset of the CaT to peak), duration at 50% decay (CD50), and amplitude, in addition to the time difference between peaks of CaTc and CaTm, as measured from AP onset (CaTdelay), represented schematically in Figure 3. The Ca2+ metrics presented were again determined as the average of the values calculated for the last 5 beats.
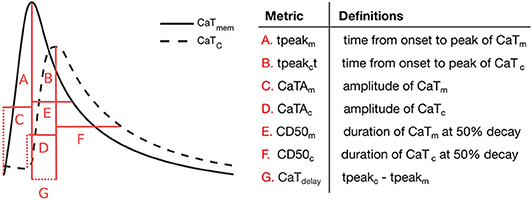
Figure 3. Ca2+ transient metrics defined to compare peripheral and central CaT traces, and corresponding descriptions.
We additionally extracted CaSR and [Na+]i traces to analyse in relation to the other CaT metrics. In our analyses, we determined CaSR and [Na+]i as the mean value during each beat, with CaSR corresponding to the average over all cell domains.
Finally, we performed correlation analysis to identify significant correlations between selected model parameters and output variables. We analyzed the correlations between the maximum ion channel conductances and the Ca2+ metrics defined above, as well as correlations between the Ca2+ metrics in the membrane domains and in the central domains, and between CaSR and [Na+]i and the central Ca2+ metrics. The correlations were determined using Kendall's tau (τ), since the variables followed discrete distributions. Significance was determined with 95% confidence, and all data analyses were performed in Matlab R2017a employing custom routines.
3. Results
3.1. Population of Models
Varying the maximum conductances between 25 and 400% resulted in an initial population of 3,000 models with a large degree of variation in AP and CaT properties. Calibration of the population by constraining output values to the ranges in Table 3 resulted in the selection of 16 out of 3,000 models. Restricting values of APD90, APD40, and CaT-A was responsible for excluding the majority of models, with 175 models satisfying the requirements for these three parameters. Mean and standard deviation of APD90, APD40, APA, RMP, CaT-A, [Na+]i, and CaT rise time for the original and control populations are shown in Table 3. EAD and alternans in the entire population are shown as % of occurrence.
The APs and CaTs of the control population are shown in Figures 4A,B. Although the model selection step obviously reduced the variability in APs and CaTs, the maximum values of the ionic conductances retained a relatively large range of variation. Only six of the thirteen varied maximum conductances showed significantly reduced variation in the control as compared to the whole population (GCaL, , GNa, GKr, GKs, and GClb). The reduced variability in these six parameters was found to be significant (two-sample Kolmogorov-Smirnov test, α = 0.05), and the distributions are illustrated in Figure 5. This indicates that these ion currents affect the rabbit AP and CaT morphology to a larger extent than the other conductances, and also that these parameters are easier to constrain and identify using the considered metrics.
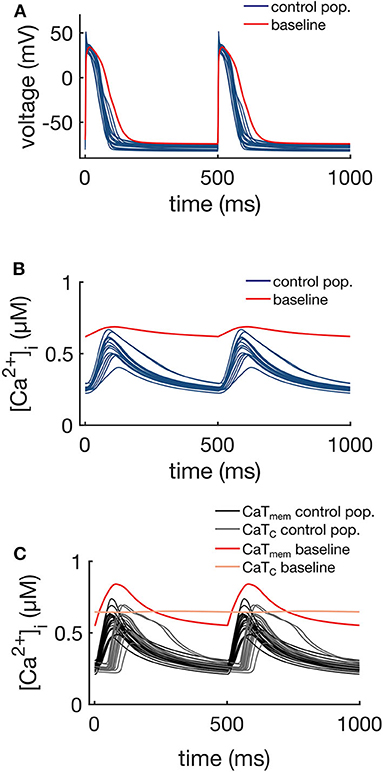
Figure 4. APs (A), whole-cell CaTs (B), and membrane (CaTm) and center of cell (CaTc) CaTs (C) of the control population (16 models), at 2 Hz steady pacing. The red traces represent the baseline model with the original maximum conductances shown in Table 1.
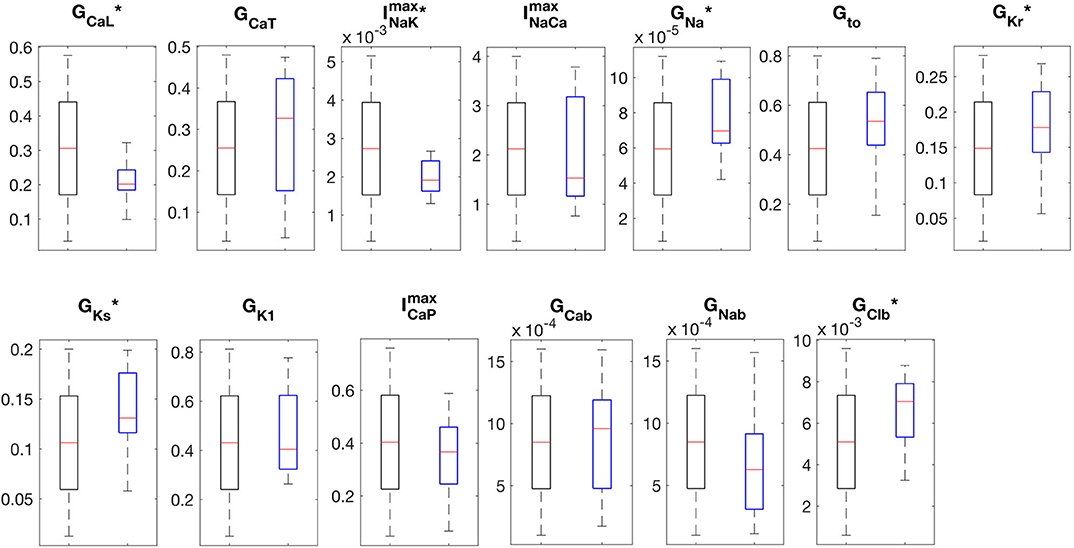
Figure 5. Boxplots of the distributions of maximum conductances. The “*” indicates distributions that were significantly different between the original (black boxes, n = 3000) and control populations (blue boxes, n = 16) (Kolmogorov-Smirnov test, p-val < 0.05).
Figure 4C shows the CaTm and CaTc traces of the control population. As expected, the Ca2+ signals at these two different locations showed differences in morphology, resulting from the differences in the underlying mechanisms driving the signal. The membrane signal CaTm results from a combination of Ca2+ entering the cell via ICaL and Ca2+ released from junctional CRUs, while the central signal CaTc is the Ca2+ released from non-junctional CRUs via CICR as a result of Ca2+ diffusing from neighboring domains. The CaTc is therefore initiated with a time delay in comparison to CaTm, which corresponds to the diffusion time of Ca2+ from the periphery to the central regions of the cell.
3.2. Calcium Dynamics and Wave Propagation
The values of the Ca2+ metrics for 16 models are shown in Table 4. Both the rise time and CD50 were significantly different between the CaTm and CaTc traces (two-sample Kolmogorov-Smirnov test, α = 0.05), with no significant differences in the amplitudes of CaTm and CaTc, which is consistent with findings in control atrial CMs (Greiser et al., 2014). The CaTc showed a shorter tpeak (time to peak from central AP onset) and a longer CD50 than CaTm. Furthermore, CaTdelay in the population was 42 ± 12 ms, which matches the 52 ms time delay measured from line scans of rabbit atrial CMs (Greiser et al., 2014). While CaSR was fairly consistent across the 16 models (0.30 μM), [Na+]i showed a large degree of variation among models.
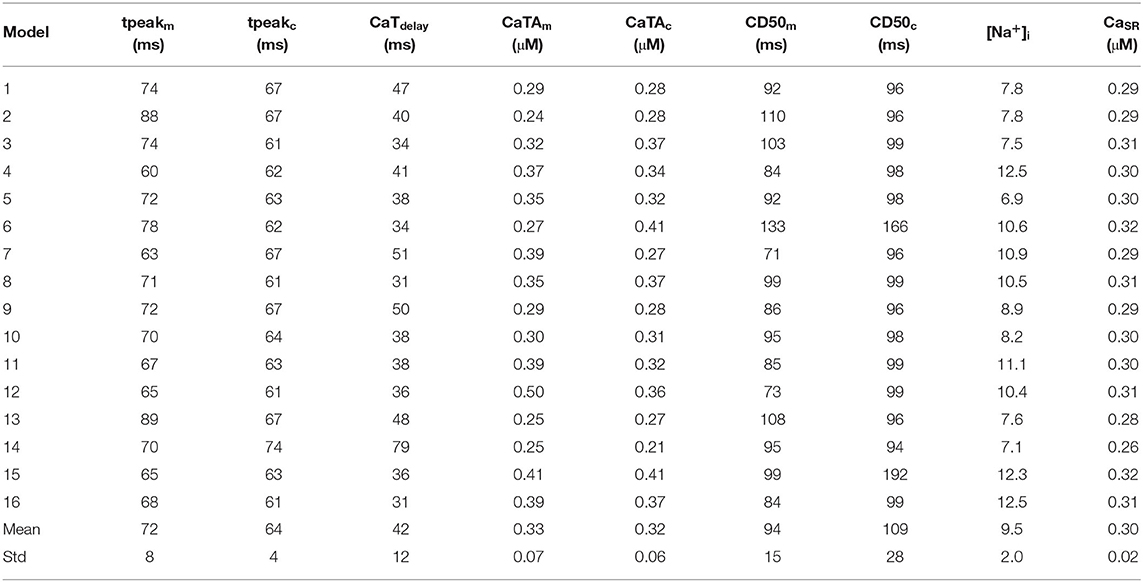
Table 4. Values of the Ca2+ metrics obtained from the control population.
All 16 models of the control population showed similar Ca2+ wave propagation patterns with physiological characteristics under normal conditions, including full regenerative propagation, delayed CaTc, and steady CaTs over time. However, despite the similarities there were also measurable differences in the propagation patterns, as characterized by the Ca2+ metrics defined above and by plots of the spatio-temporal Ca2+ dynamics. Three representative Ca2+ wave propagation patterns (models 1, 15, and 7 in Table 4) are also shown in Figure 6. Model #1 corresponds to a CaTdelay very close to the average, and with similar CaTAm and CaTAc; model #15 shows a shorter CaTdelay, and slowed CaTc decay; and model #7, in turn, showed a slightly longer CaTdelay, but a damping of CaTc.
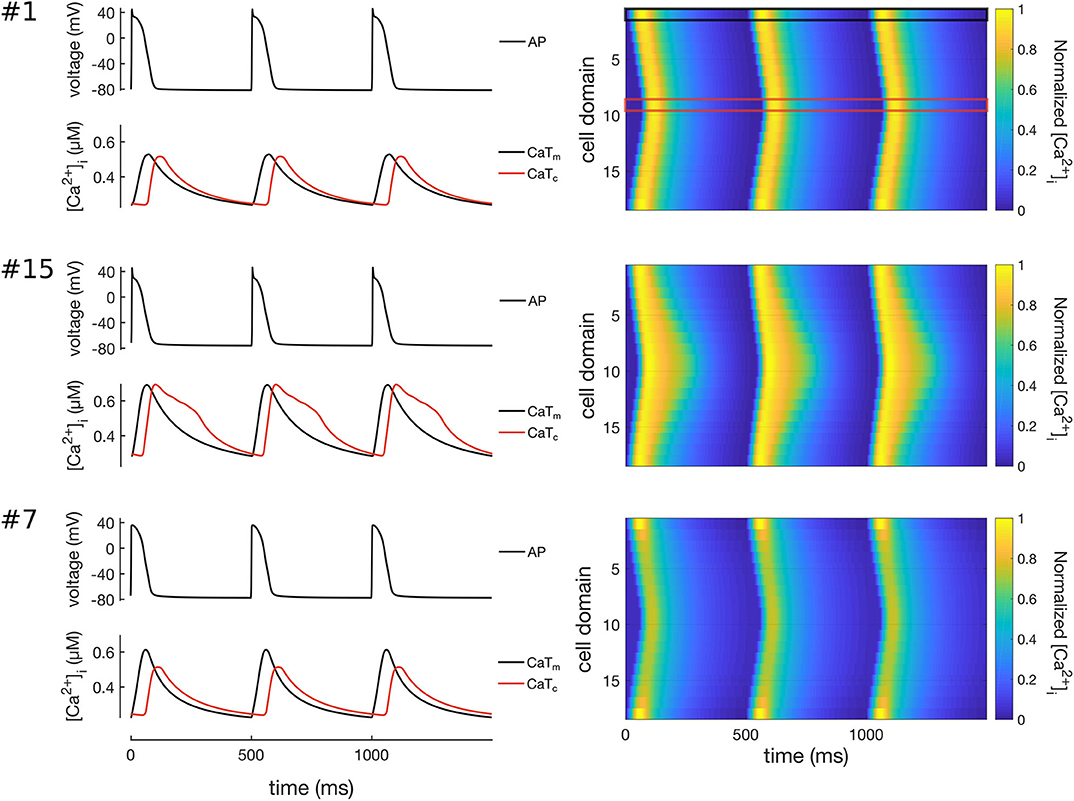
Figure 6. Simulation of Ca2+ waves in three representative models of the control population (models #1, #7, and #15). Traces on left hand-side show the APs (top), CaTs (bottom) at the membrane (CaTm, black lines) and centre of cell (CaTc, red lines). The right hand-side of the Figure shows line scans of propagating Ca2+ waves in 3 simulated beats at 2 Hz pacing. The black and red boxes on the top-right panel show the domains corresponding to the CaTm and CaTc traces. Model #1 shows a propagating Ca2+ wave where CaTm and CaTc have rather similar morphologies; model #15 shows a Ca2+ wave with slightly larger CaTdelay; and model #7 shows a wave patterns with decreased CaTAc as compared to CaTAm.
We also noted that models #6 and #15 showed a biphasic CaTc decay, with a distinct Ca2+-wave pattern as compared to all the other models in the control population. The most likely candidate mechanism is a reduced Ca2+-extrusion rate, which causes cytosolic Ca2+ to accumulate in the inner domains.To investigate this mechanism we first compared the maximum conductances of ICaL, ICaP, INCX, and INaK in the two models. We noticed that the models corresponded to two distinct combinations of the maximum conductances of these four ionic currents, which suggests that the mechanisms underlying the prolonged CaTc might be different.
Model #6 showed a combination of reduced peak magnitude of ICaL, INaK, INCX, and slightly reduced peak ICaP (despite a large ). In contrast, model #15 showed reduced peak INaK and ICaP, only slightly reduced INCX, and increased ICaL. Thus, the common characteristic in the two models was a low INaK magnitude. An interesting observation is that in model #6 the magnitude of INCX was reduced, yet to a lesser extent than , which means that in this model the increased [Ca2+]i still resulted in an enhancement of INCX. A possible mechanism in model #6 may be simply the reduced which resulted in [Ca2+]i accumulation and the observed prolongation of CaTc. In model #15, however, the mechanism seems to be different, possibly the reduced INaK resulted in an accumulation of [Na+]i, which further reduced the activity of INCX, and consequently increased [Ca2+]i prolonging CaTc. This was paralleled by a smaller extrusion via ICaP.
In order to investigate the role of INaK and INCX in the decay of CaTc, we gradually increased the values of and individually. The results of these simulations are shown in Figures 7, 8. As can been seen from these results, increasing either or decreased the CaTc decay time, abolishing the biphasic decay behavior, although at different thresholds for each of the models. In model #6 the threshold for transition from biphasic to monotonic decay occurred at 80% increase of and 120% increase of , whereas in model #15 the transition occurred at 82 and 54% increase of and , respectively. Although these results do not allow to discern the relative contribution of INCX and INaK to the prolongation and biphasic behavior of CaTc decay due to the small number of observations, they do seem to indicate that these two currents play a major part in determining the decay of CaTc, as is expected given their role in regulating [Ca2+]i.
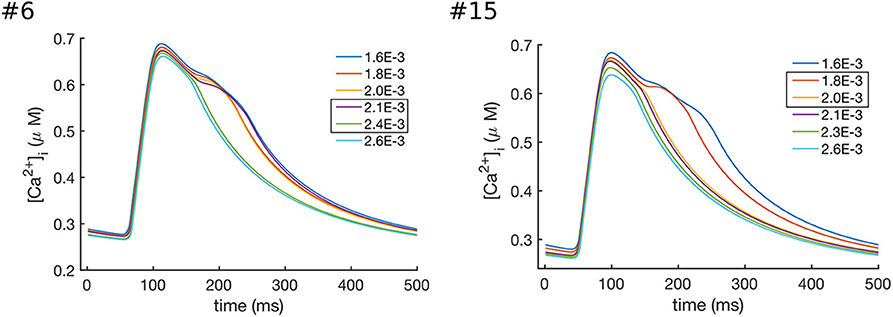
Figure 7. Effects of increasing the values of in models #6 and #15, which resulted in the enhanced Ca2+ extrusion and a faster CaTc decay. In model #6 the transition between the biphasic and smooth CaT profile occurred at values of between 2.1 × 10⁻³ and 2.4 × 10⁻³ ns/pF, while in model #15 the transition occurred at values between 1.8 × 10⁻³ and 2.0 × 10⁻³ ns/pF.
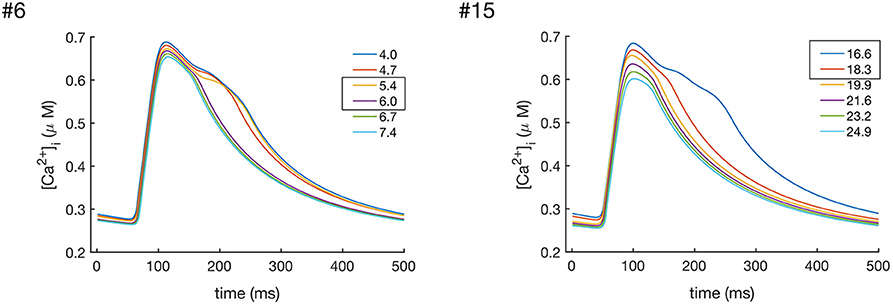
Figure 8. Effects of increasing the values of in models #6 and #15, which resulted in the enhanced Ca2+ extrusion and a faster CaTc decay. In model #6 the transition between the biphasic and smooth CaT profile occurredat values of between 5.4 and 6.0 nS/pF, while in model #15 the transition occurred at values between 16.6 and 18.3 nS/pF.
3.3. Correlation Analysis
We next analyzed the correlations between the maximum conductances of individual currents and the Ca2+ metrics defined in Figure 3. The results are summarized in Table 5, where significant correlation coefficients (p-value < 0.05) are highlighted in bold. Our analyses reveal that the Ca2+ wave properties of these 16 models were primarily sensitive to GCaL, , and . The L-type Ca2+ channel conductance GCaL showed a negative correlation with CD50m, but not with CaTAm and CaTAc. was negatively correlated with tpeakm and CD50m, which is the expected given role of INCX in Ca2+ extrusion. was also positively correlated with CaTAm, possibly because larger CaTs increase NCX activity. However, did not affect CaTdelay. Finally, we found to be negatively correlated with CaTAc and CD50c, indicating that a larger INaK current resulted in a smaller CaTc signal.
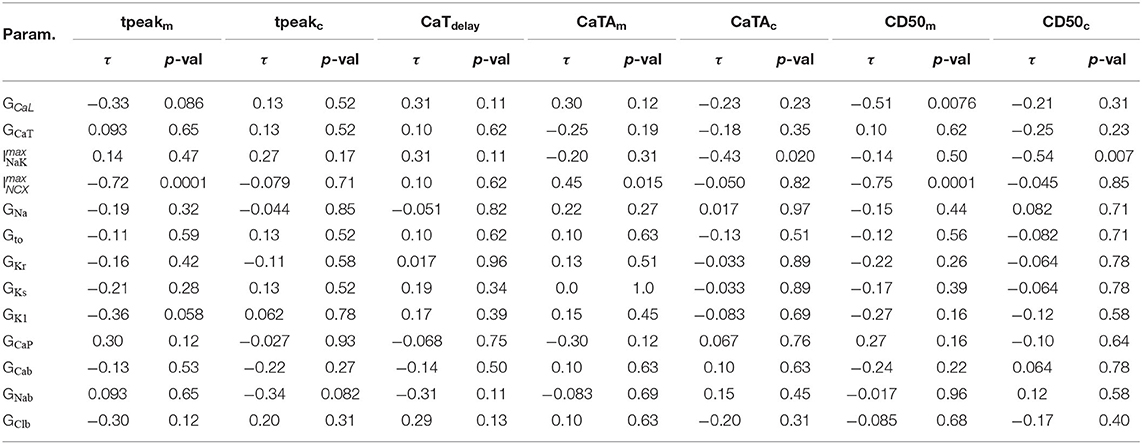
Table 5. Kendall's τ and corresponding p-values of the correlations between maximum conductances and CaTm and CaTc properties.
The correlation among the seven Ca2+ metrics, [Na+]i, and CaSR are compiled in Table 6, with significant correlation coefficients (p-value < 0.05) highlighted in bold. We observe that CaTdelay which was not sensitive to any of the ion current conductances, was strongly correlated with CaSR. We also found [Na+]i to be correlated with tpeakm, CaTAm, and CD50c. Furthermore, we observe that the individual Ca2+ metrics related to CaTm and CaTc were in general not correlated, except for CaTAm which was correlated with tpeakc, and CD50c, while CaTdelay was strongly correlated with all CaTc properties, tpeakc, CaTAc, and CD50c. The three Ca2+ metrics trise, CD50, and amplitude, were correlated for both CaTm and CaTc, as expected (data not shown).
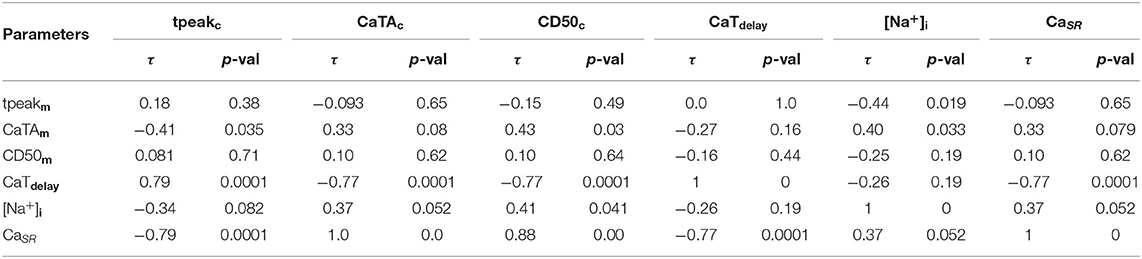
Table 6. Kendall's τ and corresponding p-values of the correlations between CaTm and CaTc properties, [Na+]i, and CaSR.
4. Discussion
We have developed a model of a healthy atrial CM with rabbit-specific EP and spatially distributed Ca2+ dynamics. The central motivation for developing the model was to be able to describe radial diffusion of calcium, which is important for the investigation of the effects of asynchronous Ca2+ release on arrhythmic activity in atrial CMs lacking TTs. We used a population-of-models approach to parameterize the maximum conductances of sarcolemmal ion currents to produce a pool of models that matched reported experimental data from the rabbit atria. The result was a population of 16 models that were all consistent with observed experimental values, but still recapitulated observed variability in Ca2+ wave characteristics.
The small number of models selected by the experimental data shows that imposing a sufficiently large number of constraints in model outputs (in this case, eight parameters) can reduce the parameter space to discrete sets of parameterizations, each following a unique trajectory. This shows that rather different parameter combinations can result in models with very similar behaviors (see Figure 4 and Supplementary Table 3, highlighting the non-uniqueness of CM models, a consequence of the compensatory effects of ionic currents (Sarkar and Sobie, 2010; Zaniboni, 2011; Muszkiewicz et al., 2018). Nonetheless, the model selection step significantly reduced the variability in six of the maximum conductances, as seen in Figure 5, indicating that the electrophysiology and Ca2+ metrics used in the model selection step were, in general, sensitive to these maximum conductances.
It is worth noting that the data used here to constrain the model were obtained from a large assortment of published experimental data. Therefore, the 16 models of the control population reflect not only the natural variability observed within different atrial regions, but also experimental uncertainties inherent to methodologies used by different research groups. The population-of-models-based approach we used here contrasts with the more standard approach, wherein a computational model is fitted to a small set of experimental observations, often obtained from a single atrial region, to yield a single model parameterization that captures the average behavior in the experimental data. Although useful for assessing the mechanisms underlying general characteristic behaviors of the model, the single-parameter approach lacks the ability to reproduce experimental observations from a range of data. In contrast, incorporating variability into the model via the population-of-models-based approach employed here allows a generalization of model results to a wider set of conditions and phenotypes.
4.1. Correlations Analysis
The seven extracted Ca2+ metrics from CaTm and CaTc quantify differences in the Ca2+ wave properties across the 16 models. Correlation analysis showed that GCaL and and were the only maximum conductances significantly affecting Ca2+ wave propagation in the model. This result is consistent with the known role of these ionic currents in intracellular Ca2+ regulation. For instance, experimental observations have shown the role of increased sarcolemmal Ca2+ in modulating the regenerative propagation of the Ca2+ signal toward the inner locations of the cell (Mackenzie et al., 2004).
The strong correlation between and CaTm metrics indicates a strong modulating effect of INCX on Ca2+ dynamics at the cell membrane. The importance of the role of INCX on modulation of Ca2+ dynamics during the AP is well-documented both experimentally, and through computational simulations (Hilgemann et al., 1992; Sher et al., 2008; Xie et al., 2015). Furthermore, since INaK affects [Na+]i homeostasis, which in turn affects INCX function, it is not surprising that INaK was correlated with CaTAc and CD50c. However, it is somewhat unexpected that INaK was more strongly correlated to the CaTc than to CaTm properties.
The observed correlations between CaTAm and tpeakc and CD50c indicates that the rate of Ca2+ release and uptake in the CRUs is modulated to some extent by the amount of Ca2+ that enters the membrane and initiates CICR. We also observed that CaTdelay was correlated to tpeakc, CaTAc, and CD50c, which indicates that the velocity of Ca2+ wave propagation was mostly modulated by the dynamics of the regenerative propagation of the Ca2+ signal along CRUs, and not by the amount of Ca2+ entering via the cell membrane. CaTdelay measures the time for the Ca2+ wave to propagate to the innermost cell domains which depends on the strength and rate of the regenerative CICR. This also determines the shape of the local CaTs in each inner domains. Therefore, it is expected that CaTdelay co-varies with the CaTc properties, but not with the CaTm properties.
The observation that CaTdelay strongly correlated with CaSR is not unexpected, since a higher SR Ca2+ load would naturally promote a faster rise of the CaT at inner domains (smaller tpeakc), and thus reduce CaTdelay, while simultaneously promoting a longer CaT duration (larger CD50c). The observed correlation between Ca2+ metrics and [Na+]i is also expected since [Na+]i plays a significant role in the modulation of NCX function, and therefore in the regulation of the sub-sarcolemmal Ca2+ signal (Hilgemann et al., 1992; Sher et al., 2008; Xie et al., 2015).
Overall the results of the correlation analyses presented here are in good agreement with our understanding of Ca2+ handling dynamics in atrial CMs, and provide additional insight into the mechanisms driving Ca2+ wave propagation in the newly developed model taking into account population variability.
4.2. Limitations and Future Directions
It is important to note that the conclusions derived from the analyses presented here are limited by the experimental data that was used in the model selection step. In particular, the lack of quantitative measurements of intracellular Ca2+ makes it difficult to validate the model predictions of the spatial characteristics of the Ca2+ dynamics. The correlation analysis used in this paper also has its own limitations and assumptions. For instance, simultaneously varying parameters to build the population can lead to interaction effects, which can mask the individual contributions of each varied parameter. The analyses presented here can be extended by, for example, determining multivariate correlations. This would require increasing the sample size to allow for a more robust regression analysis of the parameters. A way to achieve this would be by constructing new models by perturbing the parameters around the values that originated the 16 models. Alternatively, partial correlations can be determined by removing the effect of collinearity of variables.
Furthermore, the developed pool of normal rabbit atrial CM models can be used to study the effects of altered Ca2+ handling parameters, such as Ca2+ release and uptake from the SR, and Ca2+ buffering strength on Ca2+ wave propagation dynamics. Variability in these parameters will likely have a stronger modulating effect on the Ca2+ wave metrics studied here than the ionic currents, and thus constitute a natural extension of the present work.
Another relevant model limitation is the use of a deterministic RyR model, which implicitly assumes homogeneous distribution and behavior of CRUs. Therefore, this simplification does not include stochastic Ca2+ release events and subcellular fluctuations in calcium-handling proteins, which may influence the results (Sutanto et al., 2018) and limit the applicability of the model to describe pathological conditions. Using a stochastic formulation would allow the incorporation of spatial heterogeneity in Ca2+ release, which constitutes an important trigger for spontaneous Ca2+ waves, and consequently for abnormal Ca2+-wave propagation patterns. The current model implementation has limited ability to describe these events, but it can easily be extended to a stochastic RyR model to address the role of Ca2+ release stochasticity in Ca2+ wave dynamics. Additionally, the model can easily be extended to incorporate additional layers of intra- and inter-cellular variability, including TT structures.
We also recognize that the Ca2+-handling model from the Voigt et al. (2014) has the intrinsic limitations of not being specific to spatial Ca2+ distribution in rabbit atrial CMs. Previously developed atrial CM models with rabbit-specific Ca2+ handling include the models from Hilgemann and Noble (1987) and from Lindblad et al. (1996). Hilgemann and Noble (1987) proposed a 4-state model of the Serca pump with a component dependent on SR Ca2+ to incorporate Serca regulation by luminal Ca2+. Lindblad et al. (1996) modified this formulation to take into account additional experimental observations, Ca2+ buffering, and to adjust graded Ca2+ release and CICR in the model. The Shannon rabbit ventricular CM model (and our model), in turn, uses a bi-directional Hill equation with affinity for cytosolic and SR Ca2+, although the formulation used here (from the Voigt & Heijman model) had been adjusted to human atrial CM data. Additionally, Ca2+-release in Hilgemann and Noble (1987) is modeled as a simple function of SR Ca2+ concentration, while in Lindblad et al. (1996) this formulation was modified to also take into account cytosolic Ca2+. On the other hand, the Shannon model and our model use a 4-state Markov Model that allows to simulate local control of Ca2+ release. Hilgemann and Noble (1987) and Lindblad et al. (1996) used essentially the same formulation for the Na+-Ca2+ exchanger, while both the Shannon and our model use a similar formulation for INCX with additional terms to reflect Na+ and Ca2+ dependence. Thus, given the differences in Ca2+ handling formulations in the various models, it is fair to say that there is considerable uncertainty regarding which model structure is the most appropriate, especially also because of the limited amount of data on Ca2+ handling in rabbit atrial CMs. Future work should investigate how these different Ca2+ models reflect overall Ca2+ dynamics in rabbit atrial CMs by comparing Ca2+ wave propagation patterns. We note that, to the best of our knowledge, this study is the first attempt at providing a systematic approach for analyzing intracellular Ca2+ wave propagation in a rabbit atrial cardiomyocyte model with spatial Ca2+ handling.
We also note that RyR density in the model should be adjusted to reflect the smaller size of rabbit as compared to human atrial CMs. The model assumes a transversal spacing of 0.7 μm, which is smaller than the 1 μm spacing assumed in the original Voigt & Heijman model. This is an important consideration since the number of RyR has a direct impact on the amplitude of the cytosolic Ca2+ signal and on Ca2+ diffusion, and consequently on Ca2+ wave propagation dynamics. An overestimation of these parameters may result in exacerbated Ca2+ propagation which does not necessarily reflect physiological Ca2+ diffusion. Nevertheless, the model can also be simulated with fewer domains. Thus, further developments of the model should address this by adjusting RyR density and Ca2+ diffusion parameters, and Ca2+ diffusion properties should be validated against rabbit data, for example as done in Sutanto et al. (2018).
Another important consideration is the effect of TTs on atrial CM Ca2+ cycling. Although a general absence of significant TT networks has been reported in rabbit atrial CMs (Tidball et al., 1991; Blatter, 2017), a large regional variability in TT density across the atria, as well as the presence of axial TTs has been observed in various species, with corresponding variability in Ca2+ release synchrony profiles (Richards et al., 2011; Frisk et al., 2014; Brandenburg et al., 2018). Thus, the implications of considering TT networks in atrial myocytes should be discussed in more detail here. Several computational studies have explored the role of TTs in modulating intracellular Ca2+ propagation and disturbances. For example, Nivala et al. (2015) studied the effects of spatial heterogeneity in LTCC distribution and [Na+]i on Ca2+ alternans propensity in a model with three-dimensional diffusion. Their results showed that TT disruption did not cause Ca2+ alternans by itself but promoted their occurrence and lowered the onset threshold when acting in concert with increased [Na+]i (which increased Ca2+ load), and down-regulation of Serca (together with increased [Na+]i), with alternans amplitude increasing with increasing percentage of TT disruption or [Na+]i. This study emphasized not only the role of the spatial distribution of LTCCs in the generation of alternans, and thus the importance of considering spatial heterogeneity of Ca2+ cycling, but also the role of regulating [Na+]i on abnormal intracellular Ca2+ propagation.
Colman et al. (2017) performed a similar study on a model with 3D spatial Ca2+ cycling with variable TT density, showing that decreased TT density correlated with increased propensity for Ca2+ alternans. Their simulations with patchy TTs also showed observable spatial Ca2+ gradients leading to the formation of intracellular Ca2+ waves at the sites with no TTs and of delayed after depolarizations. In a similar study, Song et al. (2018) also presented a 3D spatial model of Ca2+ incorporating different TT architectures, which showed an increased incidence of Ca2+ alternans and intracellular Ca2+ wave formation in non-uniform random TT networks, as compared to uniform networks.
Marchena and Echebarria (2018) also developed a model of intracellular spatial Ca2+ distribution, but using a different framework based on a submicron resolution grid of points, allowing for a more refined description of CM subcellular structure with transverse TTs at the z-lines. At the membrane level, RyR and LTCC clusters are distributed at regular intervals, whereas inside the CM the RyR clusters follow a Gaussian distribution centered at the z-line, with only some of the grid points containing CRUs. Furthermore, they defined cytosolic, SR, and buffer-bound Ca2+ concentrations for each grid. Interestingly, their simulations showed an almost complete absence of Ca2+ signal at the center despite their model accounting for TTs. A later study by the same authors (Marchena and Echebarria, 2020) where the same model was used but incorporating variable lengths and distributions of both transverse and axial tubules emphasized the role of these structures on spatial Ca2+ propagation, showing a progressive enhancement and synchronization of the Ca2+ signal at the cell center with increasing TT density.
Biophysically detailed models of CM ultrastructure with spatially-realistic RyR distribution are also important for understanding structure-function relationships in Ca2+ handling. Rajagopal et al. (2015) and Ladd et al. (2019) developed such a model for the rat ventricular CM integrating spatial information from high-resolution imaging that included RyR, myofibrils, and mitochondria, and examined the role of these structures on Ca2+ dynamics in a CM cross-section. They showed that incorporating spatially-realistic distribution of RyRs in the model captured the spatial Ca2+ heterogeneities observed in line scans. Their simulations also suggest that modeling mitochondria as passive barriers to Ca2+ diffusion also introduces heterogeneity in the local CaTs, although to a lesser extent than RyR. These findings further suggest that local distribution of Ca2+ re-uptake may also have important consequences for the spatial Ca2+ handling, and highlight the importance of considering CM ultrastructure in studying Ca2+ diffusion properties.
The effect of adding axial TTs to the Voigt & Heijman human CM model was also studied by Sutanto et al. (2018). Their simulations with variable axial TT density and distribution shows a progressive synchronization of the intracellular Ca2+ release in the radial direction. Additionally, their results suggested an increased incidence of spontaneous Ca2+ release events when incorporating axial TTs, with the events originating primarily at the RyR clusters adjacent to the axial TTs. Holmes et al. (2018) also presented a model of the rabbit atrial CM implementing the Aslanidi et al. (2009) AP model and the three-dimensional stochastic Ca2+ handling model with Ca2+ diffusion terms developed by Colman et al. (2017). The latter was based on real geometries and intracellular ultrastructures extracted from sheep ventricular CMs, but otherwise implements a very similar Ca2+ handling model as ours and other models. The Holmes et al. (2018) model allowed to simulate the effects of TTs and intracellular Ca2+ heterogeneities in spontaneous Ca2+ waves. Of note, in their simulations with the fully detubulated model, the CaT morphology was similar to the whole-cell CaT produced by our model, although with a lower diastolic Ca2+ level. The CaT delay between the periphery and the center is about 75 ms, ca. 20 ms longer than in our simulations. Although an important result, showing that increased detubulation indeed results in a slowed Ca2+ wave propagation, which is in agreement to experimental data, the model was not adjusted to match rabbit specific cellular ultrastructure and intracellular Ca2+ diffusion. However, their work does point out the influence of Ca2+ dynamics stochasticity on AP shape, although it is not clear from their study how introducing stochasticity in the Ca2+ model affected wave propagation. Together these results show that TTs, and in particular axial TTs in atrial CMs, have great importance in modulating intracellular Ca2+ propagation and potentially play a role in Ca2+ alternans and triggered activity. As such, computational models of atrial CM with spatial Ca2+ handling are an essential tool to improve our understanding of Ca2+-handling abnormalities in atrial pathophysiology.
Given the wide range of variation of the maximum conductances in the control population (see Figure 5), and the fact that the models were selected entirely based on AP and CaT characteristics, it is natural to ask whether individual ionic currents of the models are in physiological ranges. We have compared simulated I-V curves of ICaL, INa, Ito, IK1, and IKr for the 16 models against experimental data reported by Aslanidi et al. (2009), and Muraki et al. (1995), as well as dynamic current traces from our model population with the Aslanidi model (at steady state at 2 Hz pacing). I-V curves and dynamic current traces are also shown in Supplementary Figures 2, 3, while peak current values are reported in Supplementary Table 4. We observe that the I-V curves are qualitatively similar to the experimental data. Although the range of variation is large, the magnitudes of CaL (−13.9 to −4.3 pA/pF) and to (3.4 to 16.6 pA/pF) are approximately within ±50% of the experimental values (ICaL: −7 to −8 pA/pF, Ito: 8 to 13 pA/pF, Aslanidi et al., 2009). Reported experimental values of peak IK1 are between 4 and 5 pA/pF (Aslanidi et al., 2009), whereas the largest peak IK1 in our population of 0.6 pA/pF, which is similar to the peak IK1 observed in the Aslanidi model, at 0.66 pA/pF. INa, however, was considerably higher in our population (between −737 and −291 pA/pF) as compared to the experimentally reported value of −70 pA/pF. We note, however, that peak dynamic INa we obtained from the Aslanidi model was −120 pA/pF. Peak IKr values (0.45–2.1 pA/pF) in our population were also in general considerably larger than the reported experimental value of 0.7 pA/pF (Muraki et al., 1995), assuming a cell capacitance of 50 pF). Peak IKr in the Aslanidi model was 0.43 pA/pF, which is close to the experimental value.
We also note that variability in experimental recordings of ion currents is typically very large, and ideally this should have been taken into account in the validation of the population. Nevertheless, there are observable discrepancies between peak currents in our control population and in experiments, which are limitations of the model, and we recognize that these should be further investigated. Future iterations in the development of the control population should include fine-tuning of the maximum conductances of the 16 models in order to produce a control population that better matches experimental data.
Finally, a relevant model improvement would be to include the calcium-dependent component of the chloride current, which has been shown to be involved in APD alternans in rabbit atria (Kanaporis and Blatter, 2016), and could therefore potentially affect Ca2+ wave propagation dynamics. Future work could also address the effects of AF-induced remodeling on Ca2+ wave propagation, and in particular look at the role of RyRs and Serca2a parameters in abnormal behaviors, such as failed Ca2+ propagation, Ca2+ alternans, and afterdepolarizations.
5. Conclusions
This paper presented a novel model of the rabbit atrial CMs, and provides a framework for analysing cardiac cell models based on correlation analysis. We have shown that the model is able to reproduce experimentally observed physiological Ca2+ wave propagation patterns. These differences were directly linked to two Ca2+ currents, ICaL, and INCX. However, the study also showed the Ca2+ wave patterns to be a complex interplay among different components, including CaSR and [Na+]i.
The spatial Ca2+ description in the model, along with the methodology presented here can be used as a tool to study sub-cellular mechanisms, and their implication in the arrhythmogenesis in diseased condition, such as atrial fibrillation. This work can therefore be extended to assess such mechanisms under altered conditions, such as electrical remodeling. In particular, the framework can be useful for querying the drivers of arrhythmogenic Ca2+ cycling, such as Ca2+ alternans, and to formulate hypothesis on new targets to restore normal cell function. In conclusion, the study provides a population of spatial models of the rabbit atrial cardiomyocyte that can serve as a starting point for future studies employing the commonly used experimental model.
Data Availability Statement
The raw data supporting the conclusions of this article will be made available by the authors, without undue reservation.
Author Contributions
MV, JH, and US conceived the study. MV performed the computational simulations and data analysis, and drafted the manuscript. HA, JS, and JH provided the critical revision to the manuscript. All authors approved the final version.
Funding
This project has received funding from the European Union's Horizon 2020 MSCA ITN under grant agreement No. 675351.
Conflict of Interest
The authors declare that the research was conducted in the absence of any commercial or financial relationships that could be construed as a potential conflict of interest.
Supplementary Material
The Supplementary Material for this article can be found online at: https://www.frontiersin.org/articles/10.3389/fphys.2020.556156/full#supplementary-material
References
Amrita, X., Christini, D. J., and Sobie, E. A. (2012). Exploiting mathematical models to illuminate electrophysiological variability between individuals. J. Physiol. 590, 2555–2567. doi: 10.1113/jphysiol.2011.223313
Aslanidi, O., Boyett, M., Dobrzynski, H., Li, J., and Zhang, H. (2009). Mechanisms of transition from normal to reentrant electrical activity in a model of rabbit atrial tissue: interaction of tissue heterogeneity and anisotropy. Biophys. J. 96, 798–817. doi: 10.1016/j.bpj.2008.09.057
Bers, D. M. (2002). Cardiac Na/Ca exchange function in rabbit, mouse and man: what's the difference? J. Mol. Cell. Cardiol. 34, 369–373. doi: 10.1006/jmcc.2002.1530
Blatter, L. A. (2017). The intricacies of atrial calcium cycling during excitation-contraction coupling. J. Gen. Physiol. 149, 857–865. doi: 10.1085/jgp.201711809
Blatter, L. A., Kockskämper, J., Sheehan, K. A., Zima, A. V., Hüser, J., and Lipsius, S. L. (2003). Local calcium gradients during excitation–contraction coupling and alternans in atrial myocytes. J. Physiol. 546, 19–31. doi: 10.1113/jphysiol.2002.025239
Bootman, M. D., Berridge, M. J., and Roderick, H. (2002). Calcium signalling: more messengers, more channels, more complexity. Curr. Biol. 12, R563–R565. doi: 10.1016/S0960-9822(02)01055-2
Bootman, M. D., Smyrnias, I., Rädiger Coombes, S., and Roderick, H. L. (2011). Atrial cardiomyocyte calcium signalling. Biochim. Biophys. Acta 1813, 922–934. doi: 10.1016/j.bbamcr.2011.01.030
Brandenburg, S., Pawlowitz, J., Fakuade, F. E., Kownatzki-Danger, D., Kohl, T., Mitronova, G. Y., et al. (2018). Axial tubule junctions activate atrial Ca2+ release across species. Front. Physiol. 9:1227. doi: 10.3389/fphys.2018.01227
Chang, E. T. Y., Strong, M., and Clayton, R. H. (2015). Bayesian sensitivity analysis of a cardiac cell model using a gaussian process emulator. PLoS ONE 10:e0130252. doi: 10.1371/journal.pone.0130252
Colman, M. A., Pinali, C., Trafford, A. W., Zhang, H., and Kitmitto, A. (2017). A computational model of spatio-temporal cardiac intracellular calcium handling with realistic structure and spatial flux distribution from sarcoplasmic reticulum and t-tubule reconstructions. PLOS Comput. Biol. 13:e1005714. doi: 10.1371/journal.pcbi.1005714
Coombes, S., and Timofeeva, Y. (2003). Sparks and waves in a stochastic fire-diffuse-fire model of Ca2+ release. Phys. Rev. E Stat. Nonlin. Soft Matter Phys. 68:021915. doi: 10.1103/PhysRevE.68.021915
Demir, S. S., Clark, J. W., and Giles, W. R. (1999). Parasympathetic modulation of sinoatrial node pacemaker activity in rabbit heart: a unifying model. Am. J. Physiol. Heart Circ. Physiol. 276, H2221–H2244. doi: 10.1152/ajpheart.1999.276.6.H2221
Demir, S. S., Clark, J. W., Murphey, C. R., and Giles, W. R. (1994). A mathematical model of a rabbit sinoatrial node cell. Am. J. Physiol. Cell Physiol. 266, C832–C852. doi: 10.1152/ajpcell.1994.266.3.C832
Eijsbouts, S. C., Majidi, M., Zandvoort, M. v, and Allessie, M. A. (2003). Effects of acute atrial dilation on heterogeneity in conduction in the isolated rabbit heart. J. Cardiovasc. Electrophysiol. 14, 269–278. doi: 10.1046/j.1540-8167.2003.02280.x
Frisk, M., Koivumäki, J. T., Norseng, P. A., Maleckar, M. M., Sejersted, O. M., and Louch, W. E. (2014). Variable t-tubule organization and Ca2+ homeostasis across the atria. Am. J. Physiol. Heart Circ. Physiol. 307, H609–H620. doi: 10.1152/ajpheart.00295.2014
Frommeyer, G., Wolfes, J., Ellermann, C., Kochhäuser, S., Dechering, D. G., and Eckardt, L. (2019). Acute electrophysiologic effects of the polyphenols resveratrol and piceatannol in rabbit atria. Clin. Exp. Pharmacol. Physiol. 46, 94–98. doi: 10.1111/1440-1681.13005
Greiser, M., Kerfant, B.-G., Williams, G. S., Voigt, N., Harks, E., Dibb, K. M., et al. (2014). Tachycardia-induced silencing of subcellular Ca2+ signaling in atrial myocytes. J. Clin. Invest. 124, 4759–4772. doi: 10.1172/JCI70102
Heijman, J., Erfanian Abdoust, P., Voigt, N., Nattel, S., and Dobrev, D. (2016). Computational models of atrial cellular electrophysiology and calcium handling, and their role in atrial fibrillation. J. Physiol. 594, 537–553. doi: 10.1113/JP271404
Hilgemann, D. W., Matsuoka, S., Nagel, G. A., and Collins, A. (1992). Steady-state and dynamic properties of cardiac sodium-calcium exchange. Sodium-dependent inactivation. J. Gen. Physiol. 100, 905–932. doi: 10.1085/jgp.100.6.905
Hilgemann, D. W., and Noble, D. (1987). Excitation-contraction coupling and extracellular calcium transients in rabbit atrium: reconstruction of basic cellular mechanisms. Proc. R. Soc. Lond. B Biol. Sci. 230, 163–205. doi: 10.1098/rspb.1987.0015
Holmes, M., Benson, A. P., Aslanidi, O. V., and Colman, M. A. (2018). “Investigating calcium-mediated arrhythmias via a computational model of a rabbit atrial myocyte,” in 2018 Computing in Cardiology Conference (CinC), Vol. 45 (Maastricht), 1–4. doi: 10.22489/CinC.2018.188
Hou, J.-W., Li, W., Fei, Y.-D., Chen, Y.-H., Wang, Q., Wang, Y.-P., et al. (2018). ICaL and Ito mediate rate-dependent repolarization in rabbit atrial myocytes. J. Physiol. Biochem. 74, 57–67. doi: 10.1007/s13105-017-0603-z
Hüser, J., Lipsius, S. L., and Blatter, L. A. (1996). Calcium gradients during excitation-contraction coupling in cat atrial myocytes. J. Physiol. 494, 641–651. doi: 10.1113/jphysiol.1996.sp021521
Johnstone, R. H., Chang, E. T., Bardenet, R., de Boer, T. P., Gavaghan, D. J., Pathmanathan, P., et al. (2016). Uncertainty and variability in models of the cardiac action potential: can we build trustworthy models? J. Mol. Cell. Cardiol. 96, 49–62. doi: 10.1016/j.yjmcc.2015.11.018
Kanaporis, G., and Blatter, L. A. (2016). Calcium-activated chloride current determines action potential morphology during calcium alternans in atrial myocytes. J. Physiol. 594, 699–714. doi: 10.1113/JP271887
Kettlewell, S., Saxena, P., Dempster, J., Colman, M. A., Myles, R. C., Smith, G. L., et al. (2019). Dynamic clamping human and rabbit atrial calcium current: narrowing ical window abolishes early afterdepolarizations. J. Physiol. 597, 3619–3638. doi: 10.1113/JP277827
Kurata, Y., Hisatome, I., Imanishi, S., and Shibamoto, T. (2002). Dynamical description of sinoatrial node pacemaking: improved mathematical model for primary pacemaker cell. Am. J. Physiol. Heart Circ. Physiol. 283, H2074–H2101. doi: 10.1152/ajpheart.00900.2001
Ladd, D., Tilunaité, A., Roderick, H. L., Soeller, C., Crampin, E. J., and Rajagopal, V. (2019). Assessing cardiomyocyte excitation-contraction coupling site detection from live cell imaging using a structurally-realistic computational model of calcium release. Front. Physiol. 10:1263. doi: 10.3389/fphys.2019.01263
Li, H., Scherlag, B. J., Kem, D. C., Zillner, C., Male, S., Thirunavukkarasu, S., et al. (2014). The propensity for inducing atrial fibrillation: a comparative study on old versus young rabbits. J. Aging Res. 2014:648918. doi: 10.1155/2014/684918
Lindblad, D., Murphey, C., Clark, J. R., and Giles, W. (1996). A model of the action potential and underlying membrane currents in a rabbit atrial cell. Am. J. Physiol. 271, H1666–H1696. doi: 10.1152/ajpheart.1996.271.4.H1666
Mackenzie, L., Bootman, M. D., Berridge, M. J., and Lipp, P. (2001). Predetermined recruitment of calcium release sites underlies excitation-contraction coupling in rat atrial myocytes. J. Physiol. 530, 417–429. doi: 10.1111/j.1469-7793.2001.0417k.x
Mackenzie, L., Roderick, H. L., Berridge, M. J., Conway, S. J., and Bootman, M. D. (2004). The spatial pattern of atrial cardiomyocyte calcium signalling modulates contraction. J. Cell Sci. 117, 6327–6337. doi: 10.1242/jcs.01559
Mahajan, A., Shiferaw, Y., Sato, D., Baher, A., Olcese, R., Xie, L.-H., et al. (2008). A rabbit ventricular action potential model replicating cardiac dynamics at rapid heart rates. Biophys. J. 94, 392–410. doi: 10.1529/biophysj.106.98160
Maltsev, V. A., and Lakatta, E. G. (2009). Synergism of coupled subsarcolemmal Ca2+ clocks and sarcolemmal voltage clocks confers robust and flexible pacemaker function in a novel pacemaker cell model. Am. J. Physiol. Heart Circ. Physiol. 296, H594–H615. doi: 10.1152/ajpheart.01118.2008
Marchena, M., and Echebarria, B. (2018). Computational model of calcium signaling in cardiac atrial cells at the submicron scale. Front. Physiol. 9:1760. doi: 10.3389/fphys.2018.01760
Marchena, M., and Echebarria, B. (2020). Influence of the tubular network on the characteristics of calcium transients in cardiac myocytes. PLoS ONE 15:e0231056. doi: 10.1371/journal.pone.0231056
Morotti, S., and Grandi, E. (2017). Logistic regression analysis of populations of electrophysiological models to assess proarrythmic risk. MethodsX 4, 25–34. doi: 10.1016/j.mex.2016.12.002
Muraki, K., Imaizumi, Y., Watanabe, M., Habuchi, Y., and Giles, W. R. (1995). Delayed rectifier K+ current in rabbit atrial myocytes. Am. J. Physiol. Heart Circ. Physiol. 269, H524–H532. doi: 10.1152/ajpheart.1995.269.2.H524
Muszkiewicz, A., Liu, X., Bueno-Orovio, A., Lawson, B. A. J., Burrage, K., Casadei, B., et al. (2018). From ionic to cellular variability in human atrial myocytes: an integrative computational and experimental study. Am. J. Physiol. Heart Circ. Physiol. 314, H895–H916. doi: 10.1152/ajpheart.00477.2017
Nivala, M., Song, Z., Weiss, J. N., and Qu, Z. (2015). T-tubule disruption promotes calcium alternans in failing ventricular myocytes: mechanistic insights from computational modeling. J. Mol. Cell Cardiol. 79, 32–41. doi: 10.1016/j.yjmcc.2014.10.018
Qi, A., Yeung-Lai-Wah, J. A., Xiao, J., and Kerr, C. R. (1994). Regional differences in rabbit atrial repolarization: importance of transient outward current. Am. J. Physiol. Heart Circ. Physiol. 266, H643–H649. doi: 10.1152/ajpheart.1994.266.2.H643
Rajagopal, V., Bass, G., Walker, C. G., Crossman, D. J., Petzer, A., Hickey, A., et al. (2015). Examination of the effects of heterogeneous organization of RYR clusters, myofibrils and mitochondria on Ca2+ release patterns in cardiomyocytes. PLoS Comput. Biol. 11:e1004417. doi: 10.1371/journal.pcbi.1004417
Ravelli, F., and Allessie, M. (1997). Effects of atrial dilatation on refractory period and vulnerability to atrial fibrillation in the isolated langendorff-perfused rabbit heart. Circulation 96, 1686–1695. doi: 10.1161/01.CIR.96.5.1686
Richards, M. A., Clarke, J. D., Saravanan, P., Voigt, N., Dobrev, D., Eisner, D. A., et al. (2011). Transverse tubules are a common feature in large mammalian atrial myocytes including human. Am. J. Physiol. Heart Circ. Physiol. 301, H1996–H2005. doi: 10.1152/ajpheart.00284.2011
Rouge, L., Yoho, J., Hayes, K., Herling, I., Gambert, S., Ostrander, G. K., et al. (2006). 47 inefficacy of acetylcholine for induction of atrial fibrillation in rabbits. J. Invest. Med. 54, S264–S264. doi: 10.2310/6650.2005.X0008.46
Sánchez, C., Bueno-Orovio, A., Wettwer, E., Loose, S., Simon, J., Ravens, U., et al. (2014). Inter-subject variability in human atrial action potential in sinus rhythm versus chronic atrial fibrillation. PLoS ONE 9:e0105897. doi: 10.1371/journal.pone.0105897
Sarkar, A. X., and Sobie, E. A. (2010). Regression analysis for constraining free parameters in electrophysiological models of cardiac cells. PLoS Comput. Biol. 6:e1000914. doi: 10.1371/journal.pcbi.1000914
Shannon, T. R., Wang, F., Puglisi, J., Weber, C., and Bers, D. M. (2004). A mathematical treatment of integrated ca dynamics within the ventricular myocyte. Biophys. J. 87, 3351–3371. doi: 10.1529/biophysj.104.047449
Sher, A. A., Noble, P. J., Hinch, R., Gavaghan, D. J., and Noble, D. (2008). The role of the Na+/Ca2+ exchangers in Ca2+ dynamics in ventricular myocytes. Prog. Biophys. Mol. Biol. 96, 377–398. doi: 10.1016/j.pbiomolbio.2007.07.018
Smyrnias, I., Mair, W., Harzheim, D., Walker, S. A., Roderick, H. L., and Bootman, M. D. (2010). Comparison of the T-tubule system in adult rat ventricular and atrial myocytes, and its role in excitation–contraction coupling and inotropic stimulation. Cell Calcium 47, 210–223. doi: 10.1016/j.ceca.2009.10.001
Song, Z., Liu, M. B., and Qu, Z. (2018). Transverse tubular network structures in the genesis of intracellular calcium alternans and triggered activity in cardiac cells. J. Mol. Cell. Cardiol. 114, 288–299. doi: 10.1016/j.yjmcc.2017.12.003
Sutanto, H., van Sloun, B., Schonleitner, P., van Zandvoort, M. A. M. J., Antoons, G., and Heijman, J. (2018). The subcellular distribution of ryanodine receptors and L-Type Ca2+ channels modulates Ca2+-transient properties and spontaneous Ca2+-release events in atrial cardiomyocytes. Front Physiol 9, 1108. doi: 10.3389/fphys.2018.01108
Thul, R., Coombes, S., Roderick, H. L., and Bootman, M. D. (2012). Subcellular calcium dynamics in a whole-cell model of an atrial myocyte. Proc. Natl. Acad. Sci. U.S.A. 109, 2150–2155. doi: 10.1073/pnas.1115855109
Tidball, J., Cederdahl, J., and Bers, D. (1991). Quantitative analysis of regional variability in the distribution of transverse tubules in rabbit myocardium. Cell Tissue Res. 264, 293–298. doi: 10.1007/BF00313966
Trafford, A. W., Clarke, J. D., Richards, M. A., Eisner, D. A., and Dibb, K. M. (2013). Calcium signalling microdomains and the t-tubular system in atrial mycoytes: potential roles in cardiac disease and arrhythmias. Cardiovasc. Res. 98, 192–203. doi: 10.1093/cvr/cvt018
Vagos, M., van Herck, I. G. M., Sundnes, J., Arevalo, H. J., Edwards, A. G., and Koivumäki, J. T. (2018). Computational modeling of electrophysiology and pharmacotherapy of atrial fibrillation: Recent advances and future challenges. Front. Physiol. 9:1221. doi: 10.3389/fphys.2018.01221
Voigt, N., Heijman, J., Qiongling, C.hiang, D. Y., Li, N., Karck, M., Wehrens, X. H., et al. (2014). Cellular and molecular mechanisms of atrial arrhythmogenesis in patients with paroxysmal atrial fibrillation. Circulation 129, 145–156. doi: 10.1161/CIRCULATIONAHA.113.006641
Voigt, N., Li, N., Wang, Q., Wang, W., Trafford, A. W., Abu-Taha, I., et al. (2012). Enhanced sarcoplasmic reticulum Ca2+ leak and increased Na+-Ca2+ exchanger function underlie delayed afterdepolarizations in patients with chronic atrial fibrillation. Circulation 125, 2059–2070. doi: 10.1161/CIRCULATIONAHA.111.067306
Wang, H. L., Zhou, X. H., Li, Z. Q., Fan, P., Zhou, Q. N., Li, Y. D., et al. (2017). Prevention of atrial fibrillation by using sarcoplasmic reticulum calcium atpase pump overexpression in a rabbit model of rapid atrial pacing. Med. Sci. Monit. 23, 3952–3960. doi: 10.12659/MSM.904824
Wang, Z., Fermini, B., Feng, J., and Nattel, S. (1995). Role of chloride currents in repolarizing rabbit atrial myocytes. Am. J. Physiol. Heart Circ. Physiol. 268, H1992–H2002. doi: 10.1152/ajpheart.1995.268.5.H1992
Weber, C. R., Ginsburg, K. S., Philipson, K. D., Shannon, T. R., and Bers, D. M. (2001). Allosteric regulation of Na/Ca exchange current by cytosolic Ca in intact cardiac myocytes. J. Gen. Physiol. 117, 119–131. doi: 10.1085/jgp.117.2.119
Xie, Y., Liao, Z., Grandi, E., Shiferaw, Y., and Bers, D. M. (2015). Slow [Na]i changes and positive feedback between membrane potential and [Ca]i underlie intermittent early afterdepolarizations and arrhythmias. Circ. Arrhythm. Electrophysiol. 8, 1472–1480. doi: 10.1161/CIRCEP.115.003085
Yamashita, T., Nakajima, T., Hazama, H., Hamada, E., Murakawa, Y., Sawada, K., et al. (1995). Regional differences in transient outward current density and inhomogeneities of repolarization in rabbit right atrium. Circulation 92, 3061–3069. doi: 10.1161/01.CIR.92.10.3061
Keywords: rabbit atrial cardiomyocyte, computational model, spatial calcium dynamics, calcium waves, population of models, correlation analysis
Citation: Vagos MR, Arevalo H, Heijman J, Schotten U and Sundnes J (2020) A Novel Computational Model of the Rabbit Atrial Cardiomyocyte With Spatial Calcium Dynamics. Front. Physiol. 11:556156. doi: 10.3389/fphys.2020.556156
Received: 27 April 2020; Accepted: 28 August 2020;
Published: 09 October 2020.
Edited by:
Jichao Zhao, The University of Auckland, New ZealandReviewed by:
Vijay Rajagopal, The University of Melbourne, AustraliaMichael Alan Colman, University of Leeds, United Kingdom
Copyright © 2020 Vagos, Arevalo, Heijman, Schotten and Sundnes. This is an open-access article distributed under the terms of the Creative Commons Attribution License (CC BY). The use, distribution or reproduction in other forums is permitted, provided the original author(s) and the copyright owner(s) are credited and that the original publication in this journal is cited, in accordance with accepted academic practice. No use, distribution or reproduction is permitted which does not comply with these terms.
*Correspondence: Joakim Sundnes, c3VuZG5lcyYjeDAwMDQwO3NpbXVsYS5ubw==