 Yasutaka Kurata
 Kunichika Tsumoto
 Kenshi Hayashi
 Ichiro Hisatome3
 Mamoru Tanida
- 1Department of Physiology II, Kanazawa Medical University, Uchinada, Japan
- 2Department of Cardiovascular and Internal Medicine, Graduate School of Medical Sciences, Kanazawa University, Kanazawa, Japan
- 3Department of Genetic Medicine and Regenerative Therapeutics, Graduate School of Medical Sciences, Tottori University, Yonago, Japan
Early afterdepolarization (EAD) is known to cause lethal ventricular arrhythmias in long QT syndrome (LQTS). In this study, dynamical mechanisms of EAD formation in human ventricular myocytes (HVMs) were investigated using the mathematical model developed by ten Tusscher and Panfilov (Am J Physiol Heart Circ Physiol 291, 2006). We explored how the rapid (IKr) and slow (IKs) components of delayed-rectifier K+ channel currents, L-type Ca2+ channel current (ICaL), Na+/Ca2+ exchanger current (INCX), and intracellular Ca2+ handling via the sarcoplasmic reticulum (SR) contribute to initiation, termination and modulation of phase-2 EADs during pacing in relation to bifurcation phenomena in non-paced model cells. Parameter-dependent dynamical behaviors of the non-paced model cell were determined by calculating stabilities of equilibrium points (EPs) and limit cycles, and bifurcation points to construct bifurcation diagrams. Action potentials (APs) and EADs during pacing were reproduced by numerical simulations for constructing phase diagrams of the paced model cell dynamics. Results are summarized as follows: (1) A modified version of the ten Tusscher-Panfilov model with accelerated ICaL inactivation could reproduce bradycardia-related EADs in LQTS type 2 and β-adrenergic stimulation-induced EADs in LQTS type 1. (2) Two types of EADs with different initiation mechanisms, ICaL reactivation–dependent and spontaneous SR Ca2+ release–mediated EADs, were detected. (3) Termination of EADs (AP repolarization) during pacing depended on the slow activation of IKs. (4) Spontaneous SR Ca2+ releases occurred at higher Ca2+ uptake rates, attributable to the instability of steady-state intracellular Ca2+ concentrations. Dynamical mechanisms of EAD formation and termination in the paced model cell are closely related to stability changes (bifurcations) in dynamical behaviors of the non-paced model cell, but they are model-dependent. Nevertheless, the modified ten Tusscher-Panfilov model would be useful for systematically investigating possible dynamical mechanisms of EAD-related arrhythmias in LQTS.
Introduction
Early afterdepolarization (EAD) is well known to trigger lethal ventricular arrhythmias, called Torsades de Pointes (TdP), in patients with long QT syndrome (LQTS) (Weiss et al., 2010; Shimizu and Horie, 2011; Shimizu, 2013). For prevention and treatment of ventricular arrhythmias in LQTS patients, therefore, elucidating the mechanisms of initiation and termination of EADs and how to suppress EADs is of crucial importance. There are many experimental studies regarding the mechanisms of EAD formation in cardiomyocytes, suggesting major contribution of reactivation of the L-type Ca2+ channel current (ICaL) to the initiation of EADs during the action potential (AP) phase 2 (e.g., January et al., 1988; January and Riddle, 1989; Guo D. et al., 2007; Weiss et al., 2010; Xie et al., 2010; Milberg et al., 2012a; Shimizu, 2013). However, recent experimental studies suggested the major role in EAD formation of the spontaneous Ca2+ release from the sarcoplasmic reticulum (SR) (Volders et al., 2000; Choi et al., 2002; Zhao et al., 2012). In our recent theoretical study (Kurata et al., 2017) using two human ventricular myocyte (HVM) models developed by Kurata et al. (2005) and O’Hara et al. (2011), referred to as K05 and O11 models, respectively, we could find EAD formations resulting from the ICaL reactivation, but not the spontaneous SR Ca2+ release-mediated EADs. With respect to the termination of EADs (AP repolarization), theoretical studies (Tran et al., 2009; Qu et al., 2013) using a guinea-pig ventricular myocyte model (Luo and Rudy, 1991) suggested the slowly activating delayed-rectifier K+ channel current (IKs) as a key current to cause termination of EADs. However, our preceding study (Kurata et al., 2017) suggested that the mechanisms of EAD termination were model-dependent, not necessarily requiring IKs. Thus, despite many experimental and theoretical studies, how individual membrane and intracellular components contribute to the initiation, termination and modulation of EADs remains controversial.
The aims of this study were (1) to determine whether the ten Tusscher and Panfilov model (ten Tusscher and Panfilov, 2006; referred to as the TP06 model) for HVMs, which has often been used for simulations of reentrant arrhythmias in the human ventricle (ten Tusscher et al., 2007; Adeniran et al., 2012; Zimik et al., 2015; Kazbanov et al., 2016), could reproduce EAD formation in LQTS (validation of the model cell for EAD reproducibility), and (2) to define the contributions of individual sarcolemmal and intracellular components to the initiation, termination, and modulation of phase-2 EADs in the TP06 model in comparison with those in other HVM models (evaluation of model dependence for EAD mechanisms). As in our preceding study (Kurata et al., 2017; Tsumoto et al., 2017), we examined parameter-dependent changes in stabilities of steady states and AP dynamics in the HVM model from the aspect of bifurcation phenomena, which are parameter-dependent qualitative changes in dynamical behaviors, in non-linear dynamical systems (Guckenheimer and Holmes, 1983; Parker and Chua, 1989; Kuznetsov, 2003). Conditions and dynamical mechanisms of EAD formation in the paced model cell were determined in relation to bifurcations of the non-paced model cell.
With respect to the dynamical mechanisms of EAD formation, we particularly focused on (1) whether and how contributions of each cellular component to occurrences of EADs and bifurcations in the TP06 model are different from those in the K05 and O11 models; (2) whether spontaneous SR Ca2+ release-mediated EAD initiation, which did not occur in the K05 or O11 model, can be reproduced by the TP06 model in connection with a bifurcation (destabilization) of intracellular Ca2+ dynamics; and (3) how slow IKs activation, as well as ICaL inactivation and other slow factors, contributes to EAD termination. This study would further provide a theoretical background for experimental and simulation studies on mechanisms of EAD formation and EAD-triggered reentrant arrhythmias in the LQTS human ventricle, as well as for prevention and treatments of life-threatening arrhythmias, like TdPs, in LQTS.
Materials and Methods
Mathematical Modeling for HVMs
Base Mathematical Model
In this study, we tested the mid-myocardial (M) cell version of the TP06 model for HVMs (ten Tusscher and Panfilov, 2006), which could reproduce phase-2 EADs during inhibition of IKs and/or the rapidly activating delayed rectifier K+ channel current (IKr) or enhancement of ICaL. The M cell version was chosen because it has smaller IKr and IKs and thus more vulnerable to EAD formation than the epicardial or endocardial version, as suggested experimentally as well (Antzelevitch et al., 1999), and a few modifications were made for the M cell version of the TP06 model. Figure 1 shows simulated behaviors of APs, sarcolemmal ionic currents and intracellular Ca2+ concentrations in the original and modified M cell versions of the TP06 model with various gKs and gKr values. Inconsistent with experiments for HVMs that observed only small prolongation of AP duration (APD) by IKs inhibition (Jost et al., 2005; O’Hara and Rudy, 2012), the original version of the TP06 model, which has relatively large IKs, exhibited marked APD prolongation during IKs inhibition, and failed to reproduce greater APD prolongation and phase-2 EADs during IKr inhibition (see Figure 1A). In addition, the Ca2+ concentration in the SR (CaSR) (3–4 mM during 1-Hz pacing) was higher than the experimentally observed values of 1–2 mM for rabbit ventricular myocytes (Shannon et al., 2003, 2004; Guo T. et al., 2007). Therefore, the modified version, referred to as the “mTP06a” model, underwent the following modifications: (1) 60% reduction of the maximum IKs conductance (gKs) with 50% increment of the maximum IKr conductance (gKr) to reproduce the IKr/IKs inhibition experiments, and (2) 40% reduction in the SR Ca2+ uptake rate (Pup) to reduce the Ca2+ concentration in the SR during pacing under control conditions. These modifications yielded the experimentally observed small APD prolongation by IKs inhibition and smaller CaSR of 1.3–2.6 mM during pacing at 0.5–1 Hz, but not EAD formation (Figure 1B). Therefore, we have developed another version of the modified TP06 model referred to as the “mTP06b” model with halved time constant of ICaL inactivation (τfL) and doubled maximum ICaL conductance (gCaL) on the basis of a previous theoretical study by Vandersickel et al. (2014) that required acceleration of the voltage-dependent inactivation of ICaL for reproducing EADs in the TP06 model. As shown in Figure 1C, the mTP06b model could reproduce the experimentally observed responses of HVMs to reductions of IKr or IKs, with EADs generated during IKr reductions. Maximum conductance of the ionic channels, densities of transporters, and SR Ca2+ uptake/release rates for the modified versions, as well as for the original version, are given in Supplementary Table S1.
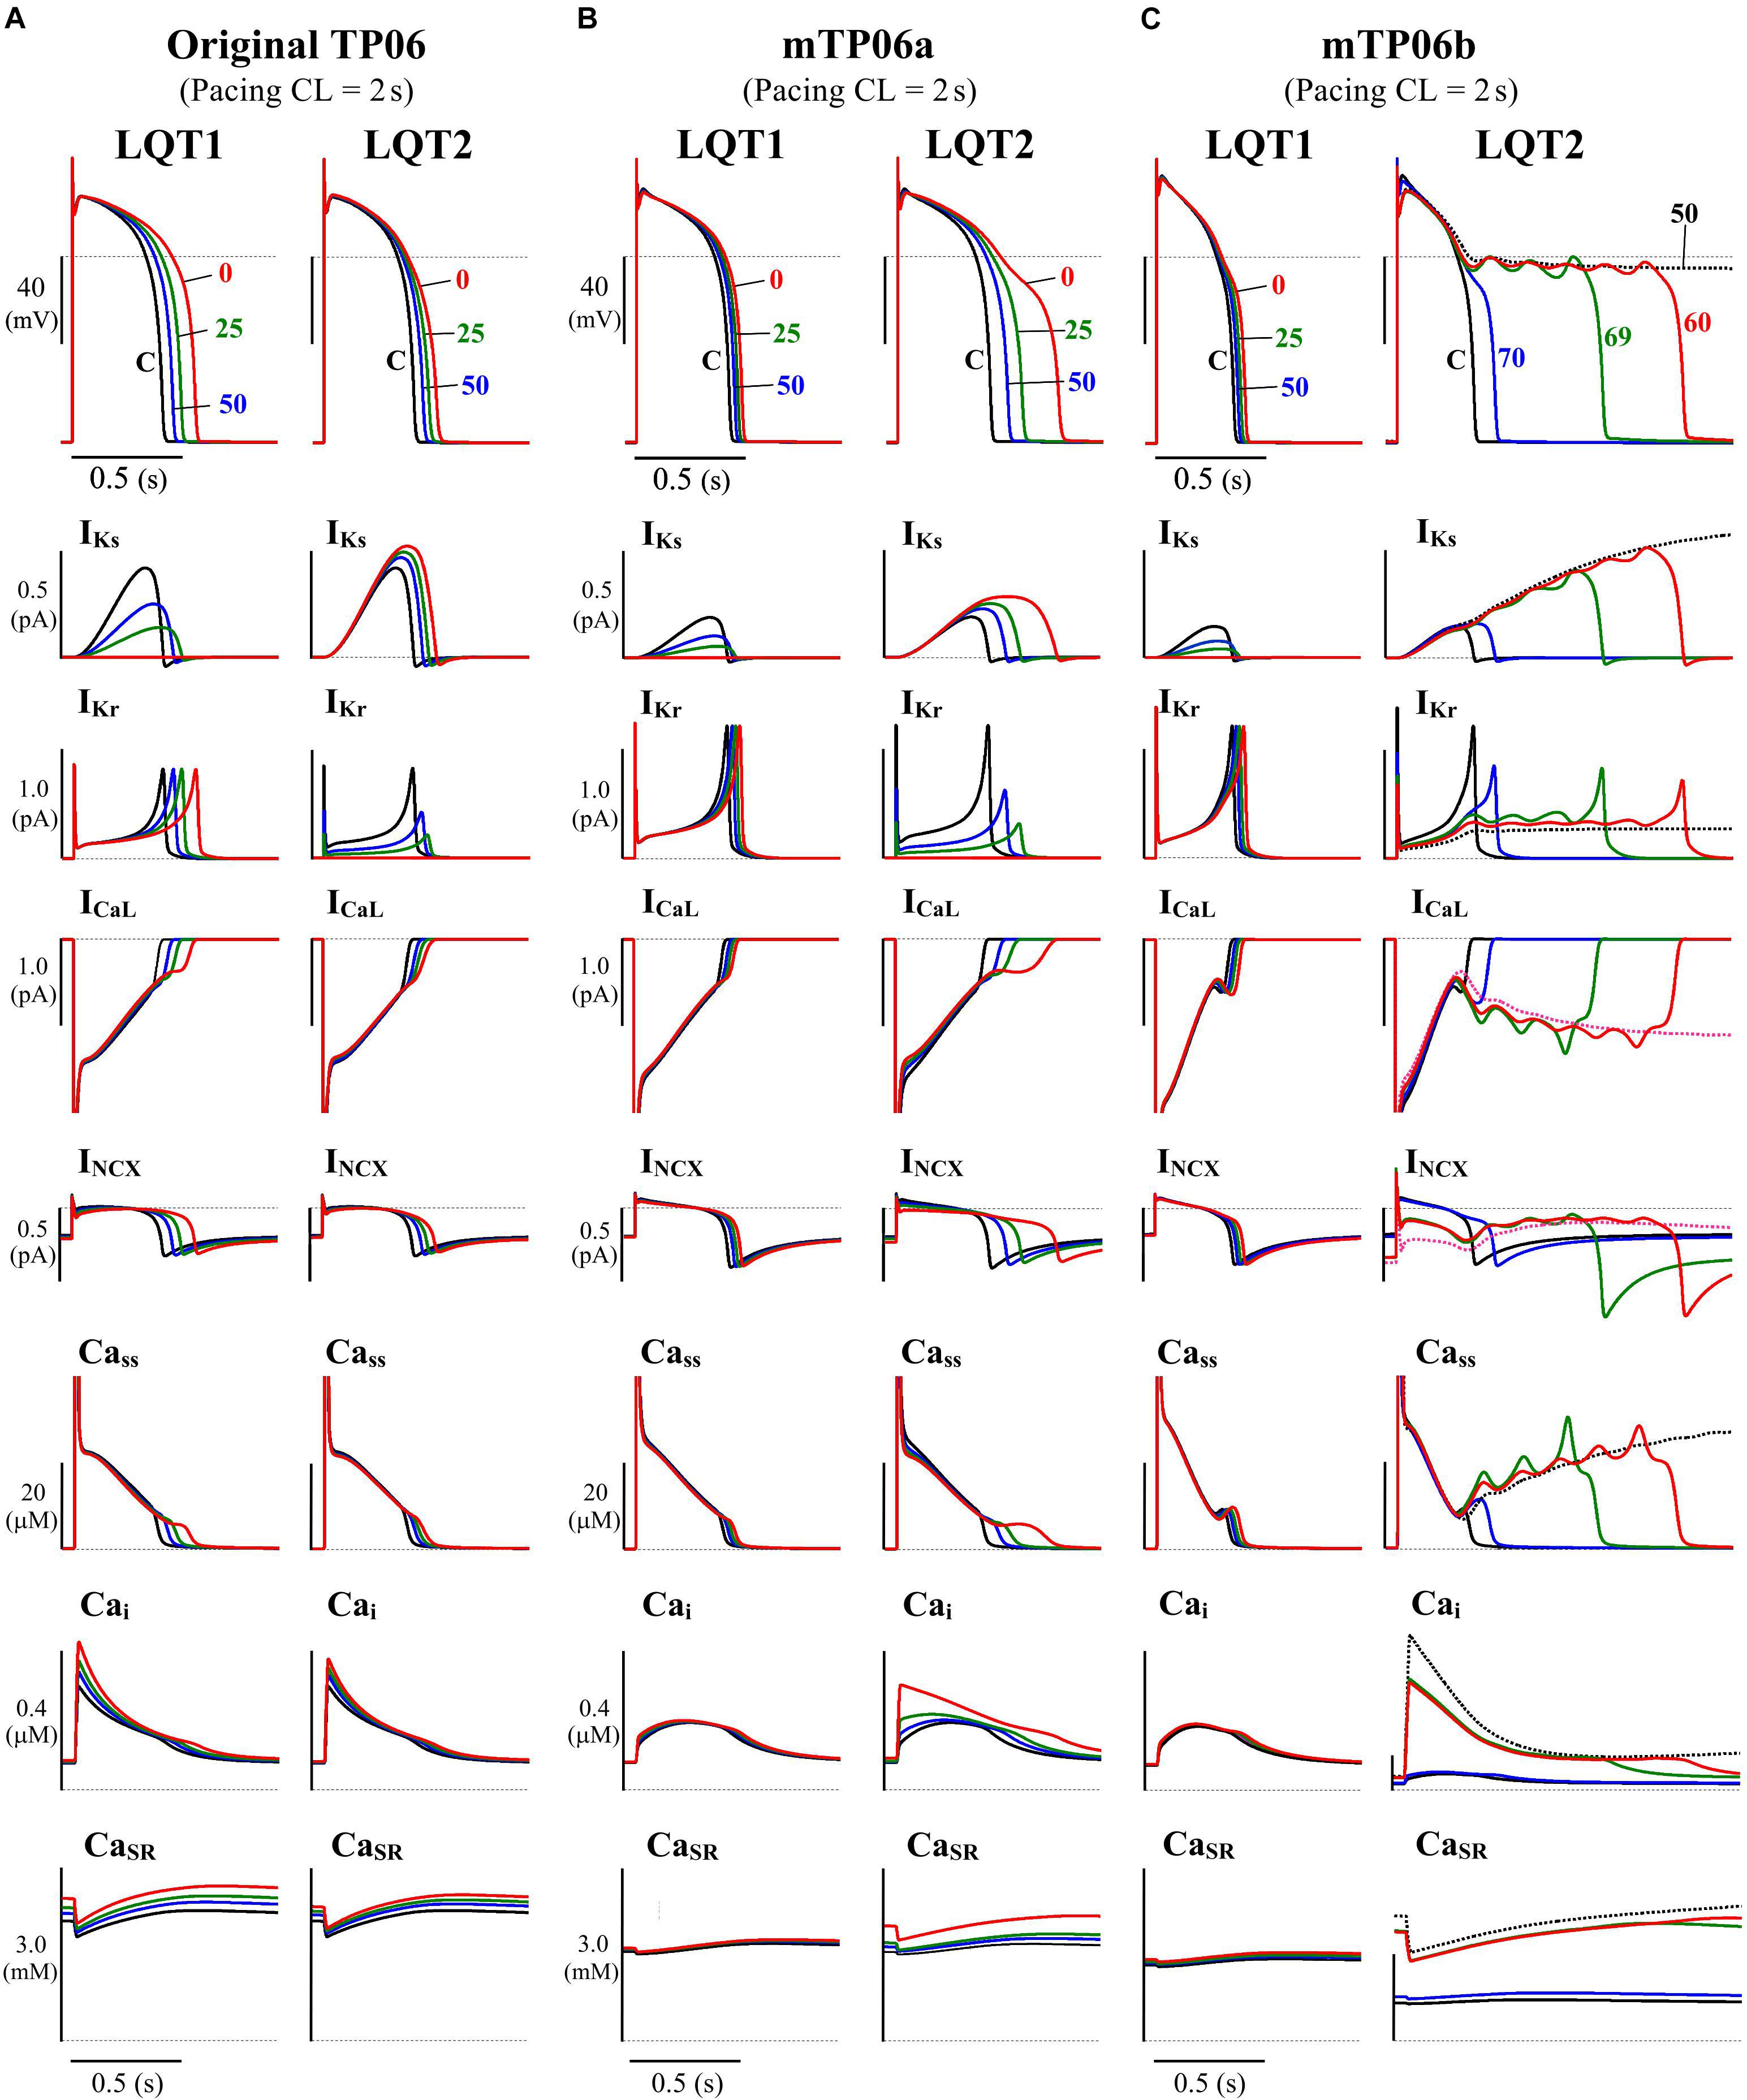
Figure 1. Simulated behaviors of APs (EADs), sarcolemmal ionic currents (IKs, IKr, ICaL, INCX) and intracellular Ca2+ concentrations (Cass, Cai, CaSR) in the M cell versions of the original TP06 (A), mTP06a (B), and mTP06b (C) models. To mimic the pathological conditions of LQT1 and LQT2, gKs and gKr values, respectively, were decreased by 30–100%; individual APs are labeled by the numbers representing the residual gKs or gKr (%Control), with ionic currents and Ca2+ concentrations for each gKs and gKr value shown by the same colors. The horizontal dashed lines denote the 0 mV, zero current and zero concentration levels. Current amplitudes for the y-axis scale bars are given in pA/pF. The model cells were paced at 0.5 Hz, i.e., with the cycle length (CL) of 2 s for 60 min; AP waveforms, ion currents and Ca2+ concentrations after the last stimulus are shown as steady-state behaviors under each condition.
The TP06 model for the normal activity of single HVMs is described as a non-linear dynamical system of 19 first-order ordinary differential equations. The membrane current system includes the Na+ channel current (INa), ICaL, IKr, IKs, 4-aminopyridine-sensitive transient outward current (Ito), inward-rectifier K+ channel current (IK1), background K+ (IpK), Na+ (IbNa) and Ca2+ (IbCa) currents, Na+-K+ pump current (INaK), Na+/Ca2+ exchanger current (INCX), and Ca2+ pump current (IpCa). Time-dependent changes in the membrane potential (Vm) are described by the equation,
where Istim represents the stimulus current (in pA/pF).
The basic model systems include material balance expressions to define the temporal variations in concentrations of myoplasmic K+ (Ki), Na+ (Nai) and Ca2+ (Cai), and subspace Ca2+ (Cass), while external concentrations of K+, Na+ and Ca2+ were fixed at 5.4, 140, and 2.0 mM, respectively. For bifurcation analyses, Ki was fixed at 140 mM for the removal of degeneracy (Krogh-Madsen et al., 2005; Kurata et al., 2008); effects of parameter-dependent changes in Ki (∼5 mM) on EAD formation and bifurcation phenomena in the model cell were much smaller than those of the same amount of changes in Nai. Nai was unfixed unless otherwise stated, but fixed at 6 mM in some cases (e.g., for the slow-fast decomposition analysis and for voltage-clamped cells, as described later); changes in Nai during AP phase 2 and EAD formation in paced model cells were slow and relatively small.
Details on expressions, standard parameter values, and dynamics of the TP06 model are provided in the original article (ten Tusscher and Panfilov, 2006), and the original TP06 model has been implemented in a cellML-based open resource for public access1. In addition, the original TP06, mTP06a, and mTP06b models have been implemented in PhysioDesigner as XML-based Physiological Hierarchy Markup Language (PHML)2 models. These models can be referred from PHML database (ID938 to 940)3, and simulations of their temporal behaviors can be performed using the software, Flint4.
Modeling LQTS Cardiomyocytes With Simulated EADs
Mutations of IKs and IKr channels (Roden et al., 1996; Chouabe et al., 1997; Anderson et al., 2006; Wiener et al., 2008; Kondo et al., 2016), as well as their pharmacological inhibitions (e.g., Carmeliet, 1992; Volders et al., 2003; Jost et al., 2005), are known to cause a wide range of channel conductance changes, leading to congenital or acquired LQTS type 1 (LQT1) and type 2 (LQT2), respectively. We developed LQT1- and LQT2-type model cells by continuously reducing gKs and gKr, respectively, from unity to zero. As illustrated in Figure 1, the TP06b model, but not the original version (with larger IKs) or the mTP06a model, reproduced phase-2 EADs (and AP repolarization failure) when gKr became smaller as in LQT2 cardiomyocytes. In contrast, gKs-reduced LQT1 model cells did not exhibit EADs but showed only slight prolongation of APDs under the basal condition, consistent with the recent experimental results from HVMs (Jost et al., 2005; O’Hara and Rudy, 2012).
Simulating Conditions of β-Adrenergic Stimulation
To simulate the condition of β-adrenergic stimulation (β-AS) as a major trigger of EADs and TdP in LQT1 patients, we modified the maximum conductance of ion channels and density of transporters based on previous reports (Zeng and Rudy, 1995; Volders et al., 2003; Kuzumoto et al., 2008), as described in our preceding article (Kurata et al., 2017). gCaL and gKs were increased up to 250% and 200%, respectively, according to previous reports for their changes during β-AS (Veldkamp et al., 2001; Saucerman et al., 2003; Himeno et al., 2008; Maltsev and Lakatta, 2010; Briston et al., 2014). Modifications of parameters for simulating β-AS are listed in Supplementary Table S2.
Numerical Methods for Dynamic Simulations
Basic Methods
Dynamic behaviors of the model cells were determined by numerically solving a set of non-linear ordinary differential equations including Eqn. 1. AP responses were elicited by 1-ms current stimuli of 60 pA/pF. When phase-2 EADs occurred at higher frequencies of the pacing, a complete AP repolarization was preceded by the next stimulus. Thus, the pacing cycle length (CL) was usually set to longer values of 2–5 s, except for analyses of the rate dependence. Numerical integration was performed by using MATLAB (The MathWorks, Inc., Natick, MA, United States) ODE solvers, ode15s and ode45, with the maximum relative error tolerance for the integration methods of 1 × 10⁻⁸.
Initial values of the state variables for computation at a parameter set were their steady-state values at a resting Vm (see Supplementary Table S3 for the control conditions), which were perturbed by the current stimulus; the last values of the state variables in computation were used as initial conditions for the next computation at a new parameter set. The minimum Vm during AP phase 4 (Vmin) and the maximum Vm during early phase 2 before emergence of an EAD (Vmax), as well as APD at 90% repolarization (APD90), were determined for individual APs or AP sets. Steady-state APs for the first parameter set were obtained by numerical integration for 30 min; subsequent numerical integration with each parameter set was continued until the differences in Vmin, Vmax and APD90 between the newly calculated AP and the preceding one became <1 × 10⁻³ of their preceding values.
Detection of EADs
EADs were detected as transient Vm oscillations which emerged during late AP phase 2 (200 ms or later from the AP peak) and eventually led to AP repolarization to a resting Vm. All the local minimum (EADmin) and maximum (EADmax) of Vm oscillations during EAD formation, as well as a set of Vmin, Vmax and APD90, were determined for one AP cycle. When APs with EADs were irregular (arrhythmic), all the potential extrema (Vmin, Vmax, EADmin, and EADmax) and APD90 values were sampled for APs evoked by the last 10 stimuli.
Stability and Bifurcation Analyses for HVMs
We performed bifurcation analysis to explore how dynamical properties of the HVM model cell systems alter with changes in parameters. Detailed procedures for bifurcation analyses, i.e., locating equilibrium points (EPs) and limit cycles (LCs), detecting bifurcation points by determination of their stabilities, were provided in our previous articles (Kurata et al., 2008, 2012, 2013, 2017; Tsumoto et al., 2017), as well as in textbooks (Guckenheimer and Holmes, 1983; Parker and Chua, 1989; Kuznetsov, 2003). In the present study, one- and two-parameter bifurcation diagrams for the non-paced cell model, as well as phase diagrams for the paced model cell, were constructed as functions of parameters, including (1) gKs, gKr, and gCaL, (2) scaling factor for INCX, (3) Pup, and (4) pacing CL. The maximum conductance of the ionic channel currents and Pup were expressed as normalized values, i.e., ratios to the control values. Mechanisms of the initiation and termination of EADs were further examined by the slow-fast decomposition analysis, in which stability and bifurcations of a fast subsystem are determined as functions of a slow variable, i.e., the gating variable xs for IKs activation or CaSR (Tran et al., 2009; Qu et al., 2013; Xie et al., 2014). Basic concepts of bifurcation analysis, types of bifurcations, and methods for constructions of bifurcation/phase diagrams and slow-fast decomposition analysis are briefly described in Supplementary Materials.
Results
Validation and Characterization of the mTP06 Models for LQTS HVMs
We first determined whether the mTP06a/b models can mimic the electrophysiological properties of IKr-reduced LQTS type 2 (LQT2) and IKs-reduced LQTS type 1 (LQT1) HVMs, in which EADs occur mainly at lower heart rates (bradycardia), and under β-AS, e.g., during exercise (tachycardia), respectively.
Decreases in IKr and/or IKs Accelerated EAD Formation in the mTP06 Model
The mTP06b model, but not the original TP06 or mTP06a model, exhibited an AP with EADs when IKr was inhibited during 0.5-Hz pacing (Figure 1). Similarly, when gKr was reduced by 40% during 0.2-Hz pacing, we could observe the AP with EADs in the gKr-reduced mTP06b model, as shown in Figure 2A-a. This simulated AP with EADs was accompanied by oscillatory reactivation of ICaL, and was terminated (i.e., Vm went back to the resting Vm) as IKs increased (blue arrows for IKs in Figure 2A-a). Further reducing gKr by 60% caused another type of EADs with IKs saturated before applying the second stimulus (Figure 2A-b); just before applying this second stimulus, the transient depolarization in plateau phase originating from the spontaneous SR Ca2+ release and resulting activation of inward INCX (red arrows in Figure 2A-b). In this case, repolarization did not occur without the next stimulus, i.e., repolarization failure occurred in the non-paced model cell after the cessation of pacing (Figure 2A-c).
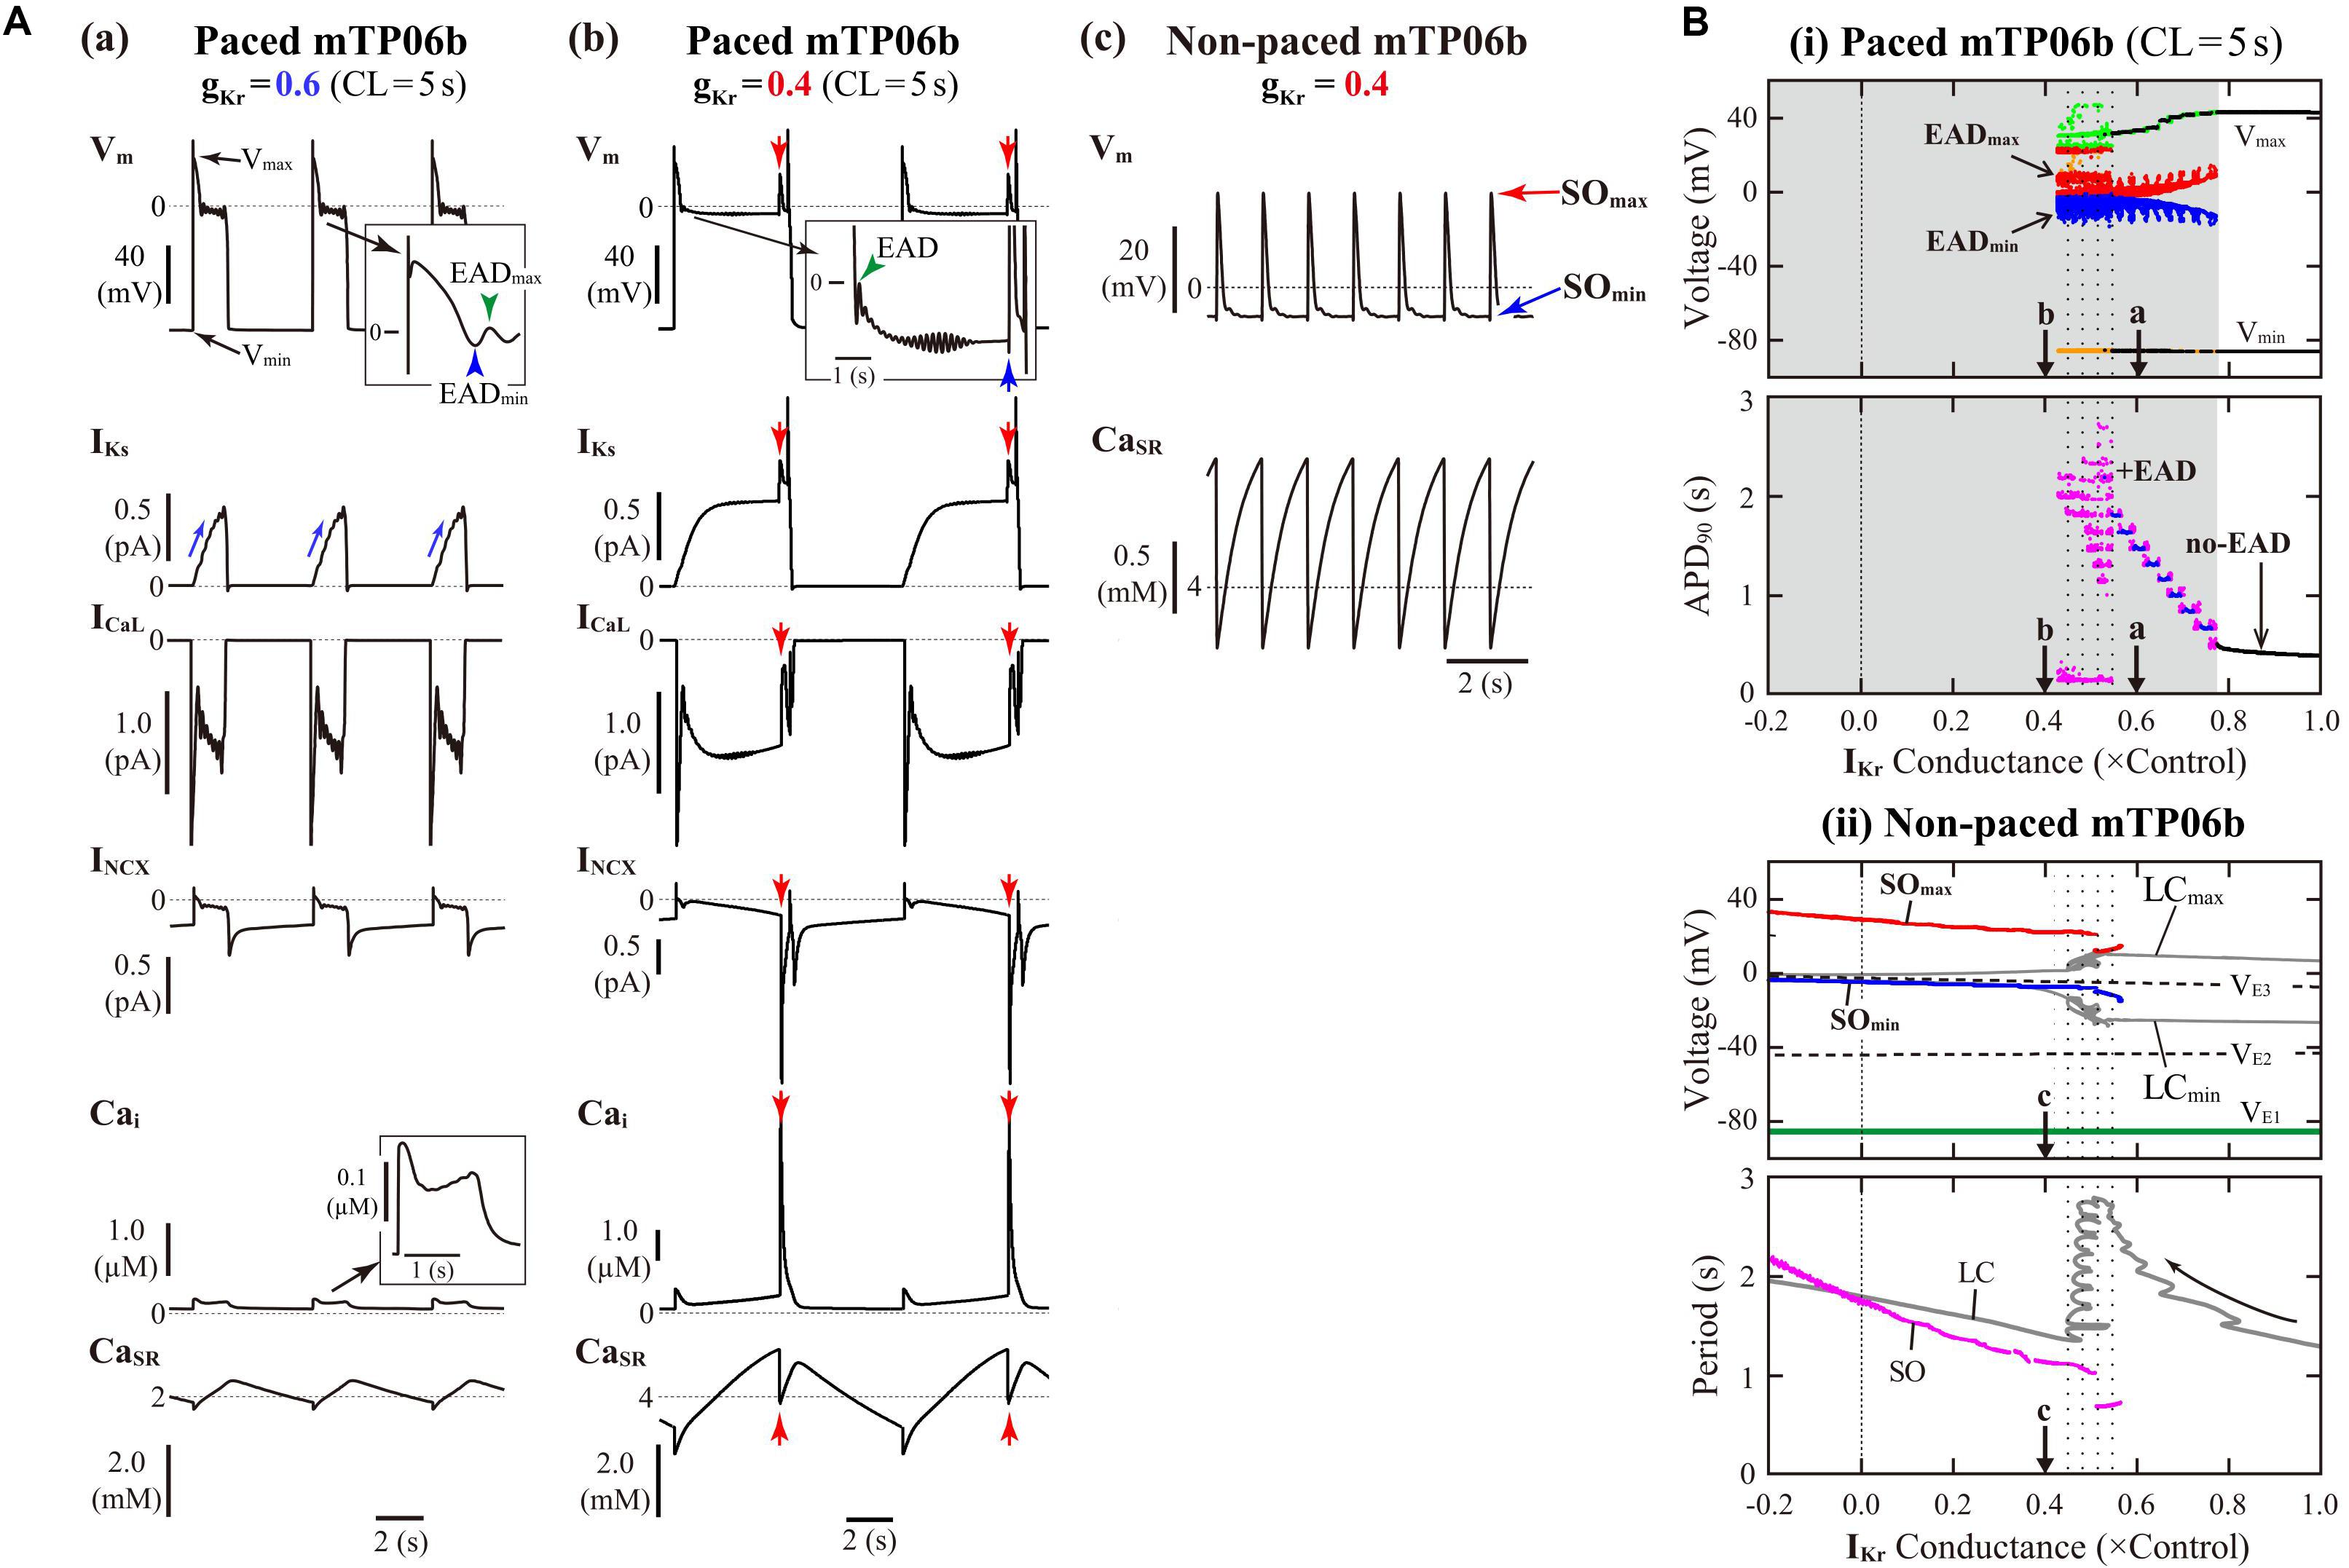
Figure 2. IKr-dependent EAD generation and bifurcations in the mTP06b model. (A) Simulated dynamics of Vm, IKs, ICaL, INCX, Cai, and CaSR (from top to bottom) in the gKr-reduced model cells paced at 0.2 Hz, illustrating two types of EADs. Temporal behaviors of the variables were computed for 30 min; the behaviors elicited by additional 3-4 stimuli are shown. APs with EADs were terminated (Vm repolarized) by gradual increases in IKs (a) or the next stimulus as indicated by the blue arrow (b). Spontaneous SR Ca2+ releases and resulting increases of inward INCX to provoke EADs occurred at gKr = 0.4, as indicated by the red arrows (b). With the smaller gKr, sustained Vm oscillations driven by spontaneous SR Ca2+ releases were observed after cessation of pacing, i.e., in the non-paced model cell (c). (B) Potential extrema of APs and EADs, and the AP duration (APD) measured at 90% repolarization (APD90) are plotted as functions of normalized gKr for the paced model cell (i). One-parameter bifurcation diagrams depicting steady-state Vm at equilibrium points (EPs), the extrema of limit cycles (LCs) and spontaneous oscillations (SOs), and the periods of LCs and SOs plotted against gKr are also shown for the non-paced model cell (ii). In the panel (i), AP dynamics during 0.2-Hz pacing were computed for 1 min at each gKr value, which was reduced from 1.0 to −0.2 at an interval of 0.001. The minimum Vm during AP phase 4 (Vmin) and the maximum Vm during AP phase 2 before EAD formation (Vmax) are indicated by black dots for rhythmic APs, and by orange (Vmin) and light green (Vmax) dots for arrhythmic APs. When EADs appeared, their local potential minimum (EADmin) and maximum (EADmax) were plotted by blue and red dots, respectively. In the panel for APD90, the black, blue, and magenta dots represent APD90 values for regular APs without EAD, regular APs with EADs, and arrhythmic APs with EADs, respectively (no-EAD: APs without EAD, + EAD: APs with EADs). The points labeled as “a” and “b” indicate gKr values for which AP behaviors are shown in Panel (A). In the panel (ii), the steady-state branches as loci of Vm at EPs (VE1–3), periodic branches as the potential minimum (LCmin) and maximum (LCmax) of LCs, and potential extrema of SOs (SOmin, SOmax), as well as the periods of LCs and SOs, are plotted for the non-paced model cell. The steady-state branch VE1 is stable (green solid lines), while VE2 and VE3 unstable (black dashed lines). The periodic branches represented by gray solid lines are always unstable. The point labeled as “c” indicates the gKr values for which SOs are shown in A-c.
Figure 2B-i shows switching of AP dynamics when gKr was gradually reduced during 0.2-Hz pacing. In this figure for the paced system, Vm extrema of APs (Vmin/Vmax) and EADs (EADmin/EADmax), were plotted against gKr. EADs emerged at gKr = 0.772, i.e., with 22.8% block of IKr (Figure 2B-i, top); the gKr reduction led to increases in the number of EADs, resulting in the discrete increase of APD90 values (see Figure 2B-i, bottom). The AP repolarization dynamics in the paced cell model relates to the dynamical behavior of the non-paced cell model because there is no stimulation during the AP repolarization. Therefore, we investigated the dynamical behavior of the non-paced cell model using bifurcation analysis. Figure 2B-ii shows one-parameter bifurcation diagrams as functions of gKr, constructed for the non-paced mTP06b model (see also Supplementary Figure S1A showing those for the mTP06a model for comparison). In the non-paced mTP06b and mTP06a model, there existed three EPs as the steady states. The EP in the upper steady-state branch (VE3 in Figure 2B-ii and Supplementary Figure S1A-ii) was always unstable at positive gKr values, while stable at negative gKr values in the mTP06a model. When gKr markedly reduced to a large negative value (out of range in Figure 2B-ii), the unstable EP (VE3) underwent the supercritical Hopf bifurcation (HB), which changed it to a stable EP and led to a generation of LC oscillation. The LCs spawned from the HB point were always unstable in the positive gKr range (see gray lines in Figure 2B-ii and Supplementary Figure S1A-ii). On the one hand, we found small-amplitude spontaneous Vm oscillations (SOs) that occurred at depolarized Vm (red and blue lines in Figure 2B-ii, top) in the vicinity of the unstable LCs, as exemplified in Figure 2A-c. Just before the disappearance of SOs with increasing gKr, the period of unstable LC markedly prolonged (see the gray zigzag trace in Figure 2B-ii, bottom). This marked prolongation of LC periods and the emergence of SOs correlated with very long APD (long-lasting EADs) and irregularity of the repolarization time in the paced cell model (compare the dotted ranges in Figures 2B-i,ii).
In contrast, VE3 in the IKs-eliminated (gKs = 0) non-paced model cells was stabilized via an occurrence of the subcritical HB when gKr was reduced (solid green lines to the left of the label “H” in Supplementary Figure S1B-ii). Thus, IKs inhibition caused drastic shift of HB points toward higher gKr values. Unstable LCs emerged via the subcritical HB, not changing their stability in the gKr range tested. In the IKs-eliminated paced mTP06a/b models (Supplementary Figure S1B-i), decreasing gKr did not yield EADs, but abruptly changed APs without EADs to local responses in the depolarized Vm range during pacing, i.e., arrest at stable EPs (VE3) without pacing.
To evaluate the dependencies of EAD formation on gKr and gKs, we performed AP simulations using the mTP06b model with various sets of gKr and gKs. Figure 3A-i shows a phase diagram of AP behaviors for changes in gKs and gKr values with 0.2-Hz pacing. By characterizing AP behaviors observed in the paced mTP06b model, the gKs–gKr parameter plane was divided into three regions: (1) AP without EAD, (2) AP with EADs (colored regions; see examples of Figure 3B for the points “d” and “e” in Figure 3A-i), and (3) local response (dotted region; see an example of Figure 3C for the point “f” in Figure 3A-i). We further separated the region of the AP with EADs into two regions based on characteristics of the repolarization time in an AP with EADs: During 0.2-Hz pacing, further decreases in gKr (and/or gKs) in the EAD region altered an AP with shorter APD90 of ≤5 s that repolarizes before the next stimulus to an AP with longer APD90 of >5 s that is repolarized by the next stimulus, as shown in Figure 2A; then, the APs with EADs were defined as “fast repolarization (fR)” type for the former and “repolarization failure (RF)” type for the latter, which are exemplified in Figures 2A-a,b, respectively. The fR and RF types were distinguished by AP behaviors after an extra stimulus following the last test stimulus to cause AP repolarization, as illustrated in Figure 3B: The fR-type AP repolarized to resting Vm within 5 s (Figure 3B-i), while the RF-type one did not (Figure 3B-ii); in this case, APD90 values of the RF-type AP were almost always more than 10 min.
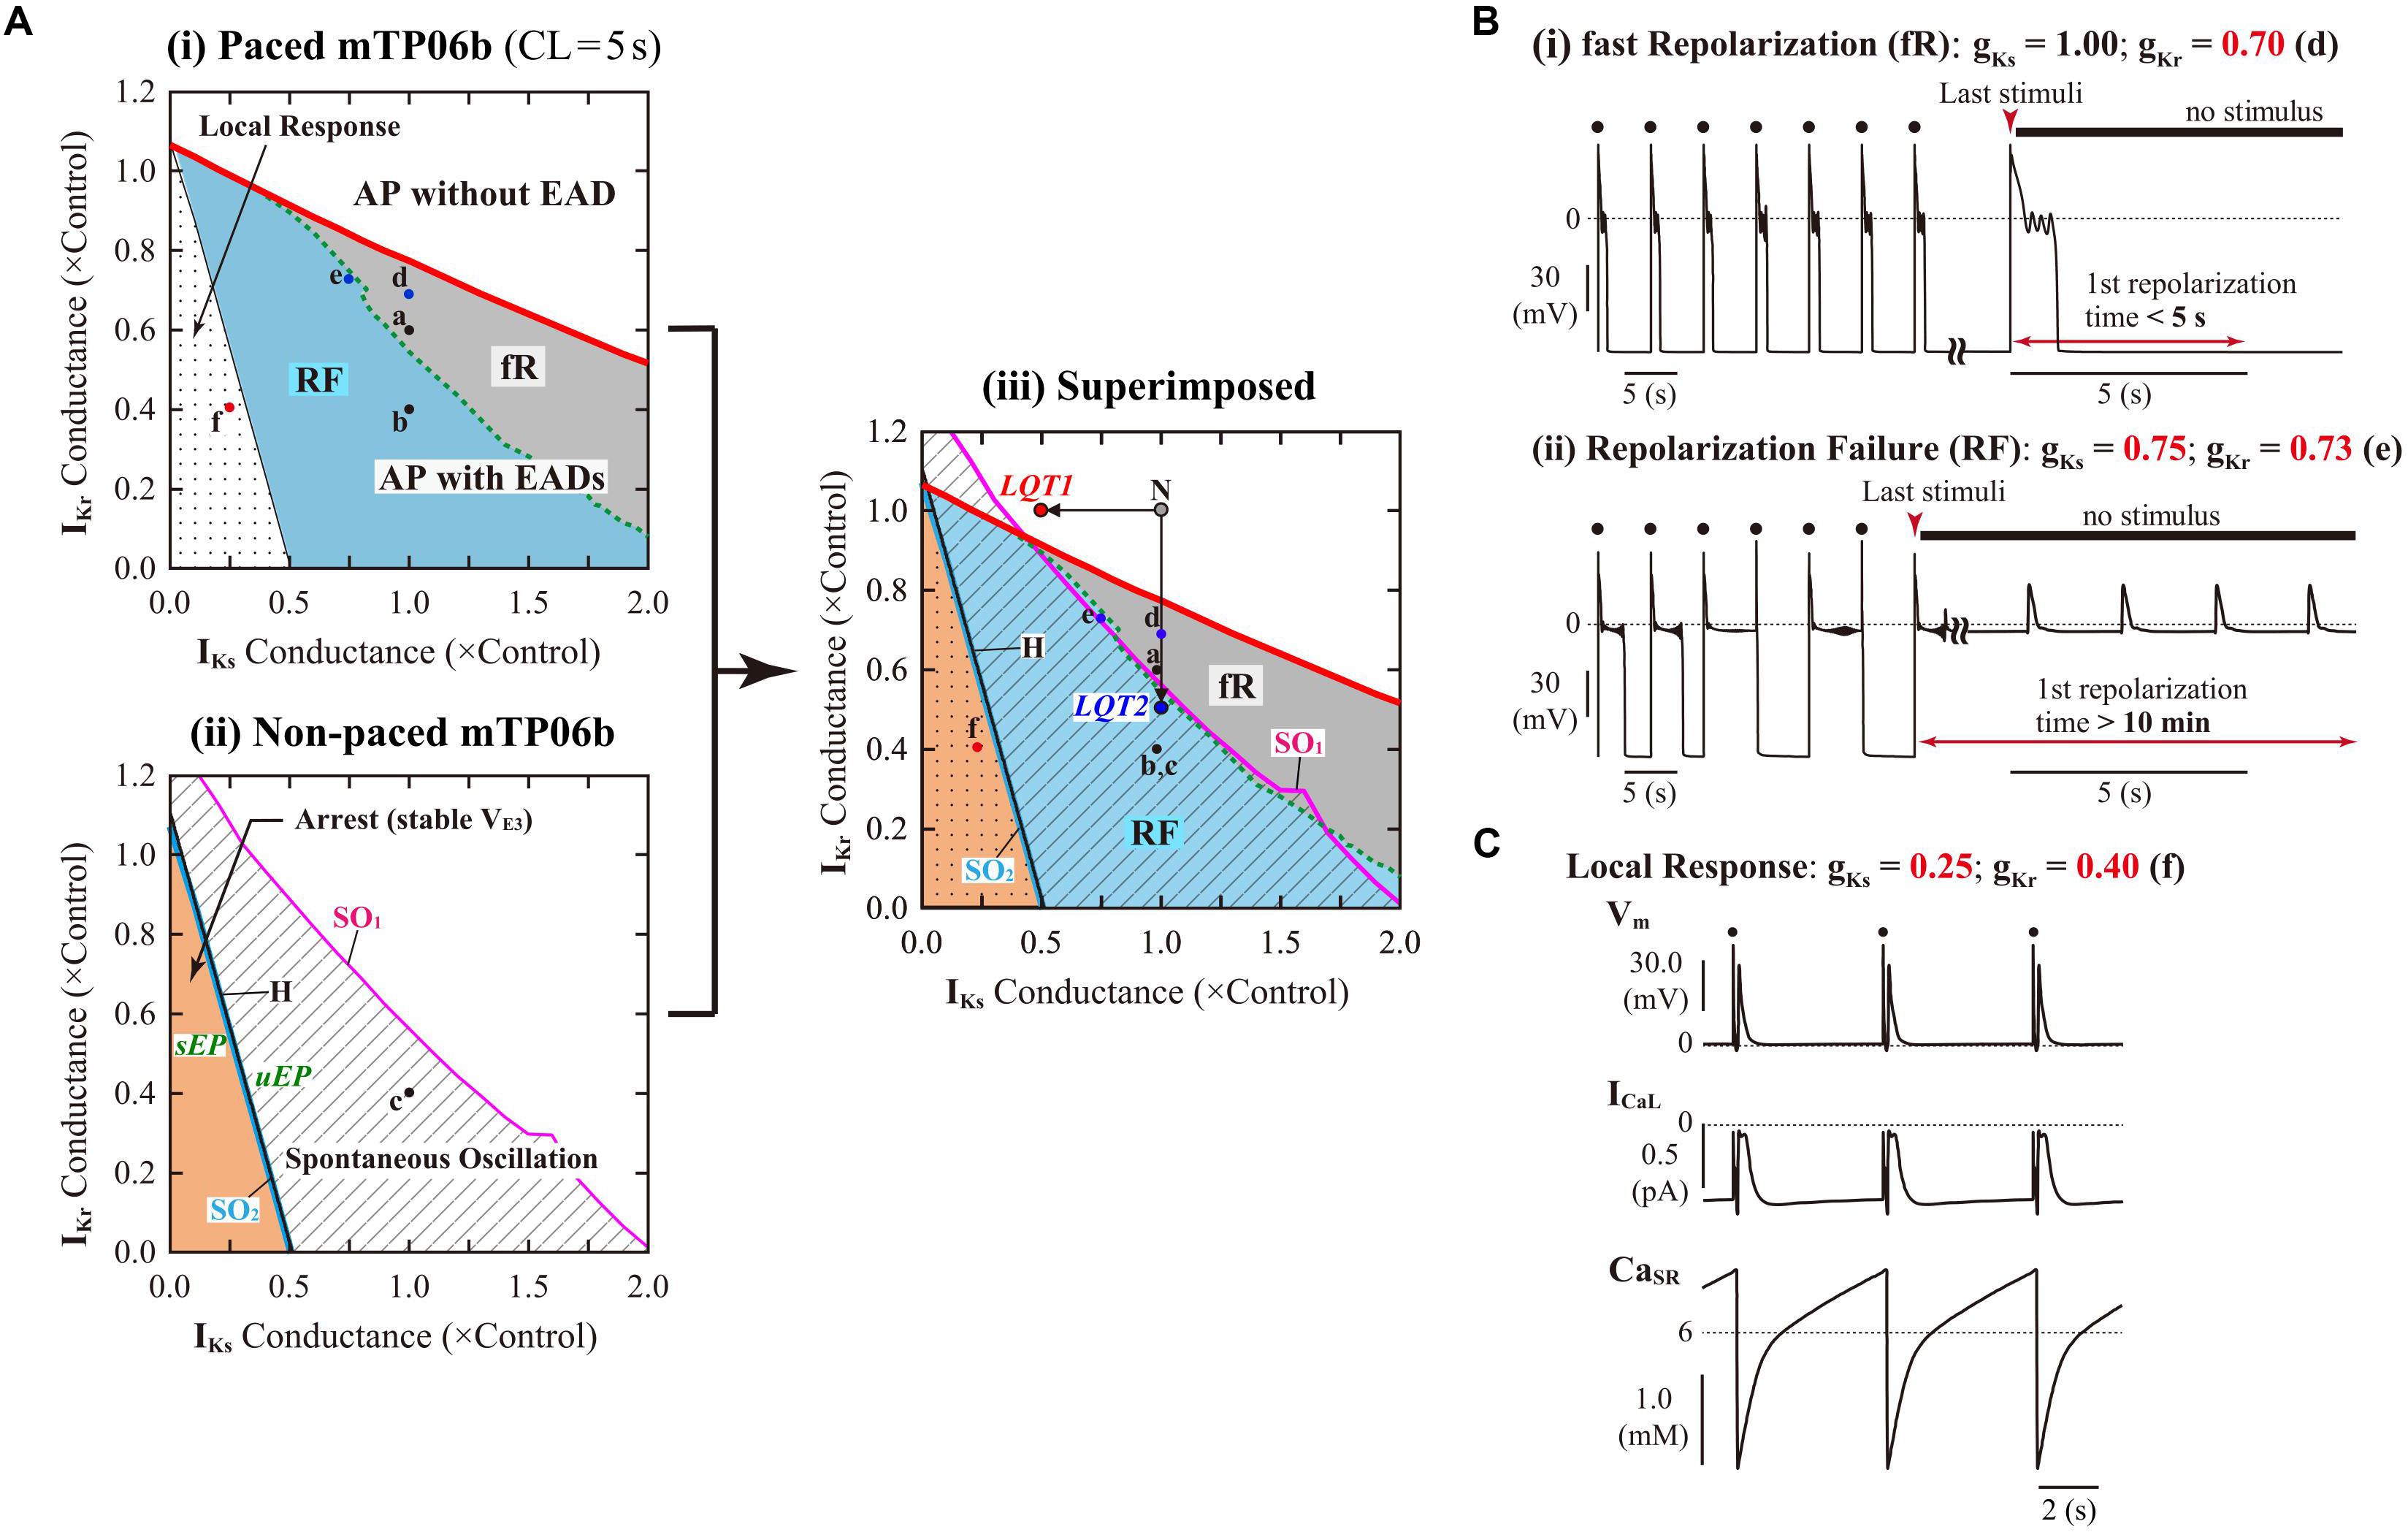
Figure 3. IKr/IKs-dependent EAD formation, dynamics and bifurcations of the mTP06b model. (A) A phase diagram indicating the region of EAD formation (and local responses) in the paced model cell (i) and two-parameter bifurcation diagrams for the non-paced model cell (ii) on the gKs–gKr parameter plane. In the diagram for the paced model cell (i), the thick red solid, black dashed and thin black solid lines, respectively, indicate parameter sets of critical points at which short-term EADs (APD90 < 5 s, as in Figure 2A-a and [B-(i)], long-term or sustained EADs (APD90 > 5 s, as in Figure 2A-b and [B-(ii)], and a local response (C) emerged; parameter regions in which short-term EADs, long-term or sustained EADs, and local responses occur are shown as the light-gray region labeled as “fR” (fast repolarization), blue region labeled as “RF” (repolarization failure), and dotted region, respectively. In the two-parameter bifurcation diagram for the non-paced model cell (ii), H, SO1, and SO2 indicate parameter sets of HB points, critical points at which SOs emerged, and critical points at which SOs switched into quiescence, respectively. The parameter regions in which SOs and convergence to the steady state (VE3), i.e., arrest, can be observed are indicated as the shaded and orange regions, respectively. The labels “sEP” and “uEP” indicate the areas of stable and unstable EPs, respectively, divided by the HB curve. The panel (iii) is the diagram for which the phase diagram (i) is superimposed upon the two-parameter bifurcation diagram (ii). The points labeled as “N”, “LQT1” and “LQT2” denote the normal, LQT1, and LQT2 conditions, respectively. The points “a”–“f” indicate parameter sets for which AP behaviors are shown in Figures 2A-a–c, and [B (d,e)] [C (f)]. (B) Representative behaviors of APs with EADs during 0.2-Hz pacing at the points labeled as “d” and “e” in (A), which are classified into the fast repolarization type (d) and repolarization failure type (e) behaviors, respectively. (C) An example of the local response during 0.2-Hz pacing at the point “f” in (A).
Decreases in gKr and/or gKs required for EAD formation were much smaller in the mTP06b model than in the mTP06a model (compare Figure 3A-i and Supplementary Figure S2). The borderline of EAD initiation (the red solid line in Figure 3A-i) shifted in a gKs-dependent manner, with the gKr region of EADs broadening as gKs increased. Furthermore, two-parameter bifurcation analysis for the non-paced cell model (Figure 3A-ii) determined three areas with different behaviors: (1) quiescence at a stable EP (resting state; VE1) with no stable EP or LC at depolarized Vm, (2) co-existence of quiescence at a stable EP (resting state) and a stable LC or SO at depolarized Vm (shaded area labeled as “Spontaneous Oscillation”), and (3) co-existence of two stable EPs at VE1 and depolarized Vm (VE3), i.e., the arrest at depolarized Vm (colored area labeled as “Arrest (stable VE3)”).
To clarify relationships between AP responses observed in the paced cell model and bifurcations occurred in the non-paced cell model, we superimposed the phase diagram on the two-parameter bifurcation diagram (Figure 3A-iii). Most of the SO region in which SOs can be observed in the non-paced cell model was included in the RF region, suggesting the relation of spontaneous SR Ca2+ release-mediated sustained EADs to SOs (Figure 3B-ii). The borderline between local response and AP with EADs corresponded to the HB set in the non-paced cell model, indicating that Vm in the paced cell model converges to the stable EP (VE3) in the area of local response.
Slow and Rapid Pacing Facilitated EAD Formation in the mTP06b Model
To further validate the mTP06b model as a LQT2 model, we next determined whether EAD formation in the gKr-reduced mTP06b model is facilitated at lower pacing rates (in bradycardia). Rate effects on EAD formation are shown in the diagrams depicting the gKr regions of EADs as functions of the pacing cycle length (Figure 4A). EAD formation in the gKr-reduced system was promoted at lower pacing rates in the Nai-variable system, while prevented in the Nai-fixed system. As in the K05 and O11 models (Kurata et al., 2017), the facilitation of EAD formation at lower pacing rates in the Nai-variable mTP06b model was accompanied by the decrease in Nai, which resulted in the decrease of outward INaK leading to delays in AP repolarization and EAD formation (Figure 4B-i). In the Nai-fixed mTP06b model, the inhibition of EAD formation at lower pacing rates accompanied marked outward shift of INCX resulting from diminished Cai transients (Figure 4B-ii). In Supplementary Figure S3, two-parameter bifurcation diagrams on the gKs–gKr parameter plane are also shown for the Nai-variable and Nai-fixed mTP06b model cells paced at 0.2 and 1 Hz. In the Nai-variable system (Supplementary Figure S3A), slower pacing promoted EAD formation during decreases of gKr and/or gKs and broadened the parameter region of EADs; in the Nai-fixed system (Supplementary Figure S3B), however, the rate-dependent changes in the onset and region of EADs were opposite to those in the Nai-variable system (compare the gray and blue areas in each panel of Supplementary Figure S3).
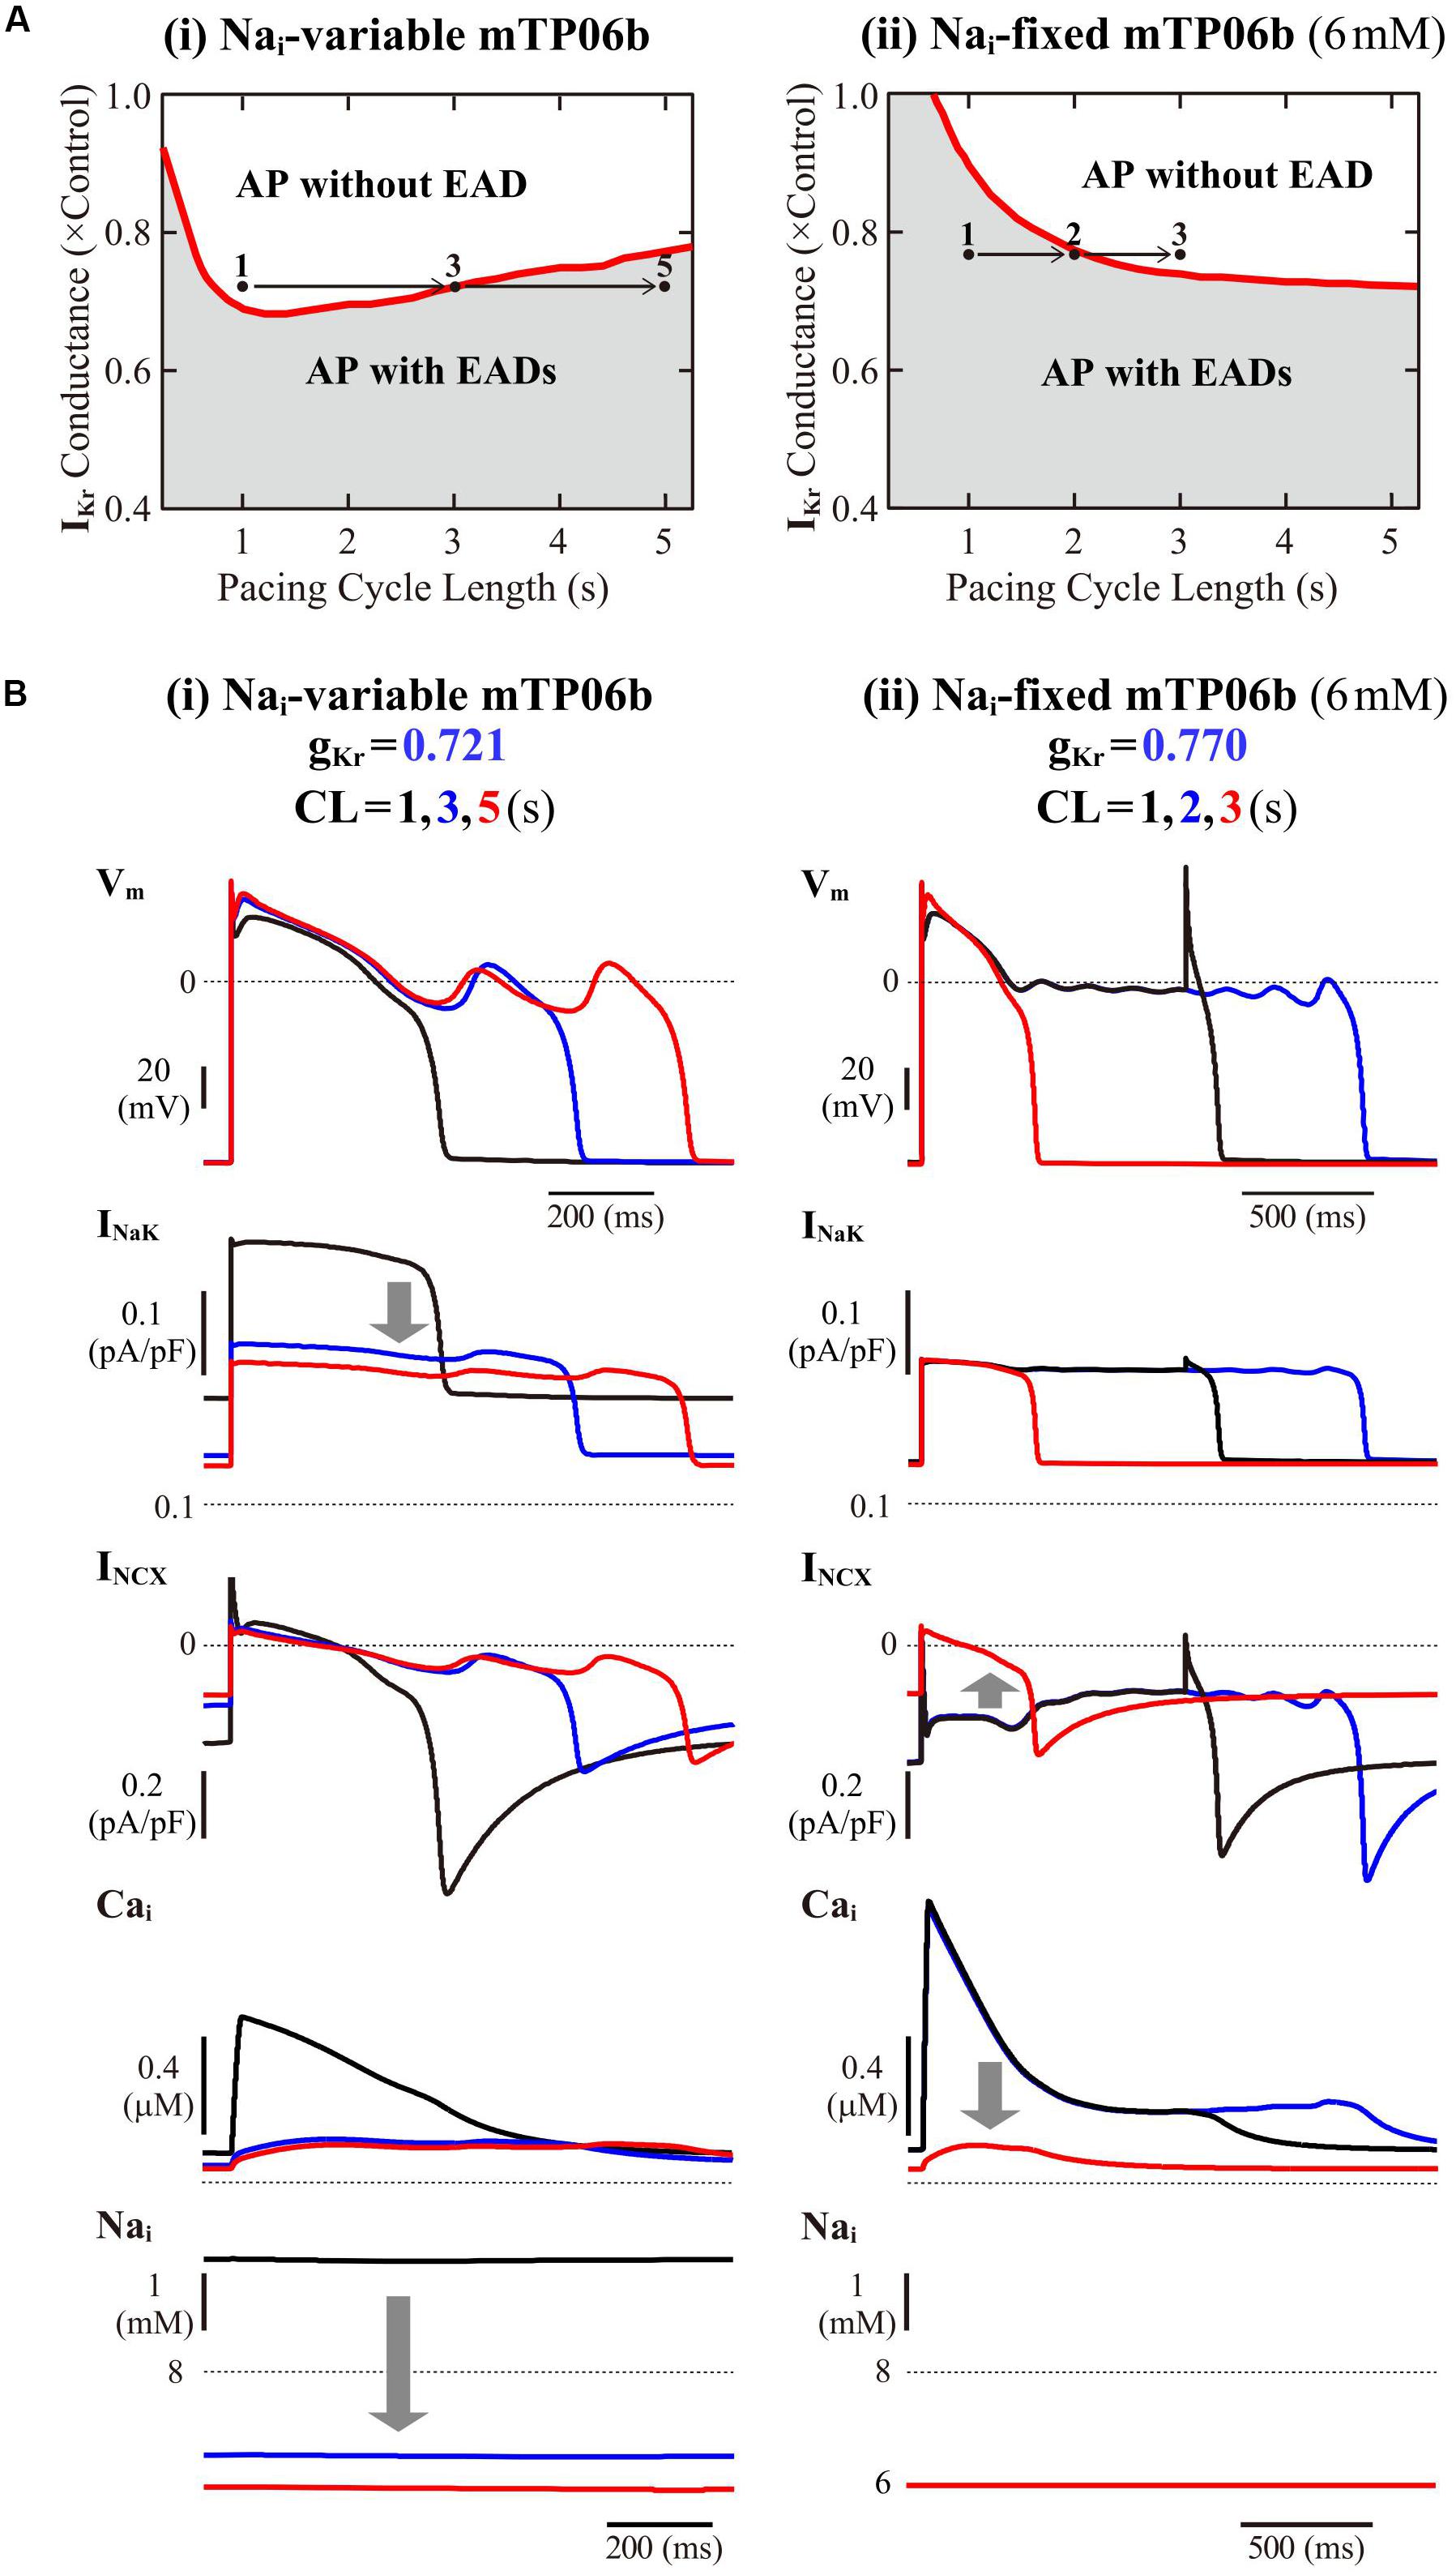
Figure 4. Rate dependence of EAD generation in the mTP06b model. (A) Two-parameter phase diagrams for the pacing cycle length (CL) and gKr depicted for the Nai-variable (i) and Nai-fixed (ii) model cells paced with various CLs of 0.75-5.25 s at 0.01-0.2 s intervals. The red solid lines and gray regions represent the parameter sets of critical points for occurrences of EADs and parameter region in which APs with EADs can be observed, respectively. (B) Simulated dynamics of the Nai-variable (i) and Nai-fixed (ii) gKr-reduced model cell paced at various frequencies (with CLs of 1, 3, and 5 s or 1, 2, and 3 s). Temporal behaviors of the model cell were computed for 30 min at each pacing rate; Vm, INaK, INCX, and Nai for the last 1-2 s are shown as steady-state dynamics. The arrows indicate the directions of changes induced by increases in CL.
The rate dependence shown in Figure 4 and Supplementary Figure S3 was determined by quasi steady-state dynamics for each parameter set. In LQT2 patients, however, EADs and TdP may often be induced by abrupt pause or transient slowing of heartbeats (bradycardia) at rest or during sleep. Thus, we also determined how EADs emerge after sudden reductions of pacing rates (Supplementary Figure S4). When a pacing CL was increased from 1 s to 3, 4, and 5 s in the IKr-reduced mTP06b model (gKr = 0.721), EADs were first induced by 172nd, 74th, and 51st stimulus, respectively, after the reductions in pacing rates; pause-induced EAD or early onset of EADs after the increment in pacing CL was not observed, but long bradycardiac periods of more than 4 min were needed for EAD formation in this model cell.
In the mTP06b model, rapid pacing (CL < 1 s) also facilitated EAD formation via increases in Cai and CaSR, and resulting increases of inward INCX (data not shown). EADs are known to be inhibited at higher pacing rates by accumulation of slowly deactivating IKs as well as reductions in ICaL due to slow recovery. Cumulative IKs increments and ICaL reductions were certainly observed at the higher pacing rates in the mTP06b model as well; however, the enhanced inward INCX appeared to cause APD prolongation and EAD formation in this model cell.
Spontaneous SR Ca2+ Release-Medicated EADs Occurred During β-AS
To validate the mTP06b model as a LQT1 model, i.e., to determine whether the IKs-reduced model cell can exhibit EADs under the conditions of β-AS, we examined susceptibilities to EAD generation during β-AS of the normal and LQT1 versions of the mTP06b model. For the LQT1 model cell, gKs was reduced by 50% and 75%, following the reports for the KCNQ1 mutations M437V and A590W, respectively (see Sogo et al., 2016). Figure 5A shows simulated APs of the normal and LQT1 versions of the mTP06b model under the basal condition and conditions of β-AS with gCaL increased to 140, 150, 160, and 180% of the control value. The LQT1 model cells exhibited longer APDs under the basal condition (APD90 of 334 ms with the normal gKs vs. 348 ms with 50% gKs and 356 ms with 25% gKs) and EADs under β-AS with gCaL increased by 60% or more for 50% gKs and 40% or more for 25% gKs, whereas the normal cell did not exhibit EAD. By constructing a two-parameter bifurcation diagram on the gKs–gCaL plane for the Nai-variable model cell paced at 1 Hz (Figure 5B), we could explain their EAD formation under the conditions of β-AS. As in the K05 model (Kurata et al., 2017), EAD formation during gCaL increases under β-AS could be inhibited by concomitant gKs increases more effectively in the normal mTP06b model than in the LQT1 models: The LQT1 model cells entered the area of EAD formation with smaller increases in gCaL (50.8% or more for the 50% gKs reduction and 31.0% or more for the 75% gKs reduction), while the normal cell with more than 87.7% increases in gCaL. Thus, the mTP06b model could recapitulate EAD formation via enhancement of ICaL during β-AS in the LQT1 cardiomyocyte. Under β-AS with higher gCaL and Pup, spontaneous SR Ca2+ releases as evidenced by abrupt falls in CaSR without ICaL reactivation often occurred, leading to Cai elevations (see Supplementary Figure S5), increments of inward INCX, and resultant EADs (or spontaneous Vm oscillations), as indicated by the dots in Figure 5A.
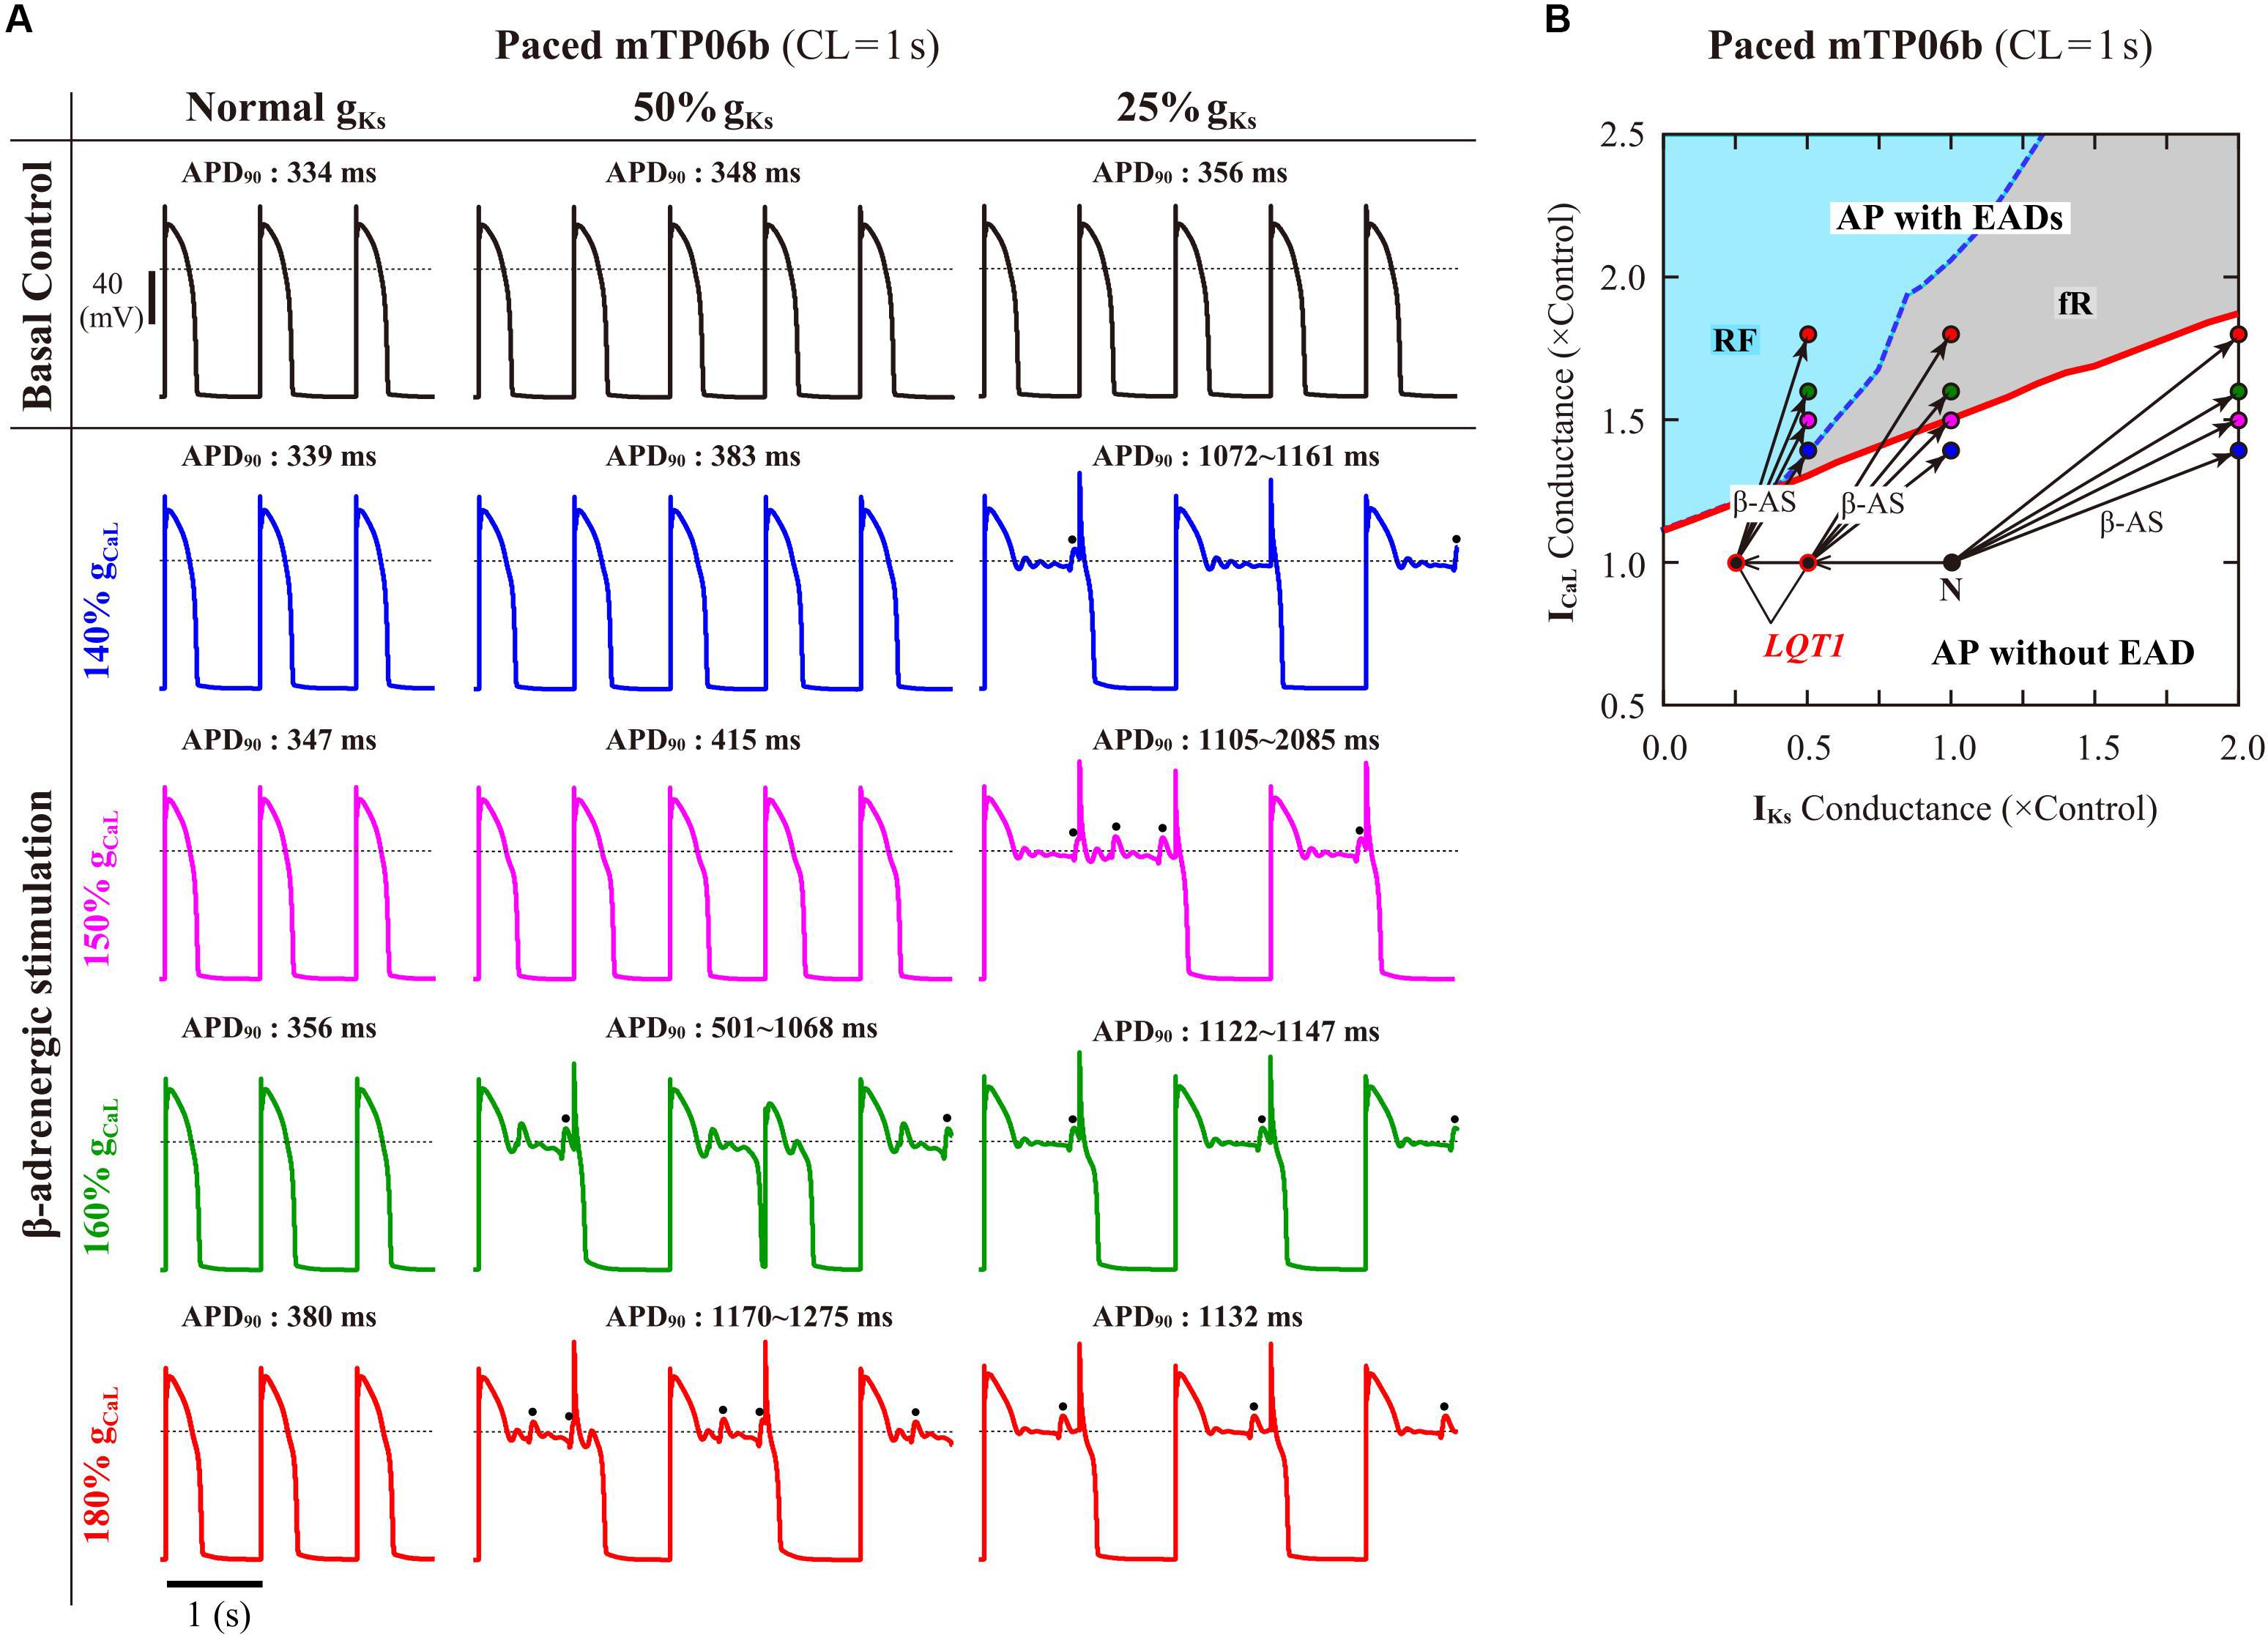
Figure 5. EAD generations during β-AS in the normal and LQT1 versions of the mTP06b model. (A) Simulated APs of the model cells under the basal condition (top) and conditions of β-AS as indicated by the points and arrows in (B). Model cells were paced at 1 Hz for 30 min. The dots denote EADs induced by spontaneous SR Ca2+ releases. (B) A phase diagram on the gKs–gCaL parameter plane depicting displacements of critical points at which EADs emerged during 1-Hz pacing. The critical points were determined during gCaL increases at an interval of 0.002 for individual gKs values increased at intervals of 0.02–0.1. For simulating the conditions of β-AS, the parameters other than gCaL and gKs were modified as stated in the section “Materials and Methods” (see Supplementary Table S2). The LQT1 model cell was assumed to have reduced gKs of 50% or 25% of the control value. The points of the control (basal) conditions for cardiomyocytes with the normal and reduced gKs are labeled as “N” and “LQT1”, respectively. The arrows indicate the parameter shifts from the basal condition to the conditions of β-AS with gKs doubled and gCaL increased to 140, 150, 160 and 180% of the control value.
Influences of SR Ca2+ Cycling, INCX and ICaL on EAD Formation
Following the finding of spontaneous SR Ca2+ releases which occurred especially under β-AS with enhanced ICaL and SR Ca2+ uptake, we next examined how SR Ca2+ uptake/release (intracellular Ca2+ dynamics) and INCX regulated by the intracellular Ca2+, as well as ICaL regulated by the subspace Ca2+, affect EAD formation and bifurcations of dynamical behaviors in the mTP06b model by changing Pup, the scaling factor for INCX, or gCaL. Figure 6A shows phase diagrams on the Pup–gKr and Pup–gCaL parameter planes. Pup values were varied from zero to 2-times the control value, assuming the effects of SR Ca2+ pump inhibitors and β-AS (Maltsev and Lakatta, 2010; Briston et al., 2014). The region of EADs shrank with reducing Pup as in the K05 and O11 models (Kurata et al., 2017), while broadening at higher Pup; however, for the emergence of EADs (red solid lines in Figure 6A), the critical gKr value was not decreased but slightly increased (the critical gCaL value was not increased but slightly decreased) as Pup reduced. The facilitated EAD formation at smaller Pup was associated with increased Cai and resulting inward shift in INCX as well as slight increases in ICaL during AP late phase 2 (see Supplementary Figure S6A). The two-parameter bifurcation analysis offered further information on how the region of EADs depends on Pup and gKr. As shown in Supplementary Figure S7, the critical set of the emergence of EADs and the HB set were mostly parallel to the Pup and gKr axes, respectively, suggesting that alterations in Pup contributed not to EAD formation but to rather stability changes of EP (VE3) in the non-paced mTP06b model; HB points disappeared with the emergence of spontaneous Vm and Ca2+ oscillations at higher Pup, indicating that the SR Ca2+ uptake/release machinery destabilizes EPs and thereby induces spontaneous oscillations. When gKr was markedly reduced in the mTP06b model, spontaneous SR Ca2+ releases to cause transient increases in intracellular Ca2+ concentrations (Cass and Cai) and resulting activation of inward INCX occasionally occurred with prolonged APD (Figure 6B-a). Increasing Pup shortened the time to the emergence of the first spontaneous Ca2+ release and raised the incidence and frequency of spontaneous Ca2+ oscillations to yield EADs or Vm oscillations (Figure 6B-b).
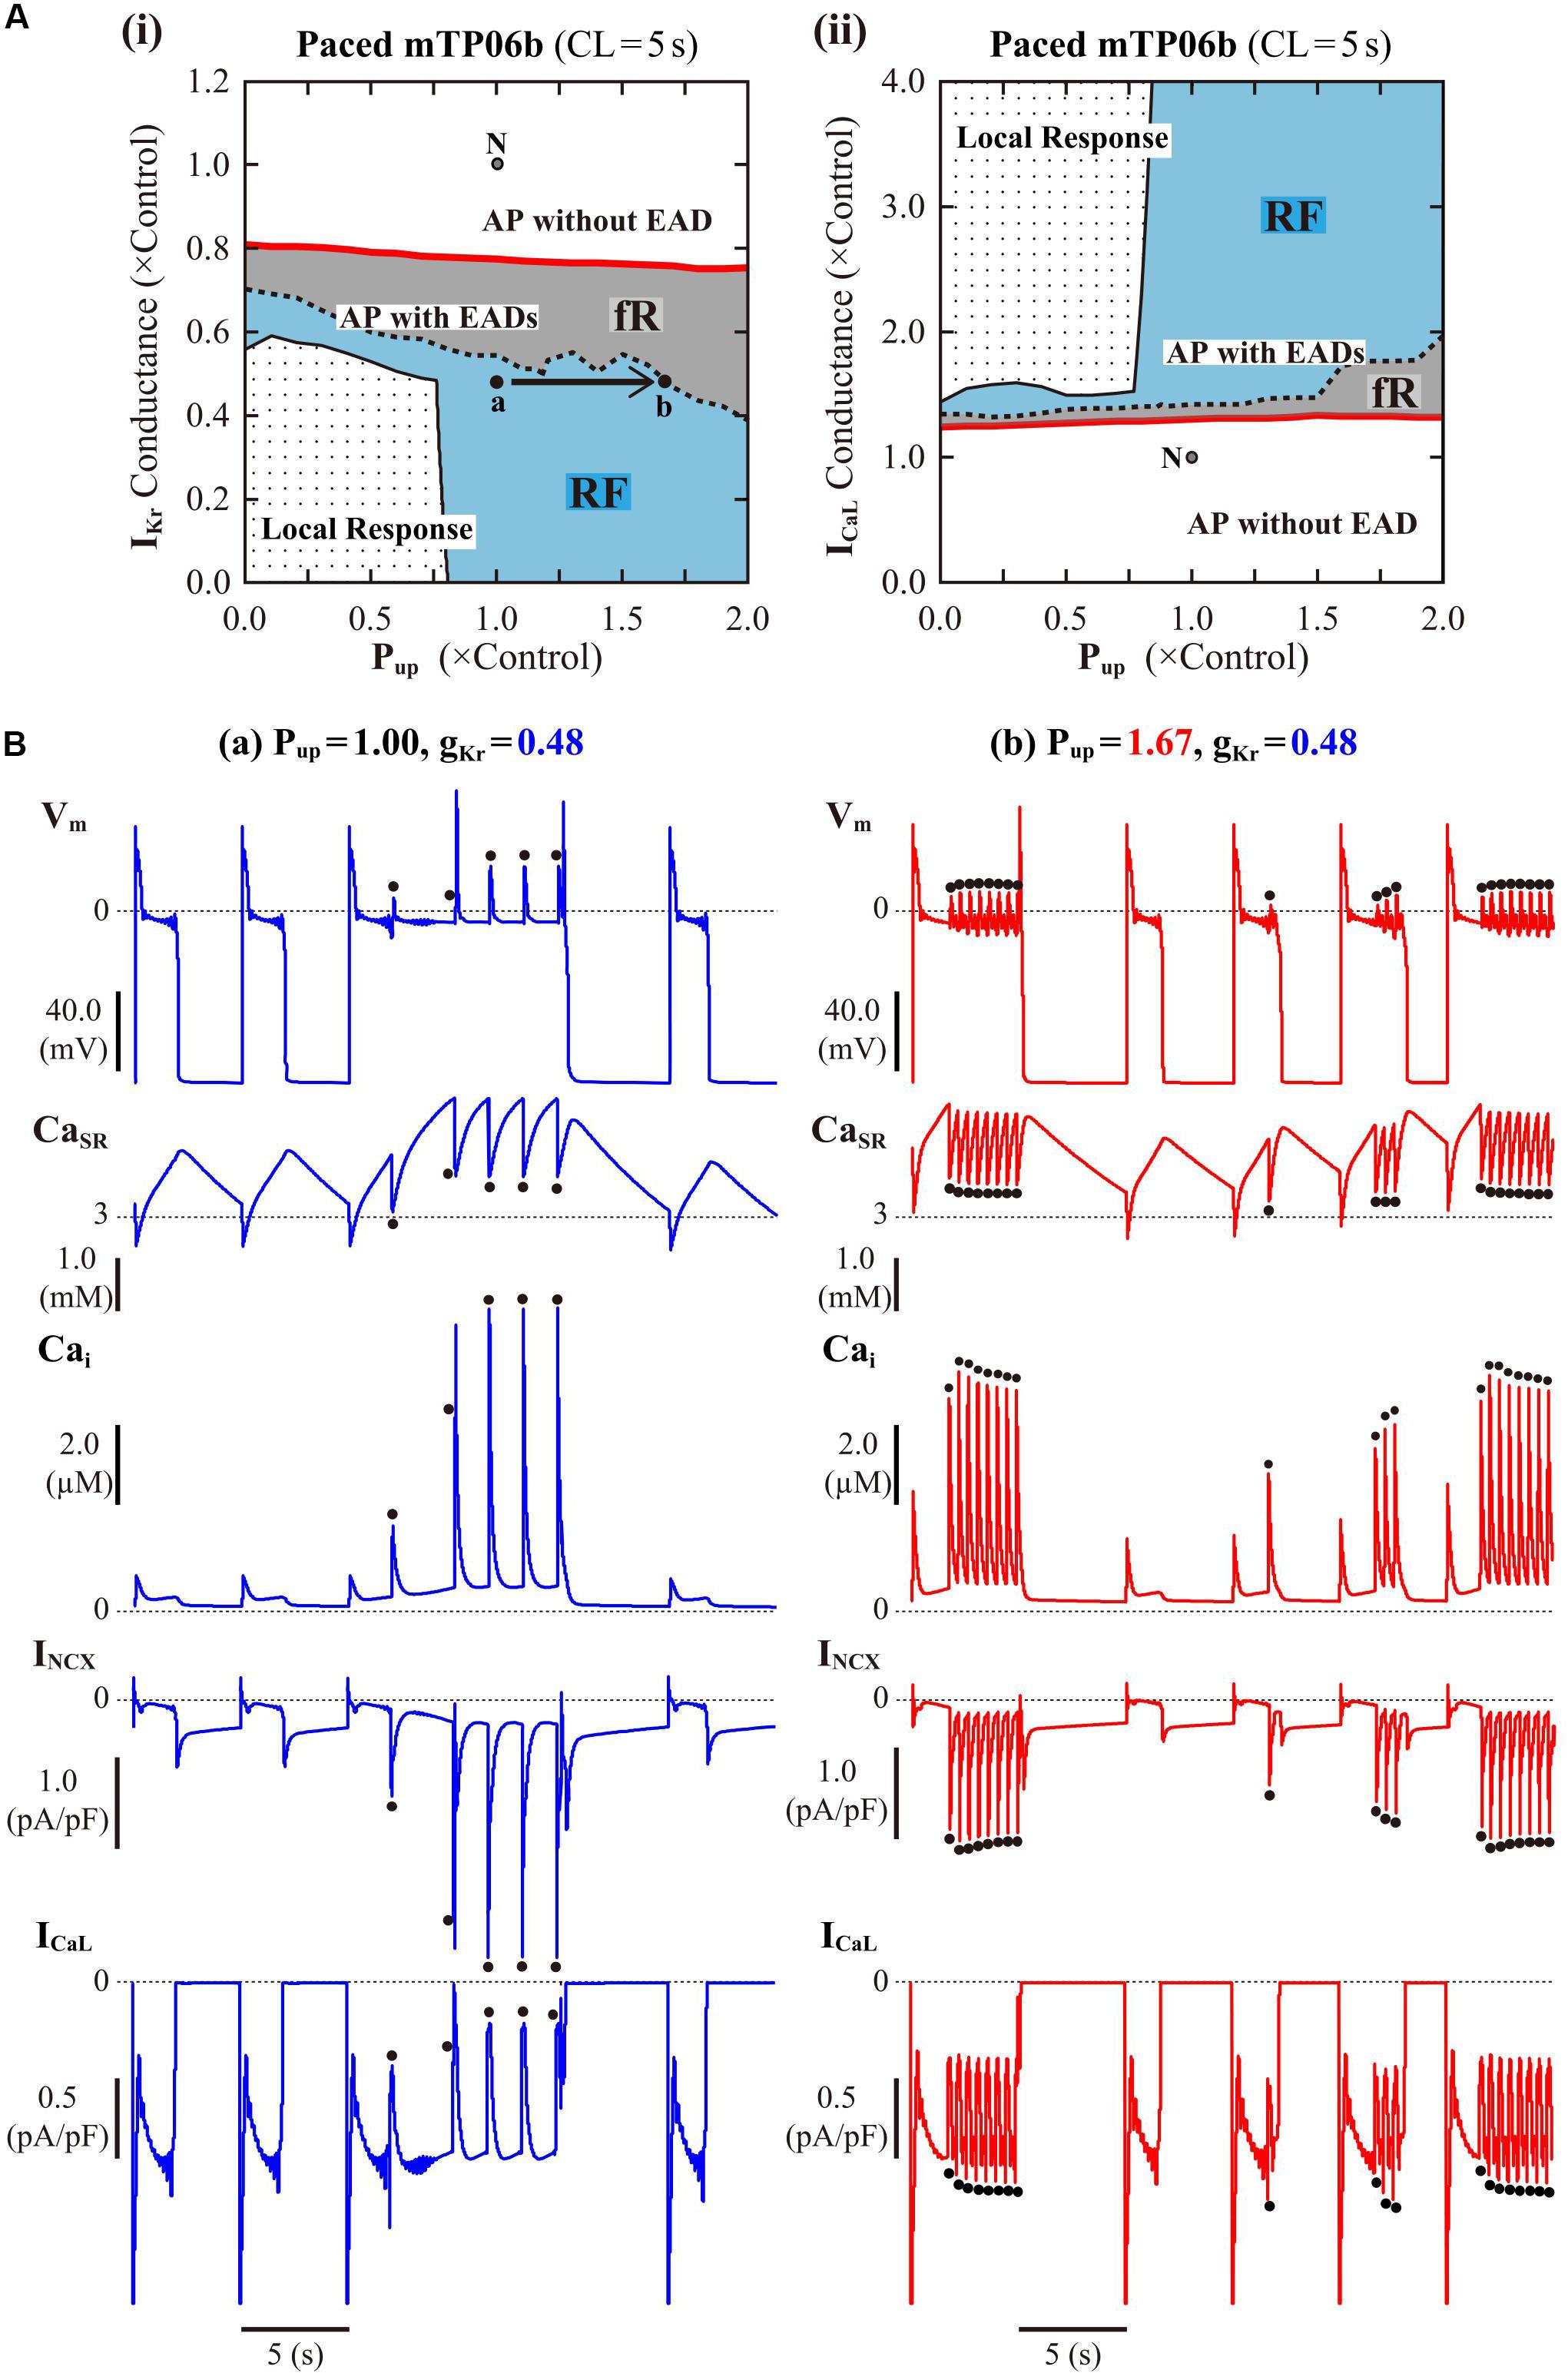
Figure 6. Influences of SR Ca2+ handling on EAD generation in the mTP06b model. (A) Phase diagrams on the Pup–gKr (i) and Pup–gCaL (ii) parameter planes, depicting displacements of critical points for the occurrence of short-term EADs (red solid lines) and long-term or sustained EADs (dashed lines) as well as the emergence of local responses (black solid lines). By the parameter sets of these critical points, the parameter planes are divided into the areas of APs with short-term EADs (fR), APs with long-term or sustained EADs (RF) and local response, as described for Figure 3A. The points “a” and “b” in the panel (i) denote the parameter sets for simulations of the model cell dynamics shown in B-a,b, respectively. (B) Simulated dynamics of the model cells with the normal (1.00) or increased (1.67) Pup and the reduced gKr (0.48). Temporal behaviors of the model cells were computed for 30 min with pacing at 0.2 Hz; Vm, CaSR, Cai, INCX and ICaL for additional 30 s are shown as steady-state dynamics. The dots indicate spontaneous SR Ca2+ releases as evidenced by abrupt falls of CaSR and resulting increases in Cai and inward INCX.
Contributions of INCX to bifurcations and EAD formation were also explored in relation to those of intracellular Ca2+ dynamics, SR Ca2+ cycling, and ICaL. The scaling factor of INCX was varied from 0.1 to 10, within the range of experimental changes in Na+/Ca2+ exchanger densities or INCX (Milberg et al., 2008, 2012b; Pott et al., 2012). On the INCX–gKr and INCX–gCaL parameter planes (Supplementary Figure S8), enhancement of INCX yielded the upward shift in the critical gKr and downward shift in the critical gCaL for EAD formation (see red curves in Supplementary Figure S8). However, the TP06b model did not exhibit a significant shift in the critical gKr or gCaL for EAD formation when INCX was reduced; only small (20–30%) inhibition of INCX was effective in shifting the critical points toward the prevention of EADs, with further inhibition resulting in the promotion of EADs. Whether EADs emerge or not depended mainly on the amplitude of inward INCX and ICaL during the AP late phase 2: As exemplified in Supplementary Figure S6B, disappearance of EADs with lower INCX density was accompanied by a decrease of inward INCX and a slight reduction of ICaL with increased inactivation during the preconditioning phase just before initiation of the first EAD (see the ellipses and inset in Supplementary Figure S6B).
We finally examined effects of ICaL on EAD formation in the paced mTP06b model and bifurcations of dynamical behaviors in the non-paced mTP06b model by changing gCaL. gCaL-dependent changes in AP dynamics observed in the paced model cell when IKs was normal (gKs = 1) and one-parameter bifurcation diagrams as functions of gCaL for the non-paced cell model are shown in Supplementary Figures S9A-i,ii, respectively. The one-parameter bifurcation diagrams for gCaL (Supplementary Figure S9A-ii) suggest the scenario of EAD formation during enhancement of ICaL, which is different from those in the K05 and O11 models (Kurata et al., 2017): Increments of gCaL yielded unstable EPs via a saddle-node bifurcation (SNB) of EPs and unstable LCs via a SNB of LCs. With normal IKs (gKs = 1), an enhanced gCaL of 1.298-fold the control value was high enough for EAD formation in the mTP06b model (Supplementary Figure S9A-i), whereas unrealistically large increases in gCaL (to 4.248-fold the control value) were required in the mTP06a model (Supplementary Figure S10A). Supplementary Figure S9B shows a phase diagram of AP behaviors in the paced model cell (Supplementary Figure S9B-i) and a two-parameter bifurcation diagram for the non-paced model cell (Supplementary Figure S9B-ii), as well as the merged diagram (Supplementary Figure S9B-iii), on the gCaL–gKs parameter planes. Decreasing gKs shifted the critical gCaL value for EAD generation toward lower values and enlarged the gCaL region of EADs (RF) in the mTP06b model. Larger gCaL (going into the RF region in Supplementary Figures S9B-i,iii) led to the AP behavior classified into the RF type with small-amplitude spontaneous Vm oscillations around unstable LCs. EPs (VE3) in the mTP06 models were unstable independent of gCaL unless gKs was extremely low or high; no HB occurred for moderate variation of gKs value and consequently stability changes of the EP did not occur (see also Supplementary Figure S9B-ii). In the IKs-eliminated mTP06a/b models (gKs = 0), an EP (VE3) was stabilized via supercritical HBs at relatively small gCaL; stable LCs emerging from the HBs were immediately destabilized via a period-doubling bifurcation (PDB) or Neimark-Sacker bifurcation (NSB) (Supplementary Figure S10B). EAD did not occur at gKs = 0; larger ICaL caused repolarization failure, in this case, local response.
Dynamical Mechanisms for Initiation and Termination of EADs in the mTP06 Model
IKs Activation-Dependent Bifurcations of the Fast Subsystem Associated With EAD Formation
To clarify the dynamical mechanisms of EAD formation in the IKr-reduced LQT2-type mTP06b model and why EADs emerge at larger gKr in the mTP06b model than in the mTP06a model (compare Figure 2 and Supplementary Figure S1), we further performed the slow-fast decomposition analysis (Tran et al., 2009; Qu et al., 2013; Xie et al., 2014). The IKs activation gating variable xs or IKs channel open probability (xs2) appears to be a slow variable yielding the termination of EADs (Figure 2A-a, the second from top). Thus, bifurcation diagrams for the fast subsystem composed of the state variables other than the slow variables xs, Nai and CaSR were first constructed as functions of xs2, with Nai and CaSR fixed at constant values (Figure 7, left); then, trajectories of the full system (with fixed Nai and CaSR) were superimposed on the diagrams (Figure 7, right). The quasi-EP (qEP), defined as a steady state of the fast subsystem, at depolarized quasi-Vm (qVE3) has possessed a property of spiral sink in the mTP06b model (Figure 7A) but spiral source in the mTP06a model (Figure 7B) at xs2 = 0. Stable qEP in the former was destabilized via an HB as xs2 increased. The gKr reduction led to broadening of the xs2 region of stable qEPs (compare green traces of qVE3 in Figures 7A-i,ii, left). The gKr reduction-induced broadening of the xs2 range of stable qEPs yielded a transient trapping of the full system trajectory in the attractor basin of the stable qEP (Figure 7A-ii, right). This trapping of the full system trajectory around the stable qEP as spiral sink sustained until the trajectory came across the steady-state xs2 curve. This trapping phenomenon was not observed in the mTP06a model (Figure 7B, right) or the IKr-normal mTP06b model (Figure 7A-i, right), because the full system trajectories did not intersect with the stable steady-state branch (qVE3) before intersecting the steady-state xs2 curve. These results indicate that an acceleration of the voltage-dependent ICaL inactivation to form the mTP06b model from the mTP06a model plays a critical role in the stabilization of qVE3, consequently leading to the trapping of the full system trajectory.
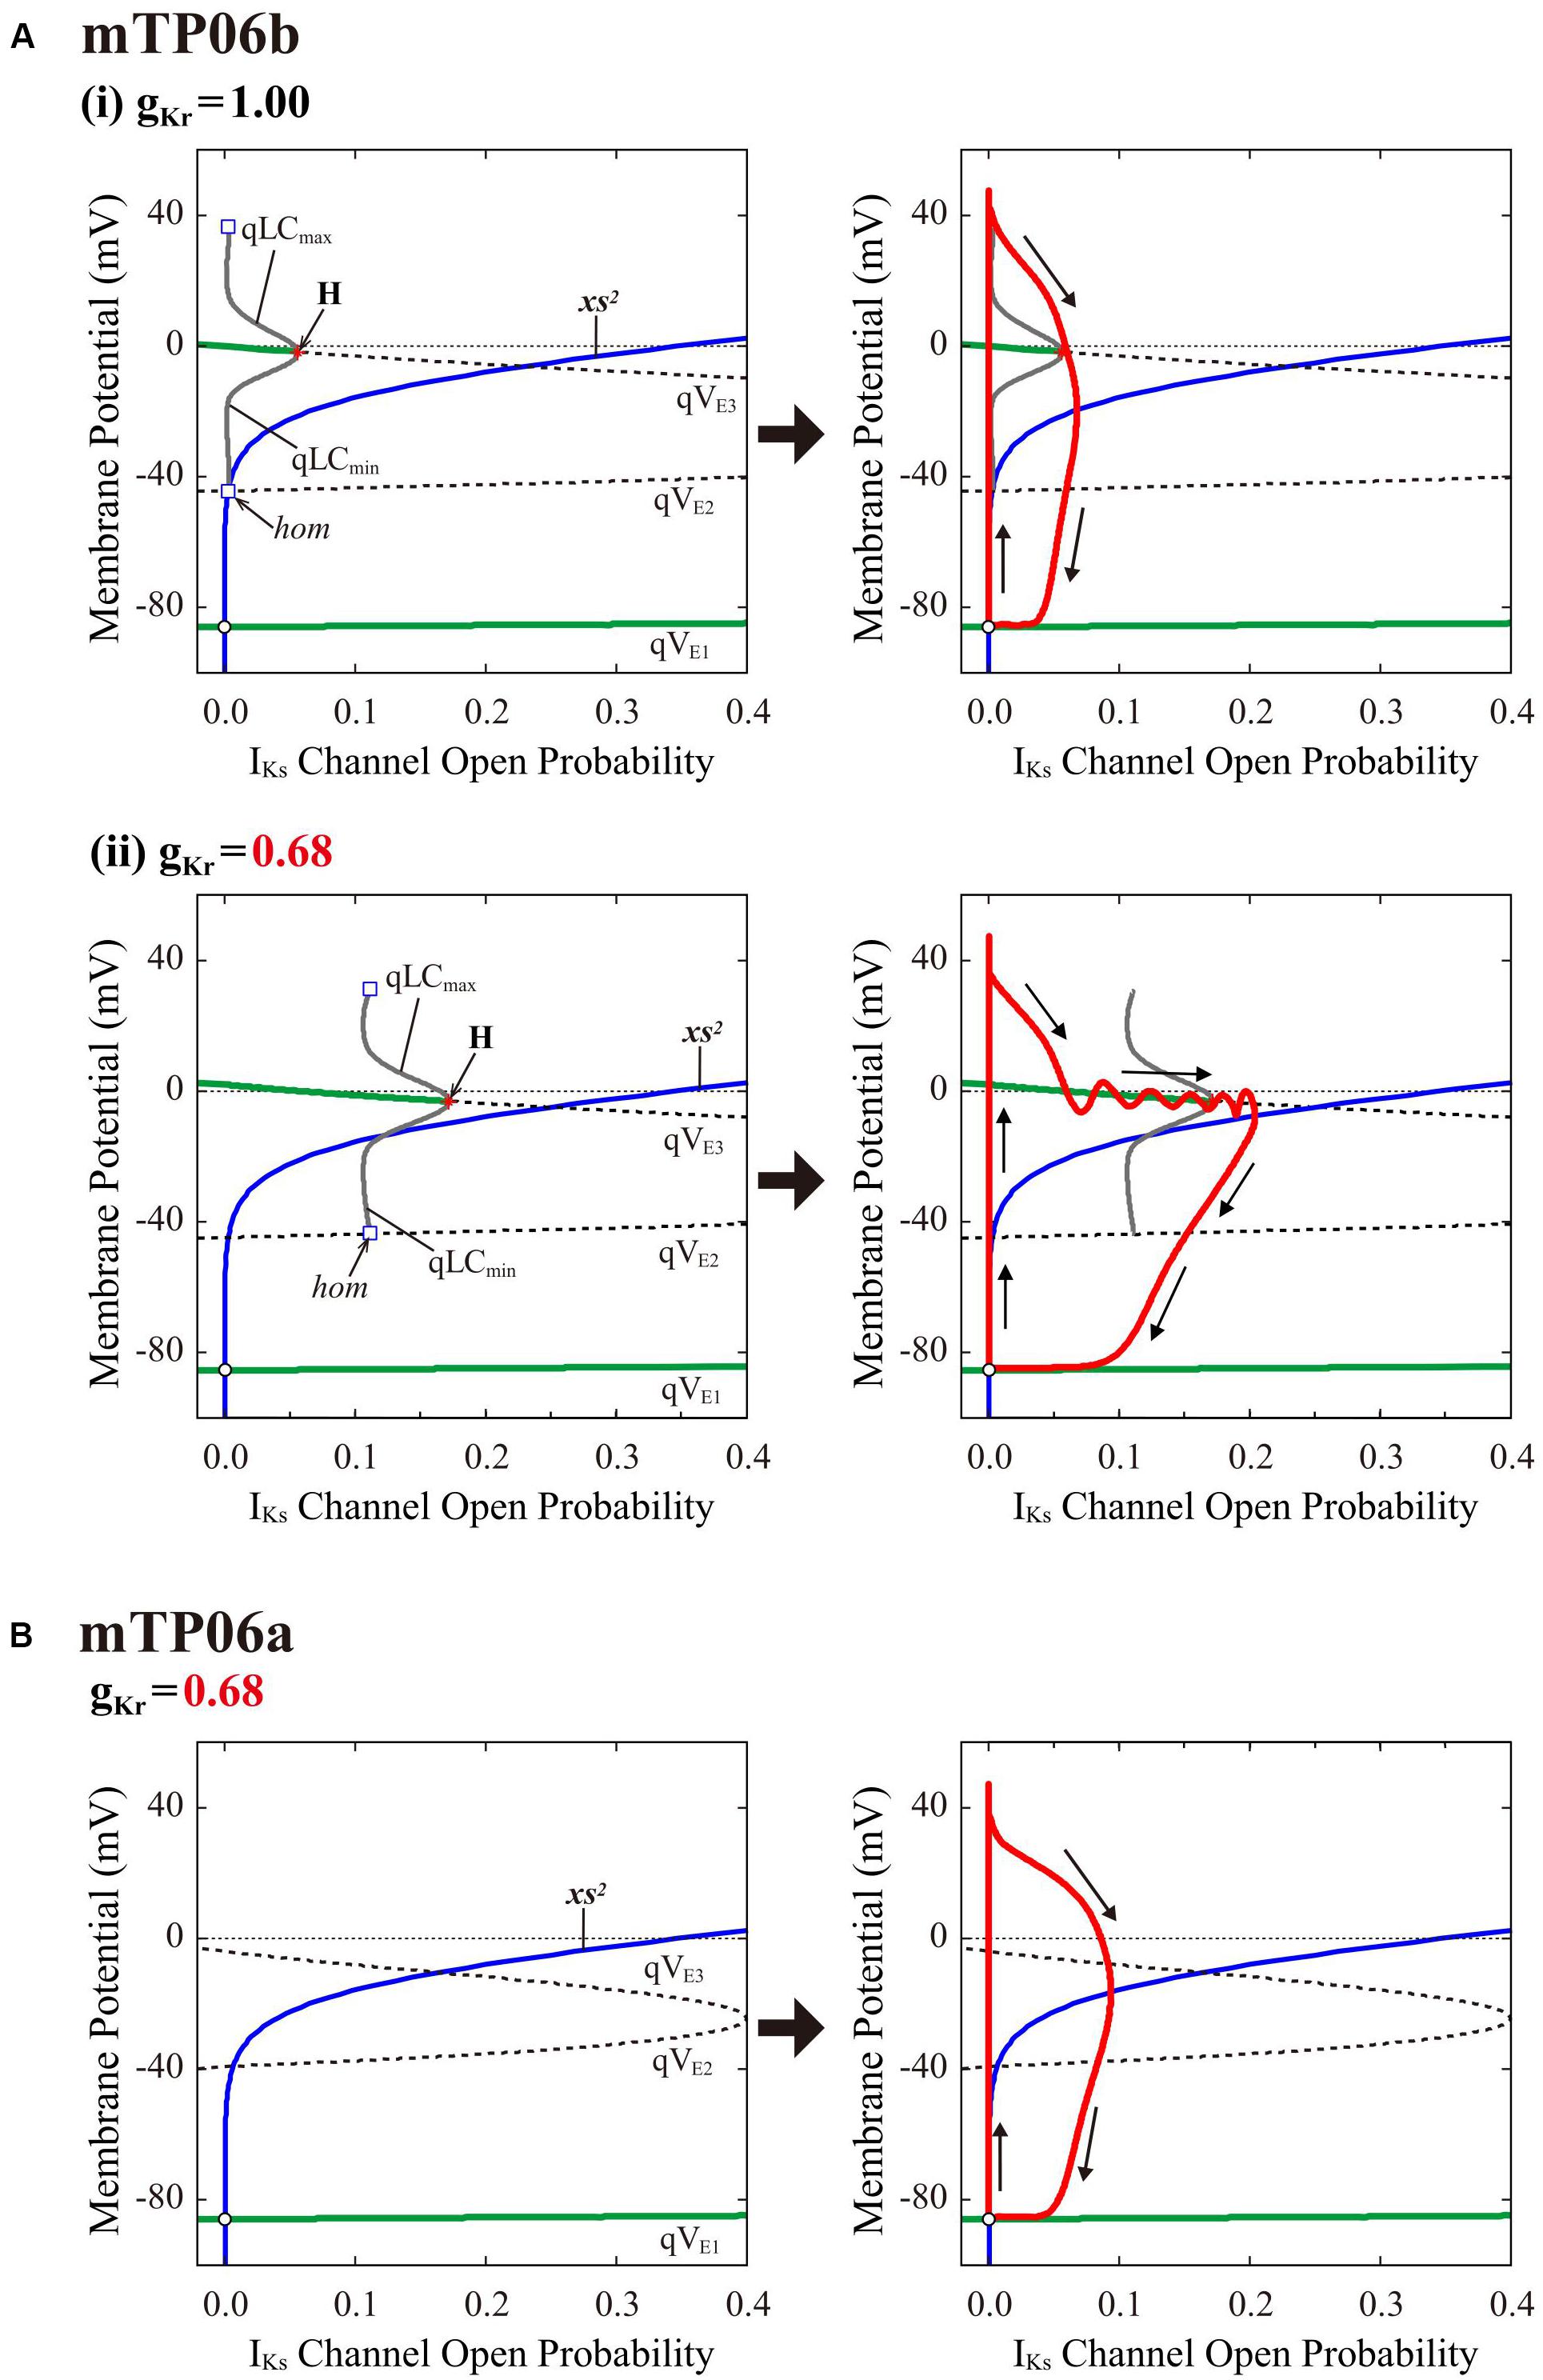
Figure 7. Dynamical mechanisms of EAD initiation and termination determined by the slow-fast decomposition analysis for the mTP06 models. Shown are one-parameter bifurcation diagrams of quasi-equilibrium points (qEPs) and quasi-limit cycles (qLCs), where the steady-state branches as loci of Vm at qEPs (qVE1–3) and periodic branches as the potential minimum (qLCmin) and maximum (qLCmax) of qLCs are depicted as functions of the square of the IKs activation gating variable (xs2), i.e., IKs channel open probability for the fast subsystems of the gKr-normal [A-(i), left] and gKr-reduced [A-(ii), left] mTP06b model and gKr-reduced mTP06a model (B, left). Other slow variables, Nai and CaSR, were fixed at constant values: Nai = 6 mM for all cases; CaSR was fixed at the value which was reached just before occurrence of the first EAD or the maximum values during AP phase 2 (when no EAD occurred), i.e., at 0.5 mM and 1.5 mM for the normal and gKr-reduced mTP06b model, respectively, and at 0.5 mM for the gKr-reduced mTP06a model. The steady-state branches consist of the stable (green solid lines) and unstable (black dashed lines) segments. The periodic branches (gray solid lines) are all unstable. The blue lines indicate the steady-state xs2 curve. Trajectories of the full system (with the fixed CaSR and Nai) are superimposed on the bifurcation diagrams for the fast subsystems (red lines in each right panel). The arrows indicate the directions of changes in the state variables. H, Hopf bifurcation; hom, homoclinic bifurcation.
Dynamical Mechanisms of Spontaneous SR Ca2+ Release-Mediated EAD
To clarify the dynamical mechanisms of spontaneous SR Ca2+ release-mediated EAD formation, we further examined the stability, dynamics and bifurcations of the voltage-clamped mTP06 model. Ca2+ dynamics during a train of 1-s depolarizing test pulses to −10 mV (from the holding potential of −85 mV) applied at 2-s intervals to mimic APs evoked by 0.5 Hz pacing were first determined for the mTP06b model with different Pup (Figure 8A). Spontaneous SR Ca2+ releases occurred when CaSR increased at higher Pup, as indicated by the dots in Figure 8A; as Pup increased, the time to the first Ca2+ release and period of spontaneous Ca2+ releases shortened, and their frequency increased. Figure 8B shows one-parameter bifurcation diagrams of the steady-state stability and dynamics of Cai as functions of the clamped-Vm in the voltage-clamped mTP06b model. Steady-state intracellular Ca2+ concentrations (EPs) in the voltage-clamped model cell were stable at hyperpolarized and depolarized Vm (green traces in the right and middle panels of Figure 8B) but became unstable via supercritical HBs in the Vm range of AP phase 2 and early phase 3 (dashed traces in Figure 8B, middle). LCs emerging from the HB points were first stable but were destabilized via NSBs after small changes in Vm; spontaneous Ca2+ oscillations occurred in the Vm range of unstable LCs, i.e., between NS1 and NS2 (gray traces labeled as LCmin and LCmax for the minimum and maximum Cai during LC oscillations in Figure 8B). As shown in Figure 8C, the unstable Vm region (uEP) was enlarged by increasing Pup (see Figure 8C, left), decreasing INCX activity (Figure 8C, middle), and/or enhancing ICaL (Figure 8C, right), all of which led to increases in CaSR.
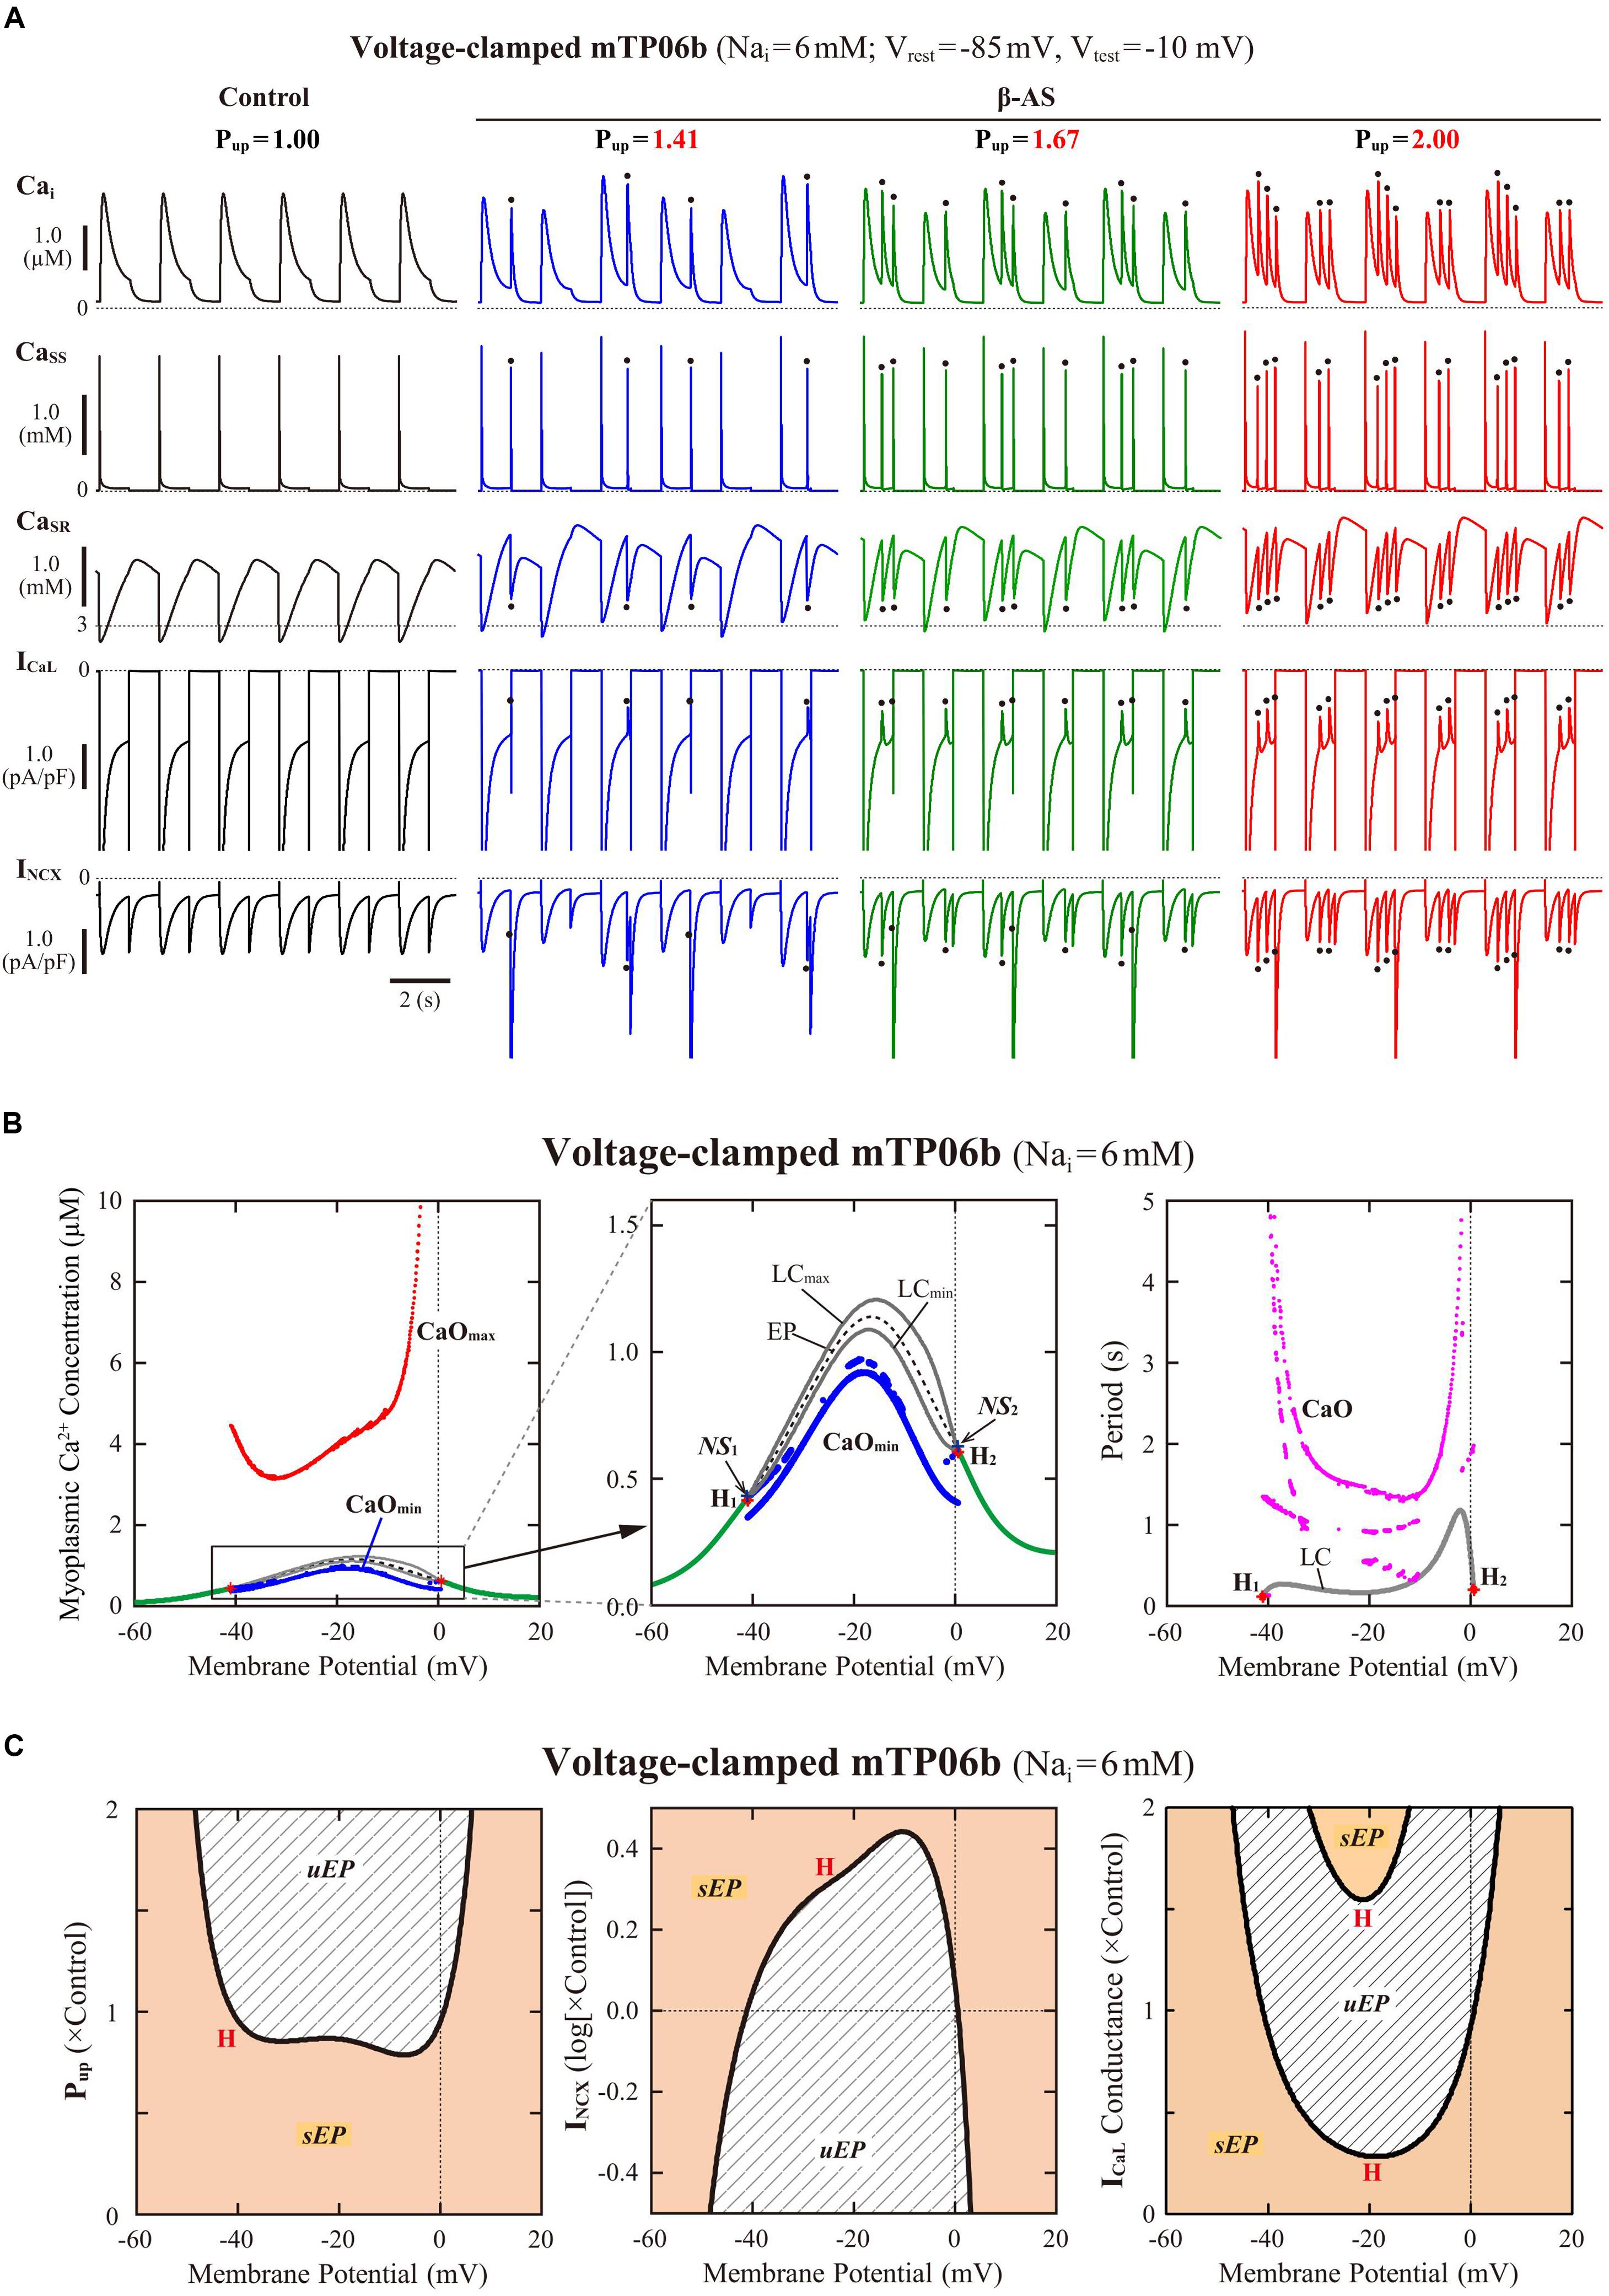
Figure 8. Stability and bifurcations of intracellular Ca2+ dynamics in voltage-clamped mTP06b model cell. (A) Dynamics of intracellular Ca2+ concentrations as well as Ca2+-dependent sarcolemmal currents in the Nai-fixed voltage-clamped model cell under the control condition (Pup = 1) and the conditions of β-AS (Pup = 1.41, 1.67, and 2.00). Temporal behaviors of the voltage-clamped model cell during a train of 1-s step depolarization from −85 mV to −10 mV at 0.5 Hz were computed for 10 min; Cai, Cass, CaSR, ICaL and INCX for the last 12 s (6 pulses) are shown as steady-state dynamics. Spontaneous SR Ca2+ releases, as evidenced by abrupt falls of CaSR and increases in Cai, Cass and inward INCX with attenuated ICaL, occurred at higher Pup (indicated by the dots). (B) One-parameter bifurcation diagrams of the equilibrium point (EP) and extrema of limit cycles (LCmin/max) and spontaneous Cai oscillations (CaOmin/max) as functions of Vm for the voltage-clamped model cell (left and middle). The middle panel shows an enlarged diagram of the rectangular area in the left panel. The periods of spontaneous Ca2+ oscillations (CaO) and limit cycles (LC) are also plotted against Vm (right). H1–2, Hopf bifurcations of the EP; NS1–2, Neimark-Sacker bifurcations of the LC. (C) Two-parameter diagrams on the Vm–Pup (left), Vm–INCX (middle) and Vm–gCaL (right) planes, indicating how the unstable Vm range changed depending on Pup, INCX and ICaL. HB values, i.e., the critical Vm at which an EP is (de)stabilized are plotted as functions of Pup, INCX and ICaL for the Nai-fixed mTP06b model; the HB points were very close to the Neimark-Sacker bifurcation points at which LCs were destabilized with the emergence of CaOs.
To further clarify the CaSR-dependent mechanism of spontaneous SR Ca2+ releases in the Pup-increased mTP06b model and why SR Ca2+ release-mediated EADs emerge more frequently at larger Pup, we also performed the slow-fast decomposition analysis for the slow variable CaSR. Bifurcation diagrams were constructed as functions of CaSR for the voltage-clamped fast subsystem composed of the voltage-independent state variables fCaL (Ca2+-dependent inactivation gate for ICaL), R (proportion of closed SR Ca2+ release channels), Cass, and Cai (Figure 9). Trajectories of the voltage-clamped full system dynamics as shown in Figure 8A for the normal (1) and enhanced (1.67) Pup were superimposed on the diagrams. The steady states of the fast subsystem, stable at lower CaSR (green traces in the middle and right panels of Figure 9), became unstable via an HB at higher CaSR (dashed traces in the middle and right panels of Figure 9). In the Pup-enhanced system, spontaneous SR Ca2+ releases as shown in blue trajectories in the middle and right panels of Figure 9B occurred when the full system trajectory, moving along the stable steady-state branch, passed through the HB point, i.e., when CaSR exceeded the HB value. In contrast, the Pup-normal system did not exhibit spontaneous SR Ca2+ release, because an increment of CaSR (Ca2+ refilling of the SR) during Ca2+ transient decay was too slow for the full system trajectory to reach the HB point for CaSR before Vm repolarization (Figure 9A, middle and right).
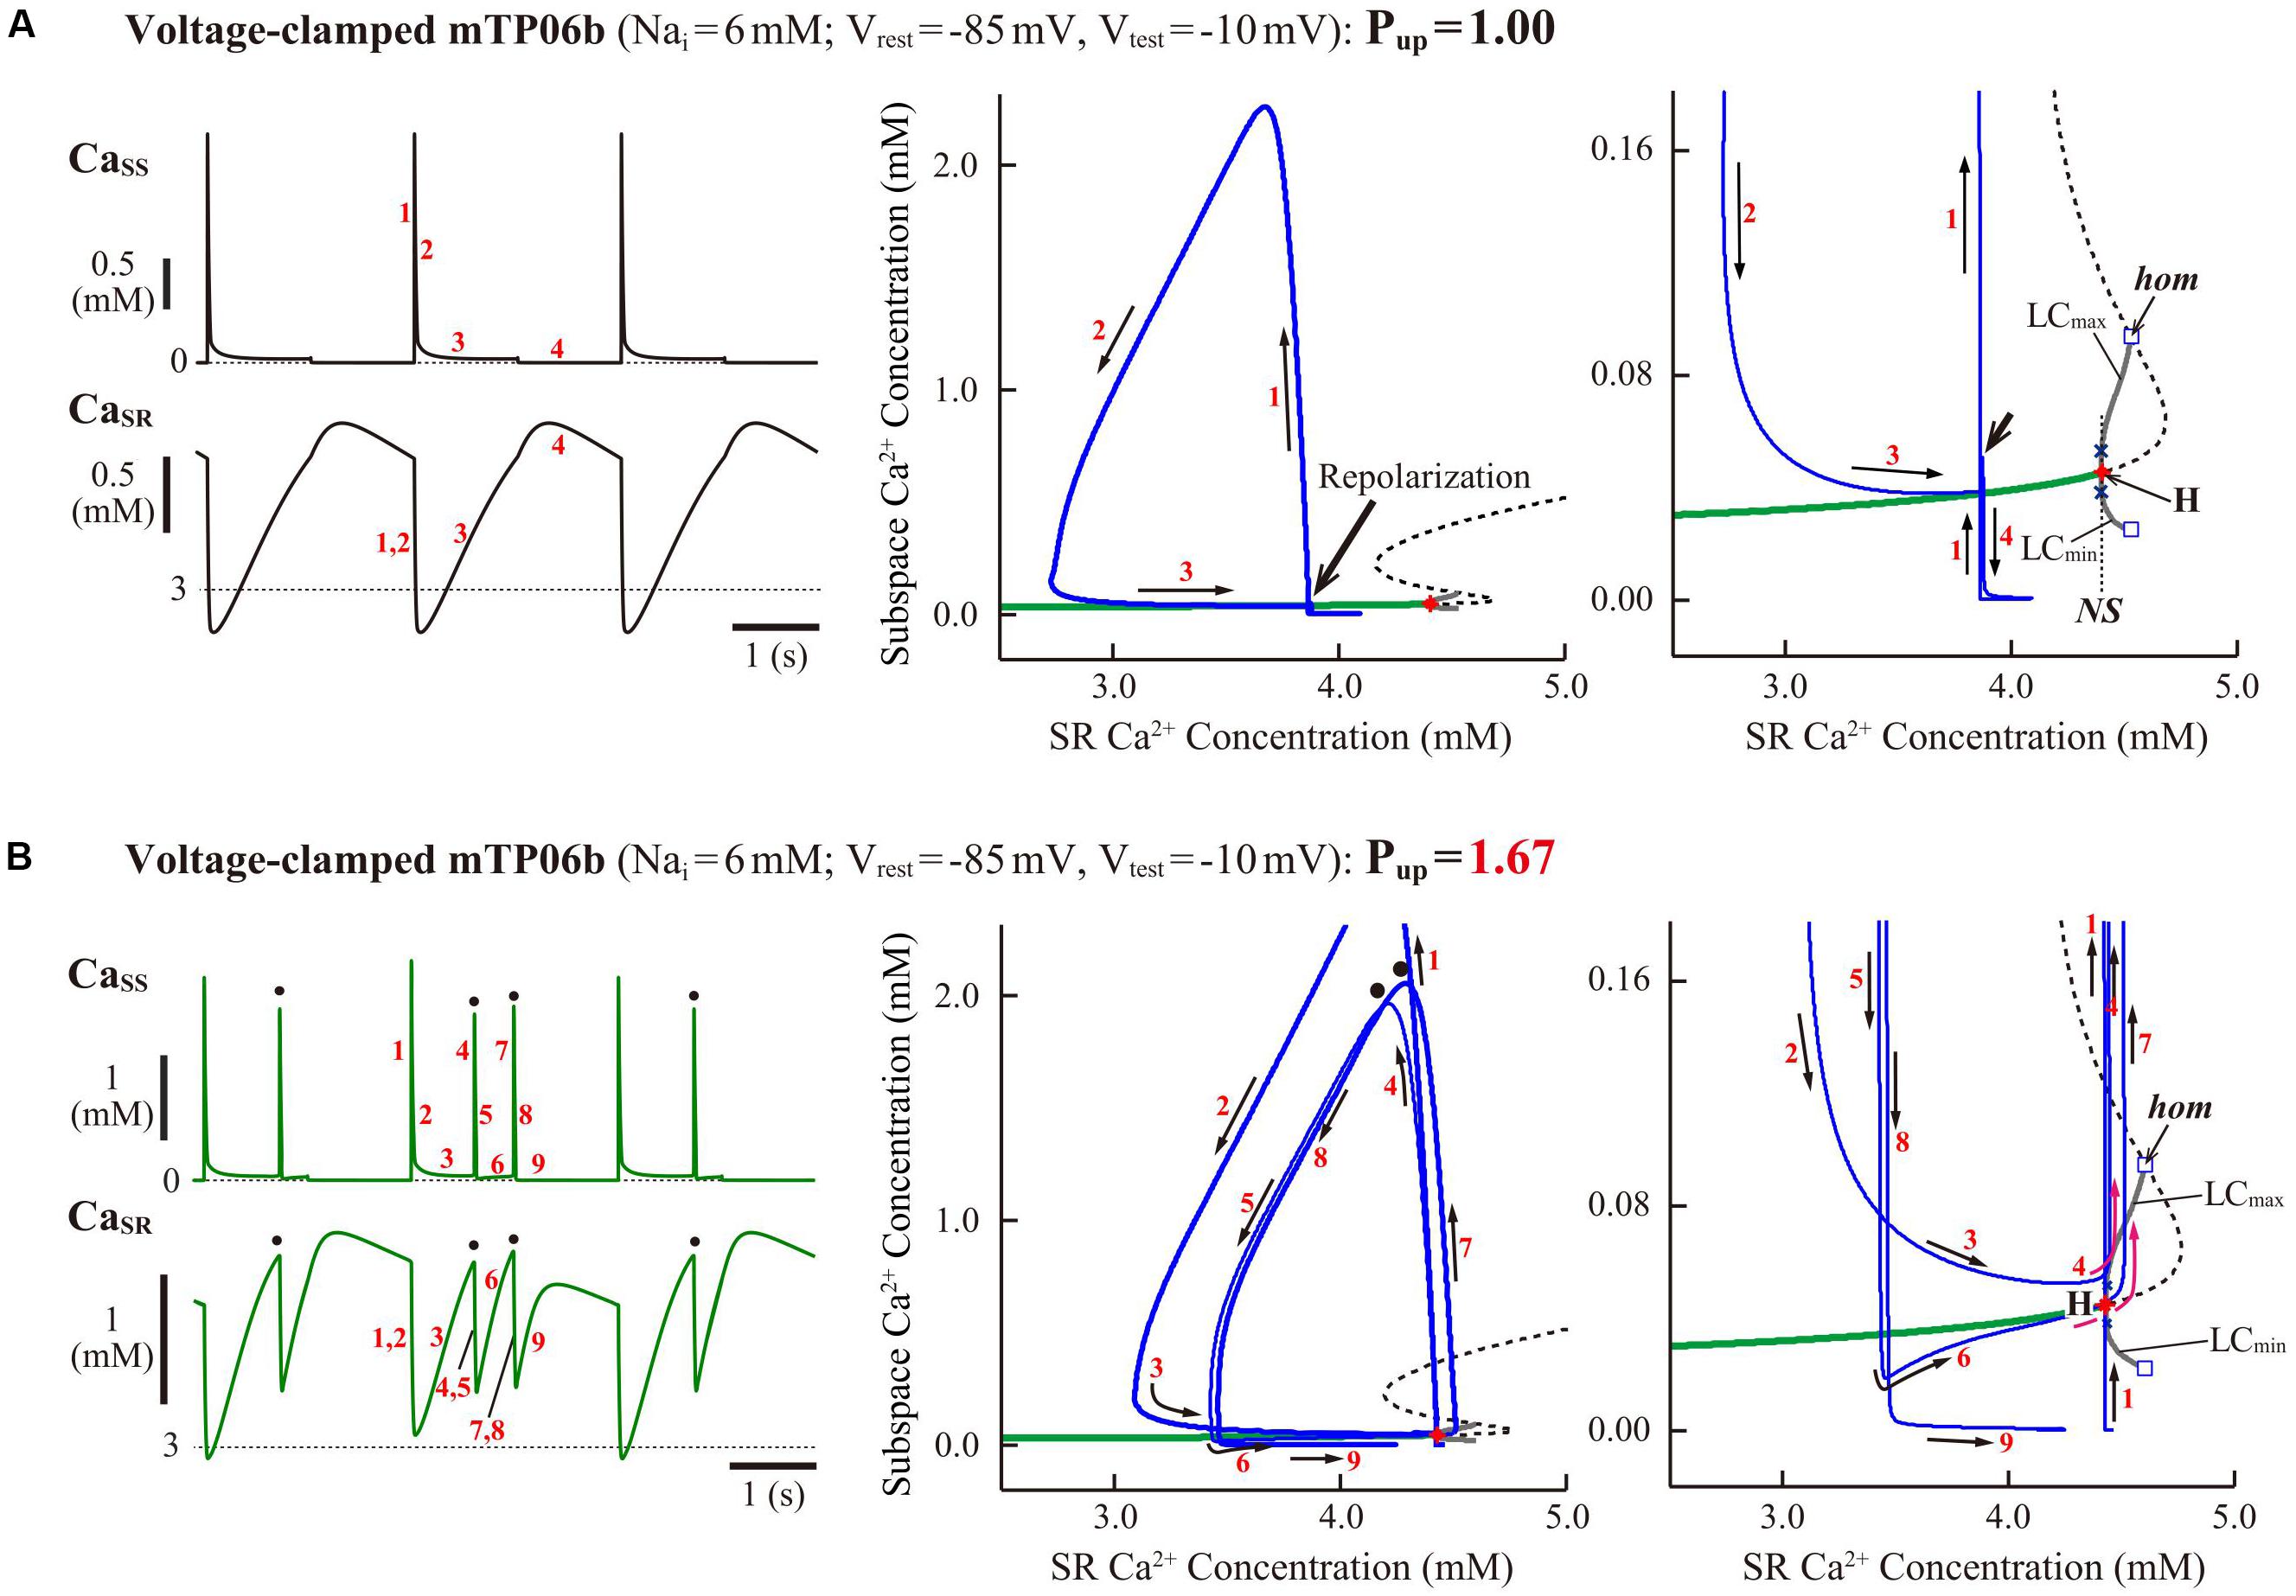
Figure 9. Slow-fast decomposition analysis for the slow variable CaSR of the voltage-clamped mTP06b model. Normal (middle) and expanded (right) scale views of one-parameter bifurcation diagrams, where the steady-state branch as a locus of Cass at EPs, as well as periodic branches as the minimum (LCmin) and maximum (LCmax) of Cass limit cycles (LCs) that were almost always unstable, are plotted as functions of CaSR for the fast subsystems of the voltage-clamped model cells with the normal (A) and increased (B) Pup. The green solid and black dashed lines represent stable and unstable steady-state branch, respectively. Subcritical HB (H) with the emergence of an unstable LC, NSB from a stable LC to an unstable one following a SNB of LCs (NS), and homoclinic bifurcation (hom) are located. Trajectories projected onto the CaSR-Cass plane of the full system during a 1-s step depolarization to −10 mV (from −85 mV) and subsequent 1-s repolarization to −85 mV are superimposed on the diagrams; Cass and CaSR dynamics in the full system during this voltage-clamp pulse are shown on the left. The labels “1”–“9” for the arrows on each diagram (middle, right) indicate the time course of changes in the state variables (Cass and CaSR) along the trajectories, with the labels also given for the Cass and CaSR dynamics (left).
Discussion
In this study, we theoretically investigated dynamical mechanisms of EAD formation in the TP06 model for HVMs, which has often been used for simulations and theoretical analyses of reentrant arrhythmias, automaticity, multi-stability and EAD formation in HVMs, in relation to the model cell dynamical behaviors and their bifurcations. In summary, EAD formation and its dynamics in the paced (non-autonomous) mTP06 model cell basically depended on stability and bifurcations of the non-paced (autonomous) model cell. Bifurcation phenomena and dynamical mechanisms of EAD formation in the mTP06 model were different from those in the K05 and O11 models tested previously (Kurata et al., 2017) in several respects (see also Supplementary Materials for additional discussions).
Validation of the mTP06 Model for EAD Reproducibility in LQT1 and LQT2 Conditions
EAD Formation in LQT1 and LQT2 Conditions (mTP06a vs. mTP06b)
Like the K05 model, the TP06b model with accelerated ICaL inactivation could recapitulate EAD formation in the IKs-reduced LQT1-type and IKr-reduced LQT2-type HVMs. The mTP06b model was much more vulnerable to EAD formation than the mTP06a model, consistent with the previous experimental finding that slowing ICaL inactivation eliminated EADs (Qu et al., 2013). As demonstrated by the slow-fast decomposition analysis (Figure 7), higher susceptibility of the mTP06b model to EAD development is attributable to the stabilization of qEPs at depolarized Vm close to the plateau Vm in the xs-parameterized fast subsystem by accelerating ICaL inactivation.
EAD amplitudes in the mTP06b model (LQT1/2 versions) during pacing (∼30 mV) were smaller than those in the K05 and O11 models (Zimik et al., 2015; Kurata et al., 2017) as well as those in rabbit and guinea-pig ventricular myocyte models (Song et al., 2015; Zhong et al., 2018); however, they were comparable to those in many experimental reports for isolated HVMs (Verkerk et al., 2000; Veldkamp et al., 2001) and human iPS cell-derived LQT2 cardiomyocytes (Itzhaki et al., 2011) as well as for ferret, rabbit, and mouse ventricular myocytes (Marban et al., 1986; Liu et al., 2012; Edwards et al., 2014). Periods of EADs (∼200 ms) were shorter than those in the other HVM models, but comparable to the experimental data from HVMs (Verkerk et al., 2000).
Rate Dependence of EAD Formation (Validation for LQT2 Model)
In LQT2 patients, fatal cardiac events often occur during sleep or at rest, i.e., in bradycardia (Shimizu and Horie, 2011; Shimizu, 2013). The K05 and O11 models could partially reproduce the bradycardia-related EADs (Kurata et al., 2017). Like the other HVM models, the Nai-variable mTP06b model could partly reproduce the rate-dependent EAD generation in LQT2 patients (Figure 4). In the IKr-reduced mTP06b model, however, EADs appeared only when pacing CLs increased to 3 s or more (i.e., pacing rates decreased to 20 beats/min or less) and extreme bradycardia continued for more than 4 min (Supplementary Figure S4). Although LQTS patients are known to exhibit sinus arrest or severe bradycardia due to coexisting sick sinus syndrome or atrio-ventricular block (Roden et al., 1996; Chiang and Roden, 2000), such long-lasting extreme bradycardia may be unlikely to occur often in LQT2 patients. Like the Luo-Rudy model for guinea-pig ventricular myocytes (Viswanathan and Rudy, 1999), the IKr-reduced O11 model could reproduce pause-induced EAD formation on increasing a pacing CL from 1 s to 2 s, which was attributable to a decrease in IKs and Cai increase-mediated enhancement of inward INCX at the lower pacing rate (data not shown). In contrast, the mTP06 model did not exhibit EADs by a single pause or transient bradycardia, which may be a limitation of this model cell.
In our previous study for the Nai-variable K05 and O11 models (Kurata et al., 2017), the facilitation of EAD formation during lower rate pacing was accompanied by the decrease in Nai and resulting reductions in outward INaK and inward shift of INCX. This study also demonstrated for the mTP06b model that the facilitation of EAD formation at lower pacing rates was mainly due to the decrease in Nai and resultant changes in INaK (Figure 4B). Thus, the major mechanism for bradycardia-related EADs in the mTP06b model is essentially the same as that in the K05 model. Bradycardia-induced EADs are believed to be ascribable to a reduction of IKs (and increment of ICaL). In the mTP06 model, however, IKs reduction (or ICaL increment) did not occur when a pacing CL increased from 1 s to 2–5 s; deactivation of IKs was fast enough to complete before the next stimulus during 1-Hz pacing (Wang et al., 1994; Virág et al., 2001; Kurata et al., 2005; Jost et al., 2007).
EAD Formation During β-AS (Validation for LQT1 Model)
In LQT1 patients with smaller IKs, fatal cardiac events are exercise-induced (tachycardia-related), because adrenergic enhancement of ICaL is no longer counterbalanced by the concomitant stimulation of IKs; the smaller increase in IKs leads to the occurrence of EADs that trigger ventricular tachyarrhythmia. The K05 model, but not the O11 model, could reproduce this IKs reduction-related EAD formation as a cause of ventricular tachycardia in LQT1 patients during β-AS (Sogo et al., 2016; Kurata et al., 2017). The mTP06b model was also capable of reproducing β-AS-related EAD formation in LQT1 cardiomyocytes, which could clearly be accounted for by the ICaL- and IKs-dependent bifurcation properties of the model cell (Figure 5). ICaL/IKs-dependent properties of EAD formation in the mTP06b model were very similar to those in the K05 model (Kurata et al., 2017), whereas ICaL/IKs-dependent HB properties of the mTP06 models were totally different (Supplementary Figures S9B, S10). However, EAD formation in the mTP06b model during β-AS was different in a mechanism from that in the K05 model: EADs in the mTP06b model involved spontaneous SR Ca2+ releases and resulting increments of inward INCX (Figure 5A and Supplementary Figure S4), while those in the K05 model solely ICaL-reactivation dependent, not involving spontaneous SR Ca2+ releases (Kurata et al., 2017). It is likely that the spontaneous SR Ca2+ release is implicated in EAD formation during β-AS; delayed afterdepolarizations (DADs), known to be induced by spontaneous SR Ca2+ releases, often accompanied EADs (Priori and Corr, 1990; Volders et al., 2000; Zhao et al., 2012). Amplitudes of spontaneous SR Ca2+ releases in the mTP06b model appeared to be comparable to or slightly larger than those observed in experimental studies during β-AS (Volders et al., 2000; Zhao et al., 2012) or for LQT2 cardiomyocytes (Choi et al., 2002; Němec et al., 2010, 2016; Parikh et al., 2012) unless AP phase 2 was extremely long (Figure 8A and Supplementary Figure S5), while much larger than those reproduced by another HVM model (Trenor et al., 2013) and rabbit ventricular myocyte models (Milberg et al., 2012b; Song et al., 2015; Wilson et al., 2017; Zhong et al., 2018). More sophisticated HVM models incorporating β-AS-related modulating factors, like those developed by Saucerman et al. (2003) and Kuzumoto et al. (2008), are required for further investigations of the mechanisms of exercise-induced EAD formation in LQT1 HVMs.
Comparisons With Other HVM Models for Bifurcation Phenomena and EAD Mechanisms
EAD Initiation Mechanisms (Roles of ICaL, INCX, and SR Ca2+ Release)
At least two mechanisms appeared to underlie the initiation of phase-2 EADs in the mTP06b model: (1) ICaL reactivation-dependent mechanism which operates and causes EADs even in the absence of spontaneous SR Ca2+ releases at lower Pup and lower pacing rates, and (2) spontaneous SR Ca2+ release-mediated mechanism activating inward INCX at higher Pup and higher pacing rates (Figures 2A-b, 6B). Coexistence of these two distinct mechanisms for EAD formation have been demonstrated experimentally as well (Zhao et al., 2012).
The major contribution of ICaL to EAD formation was suggested in many previous experimental and theoretical studies for ventricular myocytes (January and Riddle, 1989; Ming et al., 1994; Guo D. et al., 2007; Yamada et al., 2008; Xie et al., 2010; Corrias et al., 2011; Madhvani et al., 2011; Chang et al., 2012a, b; Milberg et al., 2012a; Qu and Chung, 2012; Qu et al., 2013). EAD formation in the mTP06b model with lower Pup is also attributable to ICaL reactivation in that reactivated ICaL contributes to Vm depolarization (Figures 1C, 2A-a, and Supplementary Figure S6). In the K05 and O11 models, EADs often emerged in the vicinity of the critical point at which a stable LC appeared during ICaL increases (Kurata et al., 2017), suggesting that EAD formation depends on ICaL responsible for the instability of EPs and generation of stable LCs. EADs also occurred in the ICaL-enhanced mTP06b model when unstable LCs emerged, but stable LCs were not detected (Supplementary Figure S9A). The slow-fast decomposition analysis of the guinea-pig ventricular myocyte model have suggested that the ICaL-dependent destabilization of a qEP and formation of a stable quasi-LC (qLC) via an HB in the fast subsystem is required for EAD generation in the full system (Tran et al., 2009; Qu et al., 2013; Song et al., 2015). In the mTP06b model, however, transient trapping of the full system trajectory occurred around the stable and unstable qEPs without forming a stable qLC, indicating that the emergence of a stable qLC is not necessarily needed for EAD formation. This scenario for EAD formation is essentially the same as that in a two-current three-variable AP model (Xie et al., 2014). Nevertheless, the absence of a stable qLC may result in EADs of relatively small amplitudes, as demonstrated for the mTP06b model. As mentioned above, the initiation of EADs in the mTP06b model is attributable to the stabilization of qEPs at depolarized Vm in the xs-parameterized fast subsystem, which causes transient trapping of the full system trajectory around the stable qEP; IKr reduction promotes EAD formation by broadening the region of stable qEPs at depolarized Vm (Figure 7).
As another possible mechanism for EAD initiation, many recent experimental and simulation studies have strongly suggested the spontaneous SR Ca2+ release causing Cai oscillations, oscillatory increases in inward INCX, and resulting Vm depolarization during β-AS (Choi et al., 2002; Volders et al., 2003; Zhao et al., 2012; Song et al., 2015; Wilson et al., 2017; Zhong et al., 2018) and in IKr-reduced LQT2 cardiomyocytes (Choi et al., 2002; Kim et al., 2005; Němec et al., 2010, 2016), which is similar to the mechanism for DADs induced by spontaneous SR Ca2+ releases under Ca2+ overload conditions or β-AS (e.g., Volders et al., 2003; Zhao et al., 2012) and the Ca2+ clock mechanism for sinoatrial node cell pacemaking (Maltsev and Lakatta, 2009). The K05 or O11 model could not reproduce the spontaneous SR Ca2+ release as a cause of phase-2 EADs (Kurata et al., 2017). In contrast, the mTP06b model could clearly replicate this scenario in a CaSR-dependent manner (Figures 2A-b, 5A, 6B, 9), while it was not found in the previous study using a modified TP06 model (Vandersickel et al., 2014). Such SR Ca2+ release-mediated EADs under β-AS conditions (Figure 5) have also been reproduced by the rabbit ventricular myocyte model (Volders et al., 2000; Song et al., 2015; Zhong et al., 2018).
One of the prominent properties of the mTP06 model is the instability of steady-state intracellular Ca2+ concentrations resulting in the spontaneous SR Ca2+ release at higher Pup to increase CaSR (Figures 8, 9). The K05 or O11 model did not exhibit spontaneous SR Ca2+ releases even at higher Pup, because steady-state intracellular Ca2+ concentrations were always stable independently of Vm; although Cai oscillations occurred during EADs in the K05 and O11 models, these Cai oscillations were not induced by spontaneous SR Ca2+ releases but by oscillatory reactivation of ICaL (Kurata et al., 2017). Thus, this study newly suggests that the occurrence of spontaneous SR Ca2+ releases and Ca2+ oscillations as a cause of phase-2 EADs are attributable to instability of intracellular Ca2+ concentrations in a steady state, destabilization of which leads to spontaneous Ca2+ oscillations (Figures 8, 9). This scenario, i.e., steady-state destabilization for spontaneous Ca2+ oscillations involving ryanodine or IP3 receptors, has previously been suggested by bifurcation analyses for cardiac myocytes (Keizer and Levine, 1996; Tveito et al., 2012) and for other cells (Schuster et al., 2002; Higgins et al., 2006; Kusters et al., 2007). However, the Ca2+ oscillations reported in these previous studies were much longer in period than those observed in the mTP06b model, not relating to EAD formation. Wilson et al. (2017) demonstrated spontaneous SR Ca2+ releases and sustained Ca2+ oscillations in a voltage-clamped rabbit ventricular myocyte model, suggesting instability of intracellular Ca2+ dynamics; however, dynamical mechanisms for the Ca2+ oscillation were not clarified by bifurcation analysis. To the best of our knowledge, this is the first report demonstrating instability of steady-state intracellular Ca2+ concentrations and resulting spontaneous SR Ca2+ releases that cause EADs in the HVM model (Kurata et al., 2019). In the mTP06b model, enhanced ICaL further contributed to spontaneous SR Ca2+ releases via the increment of SR Ca2+ contents and resultant enhancement of the instability of intracellular Ca2+ dynamics (Figure 8C). Elevations of Cass by spontaneous SR Ca2+ releases caused transient ICaL reductions due to Ca2+-dependent inactivation (Figures 2A-b, 6B, 8A), which may be regarded as a negative feedback mechanism leading to inhibition of EADs.
EAD Termination Mechanisms (Roles of IKs, IKr, and ICaL)
The mTP06 model requires IKs for EAD termination, i.e., repolarization failure occurred abruptly during IKr inhibition or ICaL enhancement when IKs was absent or small, whereas IKs was not necessarily needed in the K05 or O11 model. Thus, EADs in the mTP06b model during pacing appeared to terminate in an IKs activation-dependent (or stimulus-dependent) manner: The open probability of IKs channels (xs2) increased progressively in the model cell with relatively small IKr, i.e., LQT2-like cells (Figure 2A-a). Tran et al. (2009) suggested the major role of the slow IKs activation for the guinea-pig ventricular myocyte model by the slow-fast decomposition analysis in which the slow IKs activation gating variable was assumed to be a parameter for the fast subsystem. In the diagram for the slow gating variable-parameterized fast subsystem with a superimposed full system trajectory, gradual increases in the slow variable led the full system trajectory slowly across the stable steady-state branch of qEP and then into the region of the stable periodic branch of qLC through an HB point, resulting in the termination of EADs via a homoclinic bifurcation of qLC. This scenario is known as the Hopf-homoclinic bifurcation mechanism (Tran et al., 2009; Qu et al., 2013; Song et al., 2015; Huang et al., 2018). Consistent with these previous reports, the mTP06b model exhibited slow IKs activation-dependent EADs in the xs2 regions of stable and unstable qEPs (Figure 7A); however, a stable qLC region or homoclinic bifurcation to yield EAD termination was not detected for the fast subsystem of the mTP06b model. EAD terminated simply via the destabilization of a qEP in the IKr-reduced mTP06b model, suggesting that the Hopf-homoclinic bifurcation scenario is not necessarily applicable.
In the IKs-eliminated system, EADs would not terminate unless there exist other slow components or factors, such as the slowly inactivating ICaL or late INa and intracellular Na+ accumulation to increase outward INaK gently. Our previous study using the K05 and O11 models indicated that EAD termination might occur in a slow ICaL inactivation-dependent manner when IKs was relatively small (Figure 3 in Kurata et al., 2017). However, ICaL inactivation-dependent EAD termination was not clearly detected in the TP06 model. Other candidates for slow variables to cause EAD termination include the slow inactivation of late INa (Horvath et al., 2013; Trenor et al., 2013; Asakura et al., 2014) not incorporated into the TP06 model and gradual increases in Nai (Chang et al., 2012a; Xie et al., 2015). After cessation of pacing, the IKr-reduced and/or ICaL-enhanced mTP06b model could exhibit long-term EAD bursts the termination of which was induced by slow elevation of Nai and resulting enhancement of outward INaK (data not shown). This Nai-dependent mechanism has previously been demonstrated for a rabbit ventricular AP model as well (Chang et al., 2012a). Nevertheless, the slow Nai elevation (intracellular Na+ accumulation) is unlikely as a termination mechanism for short-term EADs during pacing at 0.2–2 Hz in the mTP06b model.
As another termination mechanism, stimulus-induced repolarization was observed when APD became very long with stable AP phase 2 (Figures 2A-b, 3B-ii, 5, 6). In the mTP06b model, it was yielded mainly by the prolonged decrease (inactivation) of ICaL due to its slow recovery and resulting outward shift in the total membrane current after the stimulus off. In terms of bifurcation theory, this phenomenon is related to bistability (co-existence of two stable EPs at resting Vm and depolarized Vm close to AP phase 2) and a transition between the two stable EPs by the stimulus; the transition occurs when following an application of the stimulus current a trajectory of a system starting from one stable EP at the depolarized Vm goes outside the attractor basin of the stable EP and enters the attractor basin of the other stable EP at the resting Vm (Vinet and Roberge, 1990). Bistability and the stimulus-induced transition between two stable states were found in other cardiomyocyte models (Landau et al., 1990; Vinet and Roberge, 1990). We could not find any experimental evidence for the AP repolarization induced by a stimulus current during stable AP phase 2, but it is theoretically possible. Experimental studies for wider ranges of channel conductance or other parameters may verify that the stimulus-induced repolarization really occurs.
Limitations and Perspectives of Study
As summarized in our preceding article (Kurata et al., 2017), bifurcation analyses have been used for elucidating the dynamical mechanisms of sinoatrial node pacemaking, abnormal automaticity in ventricular myocytes, generation of biological pacemaker activity, and EAD formation in ventricular myocytes. These theoretical studies have clearly demonstrated the significance of bifurcation analyses for general understanding and systematic description of the dynamical mechanisms of normal and abnormal oscillatory behaviors.
There are many limitations of our study including incompleteness of the model and inconsistency between model predictions and experimental observations, as well as the lack of experimental evidence for bifurcation phenomena in real HVMs. The aim of this study was not to refine but to validate the TP06 model. Nevertheless, more sophisticated HVM models have to be used or developed for more detailed theoretical investigations. As mentioned above, simulated Ca2+ transients induced by spontaneous SR Ca2+ releases during AP phase 2 were larger than those observed in many experimental studies. The larger Ca2+ transients in the model cell may be due to the one compartment SR with weak Ca2+ leak, which results in higher SR Ca2+ load and greater Ca2+ releases during AP phase 2; a two-compartment SR model may be required for reproducing experimentally observed smaller Ca2+ releases, as suggested previously (Wilson et al., 2017). Moreover, incorporation of more elaborate schemes for the mechanisms of SR Ca2+ release and intra-SR Ca2+ transfer (Laver, 2007, 2009; Chen et al., 2014; Song et al., 2015; Zhong et al., 2018) would also be crucial. Our preceding (Kurata et al., 2017; Tsumoto et al., 2017) and present studies have demonstrated that EAD mechanisms are different depending on models and parameter values. Therefore, we have to test as many models as possible for providing more profound understanding of EAD mechanisms.
In this study, bifurcation analysis was limited to a single cell model. However, EAD-related arrhythmias are suggested to be induced by synchronization of EADs in multiple cells (Sato et al., 2009; Xie et al., 2010) and also influenced by heterogeneity of ventricular myocytes; because of electrotonic interactions, EAD formation in multicellular or tissue models including epicardial, endocardial and M cell models may be very different in conditions from that in single cell models (Gibb et al., 1994; Huelsing et al., 2000; Weiss et al., 2010; Corrias et al., 2011). Therefore, we need investigations of the mechanisms for EAD formation and for triggering arrhythmias in human ventricles in vivo, which require multicellular (tissue) models, like those used in previous simulation studies (Weiss et al., 2010; de Lange et al., 2012; Vandersickel et al., 2014; Chang et al., 2015; Liu et al., 2018). Despite many limitations, our studies provide significant insights into the dynamical mechanisms of EAD generation in LQT1 and LQT2 HVMs by utilizing recently developed HVM models.
Author’s Note
This manuscript has been released as a Pre-Print at https://www.biorxiv.org/content/10.1101/613182v1 (Kurata et al., 2019).
Data Availability Statement
All datasets generated for this study are included in the article/Supplementary Material.
Author Contributions
YaK conception and design of the research and drafted the manuscript. YaK and KT performed the programing, simulations, bifurcation analyses, and analyzed the data. YaK, KT, and KH interpreted the results. YaK, KT, MT, and YuK prepared the figures. YaK, KT, KH, and IH edited and revised the manuscript. YaK, KT, KH, IH, MT, and YuK approved the final version of the manuscript.
Funding
This work was supported in part by the Grant-in-Aid for Scientific Research on Innovative Areas “HD Physiology (4203)” from the Ministry of Education, Culture, Sports, Science and Technology, Japan (25136720 to YaK); Grant-in-Aid for Scientific Research (C) from Japan Society for the Promotion of Science (26460303 to YaK; 22590806 to KH; 16KT0194 to KT); Grant from The Takeda Science Foundation, the Hiroshi and Aya Irisawa Memorial Promotion Award for Young Physiologists from the Physiological Society of Japan, and Grant for Promoted Research from Kanazawa Medical University (S2019-2) to KT; and Grant for Collaborative Research from Kanazawa Medical University (C2015-3 and C2016-1 to YaK and IH).
Conflict of Interest
The authors declare that the research was conducted in the absence of any commercial or financial relationships that could be construed as a potential conflict of interest.
Supplementary Material
The Supplementary Material for this article can be found online at: https://www.frontiersin.org/articles/10.3389/fphys.2019.01545/full#supplementary-material
Footnotes
- ^ http://models.cellml.org/exposure/a7179d94365ff0c9c0e6eb7c6a787d3d
- ^ http://physiodesigner.org/
- ^ https://phdb.unit.oist.jp/modeldb/
- ^ http://www.physiodesigner.org/simulation/flint/
References
Adeniran, I., El Harchi, A., Hancox, J. C., and Zhang, H. (2012). Proarrhythmia in KCNJ2-linked short QT syndrome: insights from modelling. Cardiovasc. Res. 94, 66–76. doi: 10.1093/cvr/cvs082
Anderson, C. L., Delisle, B. P., Anson, B. D., Kilby, J. A., Will, M. L., Tester, D. J., et al. (2006). Most LQT2 mutations reduce Kv11.1 (hERG) current by a class 2 (trafficking-deficient) mechanism. Circulation 113, 365–373. doi: 10.1161/CIRCULATIONAHA.105.570200
Antzelevitch, C., Shimizu, W., Yan, G. X., Sicouri, S., Weissenburger, J., Nesterenko, V. V., et al. (1999). The M cell: its contribution to the ECG and to normal and abnormal electrical function of the heart. J. Cardiovasc. Electrophysiol. 10, 1124–1152. doi: 10.1111/j.1540-8167.1999.tb00287.x
Asakura, K., Cha, C. Y., Yamaoka, H., Horikawa, Y., Memida, H., Powell, T., et al. (2014). EAD and DAD mechanisms analyzed by developing a new human ventricular cell model. Prog. Biophys. Mol. Biol. 116, 11–24. doi: 10.1016/j.pbiomolbio.2014.08.008
Briston, S. J., Dibb, K. M., Solaro, R. J., Eisner, D. A., and Trafford, A. W. (2014). Balanced changes in Ca buffering by SERCA and troponin contribute to Ca handling during β-adrenergic stimulation in cardiac myocytes. Cardiovasc. Res. 104, 347–354. doi: 10.1093/cvr/cvu201
Carmeliet, E. (1992). Voltage- and time-dependent block of the delayed K+ current in cardiac myocytes by dofetilide. J. Pharmacol. Exp. Ther. 262, 809–817.
Chang, M. G., Chang, C. Y., de Lange, E., Xu, L., O’Rourke, B., Karagueuzian, H. S., et al. (2012a). Dynamics of early afterdepolarization-mediated triggered activity in cardiac monolayers. Biophys. J. 102, 2706–2714. doi: 10.1016/j.bpj.2012.05.011
Chang, M. G., Sato, D., de Lange, E., Lee, J. H., Karagueuzian, H. S., Garfinkel, A., et al. (2012b). Bi-stable wave propagation and early afterdepolarization-mediated cardiac arrhythmias. Heart Rhythm 9, 115–122. doi: 10.1016/j.hrthm.2011.08.014
Chang, P. C., Wo, H. T., Lee, H. L., Lin, S. F., Wen, M. S., Chu, Y., et al. (2015). Role of sarcoplasmic reticulum calcium in development of secondary calcium rise and early afterdepolarizations in long QT syndrome rabbit model. PLoS One 10:e0123868. doi: 10.1371/journal.pone.0123868
Chen, W., Wang, R., Chen, B., Zhong, X., Kong, H., Bai, Y., et al. (2014). The ryanodine receptor store-sensing gate controls Ca2+ waves and Ca2+-triggered arrhythmias. Nat. Med. 20, 184–192. doi: 10.1038/nm.3440
Chiang, C. E., and Roden, D. M. (2000). The long QT syndromes: genetic basis and clinical implications. J. Am. Coll. Cardiol. 36, 1–12. doi: 10.1016/s0735-1097(00)00716-6
Choi, B. R., Burton, F., and Salama, G. (2002). Cytosolic Ca2+ triggers early afterdepolarizations and torsade de pointes in rabbit hearts with type 2 long QT syndrome. J. Physiol. 543, 615–631. doi: 10.1113/jphysiol.2002.024570
Chouabe, C., Neyroud, N., Guicheney, P., Lazdunski, M., Romey, G., and Barhanin, J. (1997). Properties of KvLQT1 K+ channel mutations in romano-ward and jervell and lange-nielsen inherited cardiac arrhythmias. EMBO J. 16, 5472–5479. doi: 10.1093/emboj/16.17.5472
Corrias, A., Giles, W., and Rodriguez, B. (2011). Ionic mechanisms of electrophysiological properties and repolarization abnormalities in rabbit Purkinje fibers. Am. J. Physiol. Heart Circ. Physiol. 300, H1806–H1813. doi: 10.1113/jphysiol.2002.024570
de Lange, E., Xie, Y., and Qu, Z. (2012). Synchronization of early afterdepolarizations and arrhythmogenesis in heterogeneous cardiac tissue models. Biophys. J. 103, 365–373. doi: 10.1016/j.bpj.2012.06.007
Edwards, A. G., Grandi, E., Hake, J. E., Patel, S., Li, P., Miyamoto, S., et al. (2014). Nonequilibrium reactivation of Na+ current drives early afterdepolarizations in mouse ventricle. Circ. Arrhythm. Electrophysiol. 7, 1205–1213. doi: 10.1161/CIRCEP.113.001666
Gibb, W. J., Wagner, M. B., and Lesh, M. D. (1994). Effects of simulated potassium blockade on the dynamics of triggered cardiac activity. J. Theor. Biol. 168, 245–257. doi: 10.1006/jtbi.1994.1106
Guckenheimer, J., and Holmes, P. (1983). Nonlinear Oscillations, Dynamical Systems, and Bifurcations of Vector Fields. New York, NY: Springer-Verlag.
Guo, D., Zhao, X., Wu, Y., Liu, T., Kowey, P. R., and Yan, G. X. (2007). L-type calcium current reactivation contributes to arrhythmogenesis associated with action potential triangulation. J. Cardiovasc. Electrophysiol. 18, 196–203. doi: 10.1111/j.1540-8167.2006.00698.x
Guo, T., Ai, X., Shannon, T. R., Pogwizd, S. M., and Bers, D. M. (2007). Intra-sarcoplasmic reticulum free [Ca2+] and buffering in arrhythmogenic failing rabbit heart. Circ. Res. 101, 802–810. doi: 10.1161/CIRCRESAHA.107.152140
Higgins, E. R., Cannell, M. B., and Sneyd, J. (2006). A buffering SERCA pump in models of calcium dynamics. Biophys. J. 91, 151–163. doi: 10.1529/biophysj.105.075747
Himeno, Y., Sarai, N., Matsuoka, S., and Noma, A. (2008). Ionic mechanisms underlying the positive chronotropy induced by beta1-adrenergic stimulation in guinea pig sinoatrial node cells: a simulation study. J. Physiol. Sci. 58, 53–65. doi: 10.2170/physiolsci.RP015207
Horvath, B., Banyasz, T., Jian, Z., Hegyi, B., Kistamas, K., Nanasi, P. P., et al. (2013). Dynamics of the late Na+ current during cardiac action potential and its contribution to afterdepolarizations. J. Mol. Cell. Cardiol. 64, 59–68. doi: 10.1016/j.yjmcc.2013.08.010
Huang, X., Song, Z., and Qu, Z. (2018). Determinants of early afterdepolarization properties in ventricular myocyte models. PLoS Comput. Biol. 14:e1006382. doi: 10.1371/journal.pcbi.1006382
Huelsing, D. J., Spitzer, K. W., and Pollard, A. E. (2000). Electrotonic suppression of early afterdepolarizations in isolated rabbit purkinje myocytes. Am. J. Physiol. Heart Circ. Physiol. 279, H250–H259. doi: 10.1152/ajpheart.2000.279.1.H250
Itzhaki, I., Maizels, L., Huber, I., Zwi-Dantsis, L., Caspi, O., Winterstern, A., et al. (2011). Modelling the long QT syndrome with induced pluripotent stem cells. Nature 471, 225–229. doi: 10.1038/nature09747
January, C. T., and Riddle, J. M. (1989). Early afterdepolarizations: mechanism of induction and block; a role for L-type Ca2+ current. Circ. Res. 64, 977–990. doi: 10.1161/01.res.64.5.977
January, C. T., Riddle, J. M., and Salata, J. J. (1988). A model for early afterdepolarizations: induction with the Ca2+ channel agonist Bay K 8644. Circ. Res. 62, 563–571. doi: 10.1161/01.res.62.3.563
Jost, N., Papp, J. G., and Varró, A. (2007). Slow delayed rectifier potassium current (IKs) and the repolarization reserve. Ann. Noninvasive Electrocardiol. 12, 64–78. doi: 10.1111/j.1542-474X.2007.00140.x
Jost, N., Virág, L., Bitay, M., Takács, J., Lengyel, C., Biliczki, P., et al. (2005). Restricting excessive cardiac action potential and QT prolongation: a vital role for IKs in human ventricular muscle. Circulation 112, 1392–1399. doi: 10.1161/CIRCULATIONAHA.105.550111
Kazbanov, I. V., ten Tusscher, K. H., and Panfilov, A. V. (2016). Effects of heterogeneous diffuse fibrosis on arrhythmia dynamics and mechanism. Sci. Rep. 6:20835. doi: 10.1038/srep20835
Keizer, J., and Levine, L. (1996). Ryanodine receptor adaptation and Ca2+-induced Ca2+ release-dependent Ca2+ oscillations. Biophys. J. 71, 3477–3487. doi: 10.1016/S0006-3495(96)79543-7
Kim, J. J., Němec, J., Li, Q., and Salama, G. (2005). Synchronous systolic subcellular Ca2+-elevations underlie ventricular arrhythmia in drug-induced long QT type 2. Circ. Arrhythm. Electrophysiol. 8, 703–712. doi: 10.1161/CIRCEP.114.002214
Kondo, T., Hisatome, I., Yoshimura, S., Mahati, E., Notsu, T., Li, P., et al. (2016). Characterization of the novel mutant A78T-HERG from a long QT syndrome type 2 patient: instability of the mutant protein and stabilization by heat shock factor 1. J. Arrhythm. 32, 433–440. doi: 10.1016/j.joa.2015.10.005
Krogh-Madsen, T., Schaffer, P., Skriver, A. D., Taylor, L. K., Pelzmann, B., Koidl, B., et al. (2005). An ionic model for rhythmic activity in small clusters of embryonic chick ventricular cells. Am. J. Physiol. Heart Circ. Physiol. 289, H398–H413. doi: 10.1152/ajpheart.00683.2004
Kurata, Y., Hisatome, I., Matsuda, H., and Shibamoto, T. (2005). Dynamical mechanisms of pacemaker generation in IK1-downregulated human ventricular myocytes: insights from bifurcation analyses of a mathematical model. Biophys. J. 89, 2865–2887. doi: 10.1529/biophysj.105.060830
Kurata, Y., Hisatome, I., and Shibamoto, T. (2012). Roles of sarcoplasmic reticulum Ca2+ cycling and Na+/Ca2+ exchanger in sinoatrial node pacemaking: insights from bifurcation analysis of mathematical models. Am. J. Physiol. Heart Circ. Physiol. 302, H2285–H2300. doi: 10.1152/ajpheart.00221.2011
Kurata, Y., Hisatome, I., Tanida, M., and Shibamoto, T. (2013). Effect of hyperpolarization-activated current If on robustness of sinoatrial node pacemaking: theoretical study on influence of intracellular Na+ concentration. Am. J. Physiol. Heart Circ. Physiol. 304, H1337–H1351. doi: 10.1152/ajpheart.00777.2012
Kurata, Y., Matsuda, H., Hisatome, I., and Shibamoto, T. (2008). Regional difference in dynamical property of sinoatrial node pacemaking: role of Na+ channel current. Biophys. J. 95, 951–977. doi: 10.1529/biophysj.107.112854
Kurata, Y., Tsumoto, K., Hayashi, K., Hisatome, I., Kuda, Y., and Tanida, M. (2019). Multiple dynamical mechanisms of phase-2 early afterdepolarizations in a human ventricular myocyte model: involvement of spontaneous SR Ca2+ release. BioRxiv [Preprint]. Available at: https://www.biorxiv.org/content/10.1101/613182v1 (accessed June 12, 2019).
Kurata, Y., Tsumoto, K., Hayashi, K., Hisatome, I., Tanida, M., Kuda, Y., et al. (2017). Dynamical mechanisms of phase-2 early afterdepolarizations in human ventricular myocytes: insights from bifurcation analyses of two mathematical models. Am. J. Physiol. Heart Circ. Physiol. 312, H106–H127. doi: 10.1152/ajpheart.00115.2016
Kusters, J. M., Cortes, J. M., van Meerwijk, W. P., Ypey, D. L., Theuvenet, A. P., and Gielen, C. C. (2007). Hysteresis and bistability in a realistic cell model for calcium oscillations and action potential firing. Phys. Rev. Lett. 98:098107. doi: 10.1103/PhysRevLett.98.098107
Kuznetsov, Y. A. (2003). Elements of Applied Bifurcation Theory, 3rd Edn, New York, NY: Springer-Verlag.
Kuzumoto, M., Takeuchi, A., Nakai, H., Oka, C., Noma, A., and Matsuoka, S. (2008). Simulation analysis of intracellular Na+ and Cl- homeostasis during β1-adrenergic stimulation of cardiac myocyte. Prog. Biophys. Mol. Biol. 96, 171–186. doi: 10.1016/j.pbiomolbio.2007.07.005
Landau, M., Lorente, P., Michaels, D., and Jalife, J. (1990). Bistabilities and annihilation phenomena in electrophysiological cardiac models. Circ. Res. 66, 1658–1672. doi: 10.1161/01.res.66.6.1658
Laver, D. R. (2007). Ca2+ stores regulate ryanodine receptor Ca2+ release channels via luminal and cytosolic Ca2+ sites. Biophys. J. 92, 3541–3555. doi: 10.1529/biophysj.106.099028
Laver, D. R. (2009). Luminal Ca2+ activation of cardiac ryanodine receptors by luminal and cytoplasmic domains. Eur. Biophys. J. 39, 19–26. doi: 10.1007/s00249-009-0417-1
Liu, G. X., Choi, B. R., Ziv, O., Li, W., de Lange, E., Qu, Z., et al. (2012). Differential conditions for early after-depolarizations and triggered activity in cardiomyocytes derived from transgenic LQT1 and LQT2 rabbits. J. Physiol. 590, 1171–1180. doi: 10.1113/jphysiol.2011.218164
Liu, W., Kim, T. Y., Huang, X., Liu, M. B., Koren, G., Choi, B. R., et al. (2018). Mechanisms linking T-wave alternans to spontaneous initiation of ventricular arrhythmias in rabbit models of long QT syndrome. J. Physiol. 596, 1341–1355. doi: 10.1113/JP275492
Luo, C., and Rudy, Y. (1991). A model of the ventricular cardiac action potential: depolarization, repolarization, and their interaction. Circ. Res. 68, 1501–1526. doi: 10.1161/01.res.68.6.1501
Madhvani, R. V., Xie, Y., Pantazis, A., Garfinkel, A., Qu, Z., Weiss, J. N., et al. (2011). Shaping a new Ca2+ conductance to suppress early afterdepolarizations in cardiac myocytes. J. Physiol. 589, 6081–6092. doi: 10.1113/jphysiol.2011.219600
Maltsev, V. A., and Lakatta, E. G. (2009). Synergism of coupled subsarcolemmal Ca2+ clocks and sarcolemmal voltage clocks confers robust and flexible pacemaker function in a novel pacemaker cell model. Am. J. Physiol. Heart Circ. Physiol. 296, H594–H615. doi: 10.1152/ajpheart.01118.2008
Maltsev, V. A., and Lakatta, E. G. (2010). A novel quantitative explanation for the autonomic modulation of cardiac pacemaker cell automaticity via a dynamic system of sarcolemmal and intracellular proteins. Am. J. Physiol. Heart Circ. Physiol. 298, H2010–H2023. doi: 10.1152/ajpheart.00783.2009
Marban, E., Robinson, S. W., and Wier, W. G. (1986). Mechanisms of arrhythmogenic delayed and early afterdepolarizations in ferret ventricular muscle. J. Clin. Invest. 78, 1185–1192. doi: 10.1172/JCI112701
Milberg, P., Fink, M., Pott, C., Frommeyer, G., Biertz, J., Osada, N., et al. (2012a). Blockade of ICa suppresses early afterdepolarizations and reduces transmural dispersion of repolarization in a whole heart model of chronic heart failure. Br. J. Pharmacol. 166, 557–568. doi: 10.1111/j.1476-5381.2011.01721.x
Milberg, P., Pott, C., Frommeyer, G., Fink, M., Ruhe, M., Matsuda, T., et al. (2012b). Acute inhibition of the Na+/Ca2+ exchanger reduces proarrhythmia in an experimental model of chronic heart failure. Heart Rhythm 9, 570–578. doi: 10.1016/j.hrthm.2011.11.004
Milberg, P., Pott, C., Fink, M., Frommeyer, G., Matsuda, T., Baba, A., et al. (2008). Inhibition of the Na+/Ca2+ exchanger suppresses torsades de pointes in an intact heart model of long QT syndrome-2 and long QT syndrome-3. Heart Rhythm 5, 1444–1452. doi: 10.1016/j.hrthm.2008.06.017
Ming, Z., Nordin, C., and Aronson, R. S. (1994). Role of L-type calcium channel window current in generating current-induced early afterdepolarization. J. Cardiovasc. Electrophysiol. 5, 323–334. doi: 10.1111/j.1540-8167.1994.tb01169.x
Němec, J., Kim, J. J., Gabris, B., and Salama, G. (2010). Calcium oscillations and T-wave lability precede ventricular arrhythmias in acquired long QT type 2. Heart Rhythm 7, 1686–1694. doi: 10.1016/j.hrthm.2010.06.032
Němec, J., Kim, J. J., and Salama, G. (2016). The link between abnormal calcium handling and electrical instability in acquired long QT syndrome–Does calcium precipitate arrhythmic storms? Prog. Biophys. Mol. Biol. 120, 210–221. doi: 10.1016/j.pbiomolbio.2015.11.003
O’Hara, T., and Rudy, Y. (2012). Quantitative comparison of cardiac myocyte electrophysiology and response to drugs in human and nonhuman species. Am. J. Physiol. Heart Circ. Physiol. 302, H1023–H1030. doi: 10.1152/ajpheart.00785.2011
O’Hara, T., Virág, L., Varró, A., and Rudy, Y. (2011). Simulation of the undiseased human cardiac ventricular action potential: model formulation and experimental validation. PLoS Comput. Biol. 7:e1002061. doi: 10.1371/journal.pcbi.1002061
Parikh, A., Mantravadi, R., Kozhevnikov, D., Roche, M. A., Ye, Y., Owen, L. J., et al. (2012). Ranolazine stabilizes cardiac ryanodine receptors: a novel mechanism for the suppression of early afterdepolarization and torsades de pointes in long QT type 2. Heart Rhythm 9, 953–960. doi: 10.1016/j.hrthm.2012.01.010
Parker, T. S., and Chua, L. O. (1989). Practical Numerical Algorithms for Chaotic Systems. New York, NY: Springer-Verlag.
Pott, C., Muszynski, A., Ruhe, M., Bögeholz, N., Schulte, J. S., Milberg, P., et al. (2012). Proarrhythmia in a non-failing murine model of cardiac-specific Na+/Ca2+ exchanger overexpression: whole heart and cellular mechanisms. Basic Res. Cardiol. 107, 1–13. doi: 10.1007/s00395-012-0247-7
Priori, S. G., and Corr, P. B. (1990). Mechanisms underlying early and delayed afterdepolarizations induced by catecholamines. Am. J. Physiol. 258, H1796–H1805. doi: 10.1152/ajpheart.1990.258.6.H1796
Qu, Z., and Chung, D. (2012). Mechanisms and determinants of ultralong action potential duration and slow rate-dependence in cardiac myocytes. PLoS One 7:e43587. doi: 10.1371/journal.pone.0043587
Qu, Z., Xie, L. H., Olcese, R., Karagueuzian, H. S., Chen, P. S., Garfinkel, A., et al. (2013). Early afterdepolarizations in cardiac myocytes: beyond reduced repolarization reserve. Cardiovasc. Res. 99, 6–15. doi: 10.1093/cvr/cvt104
Roden, D. M., Lazzara, R., Rosen, M., Schwartz, P. J., Towbin, J., and Vincent, G. M. (1996). Multiple mechanisms in the long-QT syndrome. Current knowledge, gaps, and future directions. the SADS foundation task force on LQTS. Circulation 94, 1996–2012. doi: 10.1161/01.cir.94.8.1996
Sato, D., Xie, L. H., Sovari, A. A., Tran, D. X., Morita, N., Xie, F., et al. (2009). Synchronization of chaotic early afterdepolarizations in the genesis of cardiac arrhythmias. Proc. Natl. Acad. Sci. U.S.A. 106, 2983–2988. doi: 10.1073/pnas.0809148106
Saucerman, J. J., Brunton, L. L., Michailova, A. P., and McCulloch, A. D. (2003). Modeling β-adrenergic control of cardiac myocytes contractility in silico. J. Biol. Chem. 278, 47997–48003. doi: 10.1074/jbc.M308362200
Schuster, S., Marhl, M., and Höfer, T. (2002). Modelling of simple and complex calcium oscillations. From single-cell responses to intercellular signalling. Eur. J. Biochem. 269, 1333–1355. doi: 10.1046/j.0014-2956.2001.02720.x
Shannon, T. R., Guo, T., and Bers, D. M. (2003). Ca2+ scraps: local depletions of free [Ca2+] in cardiac sarcoplasmic reticulum during contractions leave substantial Ca2+ reserve. Circ. Res. 93, 40–45. doi: 10.1161/01.RES.0000079967.11815.19
Shannon, T. R., Wang, F., Puglisi, J., Weber, C., and Bers, D. M. (2004). A mathematical treatment of integrated Ca dynamics within the ventricular myocyte. Biophys. J. 87, 3351–3371. doi: 10.1529/biophysj.104.047449
Shimizu, W. (2013). Update of diagnosis and management inherited cardiac arrhythmias. Circ. J. 77, 2867–2872. doi: 10.1253/circj.cj-13-1217
Shimizu, W., and Horie, M. (2011). Phenotypic manifestations of mutations in genes encoding subunits of cardiac potassium channels. Circ. Res. 109, 97–109. doi: 10.1161/CIRCRESAHA.110.224600
Sogo, T., Morikawa, K., Kurata, Y., Li, P., Ichinose, T., Yuasa, S., et al. (2016). Electrophysiological properties of iPS cell-derived cardiomyocytes from a patient with long QT syndrome type 1 harboring the novel mutation M437V of KCNQ1. Regener. Ther. 4, 9–17. doi: 10.1016/j.reth.2015.12.001
Song, Z., Ko, C. Y., Nivala, M., Weiss, J. N., and Qu, Z. (2015). Calcium-voltage coupling in the genesis of early and delayed afterdepolarizations in cardiac myocytes. Biophys. J. 108, 1908–1921. doi: 10.1016/j.bpj.2015.03.011
ten Tusscher, K. H., Hren, R., and Panfilov, A. V. (2007). Organization of ventricular fibrillation in the human heart. Circ. Res. 100, e87–e101. doi: 10.1161/CIRCRESAHA.107.150730
ten Tusscher, K. H., and Panfilov, A. V. (2006). Alternans and spiral breakup in a human ventricular tissue model. Am. J. Physiol. Heart Circ. Physiol. 291, H1088–H1100. doi: 10.1152/ajpheart.00109.2006
Tran, D. X., Sato, D., Yochelis, A., Weiss, J. N., Garfinkel, A., and Qu, Z. (2009). Bifurcation and chaos in a model of cardiac early afterdepolarizations. Phys. Rev. Lett. 102:258103. doi: 10.1103/PhysRevLett.102.258103
Trenor, B., Cardona, K., Saiz, J., Rajamani, S., Belardinelli, L., and Giles, W. R. (2013). Carbon monoxide effects on human ventricular action potential assessed by mathematical simulation. Front. Physiol. 4:282. doi: 10.3389/fphys.2013.00282
Tsumoto, K., Kurata, Y., Furutani, K., and Kurachi, Y. (2017). Hysteretic dynamics of multi-stable early afterdepolarisations with repolarisation reserve attenuation: a potential dynamical mechanism for cardiac arrhythmias. Sci. Rep. 7:10771. doi: 10.1038/s41598-017-11355-1
Tveito, A., Lines, G. T., Hake, J., and Edwards, A. G. (2012). Instabilities of the resting state in a mathematical model of calcium handling in cardiac myocytes. Math. Biosci. 236, 97–107. doi: 10.1016/j.mbs.2012.02.005
Vandersickel, N., Kazbanov, I. V., Nuitermans, A., Weise, L. D., Pandit, R., and Panfilov, A. V. (2014). A study of early afterdepolarizations in a model for human ventricular tissue. PLoS One 9:e84595. doi: 10.1371/journal.pone.0084595
Veldkamp, M. W., Verkerk, A. O., van Ginneken, A. C., Baartscheer, A., Schumacher, C., de Jonge, N., et al. (2001). Norepinephrine induces action potential prolongation and early afterdepolarizations in ventricular myocytes isolated from human end-stage failing hearts. Eur. Heart J. 22, 955–963. doi: 10.1053/euhj.2000.2499
Verkerk, A. O., Veldkamp, M. W., de Jonge, N., Wilders, R., and van Ginneken, A. C. (2000). Injury current modulates afterdepolarizations in single human ventricular cells. Cardiovasc. Res. 47, 124–132. doi: 10.1016/s0008-6363(00)00064-x
Vinet, A., and Roberge, F. A. (1990). A model study of stability and oscillations in the myocardial cell membrane. J. Theor. Biol. 147, 377–412. doi: 10.1016/s0022-5193(05)80495-3
Virág, L., Iost, N., Opincariu, M., Szolnoky, J., Szécsi, J., Bogáts, G., et al. (2001). The slow component of the delayed rectifier potassium current in undiseased human ventricular myocytes. Cardiovasc. Res. 49, 790–797. doi: 10.1016/s0008-6363(00)00306-0
Viswanathan, P. C., and Rudy, Y. (1999). Pause induced early afterdepolarizations in the long QT syndrome: a simulation study. Cardiovasc. Res. 42, 530–542. doi: 10.1016/s0008-6363(99)00035-8
Volders, P. G., Stengl, M., van Opstal, J. M., Gerlach, U., Spatjens, R. L., Beekman, J. D., et al. (2003). Probing the contribution of IKs to canine ventricular repolarization: key role for beta-adrenergic receptor stimulation. Circulation 107, 2753–2760. doi: 10.1161/01.CIR.0000068344.54010.B3
Volders, P. G., Vos, M. A., Szabo, B., Sipido, K. R., de Groot, S. H., Gorgels, A. P., et al. (2000). Progress in the understanding of cardiac early afterdepolarizations and torsades de pointes: time to revise current concepts. Cardiovasc. Res. 46, 376–392. doi: 10.1016/s0008-6363(00)00022-5
Wang, Z., Fermini, B., and Nattel, S. (1994). Rapid and slow components of delayed rectifier current in human atrial myocytes. Cardiovasc. Res. 28, 1540–1546. doi: 10.1093/cvr/28.10.1540
Weiss, J. N., Garfinkel, A., Karagueuzian, H. S., Chen, P. S., and Qu, Z. (2010). Early afterdepolarizations and cardiac arrhythmias. Heart Rhythm 7, 1891–1899. doi: 10.1016/j.hrthm.2010.09.017
Wiener, R., Haitin, Y., Shamgar, L., Fernández-Alonso, M. C., Martos, A., Chomsky-Hecht, O., et al. (2008). The KCNQ1 (Kv7.1) COOH terminus, a multitiered scaffold for subunit assembly and protein interaction. J. Biol. Chem. 283, 5815–5830. doi: 10.1074/jbc.M707541200
Wilson, D., Ermentrout, B., Němec, J., and Salama, G. (2017). A model of cardiac ryanodine receptor gating predicts experimental Ca2+-dynamics and Ca2+-triggered arrhythmia in the long QT syndrome. Chaos 27:093940. doi: 10.1063/1.5000711
Xie, Y., Izu, L. T., Bers, D. M., and Sato, D. (2014). Arrhythmogenic transient dynamics in cardiac myocytes. Biophys. J. 106, 1391–1397. doi: 10.1016/j.bpj.2013.12.050
Xie, Y., Sato, D., Garfinkel, A., Qu, Z., and Weiss, J. N. (2010). So little source, so much sink: requirements for afterdepolarizations to propagate in tissue. Biophys. J. 99, 1408–1415. doi: 10.1016/j.bpj.2010.06.042
Xie, Y., Liao, Z., Grandi, E., Shiferaw, Y., and Bers, D. M. (2015). Slow [Na]i changes and positive feedback between membrane potential and [Ca]i underlie intermittent early afterdepolarizations and arrhythmias. Circ. Arrhythm. Electrophysiol. 8, 1472–1480. doi: 10.1161/CIRCEP.115.003085
Yamada, M., Ohta, K., Niwa, A., Tsujino, N., Nakada, T., and Hirose, M. (2008). Contribution of L-Type Ca2+ channels to early afterdepolarizations induced by IKr and IKs channel suppression in guinea pig ventricular myocytes. J. Membr. Biol. 222, 151–166. doi: 10.1007/s00232-008-9113-9
Zeng, J., and Rudy, Y. (1995). Early afterdepolarizations in cardiac myocytes: mechanism and rate dependence. Biophys. J. 68, 949–964. doi: 10.1016/S0006-3495(95)80271-7
Zhao, Z., Wen, H., Fefelova, N., Allen, C., Baba, A., Matsuda, T., et al. (2012). Revisiting the ionic mechanisms of early afterdepolarizations in cardiomyocytes: predominant by Ca waves or Ca currents? Am. J. Physiol. Heart Circ. Physiol. 302, H1636–H1644. doi: 10.1152/ajpheart.00742.2011
Zhong, M., Rees, C. M., Terentyev, D., Choi, B. R., Koren, G., and Karma, A. (2018). NCX-mediated subcellular Ca2+ dynamics underlying early afterdepolarizations in LQT2 cardiomyocytes. Biophys. J. 115, 1019–1032. doi: 10.1016/j.bpj.2018.08.004
Keywords: early afterdepolarization, spontaneous SR Ca2+ release, long QT syndrome, mathematical model, bifurcation analysis
Citation: Kurata Y, Tsumoto K, Hayashi K, Hisatome I, Kuda Y and Tanida M (2020) Multiple Dynamical Mechanisms of Phase-2 Early Afterdepolarizations in a Human Ventricular Myocyte Model: Involvement of Spontaneous SR Ca2+ Release. Front. Physiol. 10:1545. doi: 10.3389/fphys.2019.01545
Received: 10 June 2019; Accepted: 05 December 2019;
Published: 10 January 2020
Edited by:
Joseph L. Greenstein, Johns Hopkins University, United StatesReviewed by:
Zhilin Qu, University of California, Los Angeles, United StatesThomas Hund, The Ohio State University, United States
Andrew F. James, University of Bristol, United Kingdom
Copyright © 2020 Kurata, Tsumoto, Hayashi, Hisatome, Kuda and Tanida. This is an open-access article distributed under the terms of the Creative Commons Attribution License (CC BY). The use, distribution or reproduction in other forums is permitted, provided the original author(s) and the copyright owner(s) are credited and that the original publication in this journal is cited, in accordance with accepted academic practice. No use, distribution or reproduction is permitted which does not comply with these terms.
*Correspondence: Yasutaka Kurata, yasu@kanazawa-med.ac.jp
†These authors have contributed equally to this work