95% of researchers rate our articles as excellent or good
Learn more about the work of our research integrity team to safeguard the quality of each article we publish.
Find out more
CORRECTION article
Front. Physiol. , 15 November 2019
Sec. Exercise Physiology
Volume 10 - 2019 | https://doi.org/10.3389/fphys.2019.01409
This article is a correction to:
Pacing Strategies in the ‘Athens Classic Marathon’: Physiological and Psychological Aspects
A Corrigendum on
Pacing Strategies in the ‘Athens Classic Marathon’: Physiological and Psychological Aspects
by Nikolaidis, P. T., and Knechtle, B. (2018). Front. Physiol. 9:1539. doi: 10.3389/fphys.2018.01539
In the original article, there was a mistake in the calculation of split times; the fourth split is “15–21.1 km” instead of “15–20 km,” and the fifth split is “21.1–25 km” instead of “20–25 km.” Based on the corrected split times, the following corrections have been made:
The women participants (n = 26) were 40.8 ± 9.4 years old, mean race speed 9.29 ± 1.21 km/h, and had previously completed 3.6 ± 3.9 marathon races (range 1–20), whereas men (n = 130) 44.1 ± 8.6 years old, 10.29 ± 1.87 km/h and 5.4 ± 5.9 marathon races (1–35). The overall profile of the Athens Classic Marathon follows a positive pacing with an end spurt. That is, the speed of runners decreases across the race, whereas an increase is observed in the last split. A large main effect of split on race speed (km/h) was observed (p < 0.001, η2 = 0.376) with the fastest speed in the 0–5 km split (10.87 ± 1.70 km/h) and the slowest in the 30–35 km split (9.59 ± 2.06 km/h).
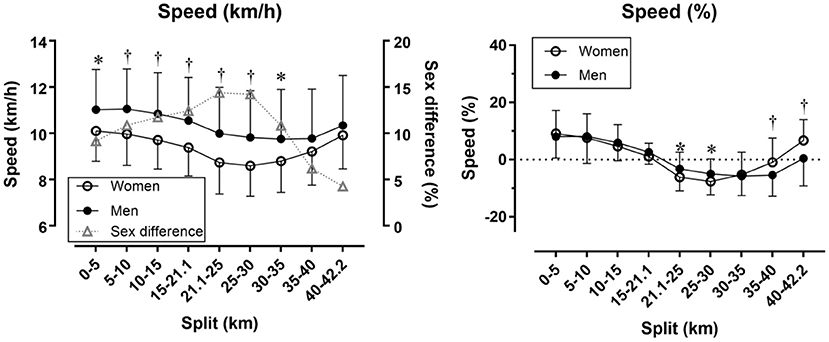
Women had similar pace range (p = 0.399; 24.8 ± 10.8% versus 22.3 ± 14.0%, respectively) and CV (p = 0.485; 0.086 ± 0.040 versus 0.079 ± 0.049, respectively) as men. A moderate main effect of sex on race speed (km/h) was found with men faster than women (10.29 ± 1.87 km/h and 9.29 ± 1.21 km/h, respectively). A small sex × split interaction on race speed was shown (p = 0.013, η2 = 0.025) with the largest sex difference in the 21.1–25 km (+14.37%) and the smallest in the 40–42 km split (+4.26%) (Figure 2, left). Considering speed (%), a large main effect of split on race speed (%) was found (p < 0.001, η2 = 0.371) with the fastest speed (%) in the 0–5 km split (+8.21 ± 9.02%) and the slowest in the 30–35 km split (−5.72 ± 7.00%). A small sex × split interaction on race speed (%) (p = 0.015, η2 = 0.024) with women and men differing at 21.1–25, 25–30, 35–40, and 40–42 km (Figure 2, right).

Figure 2. Race speed in absolute (left) and relative values (right) by sex and split. Error bars represent standard deviations; * and †depict statistical difference between women and men at p < 0.05 and p < 0.01, respectively. Speed (%) has been calculated as percentage difference of split speed and average race speed.
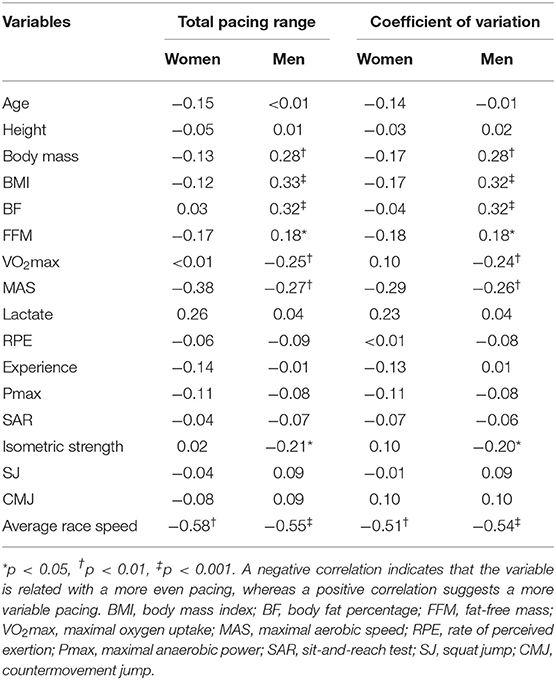
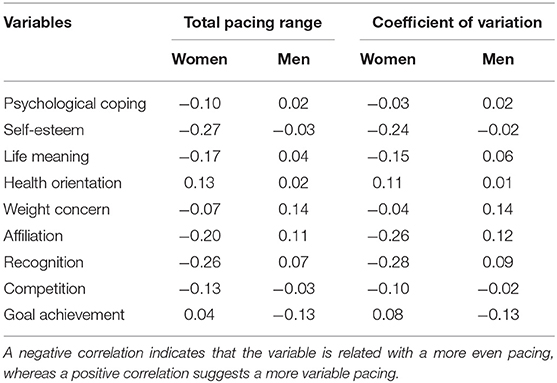
In women, no difference was observed in pace range (p = 0.185, d = 0.54) and CV (p = 0.219, d = 0.49) between runners younger or older than 41.8 years old (Table 1). In men, no difference was shown in pace range (p = 0.721, η2 = 0.035) and CV (p = 0.619, η2 = 0.042) among age groups. In women, the faster runners had smaller pace range (p = 0.002) and CV (p = 0.003) than their slower counterparts (Table 2). In men, pace range (p = 0.003, η2 = 0.109) and CV differed by performance group (p = 0.006, η2 = 0.097), where the slowest group had the most variable pacing. The physiological and psychological characteristics of all participants can be seen in Table 3 and their correlations with pacing by sex in Tables 4, 5. In the overall sample, pace range could be predicted by the equation Pace range (%) = 56.160–4.44*race speed + 0.469*CMJ (R = 0.550, SEE = 11.4, p < 0.001); in women, Pace range (%) = 73.657–7.312*race speed + 1.016*CMJ (R = 0.705, SEE = 8.17, p < 0.001); in men, Pace range (%) = 52.889–4.228*race speed + 0.503*CMJ (R = 0.571, SEE = 11.64, p < 0.001). The prediction equations for CV were CV = 0.271–0.02*race speed −0.001*age + 0.001*VO2max (R = 0.608, p < 0.001, SEE = 0.039) in the total sample; CV = 0.220–0.026*race speed + 0.026*isometric strength (R = 0.690, p < 0.001, SEE = 0.031) in women; CV = 0.316–0.017*race speed – 0.001*age (R = 0.590, p < 0.001, SEE = 0.041) in men.

Table 4. Correlations (Pearson r) of total pacing range and coefficient of variation of race speed with physiological characteristics.

Table 5. Correlations (Pearson r) of total pacing range and coefficient of variation of race speed with psychological characteristics.
The authors declare for these errors and state that they do not change the scientific conclusions of the article in any way. The original article has been updated.
Keywords: endurance exercise, master athletes, maximal oxygen uptake, motivation, performance level, speed
Citation: Nikolaidis PT and Knechtle B (2019) Corrigendum: Pacing Strategies in the ‘Athens Classic Marathon’: Physiological and Psychological Aspects. Front. Physiol. 10:1409. doi: 10.3389/fphys.2019.01409
Received: 24 October 2019; Accepted: 31 October 2019;
Published: 15 November 2019.
Edited and reviewed by: François Billaut, Laval University, Canada
Copyright © 2019 Nikolaidis and Knechtle. This is an open-access article distributed under the terms of the Creative Commons Attribution License (CC BY). The use, distribution or reproduction in other forums is permitted, provided the original author(s) and the copyright owner(s) are credited and that the original publication in this journal is cited, in accordance with accepted academic practice. No use, distribution or reproduction is permitted which does not comply with these terms.
*Correspondence: Pantelis T. Nikolaidis, cGFkZW1pbEBob3RtYWlsLmNvbQ==
Disclaimer: All claims expressed in this article are solely those of the authors and do not necessarily represent those of their affiliated organizations, or those of the publisher, the editors and the reviewers. Any product that may be evaluated in this article or claim that may be made by its manufacturer is not guaranteed or endorsed by the publisher.
Research integrity at Frontiers

Learn more about the work of our research integrity team to safeguard the quality of each article we publish.