 Minki Hwang1
 Min Cheol Park
 Chae Hun Leem
 Eun Bo Shim
94% of researchers rate our articles as excellent or good
Learn more about the work of our research integrity team to safeguard the quality of each article we publish.
Find out more
ORIGINAL RESEARCH article
Front. Physiol. , 04 September 2019
Sec. Computational Physiology and Medicine
Volume 10 - 2019 | https://doi.org/10.3389/fphys.2019.01139
The proarrhythmic risk is a major concern in drug development. The Comprehensive in vitro Proarrhythmia Assay (CiPA) initiative has proposed the JTpeak interval on electrocardiograms (ECGs) and qNet, an in silico metric, as new biomarkers that may overcome the limitations of the hERG assay and QT interval. In this study, we simulated body-surface ECGs from patch-clamp data using realistic models of the ventricles and torso to explore their suitability as new in silico biomarkers for cardiac safety. We tested seven drugs in this study: dofetilide (high proarrhythmic risk), ranolazine, verapamil (QT increasing, but safe), bepridil, cisapride, mexiletine, and diltiazem. Human ventricular geometry was reconstructed from computed tomography (CT) images, and a Purkinje fiber network was mapped onto the endocardial surface. The electrical wave propagation in the ventricles was obtained by solving a reaction-diffusion equation using finite-element methods. The body-surface ECG data were calculated using a torso model that included the ventricles. The effects of the drugs were incorporated in the model by partly blocking the appropriate ion channels. The effects of the drugs on single-cell action potential (AP) were examined first, and three-dimensional (3D) body-surface ECG simulations were performed at free Cmax values of 1×, 5×, and 10×. In the single-cell and ECG simulations at 5× Cmax, dofetilide, but not verapamil or ranolazine, caused arrhythmia. However, the non-increasing JTpeak caused by verapamil and ranolazine that has been observed in humans was not reproduced in our simulation. Our results demonstrate the potential of 3D body-surface ECG simulation as a biomarker for evaluation of the proarrhythmic risk of candidate drugs.
The proarrhythmic effects of cardiac and non-cardiac drugs have comprised a major drug safety issue for the past 20 years (Zipes, 1987; De Ponti et al., 2002; Moro et al., 2010). The electrocardiogram (ECG) is an effective means of determining whether a drug is proarrhythmic. Under certain conditions, prolongation of the QT interval increases the risk of developing Torsades de pointes (TdP), which can lead to sudden cardiac death (Thomas and Behr, 2016). The Comprehensive in vitro Proarrhythmia Assay (CiPA) was recently proposed to improve the accuracy of drug safety prediction during preclinical and clinical development (Vicente et al., 2018; Wallis et al., 2018). The CiPA comprises in silico simulation of several ion-channel assays and ECG studies to identify biomarkers of false-positive results of single hERG channel assays and thorough QT (TQT) studies (Darpo, 2010) performed according to the International Council for Harmonisation (ICH) S7B and E14 guidelines. There have been a large number of studies that investigated the effect of drugs on ECG using in silicon three-dimensional (3D) heart model. Zemzemi et al. (2013) examined the effect of the block of ion channels on ECG parameters. Okada et al. (2018) generated an arrhythmic hazard map under multiple ion channel blocks. Sahli Costabal et al. (2019) investigated the critical drug concentration which induced torsade de pointes. Rivolta et al. (2017) performed sensitivity analysis of JTpeak and T-wave morphology parameters.
In this study, we further examined the utility of 3D ECG simulation in evaluating drug safety by simulating ECG at relatively high concentrations of drugs using realistic models of the ventricles and torso. We tested dofetilide, bepridil, cisapride, ranolazine, verapamil, mexiletine, and diltiazem using the 3D model and examined the morphologies of the simulated ECG data according to drug concentration. Dofetilide, bepridil, and cisapride are high or intermediate-proarrhythmic-risk drug that prolongs the QT by blocking hERG. Verapamil and ranolazine are “false positive” low-proarrhythmic-risk drugs; they induce prolonged QT by hERG blockade while simultaneously blocking inward Ca2+ (verapamil) and Na+ (ranolazine) ion channels (Vicente et al., 2018). Mexiletine and diltiazem are low-proarrhythmic-risk drugs that do not prolong the QT at all. Recently, CiPA researchers proposed a new ECG biomarker, JTpeak, which may enable the identification of drugs producing false-positive results (Vicente et al., 2018). Proarrhythmic drugs prolong the QT and the JTpeak due to hERG blockade, but not when the hERG blockade is offset by simultaneous blockade of other depolarizing ion channels (as by verapamil and ranolazine: only the QT prolonged but not the JTpeak). In this study, we explored the ability of the results of 3D ECG simulations to identify false-positive results independently of clinically obtained ECG data.
The model construction and ECG simulation are also described in our previous papers (Im et al., 2008; Lim et al., 2013; Ryu et al., 2019). Human ventricular geometry and torso were from our previous studies (Lim et al., 2013; Ryu et al., 2019) (Figures 1A–C). Human ventricular geometry was reconstructed from the computed tomography (CT) images obtained from the University of Ulsan Medical Center using a commercially available software Aquarius intuition (TeraRecon Inc., San Mateo, CA, United States). Tetrahedral mesh was generated inside the 3D ventricular model using an in-house software (Figure 1A). The number of grid element was 1,475,818. For the modeling of Purkinje fibers, the 2-dimensional representation of the Purkinje network shown in the paper by Berenfeld and Jalife (1998) was digitized, scaled to the size of the 3D model, and mapped onto the endocardial surface of the 3D model of the ventricles (Figure 1B). Pacing was applied at the location of His bundle. The model of Purkinje fibers simply transmits the electrical signal unidirectionally. The speeds of signal transmission at various regions were adjusted manually so that the simulated activation map matches that of clinical data (Durrer et al., 1970; Supplementary Figure S2). The end nodes of the Purkinje network stimulated myocardium by applying stimulation current of −80.0 A/F until the membrane potential exceeds −10 mV. The endocardial nodes connected to the node nearest to each end node of the Purkinje network were considered the Purkinje-muscle junction (PMJ). All the tetrahedral elements containing the PMJ nodes were stimulated. Signal propagation from the stimulation nodes throughout the tissue was obtained by solving a reaction-diffusion equation (Eq. 1) numerically:
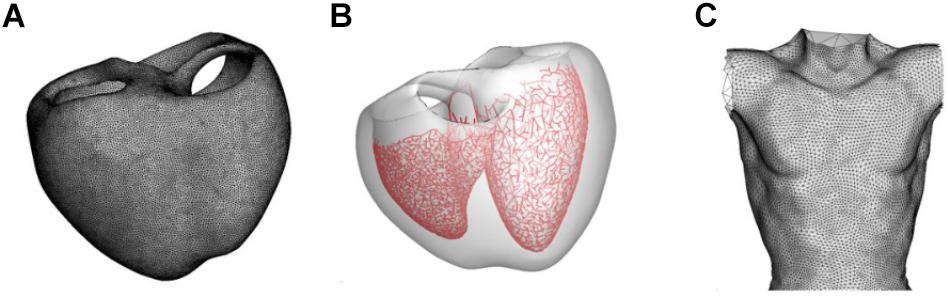
Figure 1. Models of the ventricle and torso used in the present study. (A) Grid of the ventricular model. (B) Model of the Purkinje fiber network. (C) Model of the torso.
where Vm is the transmembrane potential, t is time, D is the diffusion tensor, Cm is the membrane capacitance, and Iion and Istim are ionic and stimulation currents, respectively. The equation was spatially discretized by using finite element and the time derivative was approximated by forward Euler method (Im et al., 2008). To calculate Iion, the O’Hara-Rudy dynamic (ORd) human ventricular cell model was used (O’Hara et al., 2011). ORd model has three types of cells: endocardial, M, and epicardial cells. Each cell type was assigned to the ventricular wall with reference to the figure shown in the paper by Trudel et al. (2004). We also tested three recently published optimized cell models (Mann et al., 2016; Dutta et al., 2017; Krogh-Madsen et al., 2017). To calculate ECG values, the boundary element model of the human torso proposed by Potse et al. (2009) was used (Figure 1C). The ECG was calculated by computing the potentials on the torso surface using the following equation (Potse et al., 2009):
where ϕek(r) is potential at a point r on surface k. and are the conductivity inside and outside the surface k, respectively, Jc is the source current density field, and r′ and r″ are variables. The summation is over all surfaces l. dΩrr″ is the solid angle subtended at r by the infinitesimal surface element located at r″. The key parameters of simulation are shown in Table 1.
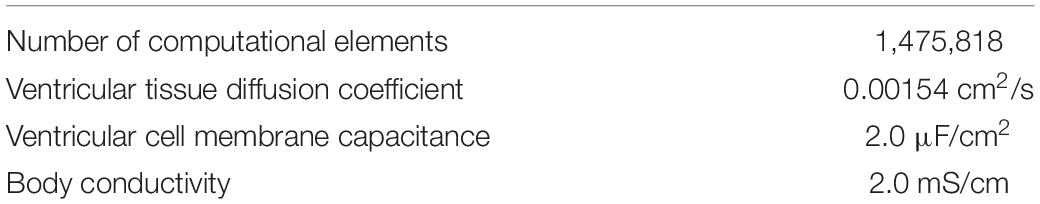
Table 1. Key parameters of simulation.
For the simulation of drug effect on ECG, we used the parameter values obtained by CiPA researchers to compare with their clinical data (Crumb et al., 2016; Li et al., 2017, 2019). We tested seven drugs: dofetilide, bepridil, cisapride, verapamil, ranolazine, mexiletine, and diltiazem. The effects of drugs were incorporated in the ECG simulation by partly blocking the corresponding ion channels (INa, INaL, ICaL, and IKr) in the ionic-current model. The percentage of blockage of each ionic current was calculated using the Hill equation (Goutelle et al., 2008). The Cmax, IC50, and Hill coefficient values for each drug with respect to each ionic current were adopted from the literature (Table 2) (Crumb et al., 2016; Li et al., 2017, 2019). Cmax means free Cmax unless otherwise stated. The effects of each drug on single-cell action potentials [of endocardial (endo), epicardial (epi), and mid-myocardial (M) cells] were examined first, and 3D ECG simulations were performed at 1×, 5× and 10× Cmax.
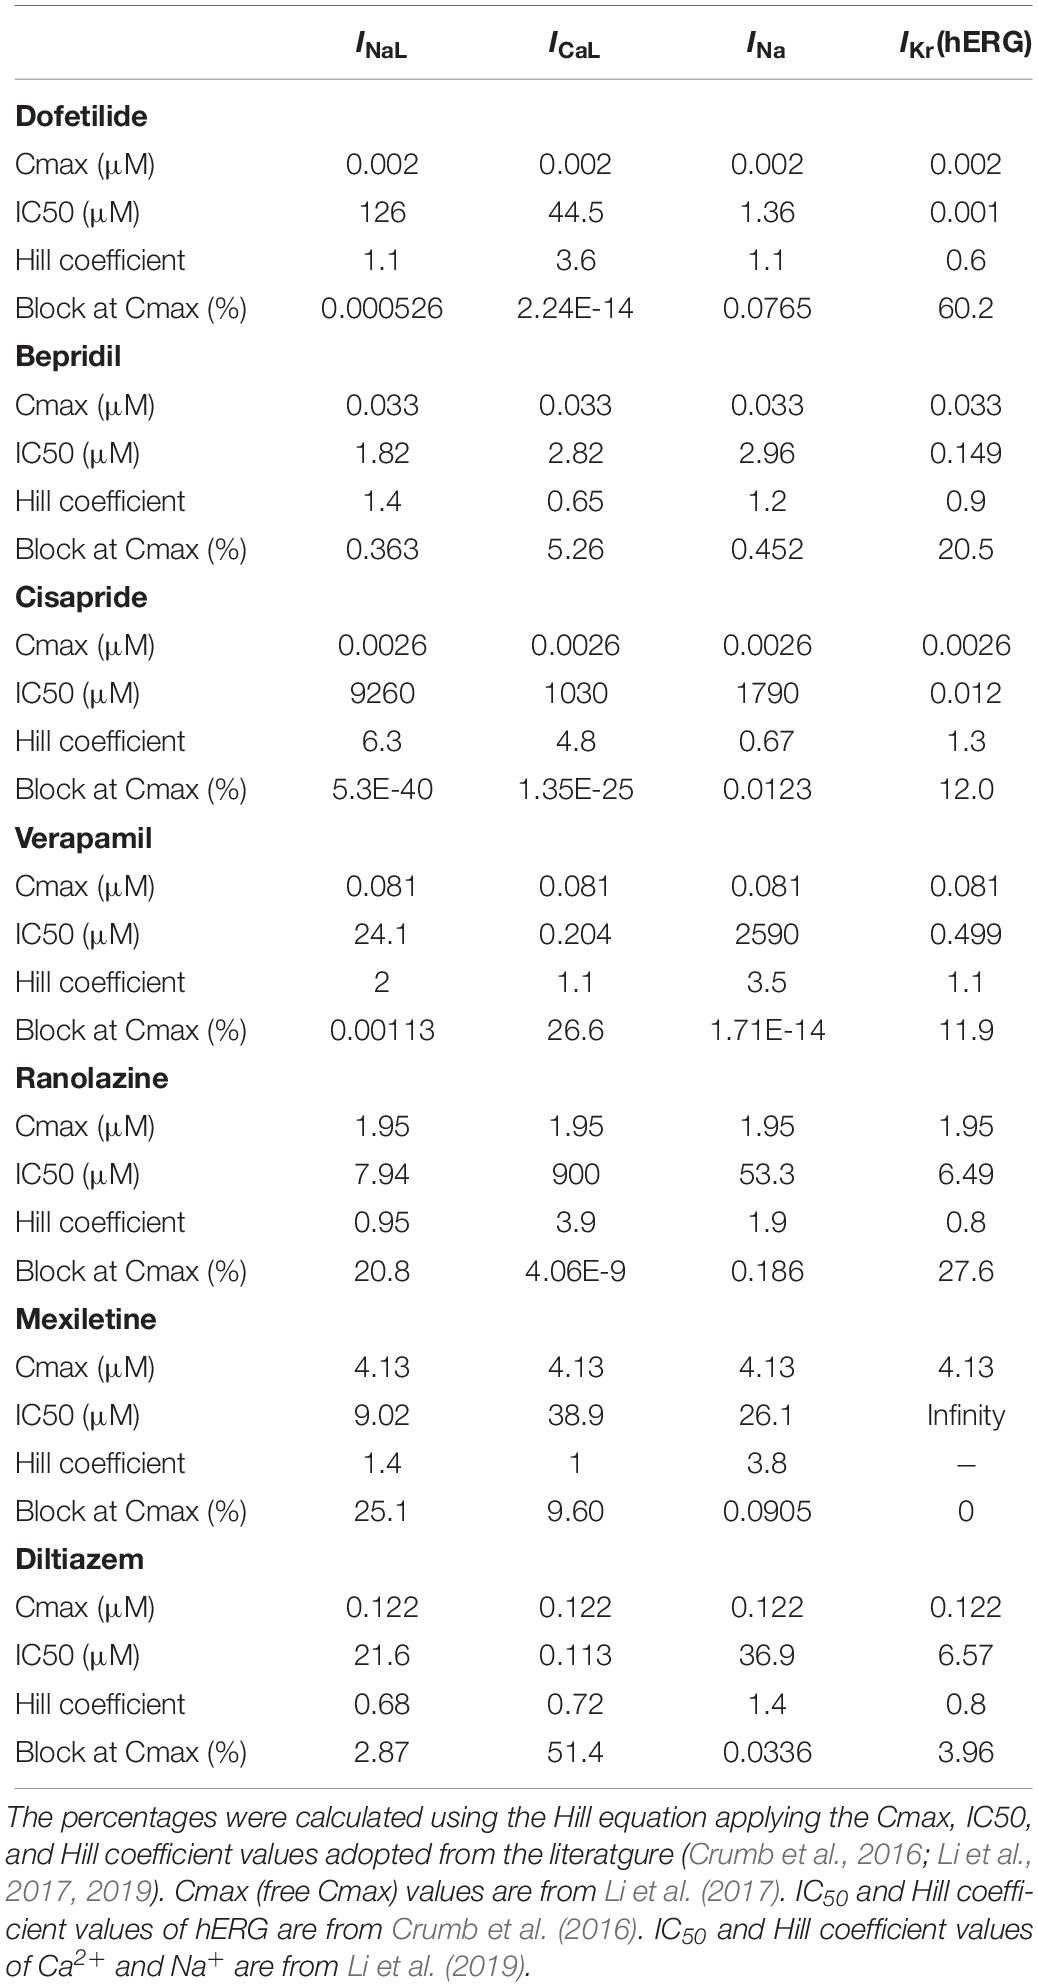
Table 2. Percentages of blockage of four ionic currents.
Figure 2 shows AP curves for endocardial, M, and epicardial cells for seven drugs at Cmax values of 1×, 5×, and 10× (Supplementary Table S1). The Cmax values are listed in Table 2. The increases in the 90% AP duration (APD90) for the three drugs in endocardial, M, and epicardial cells compared with the no-drug control are shown in Table 3. Among the three drugs, dofetilide induced the greatest increase in the APD90 value, followed by ranolazine and verapamil. When Cmax was increased from 1× to 10×, APD90 increased for all three drugs and all three cell types, with the exception of M cells, in the presence of dofetilide. Dofetilide induced ventricular tachycardia in the M cells at Cmax values of 5× and 10× (Figure 2). Table 4 shows the transmural dispersion of repolarization (TDR) values, calculated as the difference between the largest and smallest APD90s among the endocardial, M, and epicardial cells. The TDR was largest in the case of dofetilide, and verapamil did not alter the TDR at a Cmax of 1× compared with the drug-free control (Table 4). At a Cmax of 10×, verapamil increased the APD90 of epicardial cells to a greater degree than that of M cells (Table 3), which resulted in a decreased TDR compared with the drug-free control (Table 4). Figure 3 shows AP curves for seven drugs with different cell electrophysiology models. The models of O’Hara et al. (2011) and Dutta et al. (2017) provided relatively long ADP. Safe drugs resulted in relatively short APD except for ranolazine in which metabolites seem to play a significant role in drug binding (Moreno et al., 2013).
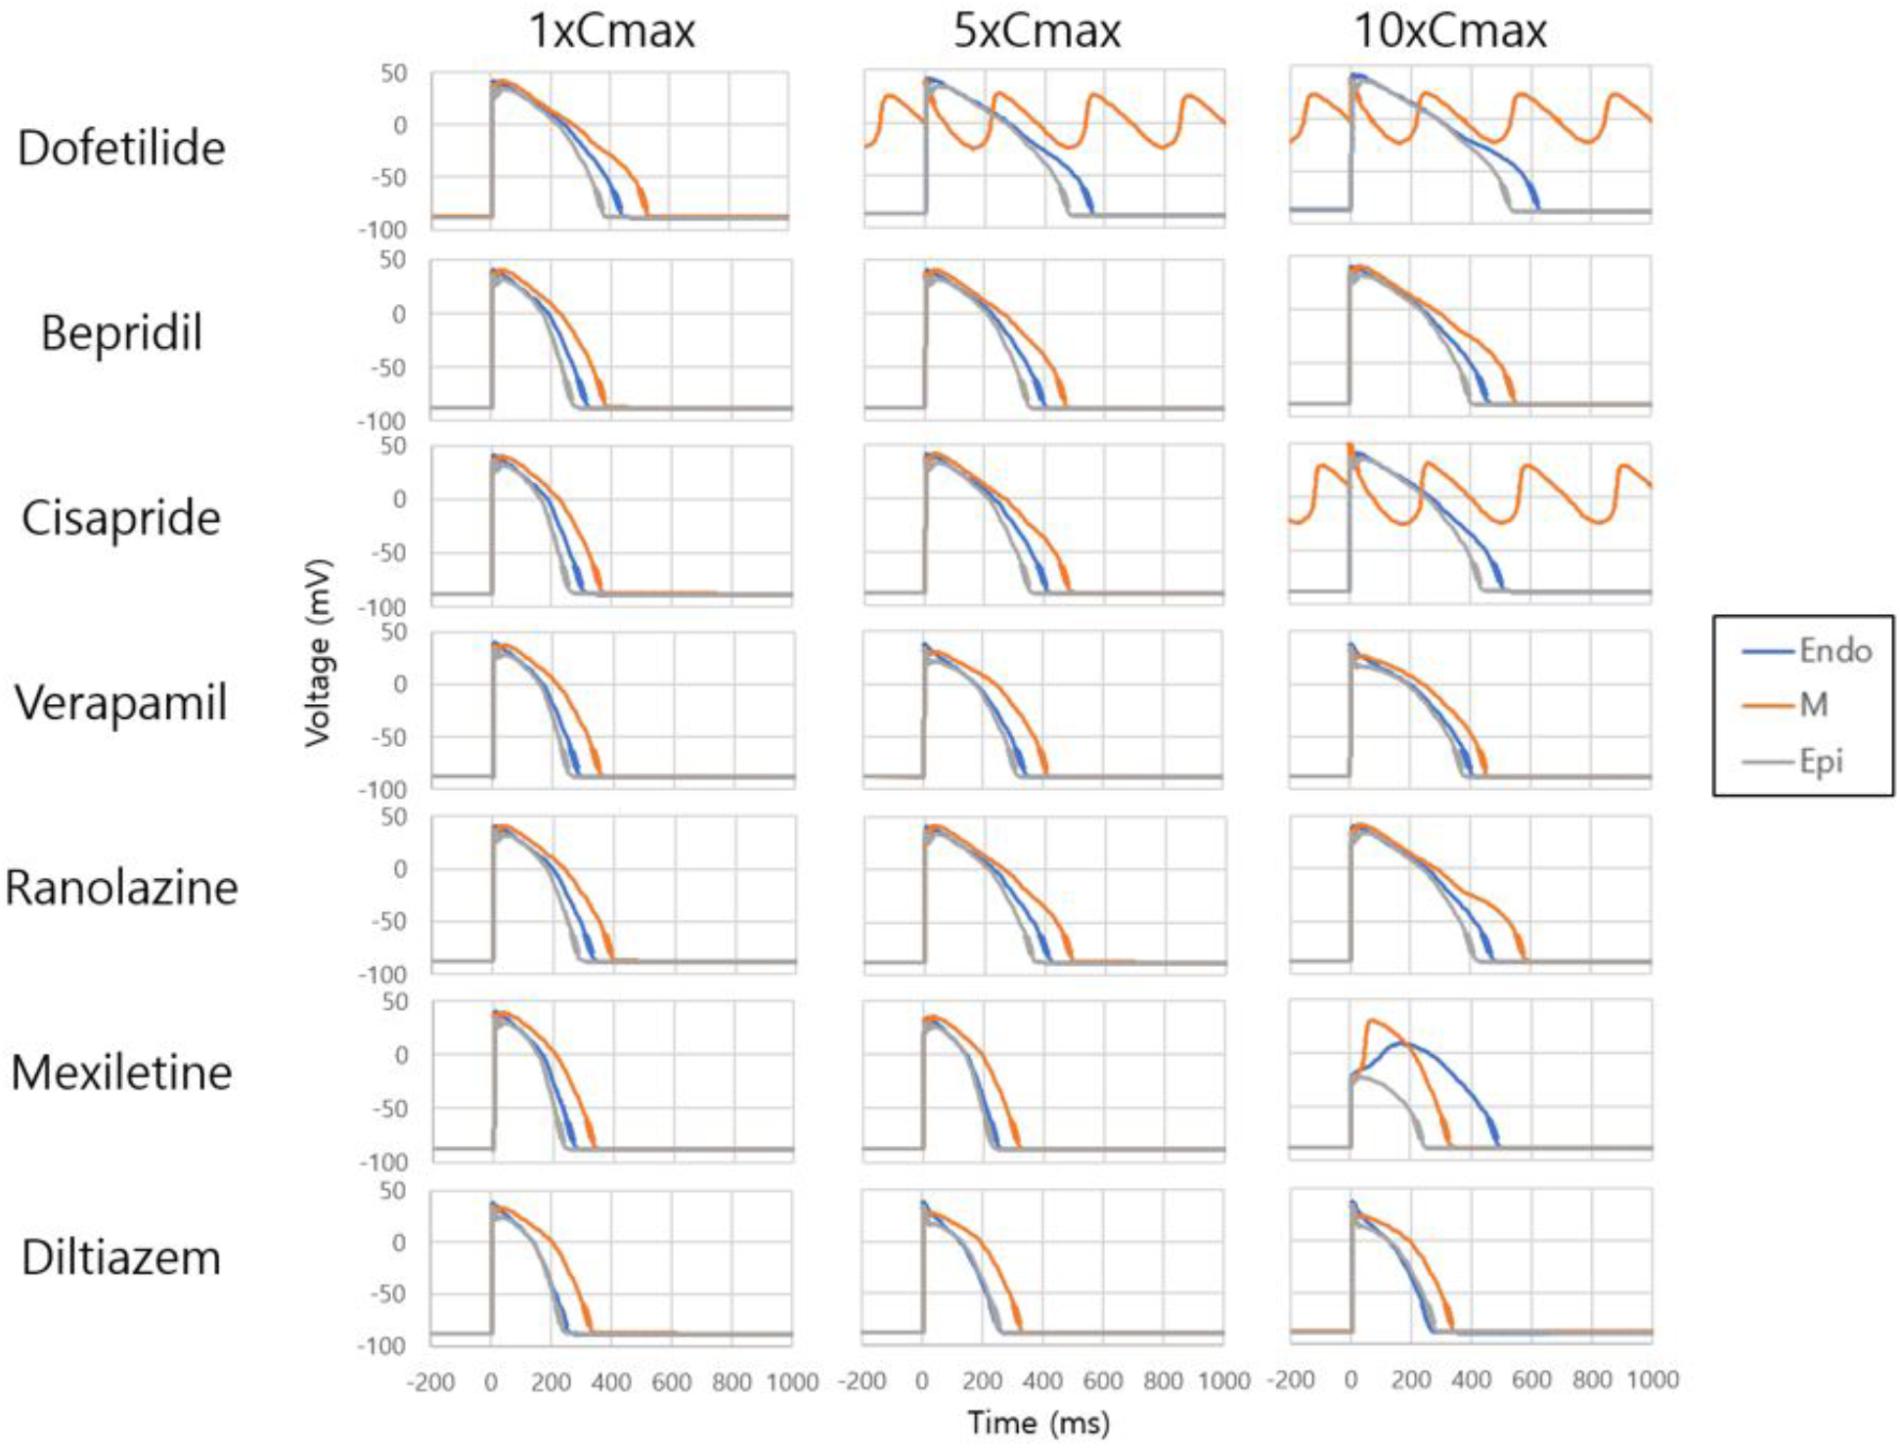
Figure 2. Effects on single-cell action potential. Action potential curves are shown for 7 drugs at Cmax values of 1×, 5×, and 10×. The action potentials of endocardial, M, and epicardial cells are shown for each drug and Cmax value. Dofetilide at Cmax values of 5× and 10× and cisapride at 10× induced tachycardia.
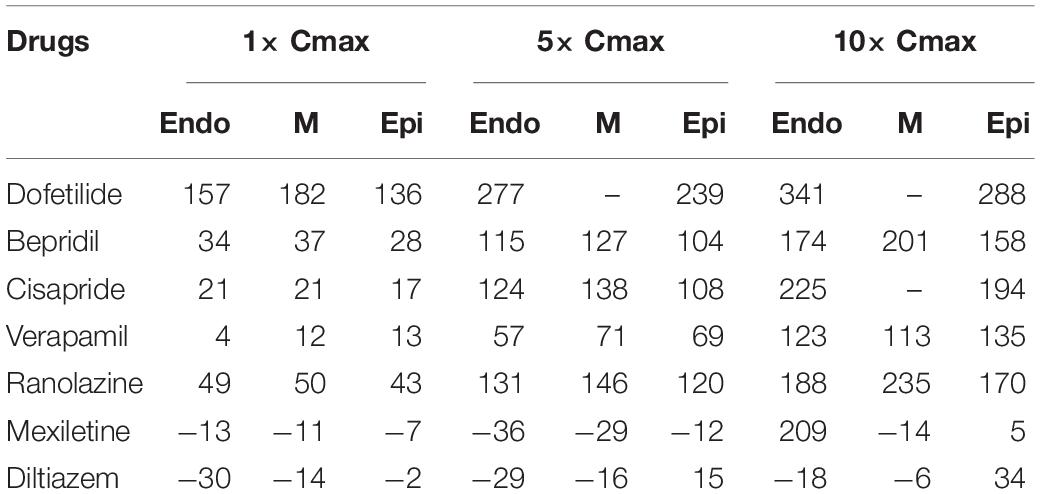
Table 3. Simulated ΔAPD90 for endocardial, M, and epicardial cells (Units: ms).
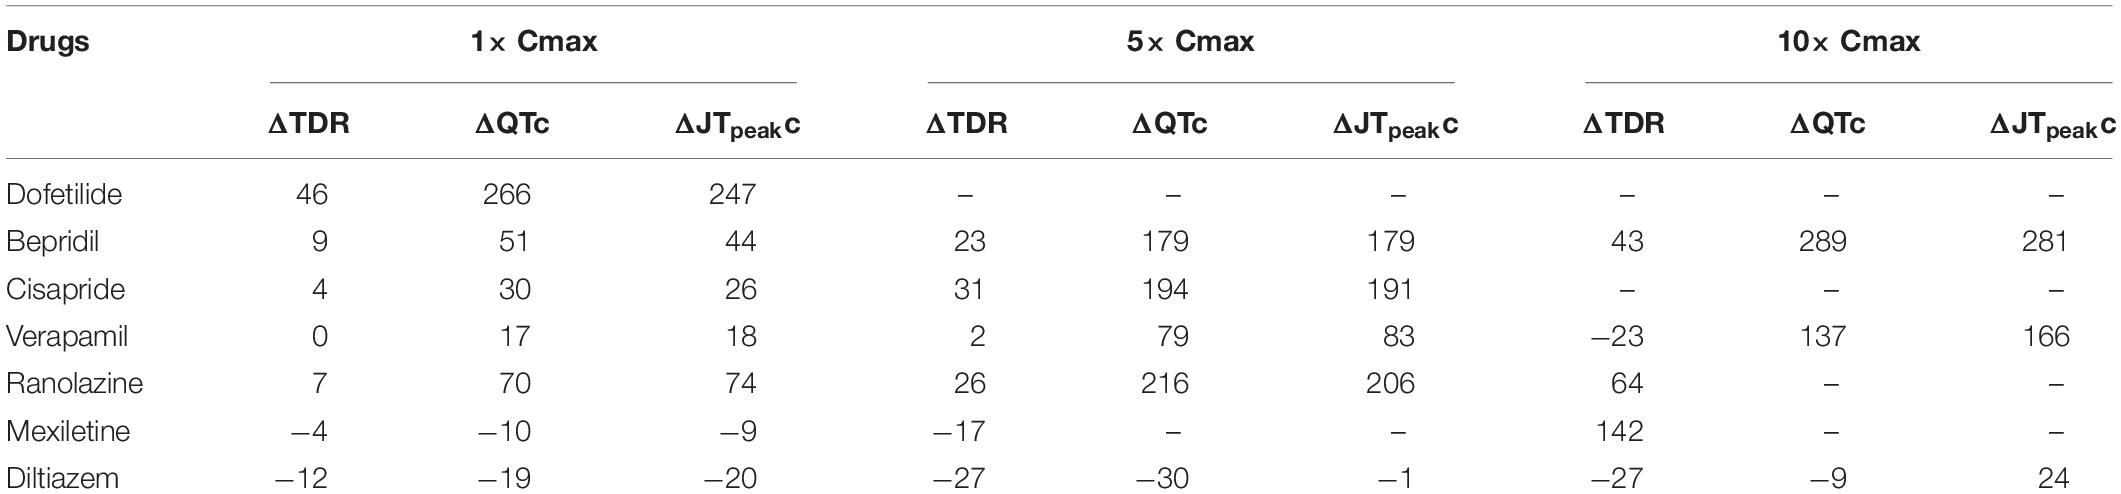
Table 4. Simulated changes in TDR, QTc, and JTpeakc according to drug concentration (Unit: ms).
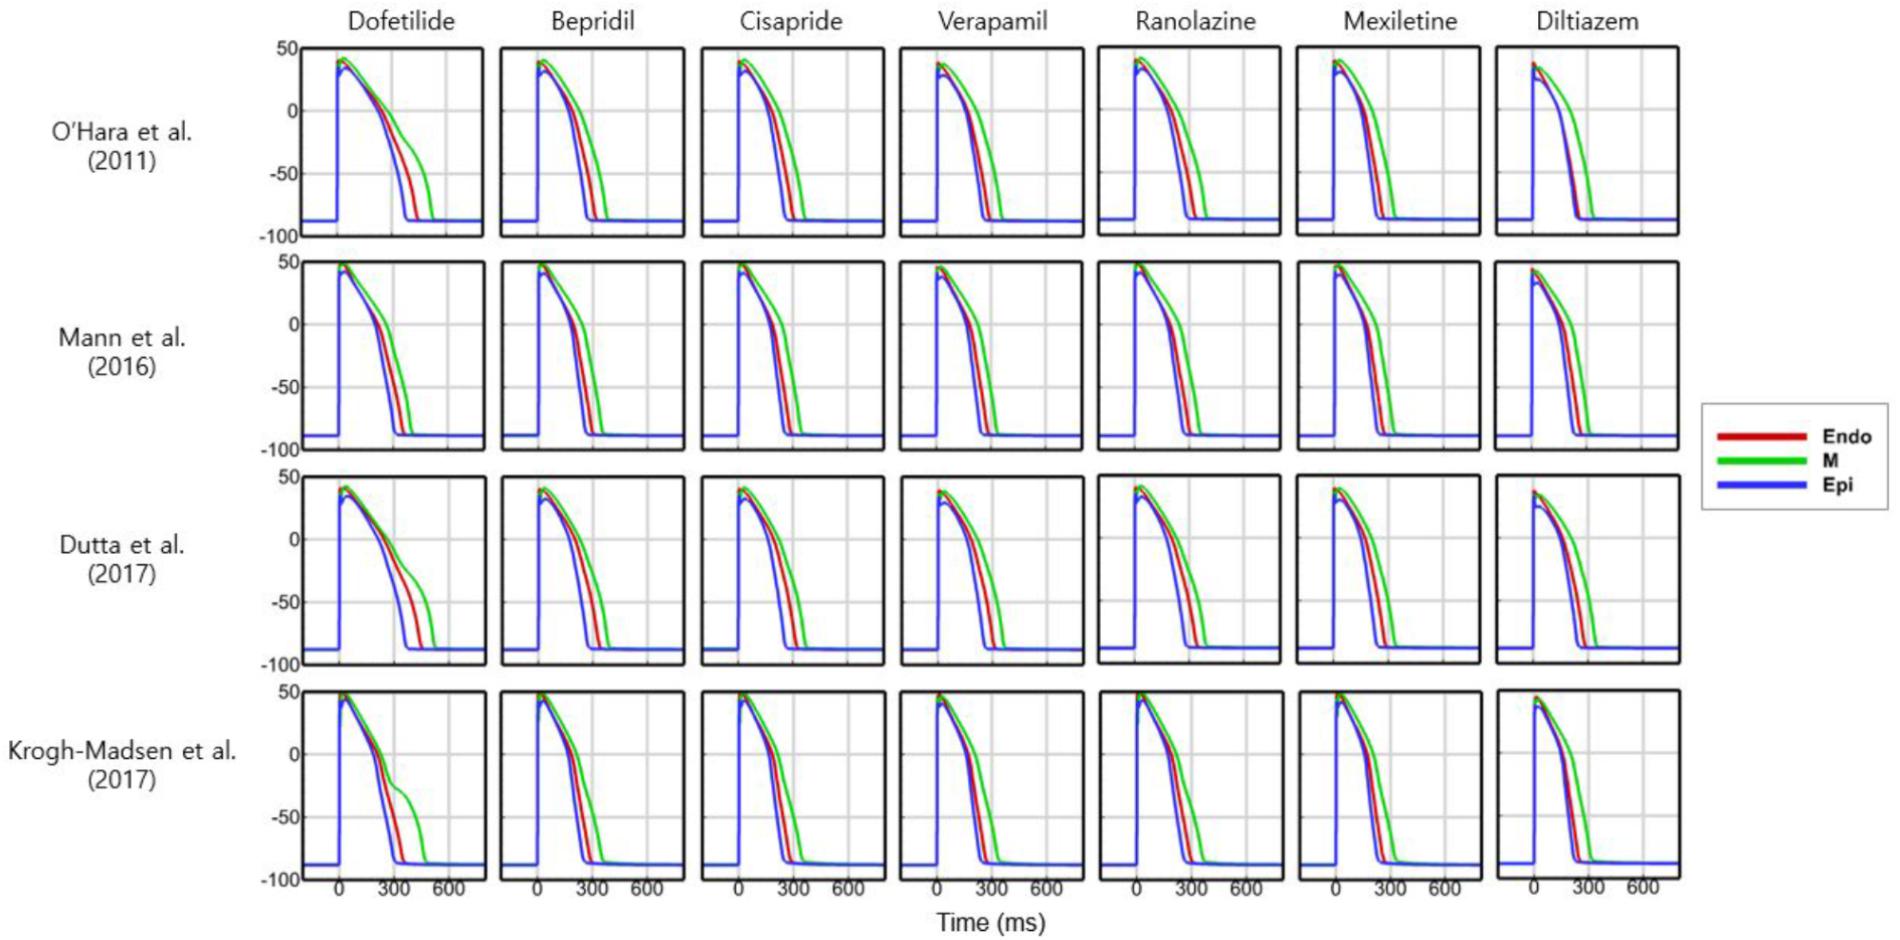
Figure 3. Action potentials with different cell models. Action potential curves are shown for 7 drugs with 4 different cell models at 1× Cmax. Action potentials of endocardial, M, and epicardial cells are shown.
To examine the effects of drug concentration on ECG parameters, 3D ECG simulations were performed using the conditions shown in Figure 2. Figure 4 shows the simulated ECGs (lead I) for the seven drugs according to concentration. Dofetilide resulted in the greatest increase in the ΔQTc value at 1× Cmax (Table 4). At a Cmax value of 5×, dofetilide induced ventricular flutter; at 10× Cmax, dofetilide, cisapride, and ranolazine induced ventricular flutter. In contrast to findings reported by the CiPA researchers (Vicente et al., 2018), the JTpeakC value increased with the QTc value for ranolazine and verapamil (Table 4). Figure 5 shows ECGs obtained from using different optimized cell models for the seven drugs at 1× Cmax. Dofetilide exhibited relatively long QT interval in all the cell models except for the model of Krogh-Madsen et al. (2017) in which the ECG morphology was irregular. The amplitude of the T wave was largest in the case of Dutta et al. (2017) while the model of Mann et al. (2016) exhibited the smallest T wave amplitude. Table 5 shows JTpeakc prolongation of drugs for different optimized cell models. The optimized cell models resulted in JTpeakc prolongations which are more consistent with clinical observations than the original ORd model. For ranolazine, metabolites seem to play a significant role in drug binding (Moreno et al., 2013).
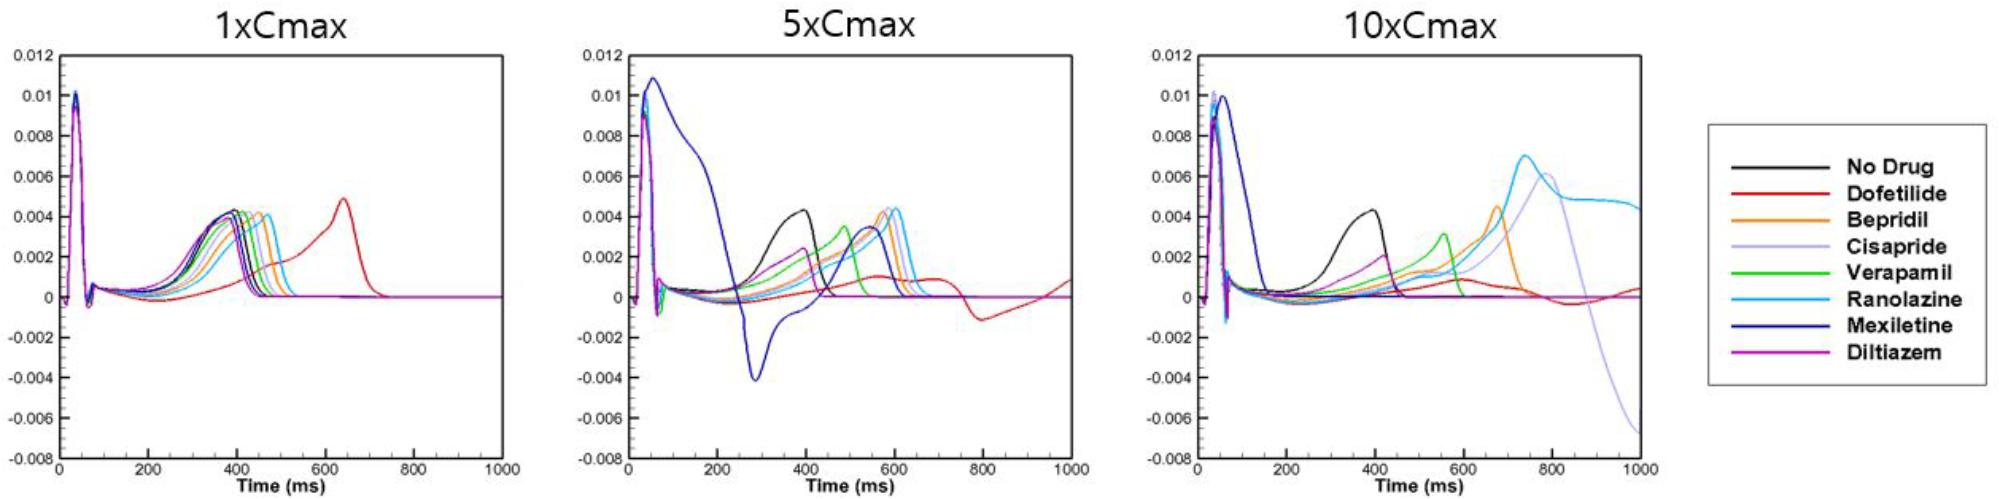
Figure 4. Effects on body-surface ECG parameters. Body-surface ECG data (lead I) are shown for 7 drugs at Cmax values of 1×, 5×, and 10× compared with drug-free conditions. The QT interval was longest for dofetilide.
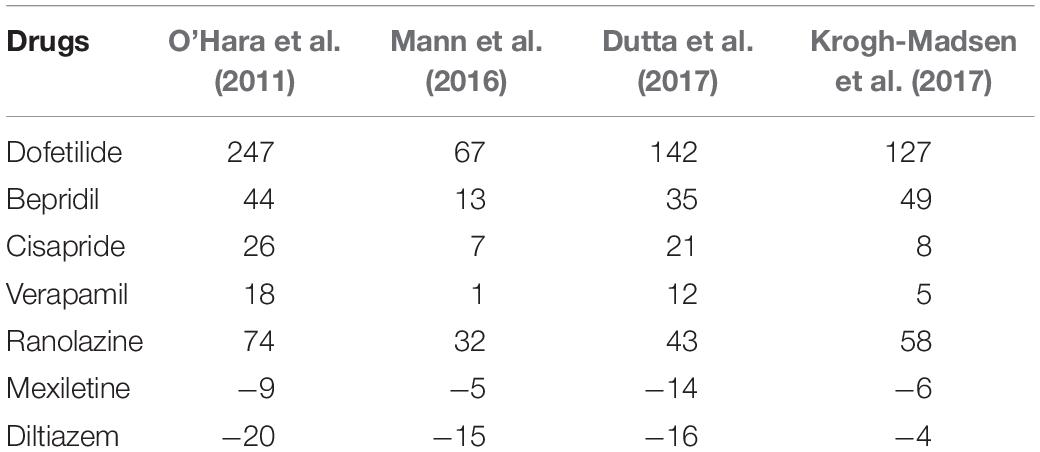
Table 5. Simulated ΔJTpeakc for various drugs with different cell models (Unit: ms).
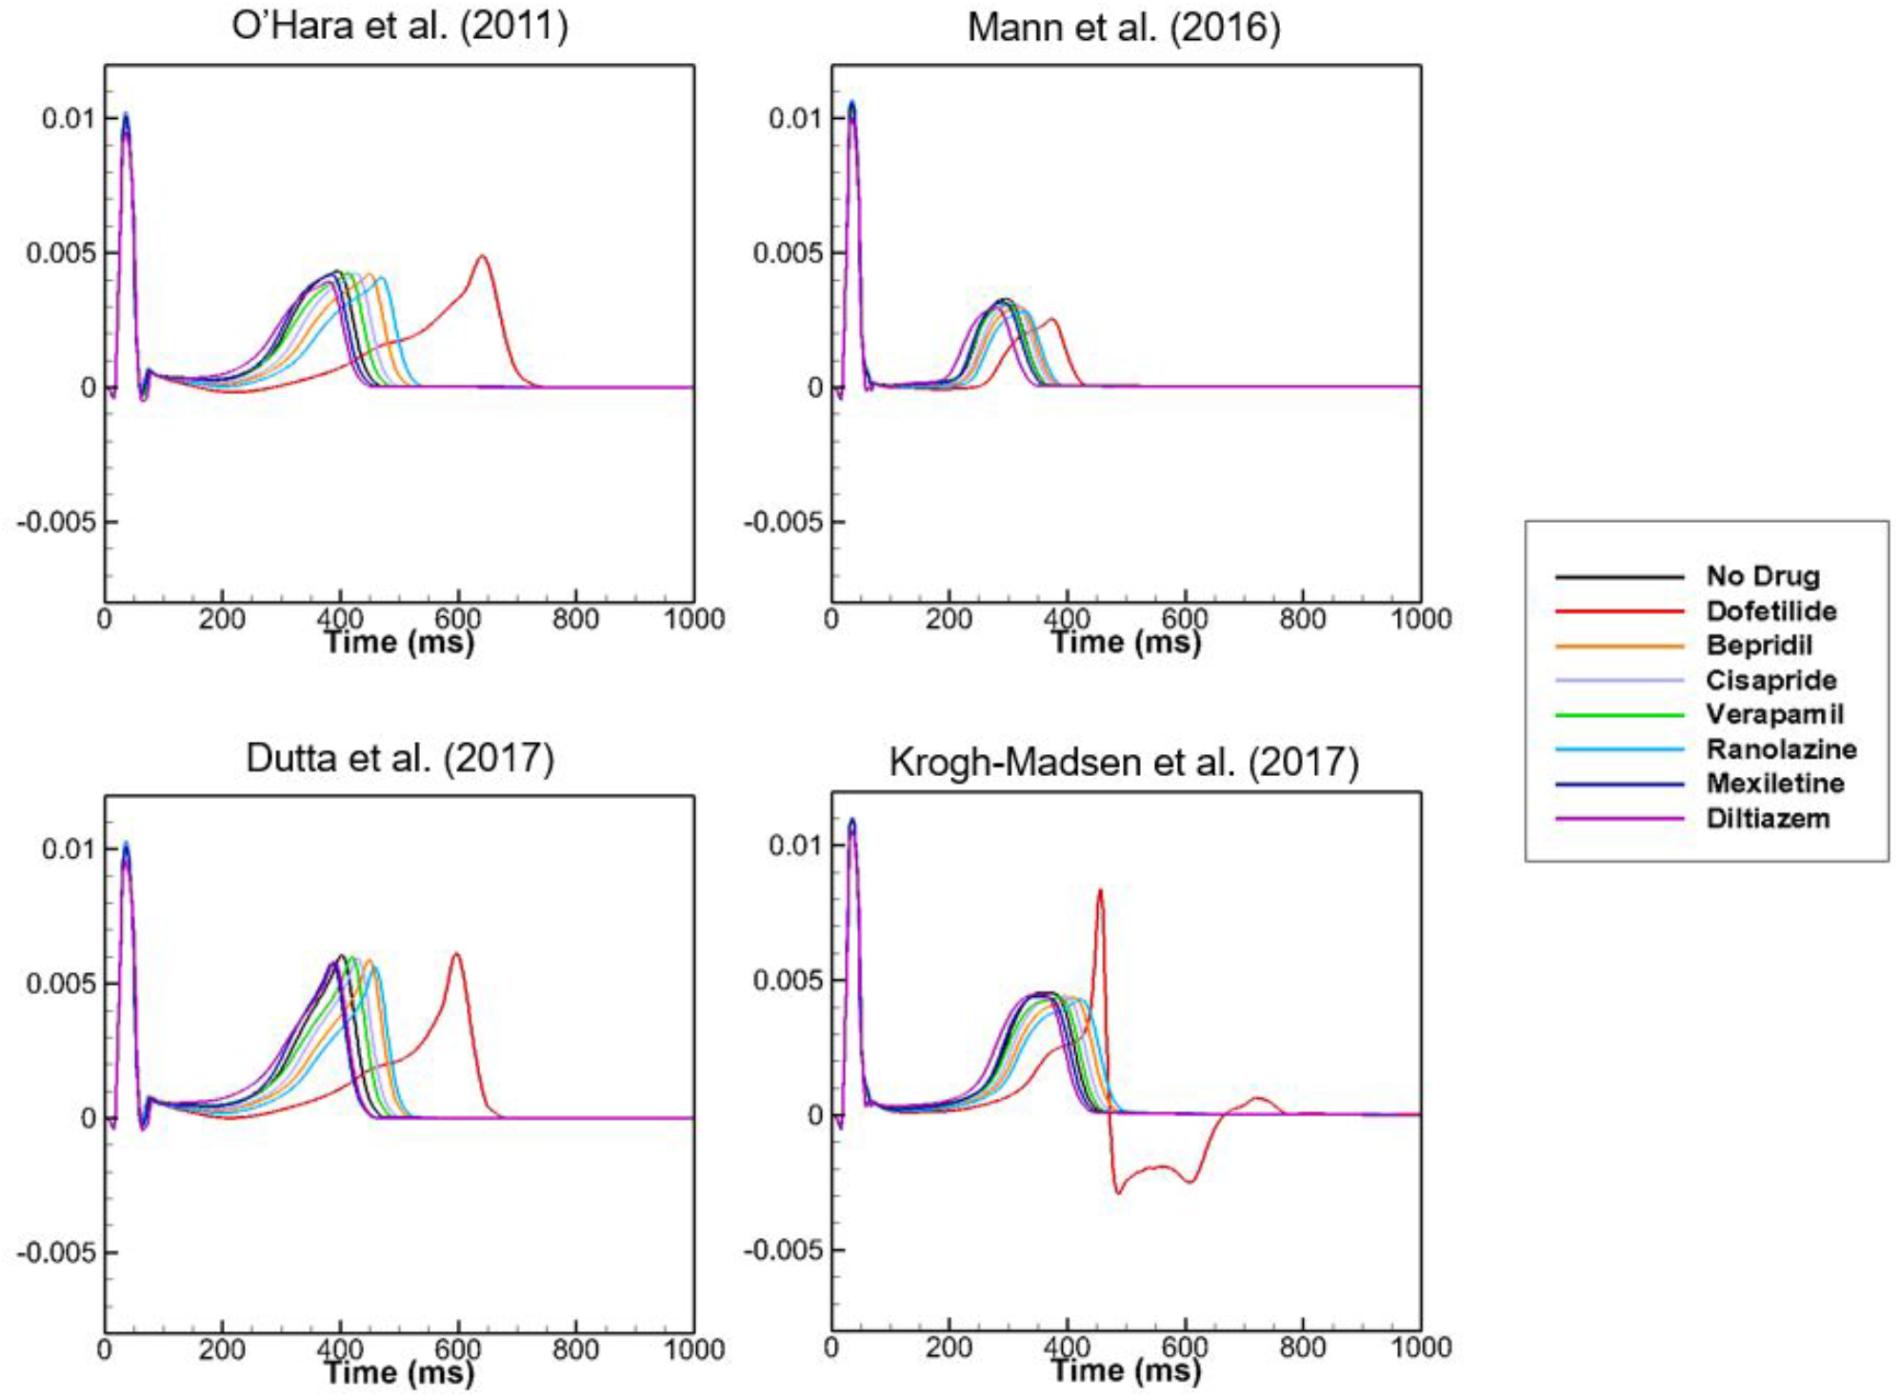
Figure 5. ECGs with different cell models. Body-surface ECGs (lead I) are shown for 7 drugs applying different cell models at 1× Cmax. Irregular morphology of ECG is observed for dofetilide in the case of the model by Krogh-Madsen et al. (2017).
Because dofetilide induced ventricular tachycardia in the single-cell model at Cmax values of 5× and 10×, ventricular tachycardia was examined in the 3D model. Figure 6 shows the AP from the single-cell model, the AP at a point in the 3D model, and ECG data from the 3D model in the presence of dofetilide at a Cmax of 10×, which indicates the presence of ventricular tachycardia. Figure 6 also shows snapshots of ventricular AP propagation, which exhibits rotational activation. Table 6 lists the occurrences of ventricular tachycardia caused by the three drugs according to concentration. The arrhythmia morphology was not polymorphic, which is a limitation of our model.
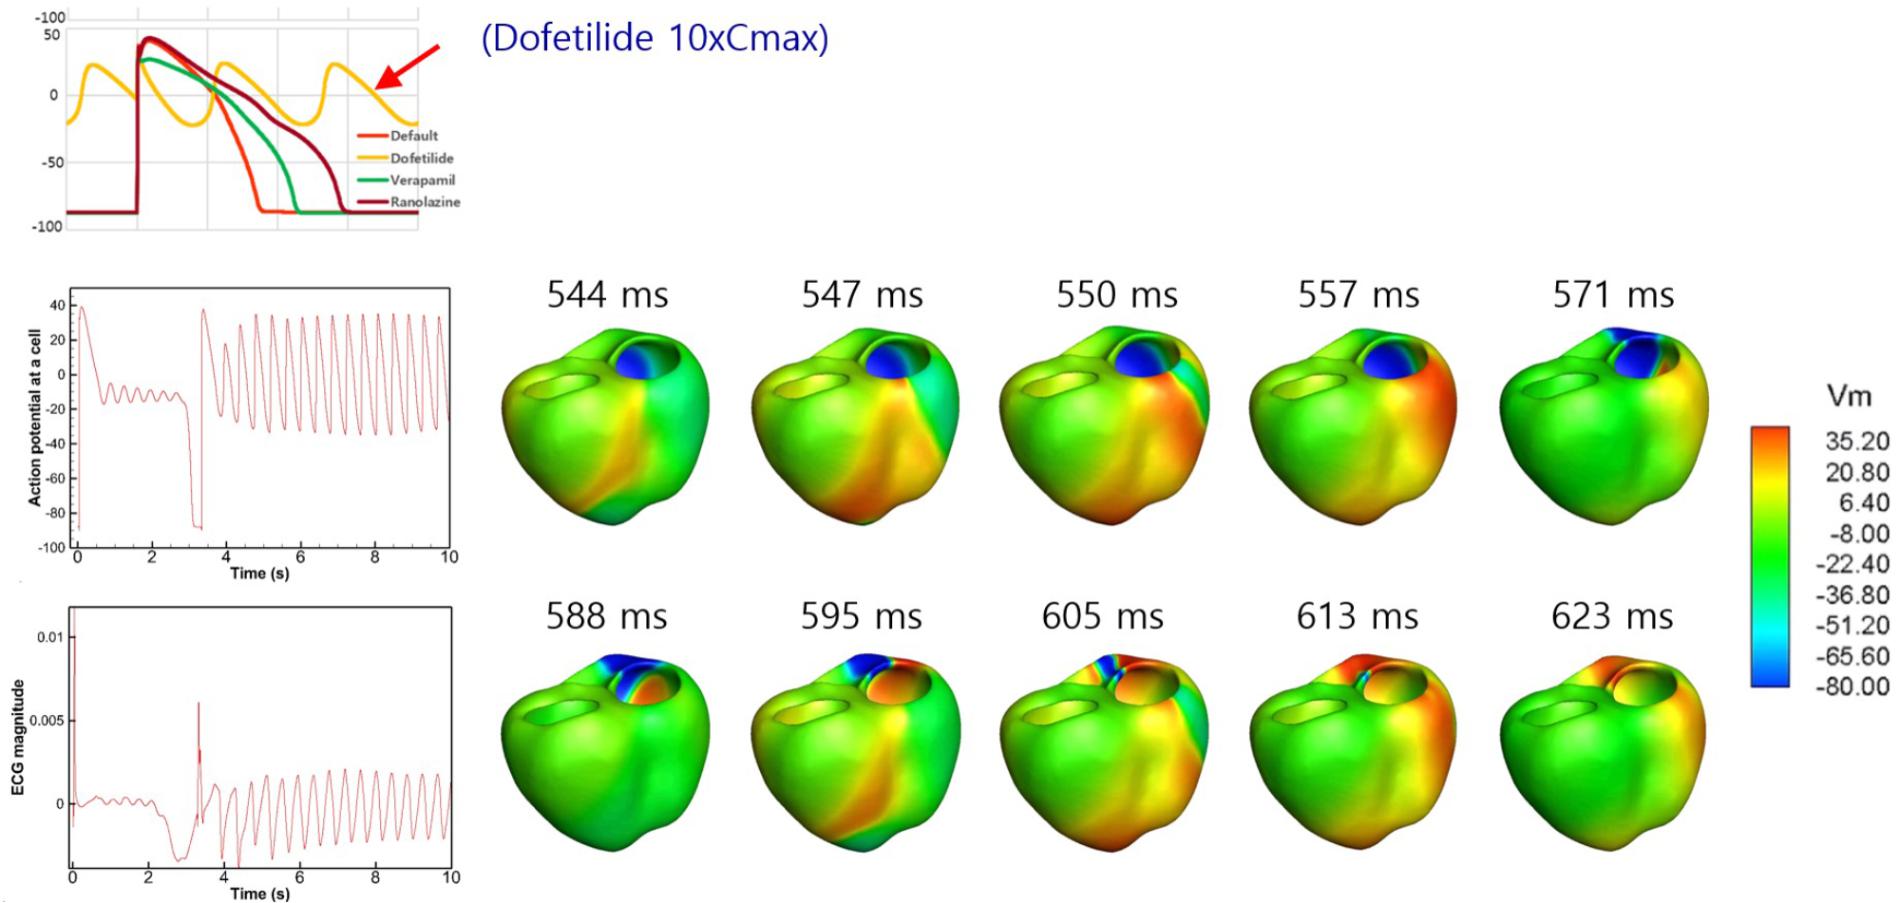
Figure 6. Drug-induced ventricular tachycardia. The action potential from the single-cell model, action potential at a point in the 3D model, and ECG data from the 3D model in the presence of dofetilide at a Cmax value of 10× are shown. Photographs of ventricular action potential propagation are also shown.
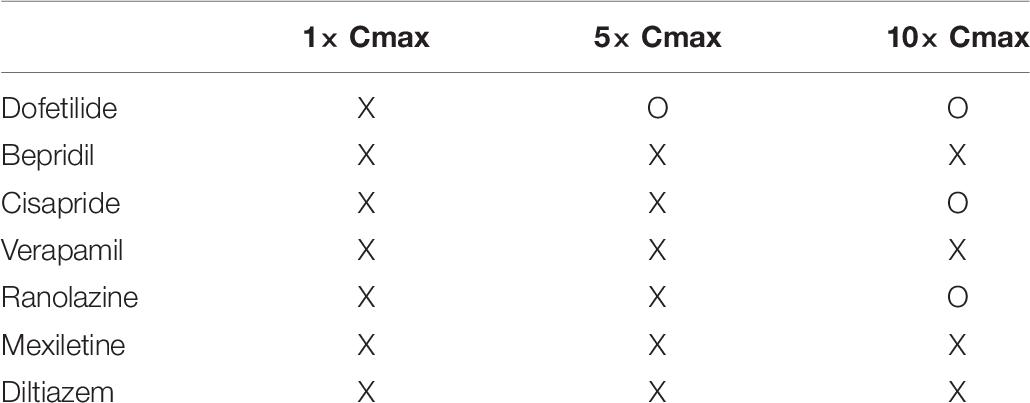
Table 6. Occurrence of ventricular tachycardia. Simulated ECG was examined to determine the occurrence of VT (O: VT occurred, X: VT did not occur).
To test the suitability of the models to examine JTpeak, we checked the rate dependence of JTpeak using various models without any drug effect. All the models showed decreasing JTpeak as heart rate increased with the model of Dutta et al. (2017) exhibiting the best agreement with clinical data (Johannesen et al., 2014; Figure 7). We also validated intercellular conduction by comparing activation times obtained from our ventricular model with those in the literature (Supplementary Figure S1).
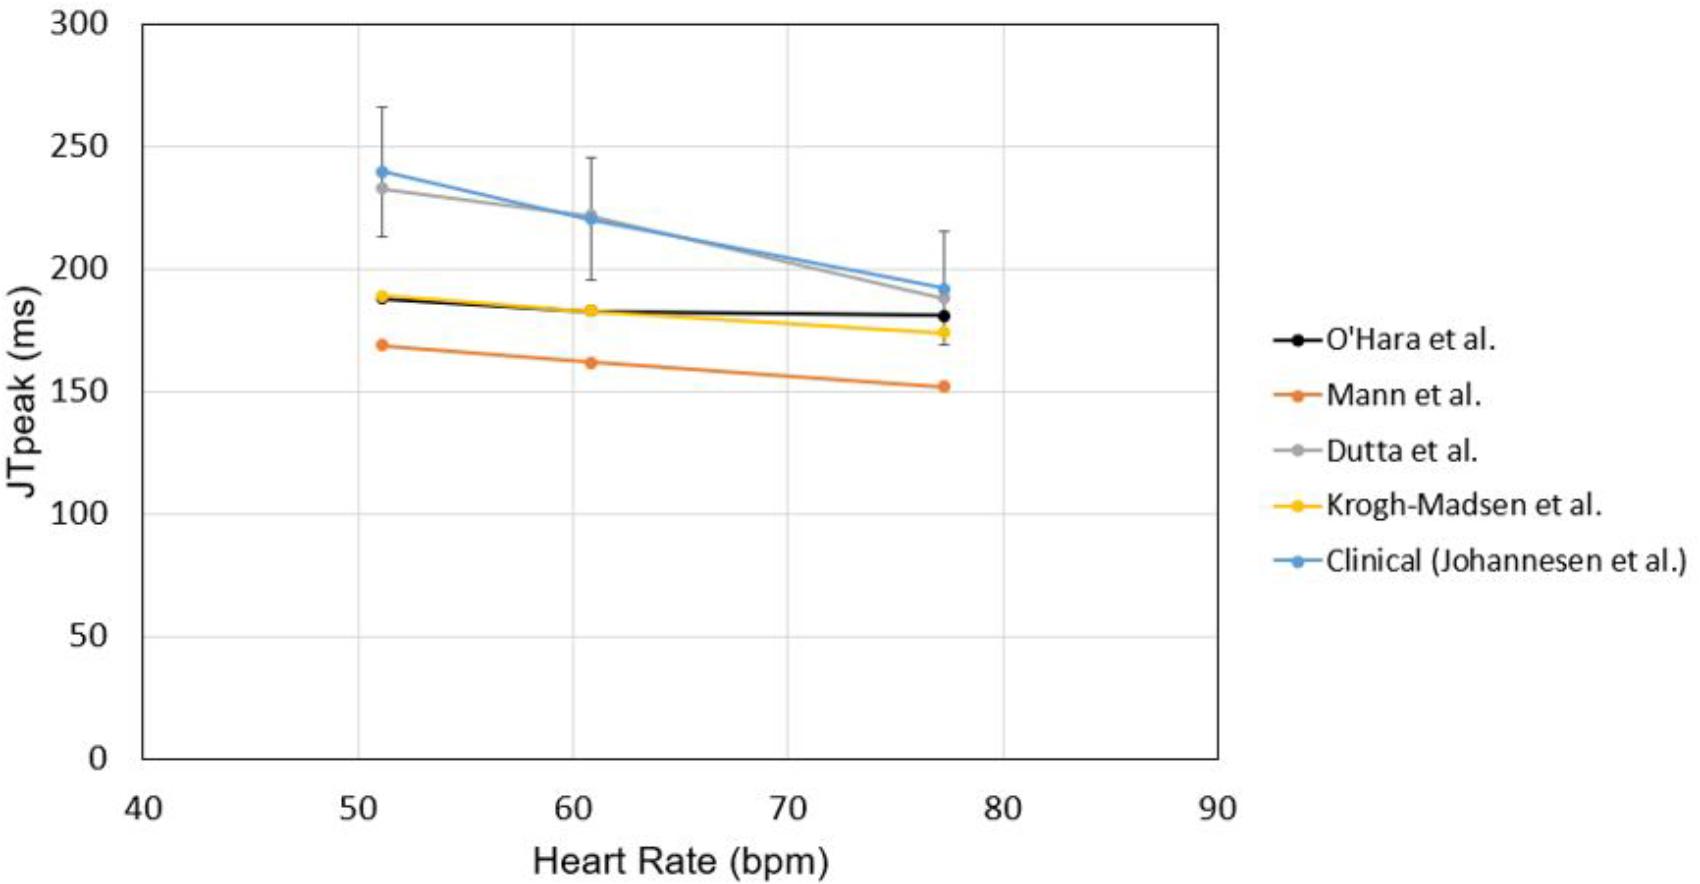
Figure 7. Rate dependence of JTpeak. JTpeak was obtained for different heart rates with different cell models. Simulation results were compared with clinical data by Johannesen et al. (2014).
In evaluations of drug safety, the QT interval in ECGs has received much attention because drug-induced prolongation of the QT interval is, under certain conditions, associated with the risk of TdP, a fatal ventricular arrhythmia. However, prolongation of the QT interval does not always lead to TdP. The recently proposed CiPA initiative aims to enable more comprehensive evaluation of drug safety (Vicente et al., 2018; Wallis et al., 2018). In this study, we examined the effects of seven drugs on the QT interval using a realistic in silico 3D body-surface ECG model that included the ventricles and torso. Among the seven drugs, dofetilide resulted in the greatest increase in the QT interval, which is consistent with published data (Vicente et al., 2015). Dofetilide use entails a relatively high risk of TdP (Tisdale, 2016). However, the occurrence of TdP requires not only prolongation of the QT interval, but also early afterdepolarization (EAD) and TDR (Antzelevitch et al., 2004). In this study, dofetilide also exhibited the highest TDR values (Figure 2 and Table 4). In addition, dofetilide does not block the INaL and ICaL channels (Table 2), which increases the probability of EAD. The increases in APD90 caused by ranolazine and verapamil were smaller than those induced by dofetilide, which resulted in smaller increases in the QT interval in the 3D ECG simulation. Ranolazine blocks INaL channels almost as effectively as IKr channels (Table 2) and entails a low risk of TdP because blockade of INaL channels decreases the risk of EAD (Hawwa and Menon, 2013). Interestingly, for ranolazine, the magnitude of the increase in the APD90 was similar in endocardial and M cells, whereas for verapamil it was similar in M and epicardial cells, at 1× Cmax (Table 3). Dofetilide induced the greatest increase in the APD90 of M cells; most QT interval-prolonging drugs increase the APD of M cells preferentially, thereby increasing the TDR value (Antzelevitch et al., 2004). Verapamil did not affect the TDR at a Cmax of 1× and decreased it at 10× Cmax, consistent with the low risk of TdP associated with its use (Milberg et al., 2005).
In this study, the increases in JTpeakC were similar to those in QTc, in contrast to the finding of Vicente et al. (2015) that the JTpeakC is not increased by ranolazine or verapamil at a Cmax value of 1×. Tpeak corresponds to the time of epicardial repolarization, and most drugs that increase the epicardial APD also increase the JTpeakC because of delayed epicardial layer repolarization. Ranolazine and verapamil increased the epicardial APD and the JTpeakC in our simulation. Thus, the discrepancy in the JTpeakC interval between our simulated results and human ECGs performed after administration of verapamil or ranolazine implies that the 3D model needs further improvement. In order to make the model accurately predict the prolongations of JTpeak and Tpeak–Tend, the improvement of the cell models seems to be needed. If epicardial APD remains the same, and endocardial APD increases under the effects of a drug, JTpeak should remain the same, and Tpeak–Tend should increase, which is expected in the cases of safe drugs. The current cell models do not exhibit these behaviors of APD changes under the effects of safe drugs, which disqualifies the current model as a biomarker. EAD was also observed in our simulated AP for ranolazine at a Cmax value of 10×, but not 5×. This result may reflect a limitation of the in vitro data-based simulation, in which the role of metabolites was not considered. However, simulation at a Cmax value of 10× was not recommended by the CiPA because of excessive variability in the values of the markers at higher concentrations (Li et al., 2019). Thus, the ventricular tachycardia induced by dofetilide (but not by verapamil or ranolazine) at 5× Cmax may have potential as an in silico biomarker for screening of the TdP risks posed by candidate molecules.
Although validation is needed to improve the predictive capability of the model, this study demonstrated the possibility of the model to become an effective biomarker to examine the effects of drugs on body-surface ECG parameters using realistic 3D models of the ventricles and torso. This step could lead to our ultimate goal of creating a comprehensive in silico drug-safety testing system.
This study also has several limitations. First, in the human ventricular model, we had difficulty in defining the spatial distribution of the sandwiched midcardial cell layer between the endocardial and epicardial cells. The distribution was adopted from the scheme presented in Trudel et al. (2004). Second, in the model of the ventricles and torso, we did not consider the lungs and other tissues between the body surface and the heart when solving for the body surface potentials. The bone located between the heart and body surface might influence ECG data due to its much higher electrical impedance than that of body fluids. We did not consider the effect of this bone in the ECG algorithm. In a future study, the electrical impedance of bone will be considered. Similarly, the effects of non-homogeneous properties of extracellular tissue should be incorporated into the heart model. However, we believe that these limitations did not greatly affect the major findings of this study.
The datasets generated for this study are available on request to the corresponding author.
D-SY and ES provided the main idea for this research. MH, SH, and MP obtained and analyzed the data. MH wrote the initial draft of the manuscript. D-SY and ES edited the manuscript. CL provided advice on physiological issues and contributed to the toxicity test protocol. All authors reviewed the manuscript.
This research was supported by a grant (18182MFDS406) from the Ministry of Food and Drug Safety of Korea in 2018.
MH is employed by SiliconSapiens Inc. (Seoul, South Korea).
The remaining authors declare that the research was conducted in the absence of any commercial or financial relationships that could be construed as a potential conflict of interest.
The Supplementary Material for this article can be found online at: https://www.frontiersin.org/articles/10.3389/fphys.2019.01139/full#supplementary-material
AP, action potential; CT, computed tomography; EAD, early afterdepolarization; ECG, electrocardiogram; ORd, O’Hara-Rudy dynamic; TdP, Torsades de pointes; TDR, transmural dispersion of repolarization.
Antzelevitch, C., Belardinelli, L., Zygmunt, A. C., Burashnikov, A., Di Diego, J. M., Fish, J. M., et al. (2004). Electrophysiological effects of ranolazine, a novel antianginal agent with antiarrhythmic properties. Circulation 110, 904–910. doi: 10.1161/01.cir.0000139333.83620.5d
Berenfeld, O., and Jalife, J. (1998). Purkinje-muscle reentry as a mechanism of polymorphic ventricular arrhythmias in a 3-dimensional model of the ventricles. Circ. Res. 82, 1063–1077. doi: 10.1161/01.res.82.10.1063
Crumb, W. J., Vicente, J., Johannesen, L., and Strauss, D. G. (2016). An evaluation of 30 clinical drugs against the comprehensive in vitro proarrhythmia assay (CiPA) proposed ion channel panel. J. Pharmacol. Toxicol. Methods 81, 251–262. doi: 10.1016/j.vascn.2016.03.009
Darpo, B. (2010). The thorough QT/QTc study 4 years after the implementation of the ICH E14 guidance. Br. J. Pharmacol. 159, 49–57. doi: 10.1111/j.1476-5381.2009.00487.x
De Ponti, F., Poluzzi, E., Cavalli, A., Recanatini, M., and Montanaro, N. (2002). Safety of non-antiarrhythmic drugs that prolong the QT interval or induce torsade de pointes: an overview. Drug Saf. 25, 263–286. doi: 10.2165/00002018-200225040-00004
Durrer, D., van Dam, R. T., Freud, G. E., Janse, M. J., Meijler, F. L., and Arzbaecher, R. C. (1970). Total excitation of the isolated human heart. Circulation 41, 899–912. doi: 10.1161/01.cir.41.6.899
Dutta, S., Chang, K. C., Beattie, K. A., Sheng, J., Tran, P. N., Wu, W. W., et al. (2017). Optimization of an in silico cardiac cell model for proarrhythmia risk assessment. Front. Physiol. 8:616. doi: 10.3389/fphys.2017.00616
Goutelle, S., Maurin, M., Rougier, F., Barbaut, X., Bourguignon, L., Ducher, M., et al. (2008). The hill equation: a review of its capabilities in pharmacological modelling. Fundam. Clin. Pharmacol. 22, 633–648. doi: 10.1111/j.1472-8206.2008.00633.x
Hawwa, N., and Menon, V. (2013). Ranolazine: clinical applications and therapeutic basis. Am. J. Cardiovasc. Drugs 13, 5–16. doi: 10.1007/s40256-012-0003-2
Im, U. B., Kwon, S. S., Kim, K., Lee, Y. H., Park, Y. K., Youn, C. H., et al. (2008). Theoretical analysis of the magnetocardiographic pattern for reentry wave propagation in a three-dimensional human heart model. Prog. Biophys. Mol. Biol. 96, 339–356. doi: 10.1016/j.pbiomolbio.2007.07.024
Johannesen, L., Vicente, J., Gray, R. A., Galeotti, L., Loring, Z., Garnett, C. E., et al. (2014). Improving the assessment of heart toxicity for all new drugs through translational regulatory science. Clin. Pharmacol. Ther. 95, 501–508. doi: 10.1038/clpt.2013.238
Krogh-Madsen, T., Jacobson, A. F., Ortega, F. A., and Christini, D. J. (2017). Global Optimization of Ventricular myocyte model to multi-variable objective improves predictions of drug-induced torsades de pointes. Front. Physiol. 8:1059. doi: 10.3389/fphys.2017.01059
Li, Z., Dutta, S., Sheng, J., Tran, P. N., Wu, W., Chang, K., et al. (2017). Improving the in silico assessment of proarrhythmia risk by combining hERG (human ether-a-go-go-related gene) channel-drug binding kinetics and multichannel pharmacology. Circ. Arrhythm. Electrophysiol. 10:e004628.
Li, Z., Ridder, B. J., Han, X., Wu, W. W., Sheng, J., Tran, P. N., et al. (2019). Assessment of an in silico mechanistic model for proarrhythmia risk prediction under the CiPA initiative. Clin. Pharmacol. Ther. 105, 466–475. doi: 10.1002/cpt.1184
Lim, K. M., Jeon, J. W., Gyeong, M. S., Hong, S. B., Ko, B. H., Bae, S. K., et al. (2013). Patient-specific identification of optimal ubiquitous electrocardiogram (U-ECG) placement using a three-dimensional model of cardiac electrophysiology. IEEE Trans. Biomed. Eng. 60, 245–249. doi: 10.1109/TBME.2012.2209648
Mann, S. A., Imtiaz, M., Winbo, A., Rydberg, A., Perry, M. D., Couderc, J. P., et al. (2016). Convergence of models of human ventricular myocyte electrophysiology after global optimization to recapitulate clinical long QT phenotypes. J. Mol. Cell Cardiol. 100, 25–34. doi: 10.1016/j.yjmcc.2016.09.011
Milberg, P., Reinsch, N., Osada, N., Wasmer, K., Monnig, G., Stypmann, J., et al. (2005). Verapamil prevents torsade de pointes by reduction of transmural dispersion of repolarization and suppression of early afterdepolarizations in an intact heart model of LQT3. Basic Res. Cardiol. 100, 365–371. doi: 10.1007/s00395-005-0533-8
Moreno, J. D., Yang, P. C., Bankston, J. R., Grandi, E., Bers, D. M., Kass, R. S., et al. (2013). Ranolazine for congenital and acquired late INa-linked arrhythmias: in silico pharmacological screening. Circ. Res. 113, e50–e61. doi: 10.1161/CIRCRESAHA.113.301971
Moro, C., Hernandez-Madrid, A., and Matia, R. (2010). Non-antiarrhythmic drugs to prevent atrial fibrillation. Am. J. Cardiovasc. Drugs 10, 165–173. doi: 10.2165/11537270-000000000-00000
O’Hara, T., Virag, L., Varro, A., and Rudy, Y. (2011). Simulation of the undiseased human cardiac ventricular action potential: model formulation and experimental validation. PLoS Comput. Biol. 7:e1002061. doi: 10.1371/journal.pcbi.1002061
Okada, J. I., Yoshinaga, T., Kurokawa, J., Washio, T., Furukawa, T., Sawada, K., et al. (2018). Arrhythmic hazard map for a 3D whole-ventricle model under multiple ion channel block. Br. J. Pharmacol. 175, 3435–3452. doi: 10.1111/bph.14357
Potse, M., Dube, B., and Vinet, A. (2009). Cardiac anisotropy in boundary-element models for the electrocardiogram. Med. Biol. Eng. Comput. 47, 719–729. doi: 10.1007/s11517-009-0472-x
Rivolta, M., Sassi, R., Gurev, V., Rice, J., Lopes, C., and Couderc, J. (2017). “Sensitivity analysis of the QT and JTpeak intervals from a high-resolution human left-ventricular wedge model,” in Proceedings of the Conference: 2017 Computing in Cardiology Conference, (Rennes: IEEE),
Ryu, A. J., Lee, K. E., Kwon, S. S., Shin, E. S., and Shim, E. B. (2019). In silico evaluation of the acute occlusion effect of coronary artery on cardiac electrophysiology and the body surface potential map. Korean J. Physiol. Pharmacol. 23, 71–79. doi: 10.4196/kjpp.2019.23.1.71
Sahli Costabal, F., Yao, J., Sher, A., and Kuhl, E. (2019). Predicting critical drug concentrations and torsadogenic risk using a multiscale exposure-response simulator. Prog. Biophys. Mol. Biol. 144, 61–76. doi: 10.1016/j.pbiomolbio.2018.10.003
Thomas, S. H., and Behr, E. R. (2016). Pharmacological treatment of acquired QT prolongation and torsades de pointes. Br. J. Clin. Pharmacol. 81, 420–427. doi: 10.1111/bcp.12726
Tisdale, J. E. (2016). Drug-induced QT interval prolongation and torsades de pointes: role of the pharmacist in risk assessment, prevention and management. Can. Pharm. J. 149, 139–152. doi: 10.1177/1715163516641136
Trudel, M. C., Dube, B., Potse, M., Gulrajani, R. M., and Leon, L. J. (2004). Simulation of QRST integral maps with a membrane-based computer heart model employing parallel processing. IEEE Trans. Biomed. Eng. 51, 1319–1329. doi: 10.1109/tbme.2004.827934
Vicente, J., Johannesen, L., Mason, J. W., Crumb, W. J., Pueyo, E., Stockbridge, N., et al. (2015). Comprehensive T wave morphology assessment in a randomized clinical study of dofetilide, quinidine, ranolazine, and verapamil. J. Am. Heart Assoc. 4:e001615. doi: 10.1161/JAHA.114.001615
Vicente, J., Zusterzeel, R., Johannesen, L., Mason, J., Sager, P., Patel, V., et al. (2018). Mechanistic model-informed proarrhythmic risk assessment of drugs: review of the “CiPA” initiative and design of a prospective clinical validation study. Clin. Pharmacol. Ther. 103, 54–66. doi: 10.1002/cpt.896
Wallis, R., Benson, C., Darpo, B., Gintant, G., Kanda, Y., Prasad, K., et al. (2018). CiPA challenges and opportunities from a non-clinical, clinical and regulatory perspectives. An overview of the safety pharmacology scientific discussion. J. Pharmacol. Toxicol. Methods 93, 15–25. doi: 10.1016/j.vascn.2018.06.005
Zemzemi, N., Bernabeu, M. O., Saiz, J., Cooper, J., Pathmanathan, P., Mirams, G. R., et al. (2013). Computational assessment of drug-induced effects on the electrocardiogram: from ion channel to body surface potentials. Br. J. Pharmacol. 168, 718–733. doi: 10.1111/j.1476-5381.2012.02200.x
Keywords: 3D heart model, ECG simulation, hERG, QT, torsade de pointes
Citation: Hwang M, Han S, Park MC, Leem CH, Shim EB and Yim D-S (2019) Three-Dimensional Heart Model-Based Screening of Proarrhythmic Potential by in silico Simulation of Action Potential and Electrocardiograms. Front. Physiol. 10:1139. doi: 10.3389/fphys.2019.01139
Received: 16 April 2019; Accepted: 20 August 2019;
Published: 04 September 2019.
Edited by:
Ahsan H. Khandoker, Khalifa University, United Arab EmiratesReviewed by:
Gary Richard Mirams, University of Nottingham, United KingdomCopyright © 2019 Hwang, Han, Park, Leem, Shim and Yim. This is an open-access article distributed under the terms of the Creative Commons Attribution License (CC BY). The use, distribution or reproduction in other forums is permitted, provided the original author(s) and the copyright owner(s) are credited and that the original publication in this journal is cited, in accordance with accepted academic practice. No use, distribution or reproduction is permitted which does not comply with these terms.
*Correspondence: Eun Bo Shim, ZWJzaGltQGthbmd3b24uYWMua3I=; Dong-Seok Yim, eWltZHNAY2F0aG9saWMuYWMua3I=
Disclaimer: All claims expressed in this article are solely those of the authors and do not necessarily represent those of their affiliated organizations, or those of the publisher, the editors and the reviewers. Any product that may be evaluated in this article or claim that may be made by its manufacturer is not guaranteed or endorsed by the publisher.
Research integrity at Frontiers
Learn more about the work of our research integrity team to safeguard the quality of each article we publish.