- 1Faculty of Sports Science, Ningbo University, Ningbo, China
- 2Research Academy of Grand Health, Ningbo University, Ningbo, China
- 3Auckland Bioengineering Institute, University of Auckland, Auckland, New Zealand
- 4Institute for Clinical Exercise and Health Science, University of the West of Scotland, Paisley, United Kingdom
- 5Department of Engineering Science, University of Auckland, Auckland, New Zealand
This study presents an investigation of the changes in foot posture, joint kinematics, joint moments and joint contact forces in the lower extremity following a 5 k treadmill run. A relationship between knee and ankle joint loading and foot posture index (FPI) is developed. Twenty recreational male heel-strike runners participated in this study. All participants had a history of running exercise and were free from lower extremity injuries and foot deformities. Foot posture was assessed from a six-item FPI to quantitatively classify high supination to high pronation foot poses. The FPI is scored using a combination of observations and foot palpations. The three-dimensional marker trajectories, ground reaction force and surface electromyography (EMG) were recorded at pre and post-gait sessions conducted over-ground and 5 k running was conducted on a treadmill. Joint kinematics, joint moments and joint contact forces were computed in OpenSim. Simulated EMG activations were compared against experimental EMG to validate the model. A paired sample t-test was conducted using a 1D statistical parametric mapping method computed temporally. Hip joint moments and contact forces increased during initial foot contact following 5 k running. Knee abduction moment and superior-inferior knee contact force increased, whereas the knee extension moment decreased. Ankle plantarflexion moment and ankle contact forces increased during stance. FPI was found to be moderately correlated with peak knee and ankle moments. Recreational male runners presented increased static foot pronation after 5 k treadmill running. These findings suggest that following mid distance running foot pronation may be an early indicator of increased lower limb joint loading. Furthermore, the FPI may be used to quantify the changes in knee and ankle joint moments.
Introduction
Long distance running has increased in popularity (van Gent et al., 2007; Hulme et al., 2017) due to practicality in many environments, low cost, and links to preventing health issues (Mei et al., 2018). Extensive running participation may lead to increased running-related injuries (RRI) reported as 2.5–33.0 injuries per 1000 h of running (Videbæk et al., 2015; Hulme et al., 2017) with up to 79.3% RRI reported at the knee joint (van Gent et al., 2007). The human foot, as the primary interface with our environment, presents morphological and postural changes following prolonged running, which is a key intrinsic factor contributing to RRI (Barnes et al., 2008; Nigg, 2011; Nigg et al., 2015; Mei et al., 2018). A 6-item scale (foot posture index, FPI) was previously developed and validated to define foot postures including high supination, supination, neutral, pronation and high pronation in multiple planes and anatomical segments under static palpation measurements and clinical settings (Redmond et al., 2006). This FPI may play a role as a low-cost assessment of foot postures without requiring a lab or imaging evaluation.
Over 90% of recreational marathon runners adopt a heel-strike style (Larson et al., 2011). This is associated with a drop in foot arch following long distance running (Mei et al., 2018), which is consistent with a recent finding reporting reduced arch ratio and foot pronation (Fukano et al., 2018). A recent study reported that competitive runners exhibited higher local dynamic foot stability quantified by the “Maximal Lyapunov Exponent” compared with recreational runners during an exhaustive 5 k run (Hoenig et al., 2019). A high-intensity treadmill run exhibited symmetry in step length, step frequency, contact time, flight time, maximum force and impulse but asymmetry in impact force (at 5 k), and flight time together with impact force (at 7.5–10 k) (Hanley and Tucker, 2018). Skeletal joint work shifted proximally from the ankle to the knee and hip joints reducing long distance running economy (Sanno et al., 2018).
Foot pronation and joint impact forces have been proposed as predictors of RRI (Nigg, 2011; Brund et al., 2017). Gait retraining programs (Bowser et al., 2018) and real time feedback studies (Yong et al., 2018) evaluated potential factors contributing to impact RRI, such as peak tibial shock (peak vertical acceleration), and average and peak loading rates. Conflicting opinions concerning foot pronation as a risk factor has reported for neutral shoes (Nielsen et al., 2014), and standard versus motion control shoes (Malisoux et al., 2016). The contradicting results may be explained in part by different runners’ experience, running footwear preferences, and different study designs. Bertelsen et al. (2017) proposed a framework to analyze the etiology of RRI, whereby cumulative load exceeding a maximum load capacity would trigger injury. Studies have revealed alterations in gait symmetry, joint stability and power contribution in competitive long distance runners (Hanley and Tucker, 2018; Sanno et al., 2018; Hoenig et al., 2019). The literature presents multiple factors contributing to RRI in competitive athletes, however, few studies consider the effects on recreational runners, who are the majority of the running population (Knechtle et al., 2018; Vitti et al., 2019). Foot pronation has been reported as a predictor of altered joint kinetics and running related injuries (Nigg, 2011; Brund et al., 2017), however, a quantitative measure between the clinical FPI (a score that measures pronation) and joint kinetics has not been presented to date.
Thus, the aim of this study was to investigate the changes of foot posture, joint kinematics, joint moments and joint contact forces in the lower extremity following a 5 k treadmill run in recreational runners. We present the FPI and its relation to lower limb kinetics pre and post-5 k running. It is hypothesized that (1) joint kinematics, joint moments and joint contact forces in the lower extremity will change post-5 k running, and (2) the FPI will quantify changes in joint kinetics following mid distance running.
Materials and Methods
Participants
Twenty recreational male heel strike runners (25.8 ± 1.6 years, 67.8 ± 5.3 kg, 1.73 ± 0.05 m) participated in this study, consistent with previous running studies (Hanley and Tucker, 2018; Sanno et al., 2018; Hoenig et al., 2019). The inclusion criteria was participants would have over ground or treadmill running history with an average distance of 30 km per week and preference using typical running shoes. Participants were free from lower extremity disorders and injuries. Foot deformities, such as hallux valgus, over pronation or supination, pes planus, and pes cavus, were excluded during recruitment. Written consent was obtained prior to the test. Ethics was approved from the Human Ethics Committee at Ningbo University (RAGH20161208).
Experimental Protocol
Baseline data (pre 5 k run) were collected with the participant standing barefoot (static) followed by running barefoot on the over ground runway at their self-selected speed. This included a static foot posture assessment, static marker positions, dynamic marker trajectories, ground reaction force and surface electromyography (EMG). The assessment of foot posture was performed following the established FPI (Redmond et al., 2006), including six observations from the (1) talar palpation, (2) malleoli, (3) inversion/eversion of calcaneus in the rearfoot, (4) talonavicular joint, (5) medial longitudinal arch, and (6) forefoot abduction/adduction to define foot postures in multiple planes and anatomical segments. An eight-camera motion capture system (Vicon Metrics Ltd., Oxford, United Kingdom) was used to track the marker trajectories at 200 Hz, and an in-ground force plate (AMTI, Watertown, MA, United States) was utilized to record the ground reaction force at 1000 Hz. The force plate was located in the middle of an over ground runway. A 37-marker set was used for all participants during the test, which has been validated in previous studies (Hamner and Delp, 2013; Rajagopal et al., 2016). Surface electromyography (EMG) signals were recorded via a EMG system (Delsys, Boston, MA, United States) for muscle activities, including rectus femoris (RF), vastus lateralis (VL), vastus medialis (VM), biceps femoris (BF), semitendinosus (ST), tibialis anterior (TA), medial gastrocnemius (MG), and lateral gastrocnemius (LG).
After warm-up and lab familiarization, the FPI was evaluated and recorded as scores (from -2 to 2 per item). The total score would be classed as high supination (-12), supination (-5), neutral (0), pronation (5), and high pronation (12) while static barefoot standing with shoulders’ width apart (Redmond et al., 2006). Data of marker trajectories and ground reaction force from two static and five running trials were collected of the right foot striking the force plate. After the baseline test, participants ran 5 k on the treadmill at their self-selected speed (which were recorded in the range of 10–12 km/h) using participants’ own typical running shoes. This was not chosen to elicit fatigue but elicit submaximal effort (Hanley and Tucker, 2018). The post-5 k test started within 5 min of finishing the treadmill run, following the same protocols as the baseline test (with participants barefoot).
Musculoskeletal Model
An updated version of the original OpenSim musculoskeletal model (Delp et al., 2007), which included the patella (DeMers et al., 2014), was used for this study. This model included the torso and lower extremity, which had six degrees of freedom at the pelvis, a ball-and-socket joint with three degrees of freedom at the hip, pin joints at the ankle, subtalar and metatarsophalangeal joints. A non-frictional patella articulated with the femur and prescribed by the knee angle was also added to direct the quadriceps force, wrapping around the patella and attaching to the tibial tuberosity (DeMers et al., 2014). The default model included a hinge joint for flexion-extension of the knee, and was extended to include abduction-adduction motion based on a previous study (Meireles et al., 2017).
Data processing was performed in OpenSim v3.3 as per the established workflow (Delp et al., 2007). Marker trajectories and ground reaction forces were low pass filtered at 6 Hz with a zero-phase fourth order Butterworth filter. The model was firstly scaled to each participant’s anthropometric measures collected from static marker positions and body mass. Muscle insertion points and moment arms were scaled to match each participants’ segment lengths (DeMers et al., 2014). The “Inverse kinematics” (IK) algorithm minimized errors between virtual markers in the model and experimental marker trajectories to compute joint angles, and “Inverse Dynamics” (ID) was performed to compute joints moment (Delp et al., 2007).
Muscle forces were previously reported as the main factors affecting joint contact forces (DeMers et al., 2014; Lerner et al., 2015; Lerner and Browning, 2016). The “Static Optimization” (SO) with weighted factors was employed to compute muscle activation and forces, which improves the accuracy of joint contact force prediction (DeMers et al., 2014; Lerner and Browning, 2016). Following previously established protocols to reduce prediction errors (Lerner et al., 2015; Lerner and Browning, 2016), the weighting factors for muscles were set at 1.5 for the gastrocnemius, 2 for the hamstrings and 1 for other muscles in this study. The contact forces to the hip, knee and ankle joints in the anterior/posterior (x), superior/inferior (y), and medial/lateral (z) directions were computed using “Joint Reaction” (JR) analysis for the femur, tibia and talus, respectively.
Model Validation
Muscle electromyography (EMG) signals were used to validate model-simulated muscle activations (Supplementary Material 1), which included the rectus femoris (RF), vastus lateralis (VL), vastus medialis (VM), biceps femoris (BF), semitendinosus (ST), tibialis anterior (TA), medial gastrocnemius (MG), and lateral gastrocnemius (LG). Joint kinematics, joint kinetics, and joint contact force were compared with previous literature.
Data and Statistical Analysis
A simulation of stance phase from right heel strike to toe off was analyzed in this study. Variables included FPI scores, joint angles, joint moments and joint contact force in the anterior/posterior (ant-post) (x), superior/inferior (sup-inf) (y), and medial/lateral (med-lat) (z) directions during pre-5 k and post-5 k tests. For the time sequential kinematics, kinetics and contact force data, raw data from five trials of each participant were interpolated to 50 in data length to represent stance, and averaged for each participant for statistics. The joint moments (flexion/extension, adduction/abduction, and internal/external rotation moments of the hip, flexion/extension and adduction/abduction moments of the knee, dorsi/plantar flexion moment of the ankle, inversion/eversion moment of subtalar) and contact forces were normalized to body mass (Nm/kg) for moments and body weight (xBW) for contact forces, respectively. Peak values of joint moments and joint contact forces were selected for statistics. Previously published studies concerning knee sup-inf contact force showed similar patterns with vertical ground reaction force (Steele et al., 2012; Gerus et al., 2013; Knarr and Higginson, 2015), thus this study calculated the vertical instantaneous loading rate (VILR) (unit: xBW/%stance) of sup-inf knee contact force using an established protocol (Ueda et al., 2016), to provide extra loading information to the knee joint. Stance was divided into three sub-phases as per previous studies (Novacheck and Tom, 1998; Dugan and Bhat, 2005), including initial contact (0∼50%), mid stance (∼50%∼), and push off (50∼100%).
Data normality was checked prior to statistical analysis. A paired sample t-test was performed to analyze the difference in FPI scores, running speed, contact times, peak joint moments and joint contact forces. Due to the one-dimensional (1D) time-varying characteristics of joint kinematics, joint moments and joint contact force (Pataky, 2010; Pataky et al., 2015), the open source Statistical Parametric Mapping 1D package (SPM1D), which relies on Random Vector Field theory to account for data variability, was utilized for the statistical analysis. All statistical analyses were performed in MATLAB R2018a (The MathWorks, MA, United States), with significance level set at p < 0.05.
Results
Foot Posture and Gait Parameter Changes
The FPI scores measured pre-5 k and post-5 k running showed significant increase toward pronation. The pre and post-5 k running speeds measured during the gait test were found to be ∼3.1 m/s on average. Participants were instructed to run 5 k at their self-selected speed, and actual speeds were recorded in the range of 10–12 km/h (2.8–3.3 m/s), with completion time between 25.3 and 29.7 min. A statistically significant increase of running speed was observed post-5 k running but stance times remained unchanged (Table 1).
Hip Joint
At the hip joint during post-5 k running, external rotation angle increased at 0–10% (p = 0.048) (Figure 1) and rotation moment increased at 10%–20% (p < 0.001) and 26%–28% (p = 0.027) (Figure 2C). Increased extension moment was observed across stance at 6% (p = 0.050), 14% (p = 0.050) and 24%–50% (p < 0.001) (Figure 2A). Abduction moment increased at 12%–20% (p < 0.001), 24%–30% (p = 0.001), and 36%–52% (p < 0.001), respectively (Figure 2B). The contact force increased in the ant-post-direction at 22–28% (p = 0.001) (Figure 3A), in the med-lat direction at 16–28% (p < 0.001) (Figure 3B), and in the sup-inf direction at 48–52% (p = 0.009) (Figure 3C). Peak hip moments and contact force are presented (Table 2), with increased peak hip extension moment (p = 0.024) and abduction moment (p < 0.001), and peak hip contact force in the ant-post (p = 0.001), med-lat (p < 0.001), and sup-inf (p = 0.002) directions during post-5 k running.
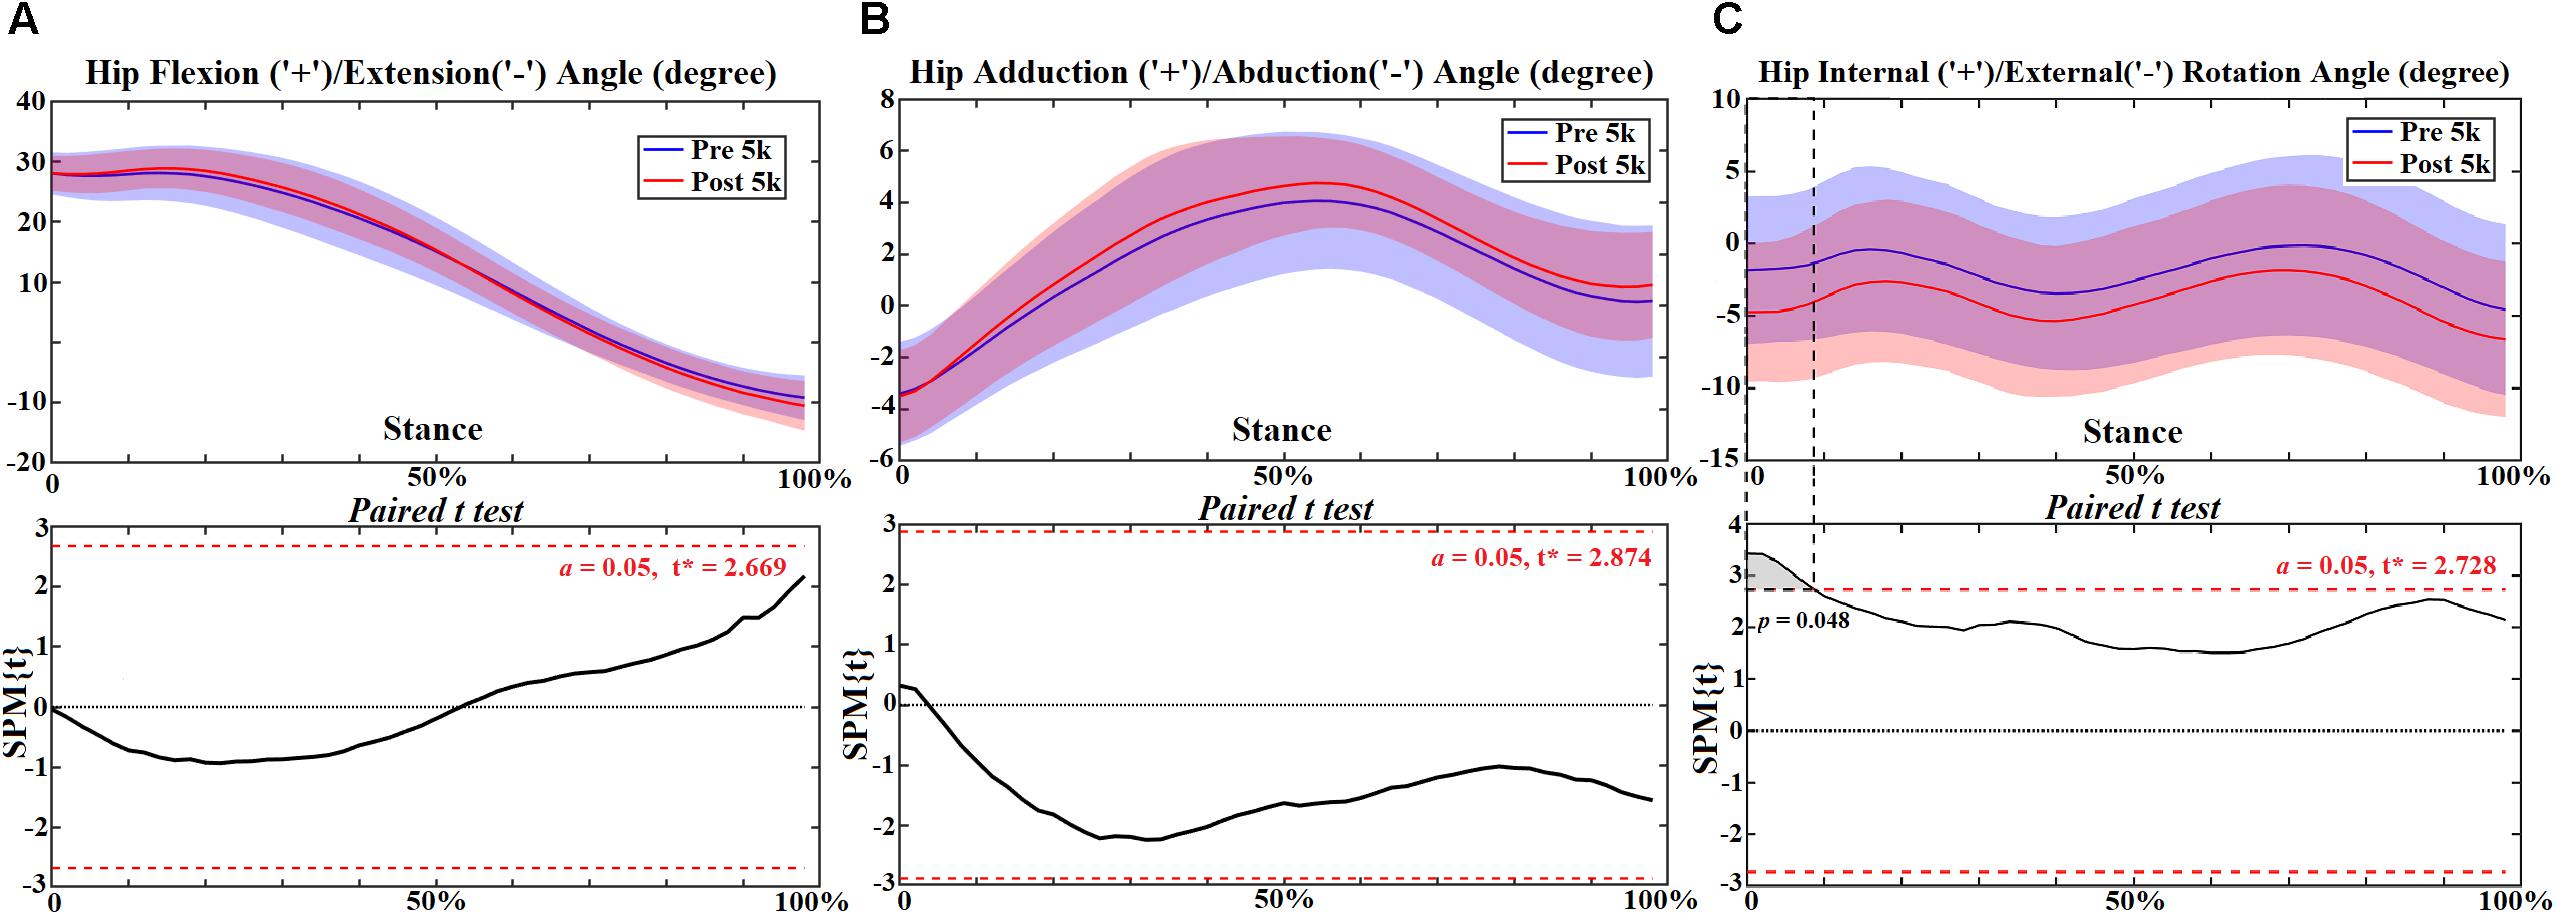
Figure 1. The hip joint angles (A–C) during stance with statistics (spm{t}) from spm1d (“+” and “-” represent directions).
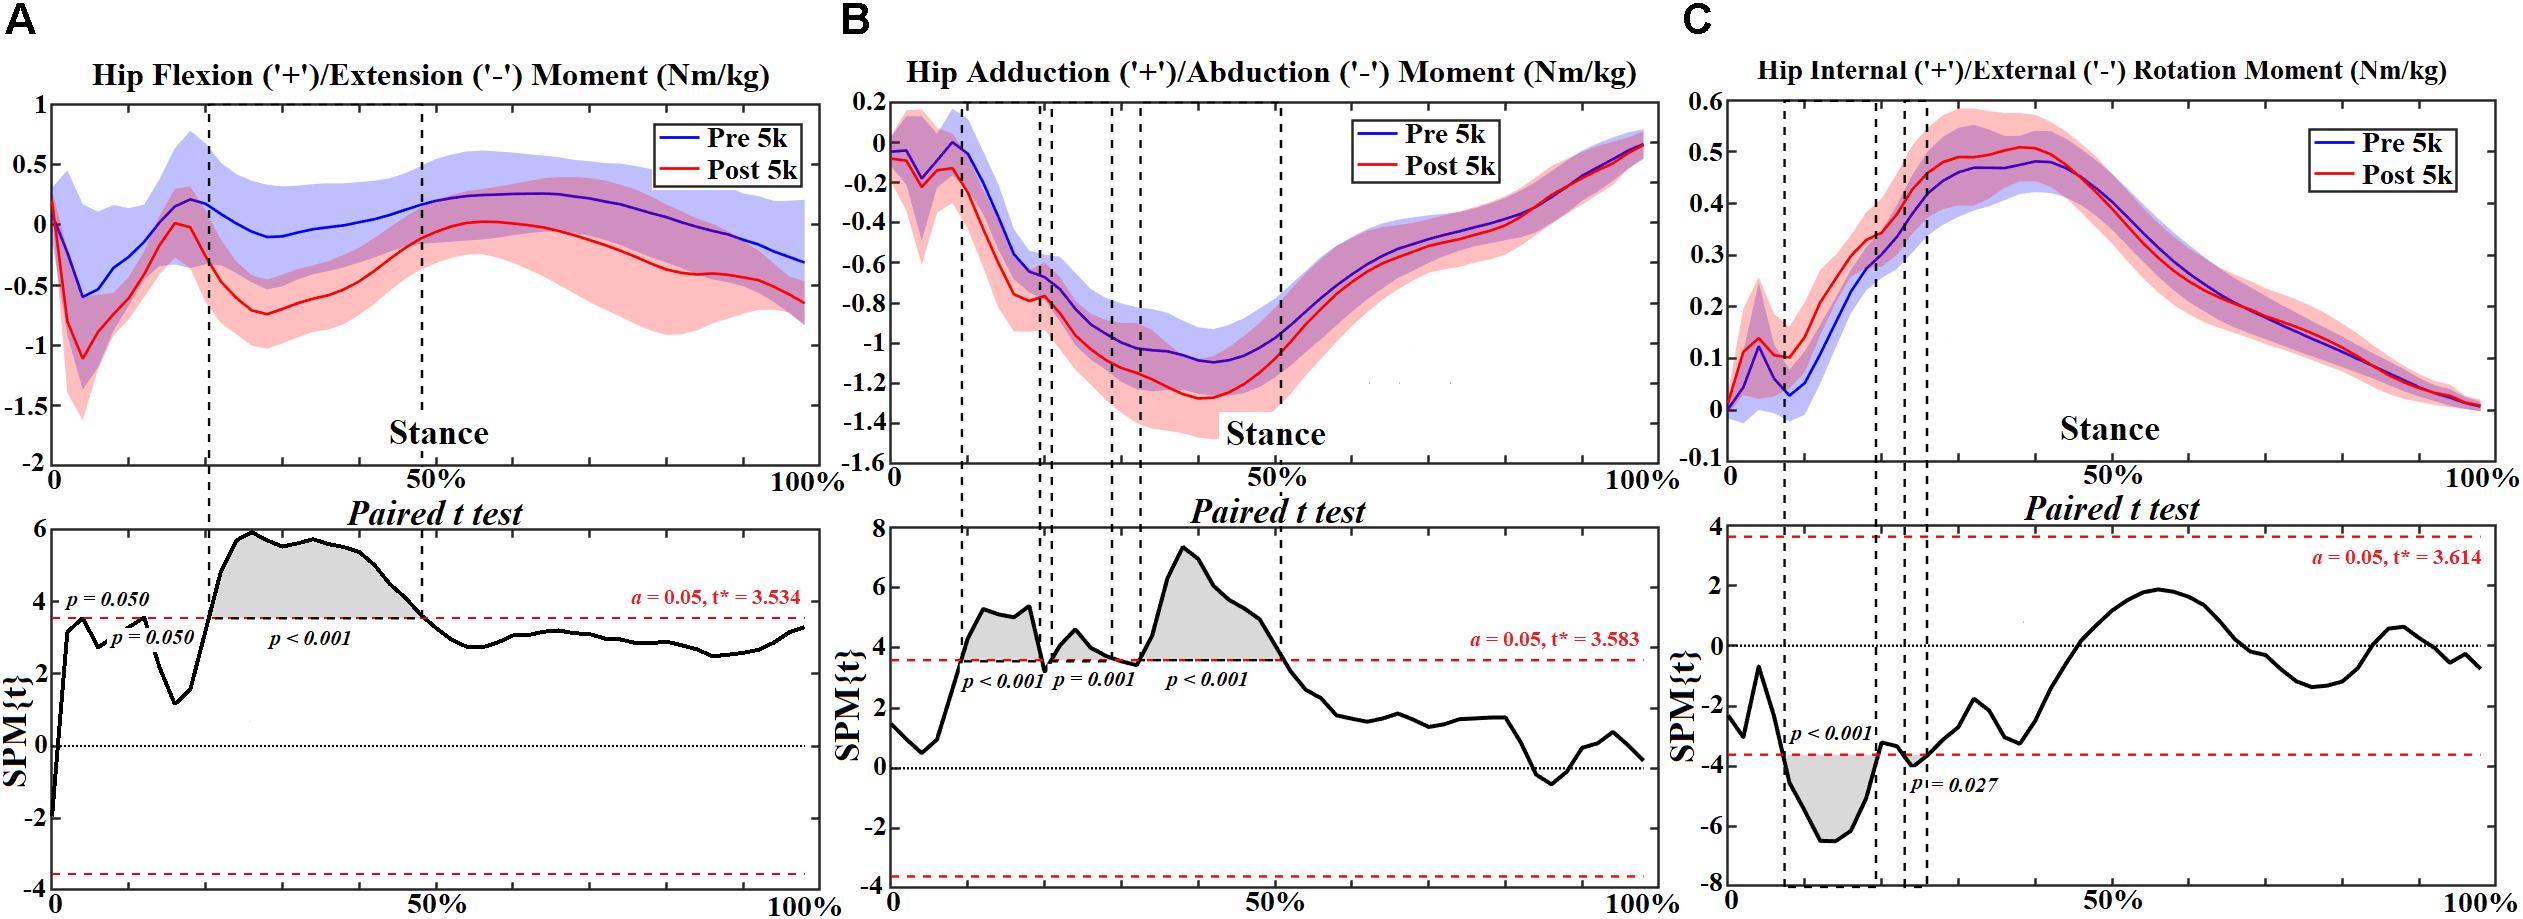
Figure 2. The hip moments (A–C) during stance with statistics (spm{t}) from spm1d (“+” and “-” represent directions).
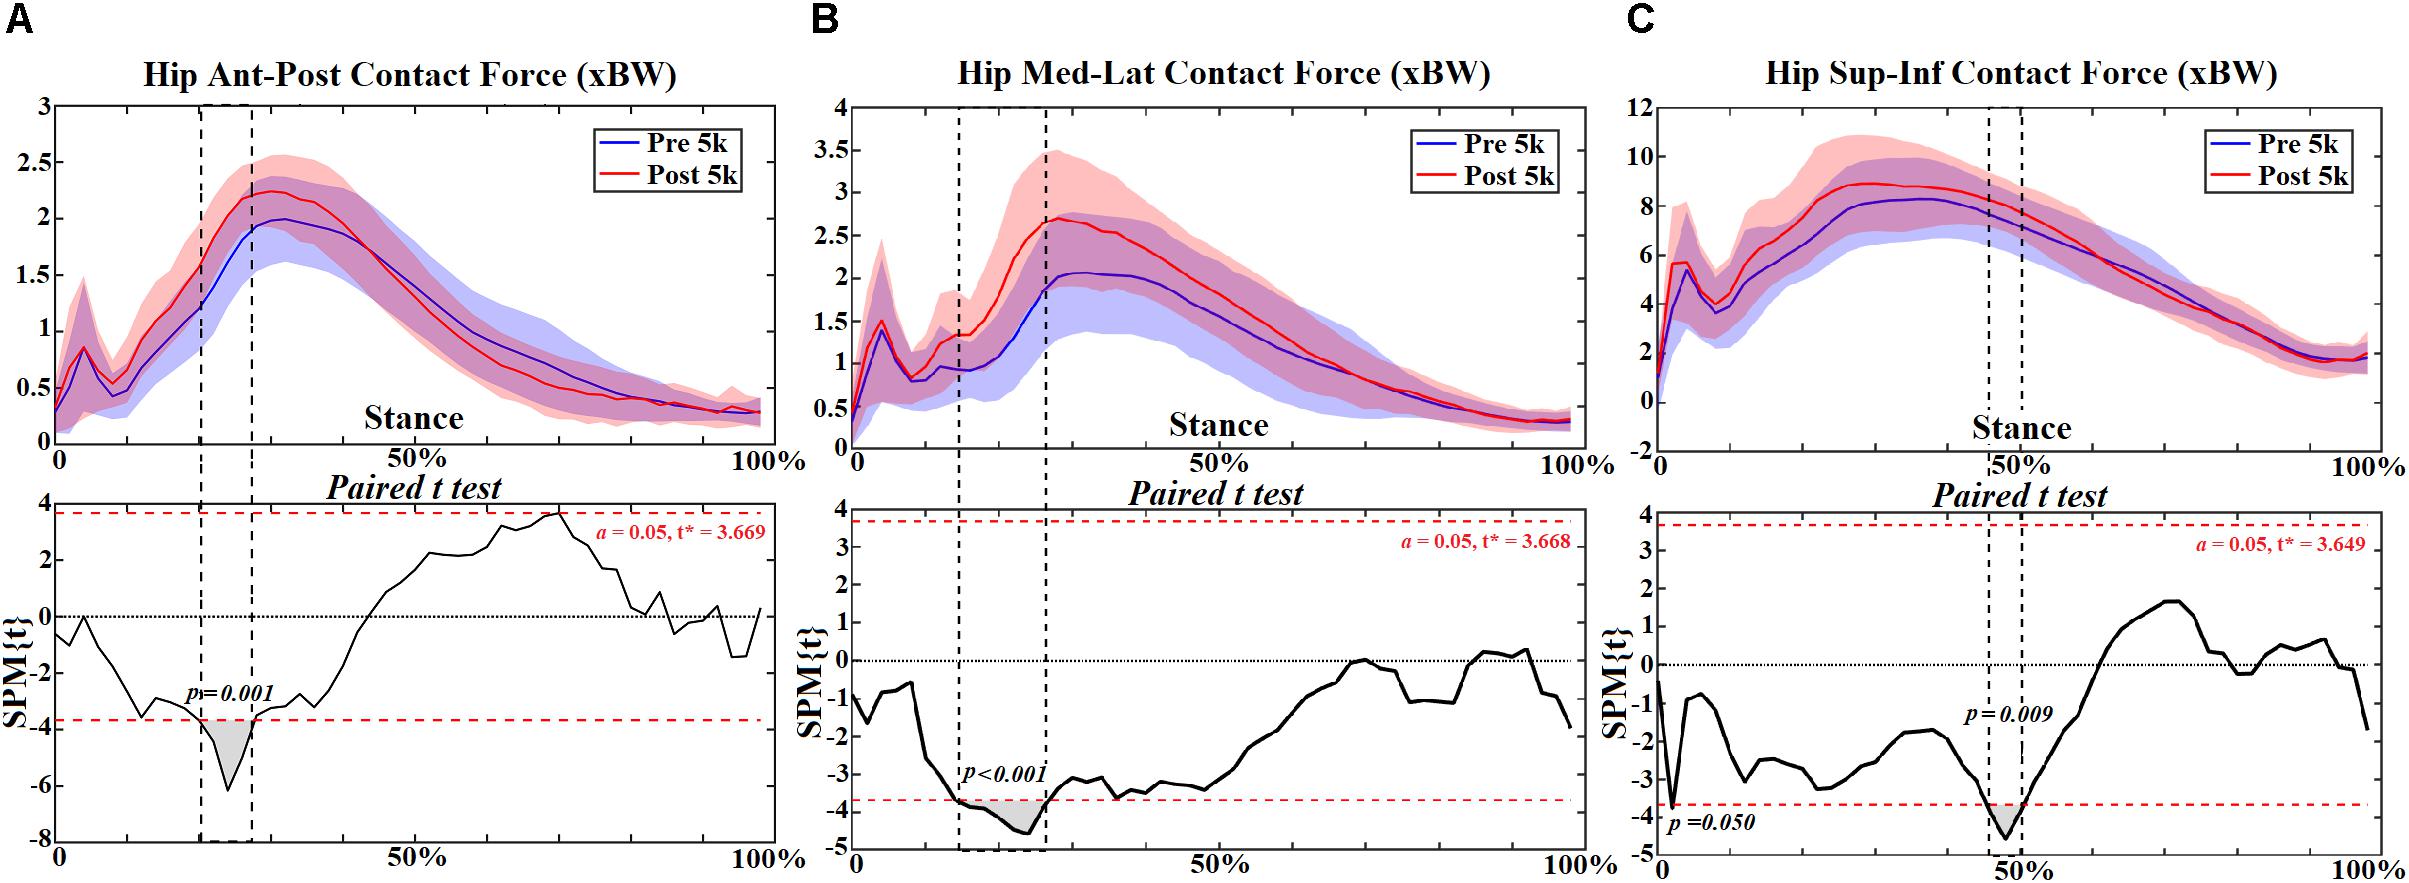
Figure 3. The hip contact forces (A–C) during stance with statistics (spm{t}) from spm1d (“+” and “-” represent directions).

Table 2. The peak hip moments and joint contact forces in the ant-post, med-lat, and sup-inf directions during stance (Mean ± SD [95% Confidence Interval]).
Knee Joint
At the knee joint, flexion angle showed no change (Figure 4A) but adduction reduced at 12–14% (p = 0.050) of stance (Figure 4B). However, reduced extension moment was observed at 22–24% (p = 0.031) and 36–96% (p < 0.001) (Figure 5A). Increased knee abduction moment was observed at 12–20% (p = 0.002) and 26% (p = 0.044) during initial contact, and at 74–88% (p < 0.001) and 92–96% (p = 0.017) during push off, respectively (Figure 5B). The knee contact force increased during mid stance (46–58%, p < 0.001) in the sup-inf direction (Figure 6C) but no significance in other directions (Figures 6A,B). Table 3 presents the peak knee joint extension (p = 0.001) and abduction (p = 0.002) moments, and the VILR (p < 0.001) and peak values of sup-inf (p = 0.005) knee contact force.
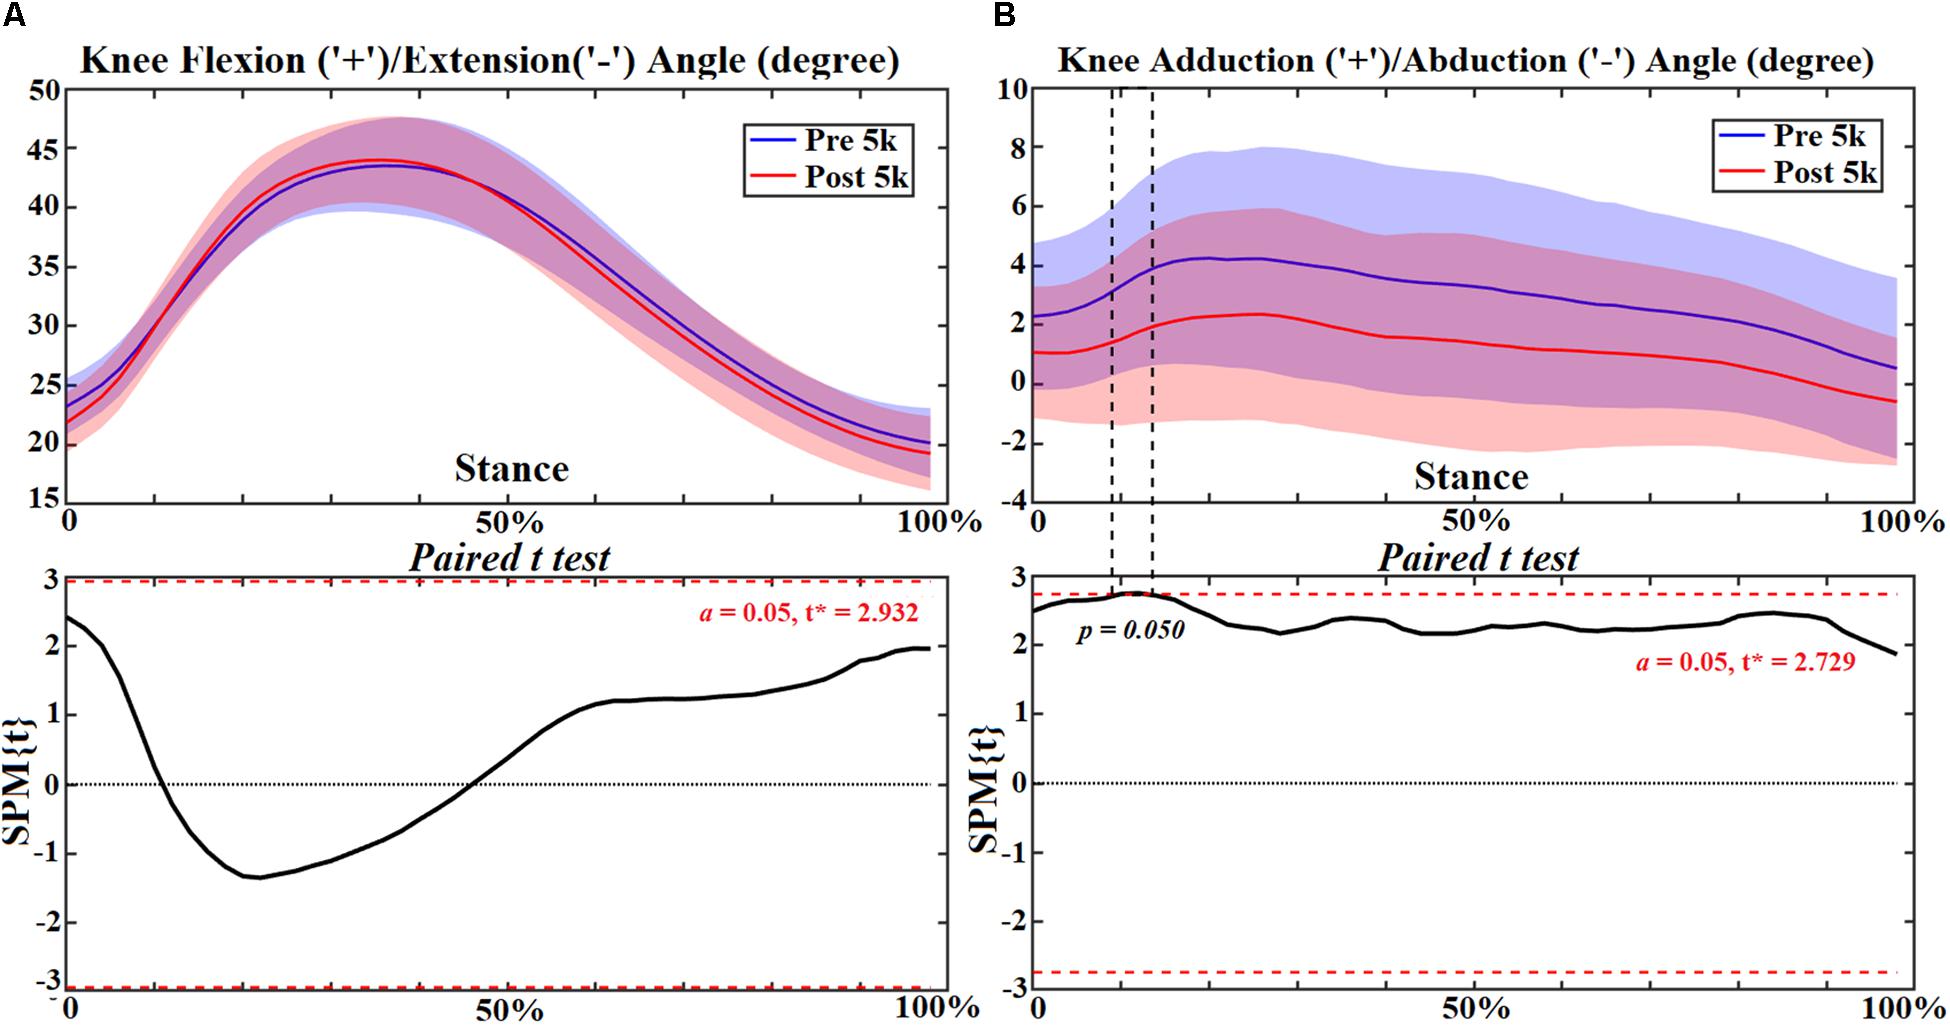
Figure 4. The knee joint angles (A,B) during stance with statistics (spm{t}) from spm1d (“+” and “-” represent directions).
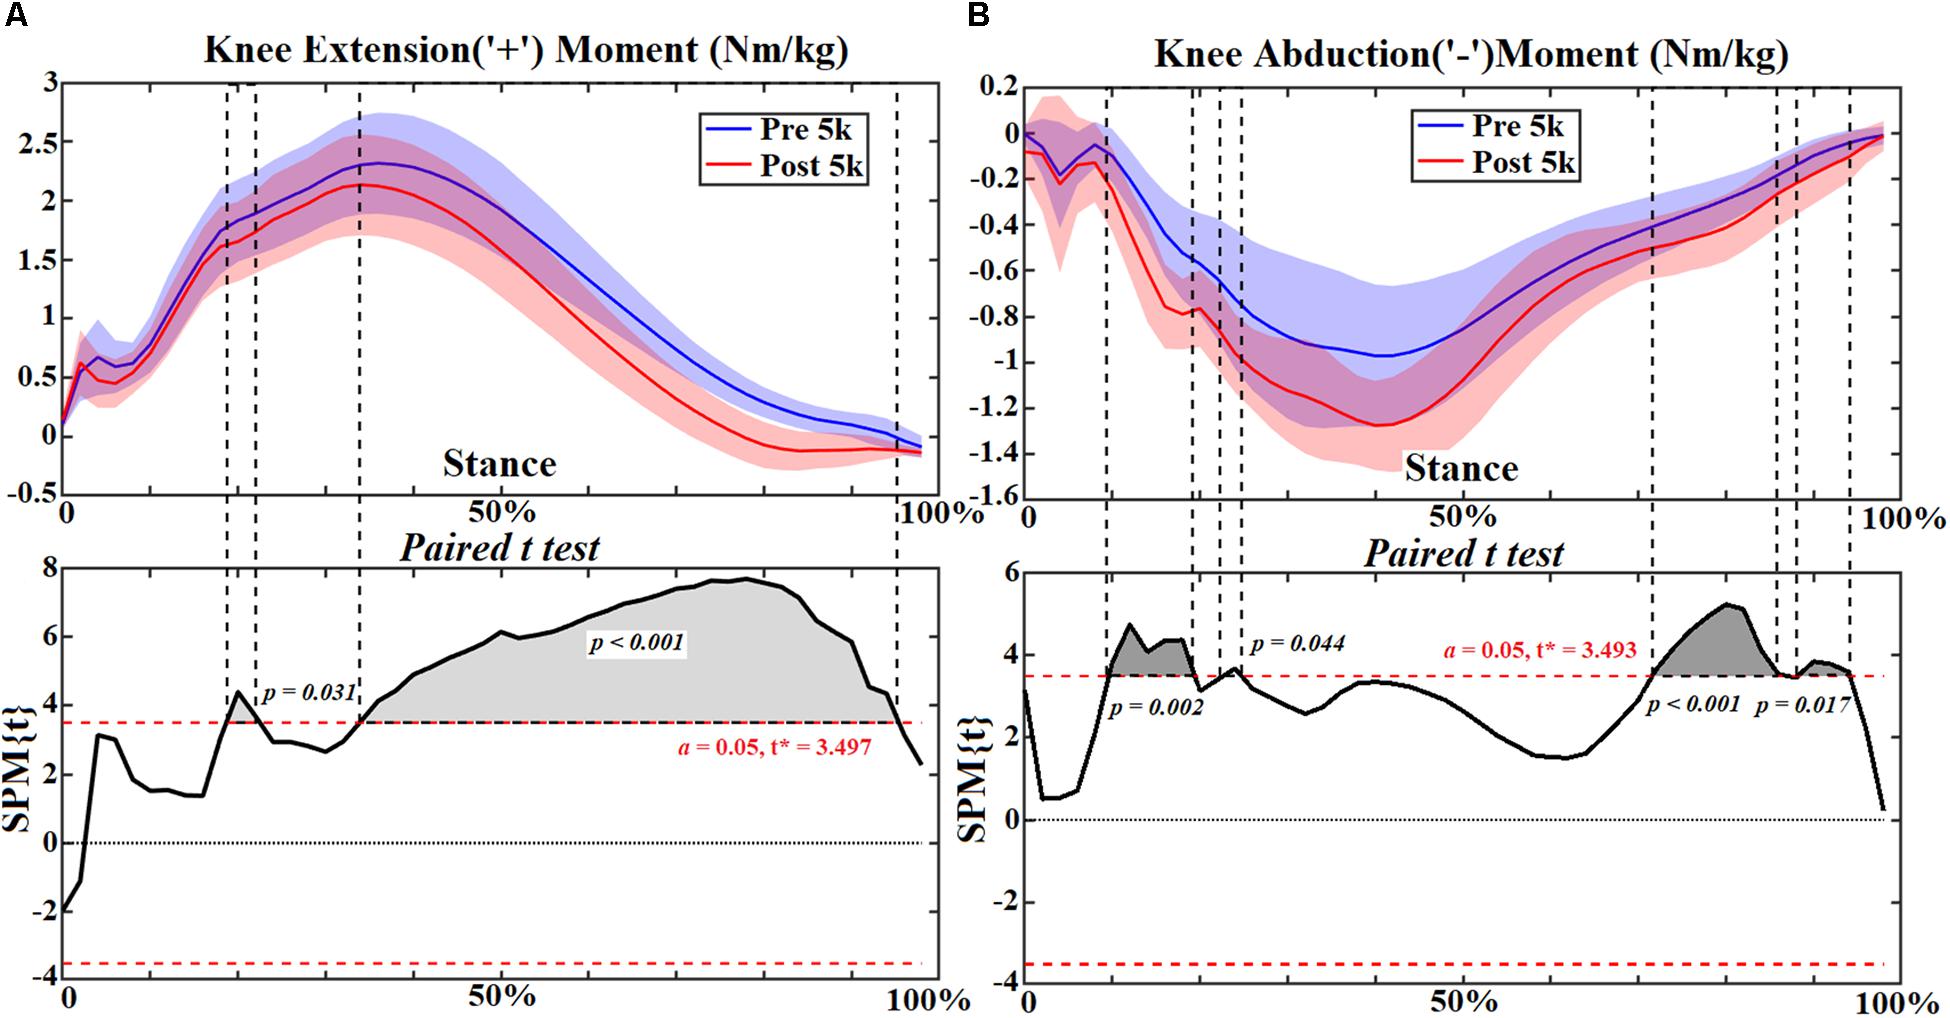
Figure 5. The knee joint moments (A,B) during stance with statistics (spm{t}) from spm1d (“+” and “-” represent directions).
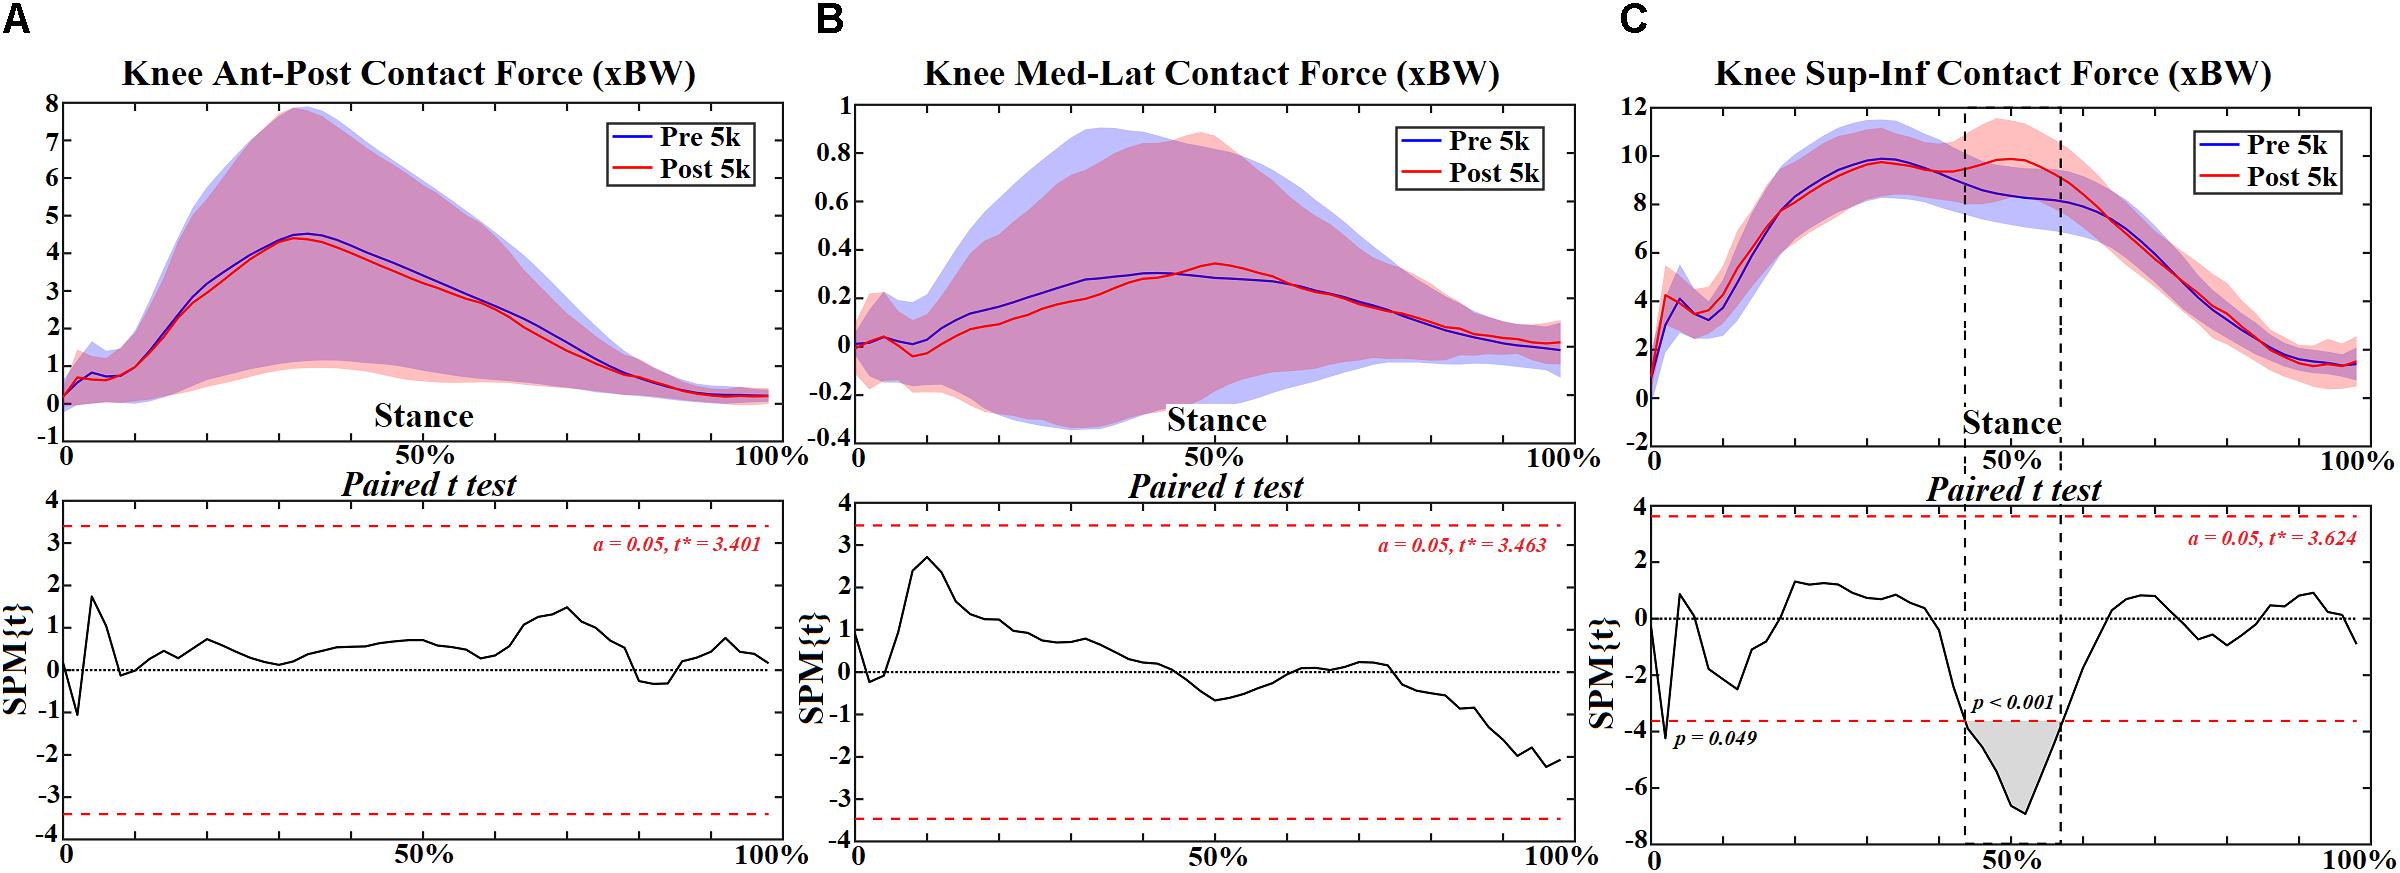
Figure 6. The knee joint contact forces (A–C) during stance with statistics (spm{t}) from spm1d (“+” and “-” represent directions).

Table 3. The peak knee moments and joint contact forces in the ant-post, med-lat, and sup-inf directions (Mean ± SD [95% Confidence Interval]).
Correlation between FPI scores pre-5 k and post-5 k with peak knee flexion moment, peak knee abduction moment and VILR are presented in Figure 7. There was a moderate correlation between FPI and peak knee flexion moment (0.35–0.47), during pre- and post-5 k treadmill running (Figure 7A). The correlation between FPI and peak knee abduction moment was also moderate (0.39–0.44), during pre and post-5 k (Figure 7B). Interestingly, the correlation between FPI and VILR was only moderate post-5 k (0.39) (Figure 7C).

Figure 7. The correlation of peak knee joint loadings (A, flexion moment; B, abduction moment; C, vertical loading rate) with FPI.
Ankle Joint
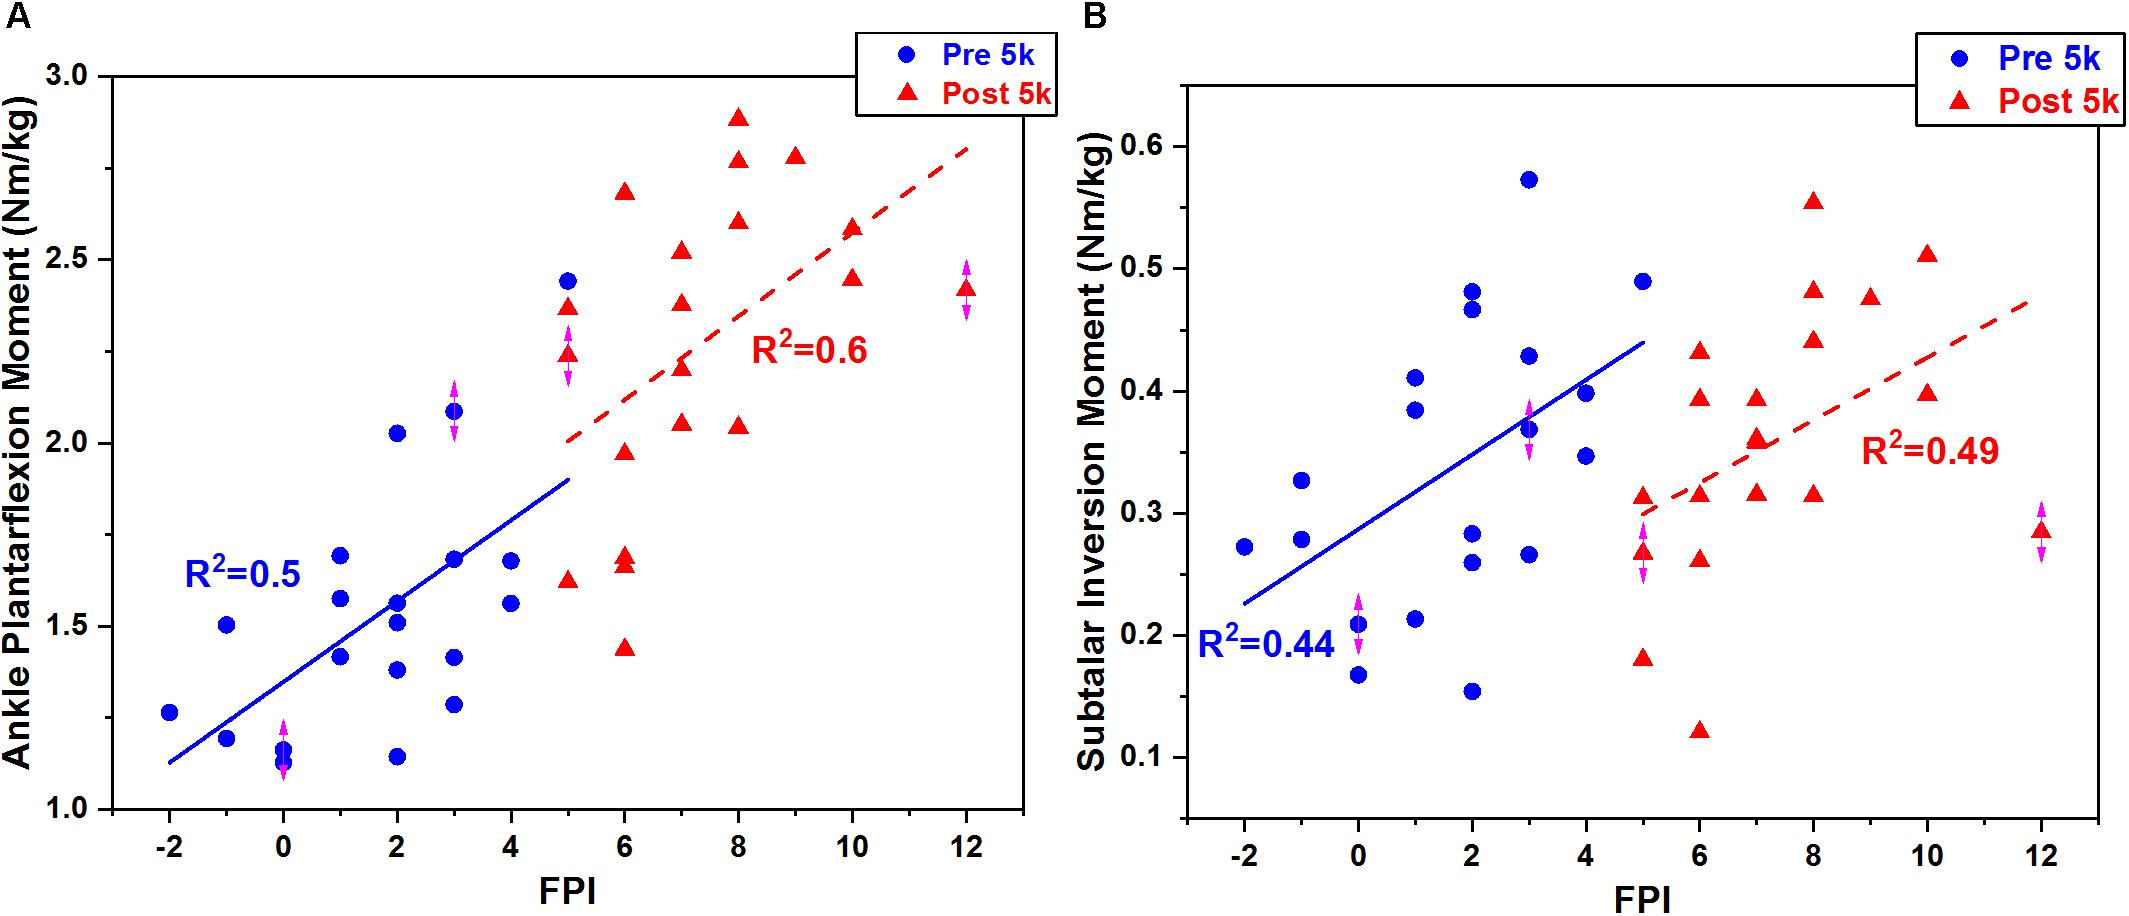
At the ankle joint increased plantarflexion was observed during push off at 80–92% (p = 0.030) (Figure 8A), and the plantarflexion moment increased at 6–98% (p < 0.001) during stance (Figure 9A). However, the subtalar joint eversion angle (Figure 8B) and subtalar moment (Figure 9B) showed no change. The ankle contact force in the ant-post direction increased at 6%-48% (p < 0.001) but decreased at 76–82% (p = 0.011) (Figure 10A). The med-lat ankle contact force decreased at 28–44% (p < 0.001) (Figure 10B). The sup-inf ankle contact force increased at 20–64% (p < 0.001) and 72–86% (p < 0.001) (Figure 10C), respectively. Table 4 presents the peak ankle plantarflexion moment (p < 0.001), ankle contact force in the ant-post (p < 0.001) and sup-inf (p < 0.001) directions. The correlations between FPI and peak ankle moment (0.5–0.6) and subtalar moment (0.44–0.49) were moderate in both cases (Figures 11A,B).
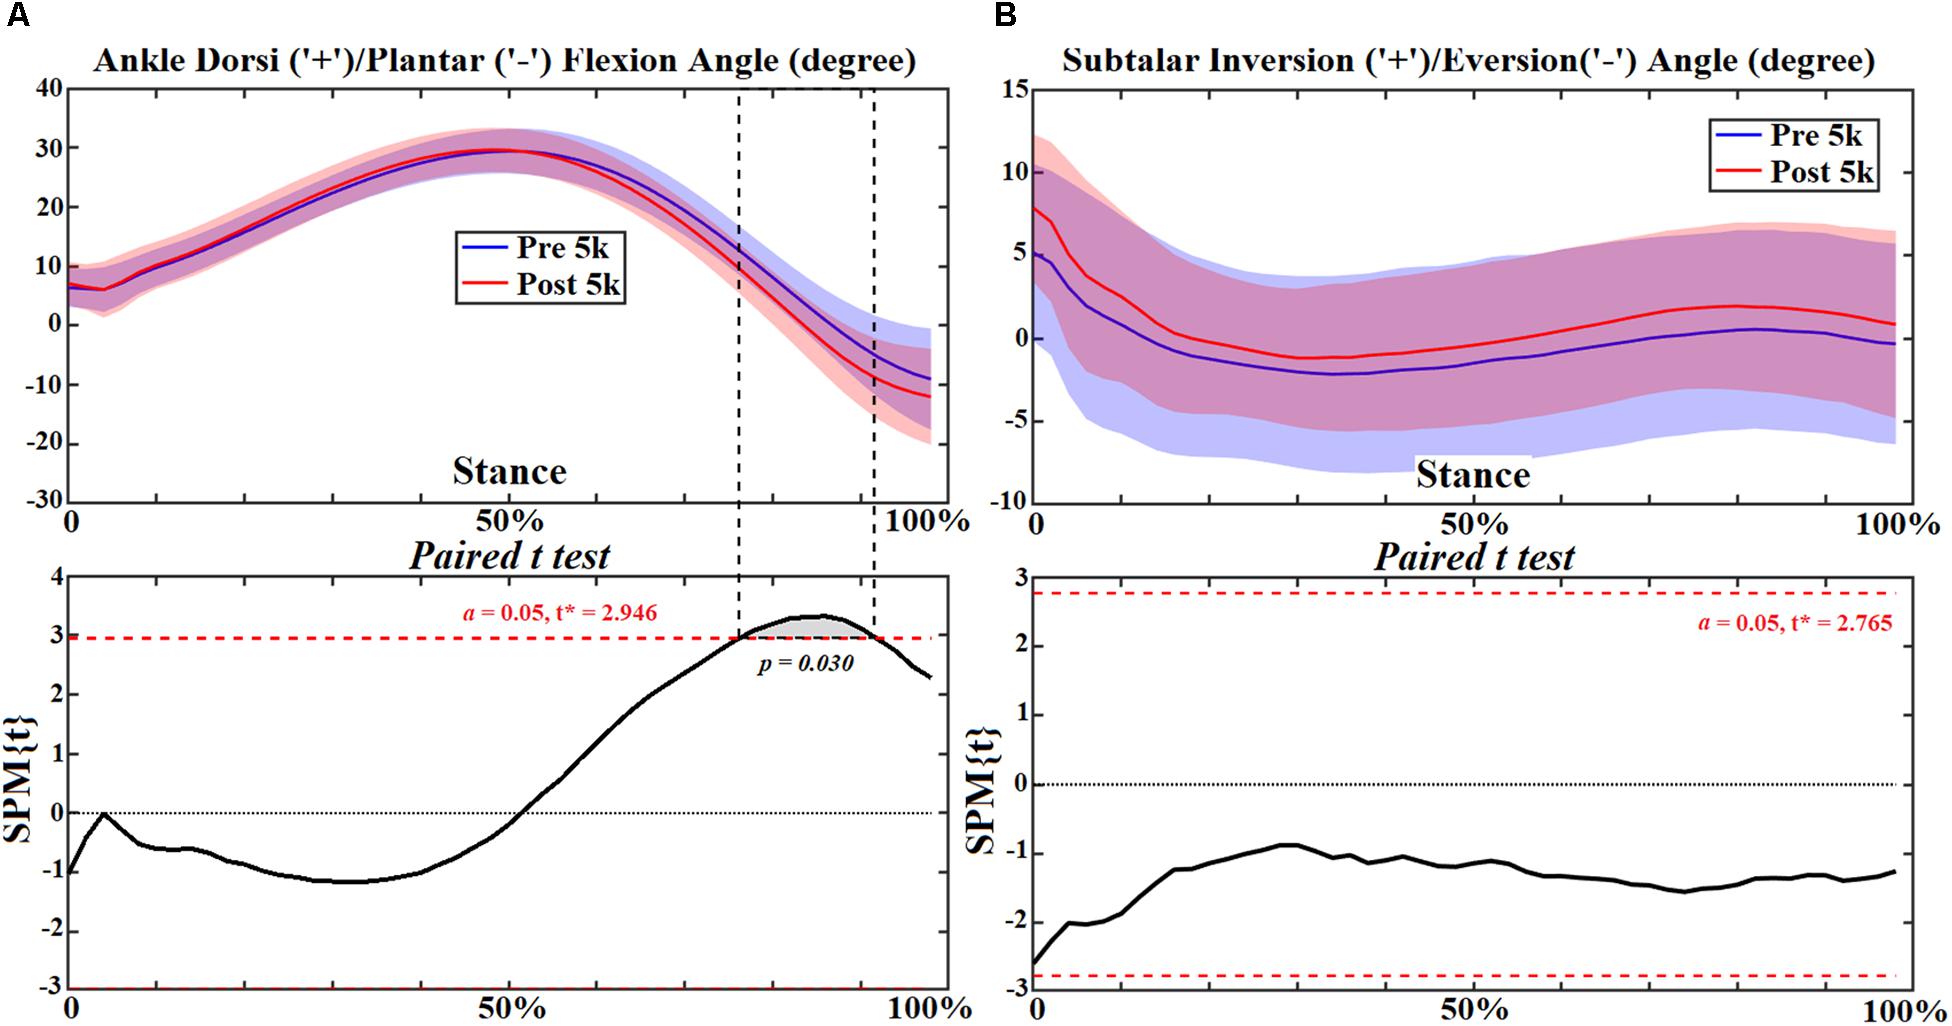
Figure 8. The ankle and subtalar joint angles (A,B) during stance with statistics (spm{t}) from spm1d (“+” and “-” represent directions).
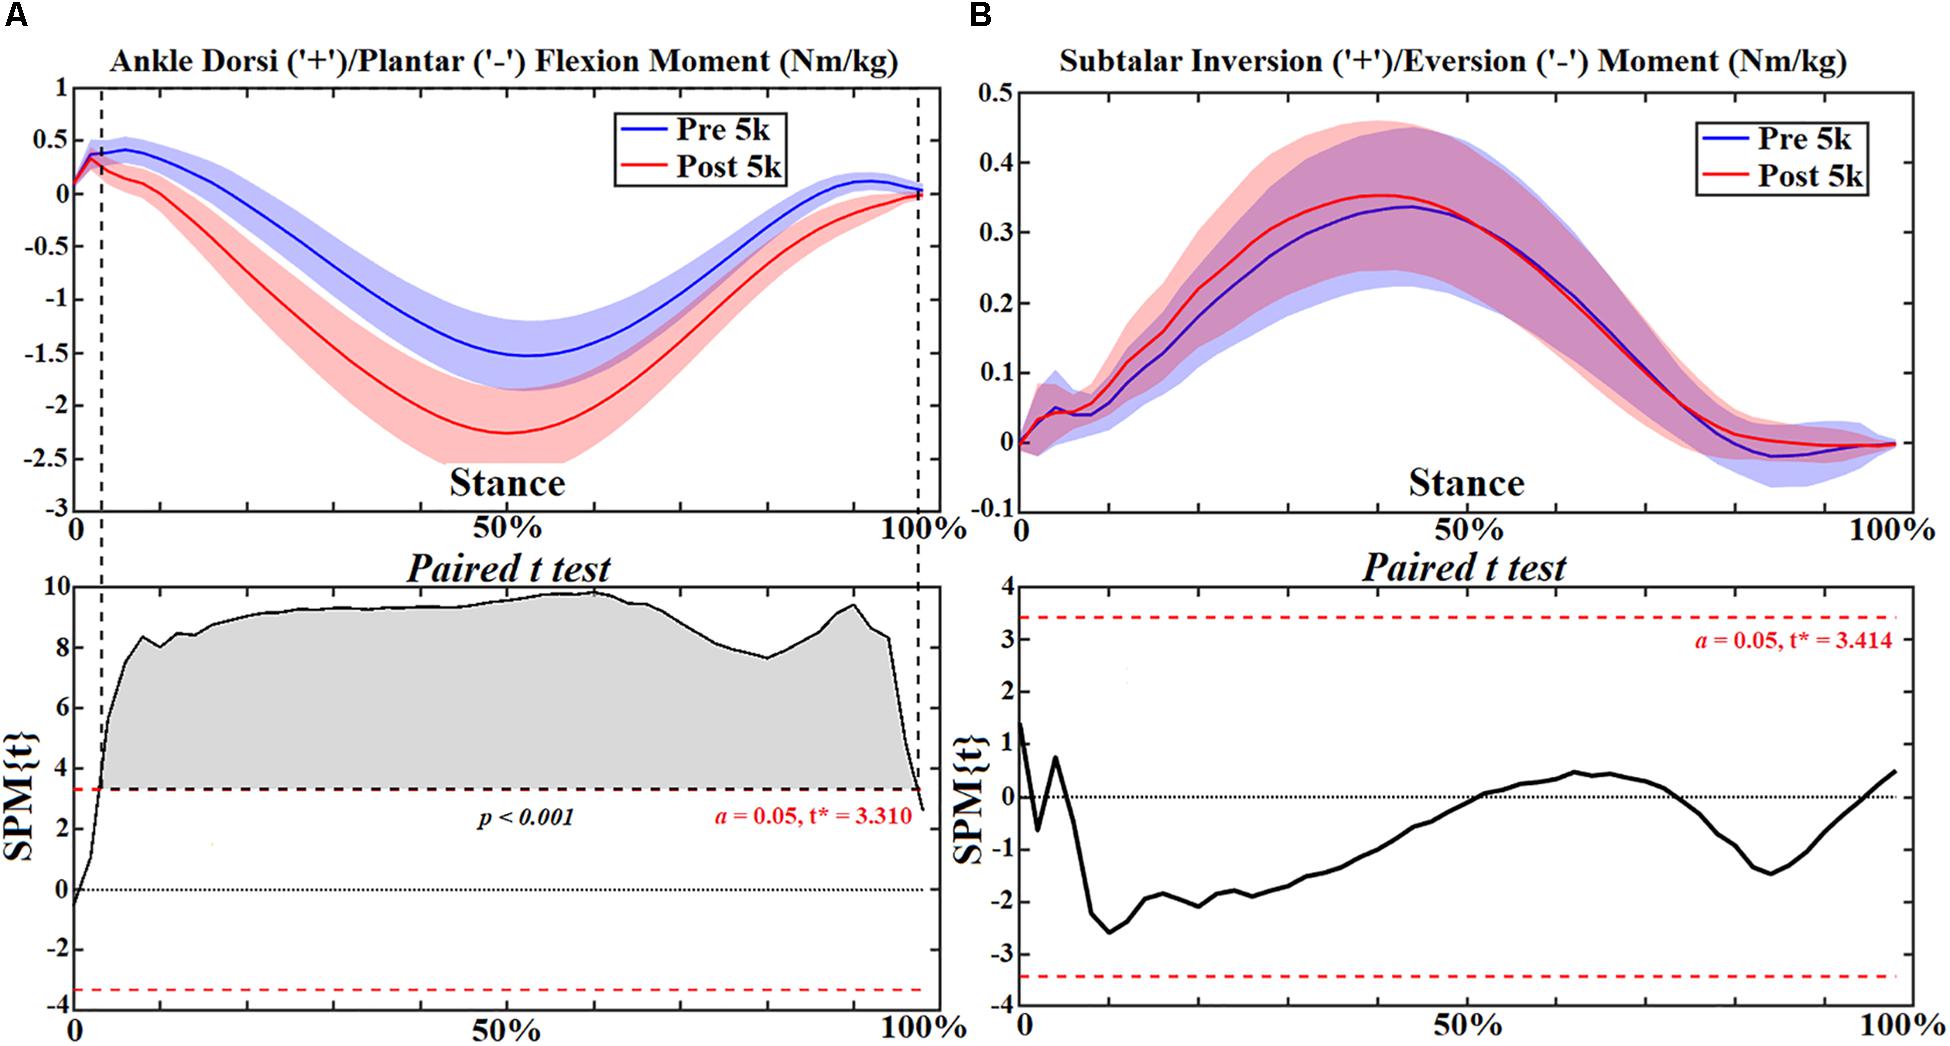
Figure 9. The ankle and subtalar joint moments (A,B) during stance with statistics (spm{t}) from spm1d (“+” and “-represent directions).
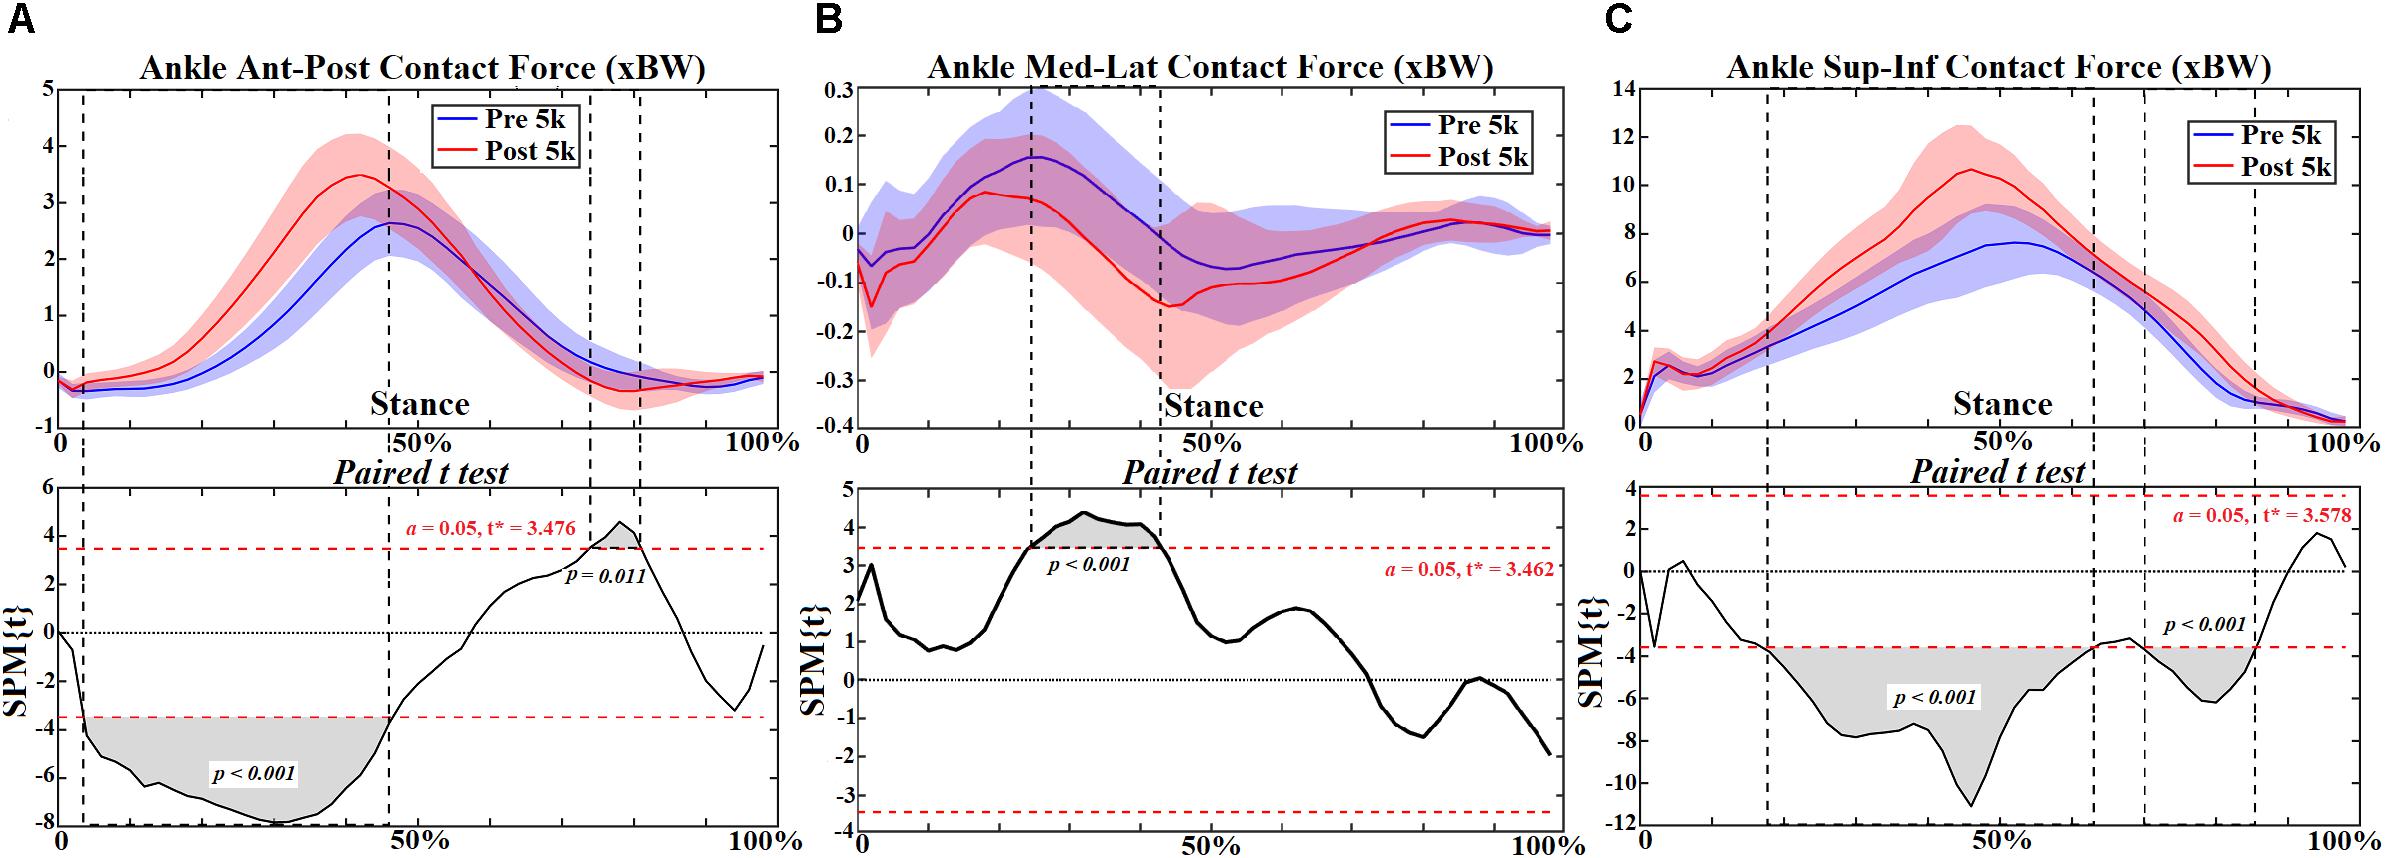
Figure 10. The ankle joint contact forces (A–C) during stance with statistics (spm{t}) from spm1d (“+” and “-” represent directions).

Table 4. The peak ankle and subtalar moments and ankle joint contact forces in the ant-post, med-lat, and sup-inf directions (Mean ± SD [95% Confidence Interval]).
Discussion
The findings in this study suggest that joint moments and joint contact forces in the lower extremity are altered with increased foot pronation following 5 k running. Specifically, hip joint moments and hip contact force increased during stance. Knee joint extension moment decreased but abduction moment increased, and sup-inf contact force increased during mid stance. Ankle plantarflexion moment increased throughout stance, and ankle contact force increased in the ant-post and sup-inf directions but decreased in the med-lat direction. The FPI was found to correlate moderately with knee and ankle moments pre- and post-5 km running.
The human foot attenuates shock at the arch during weight bearing in stance. Due to repetitive loading from prolonged running activities, reduced arch height and pronated foot posture are reported in long distance runners (Fukano et al., 2018; Mei et al., 2018), which is consistent with the increased foot pronation assessed using the FPI in this study. Foot pronation may be associated with several RRI, which remain a conflicting issue in the biomechanics community. High arch runners present with higher incidence of ankle injuries, in contrast low arch runners exhibit more knee injuries (Williams et al., 2001), specifically the medial tibia stress syndrome among lower arch and pronated foot runners (Bennett et al., 2001). Greater knee abduction moment has been reported during walking and running in athletes with a low foot arch (Powell et al., 2016). This is consistent with the current study that showed a moderate correlation between FPI (pronated with low arch) and peak abduction moment. It should be acknowledged that participants in this study wore their preferred shoe design and this was not controlled for. Shoe design has been shown to influence pronation including motion control shoes (Malisoux et al., 2016), maximal, neutral, and minimal shoes (Mei et al., 2014; Pollard et al., 2018; Xiang et al., 2018). Footwear design or wearing no shoes at all may influence the motor control system during running (Feng and Song, 2017; Santuz et al., 2017).
Stance contact time after 5 k running was consistent with a recent study of intersegmental work contribution during a prolonged run (Sanno et al., 2018). However, the average speed of runners in this study was ∼3.1 m/s, which was slower than the study of exhaustive maximal 10 k treadmill running (Hanley and Tucker, 2018) reported as ∼4.7 m/s. This is likely due to runners in that study being competitive compared to the recreational class of the runners in the present study. Comparison with other recreational running studies revealed speeds of 3.3–3.4 m/s (Hoenig et al., 2019) and 3.2 m/s (Chan-Roper et al., 2012), which was consistent with our findings.
Sagittal and coronal hip kinematics remained unchanged post-5 k running in this study. This was consistent with a 10 k treadmill study of recreational runners at the same 5 k mark (Sanno et al., 2018). In overuse injuries in recreational runners it has been reported that hip flexor, abductor and external rotator muscle strength is reduced (Niemuth et al., 2005; Luedke et al., 2015; Kollock et al., 2016). The reduced muscles lead to an imbalance of the hip joint moments and the net result is increased extension, abduction and internal rotation moments. This is consistent with the current study where we found increased extension moment, abduction moment and internal rotation moment during the initial contact of stance.
The sup-inf hip contact force from this study was 8.8–9.7 BW at 3.1 m/s, which was consistent with a previous running study that reported hip contact forces of 9.47 BW when running at 3.05 m/s (Giarmatzis et al., 2015). It should be noted that the hip contact force in the current study further highlighted that sup-inf contact force increased during mid stance, whereas the med-lat and ant-post contact forces only increased during initial contact. Further, the pattern of sup-inf knee contact force was similar to the vertical ground reaction force, which is consistent with previous studies (Steele et al., 2012; Gerus et al., 2013; Knarr and Higginson, 2015).
Knee flexion and adduction kinematics and joint moments were consistent in profile and magnitude range with previous running studies (Hamner et al., 2010; Bonacci et al., 2013; Hamner and Delp, 2013). Simulated knee crossing muscle activation patterns (vastus lateralis, rectus femoris and vastus medialis) were in good temporal agreement with EMG signals recoded in our study (see Supplementary Material). Significantly decreased knee extension moment was observed from mid stance to push off during post-5 k running, which may be partly explained by the weak extensor muscles reported for recreational runners (Kollock et al., 2016).
The FPI was found to partly explain the knee flexion and knee abduction moments both pre and post-5 k running. Specifically, as the foot pronates knee abduction increases. This is interesting since increased knee abduction (or reduced knee adduction) has been associated with reduced medial knee loading in people who walk with increased foot pronation (Levinger et al., 2013). However, in contrast increased pronation has also been reported to be associated with medial loading and tibia stress (Barnes et al., 2008; Levinger et al., 2010) and everted foot kinematics during locomotion (Levinger et al., 2012). This suggests that foot pronation plays a role in medial knee joint loading and should not be too over pronated or supinated.
Ankle joint kinematics at heel strike and toe off during pre- 5 k and post-5 k were consistent with recent studies (Reenalda et al., 2016; Sanno et al., 2018) showing similar profiles and range of motion. The subtalar joint angle and moment patterns were unchanged post-5 k running, however, the single calcaneus marker used in this study may not be suited for dynamic subtalar joint motions in the frontal plane and should be considered as a limitation (Wang and Gutierrez-Farewik, 2011; Fischer et al., 2017). Our study showed increased plantarflexion during push off and plantarflexion joint moment throughout stance post-5 k running. One item exhibited from the FPI in this study was increased calcaneus eversion at the subtalar joint post-5 k running. This is consistent with a study that reported subtalar over eversion was found to enlarge the plantar flexors and tibialis anterior muscles (Wang and Gutierrez-Farewik, 2011). Further, increased plantar flexor muscles and tibialis anterior (dorsiflexor) may contribute to increased ankle contact forces. This is consistent with the increased ankle contact force observed in this study.
Conclusion
This study presents an investigation of the changes in foot posture, joint kinematics, joint moments and joint contact forces in the lower extremity following a 5 k treadmill run in 20 participants. A relationship between knee and ankle joint loading and FPI was developed. It was found that hip joint moments and contact forces increased during initial foot contact following 5 k running. Knee abduction moment and superior-inferior knee contact force increased, whereas the knee extension moment decreased. Ankle plantarflexion moment and ankle contact forces increased during stance. A useful finding was that the FPI was moderately correlated with peak knee and ankle moments. The FPI showed that recreational male runners presented increased static foot pronation after 5 k treadmill running. These findings suggest that following mid distance running change in foot pronation may be an early indicator of increased lower limb joint loading. Furthermore, the FPI may be used to quantify the changes in knee and ankle joint moments. Specifically, increase in FPI leads to an increase in knee flexion moment, knee abduction moment, ankle plantarflexion moment and subtalar inversion moment.
Data Availability
The raw data supporting the conclusions of this manuscript will be made available by the authors, without undue reservation, to any qualified researcher.
Ethics Statement
This study was approved by the Ethical Committee in the Research Academy of Grand Health, Ningbo University (RAGH20161208).
Author Contributions
QM, YG, and JF conceived and designed this study. QM and LX conducted the test, collected, and analyzed the data. QM, YG, JB, and JF prepared the manuscript. QM, YG, LX, JB, and JF commented, revised the manuscript, and all approved for the submission.
Funding
This study was sponsored by National Natural Science Foundation of China (No.81772423), and K. C. Wong Magna Fund in Ningbo University. QM of this paper is supported by the New Zealand-China Doctoral Research Scholarship issued from the Ministry of Foreign Affairs and Trade (New Zealand).
Conflict of Interest Statement
The authors declare that the research was conducted in the absence of any commercial or financial relationships that could be construed as a potential conflict of interest.
Supplementary Material
The Supplementary Material for this article can be found online at: https://www.frontiersin.org/articles/10.3389/fphys.2019.00573/full#supplementary-material
References
Barnes, A., Wheat, J., and Milner, C. (2008). Association between foot type and tibial stress injuries: a systematic review. Br. J. Sports Med. 42, 93–98. doi: 10.1136/bjsm.2007.036533
Bennett, J. E., Reinking, M. F., Pluemer, B., Pentel, A., Seaton, M., and Killian, C. (2001). Factors contributing to the development of medial tibial stress syndrome in high school runners. J. Orthop. Sport Phys. Ther. 31, 504–510. doi: 10.2519/jospt.2001.31.9.504
Bertelsen, M. L., Hulme, A., Petersen, J., Brund, R. K., Sørensen, H., Finch, C. F., et al. (2017). A framework for the etiology of running-related injuries. Scand. J. Med. Sci. Sport 27, 1170–1180. doi: 10.1111/sms.12883
Bonacci, J., Saunders, P. U., Hicks, A., Rantalainen, T., Vicenzino, B. G. T., and Spratford, W. (2013). Running in a minimalist and lightweight shoe is not the same as running barefoot: a biomechanical study. Br. J. Sports Med. 47, 387–392. doi: 10.1136/bjsports-2012-091837
Bowser, B. J., Fellin, R., Milner, C. E., Pohl, M. B., and Davis, I. S. (2018). Reducing impact loading in runners. Med. Sci. Sport Exerc. 50, 2500–2506. doi: 10.1249/MSS.0000000000001710
Brund, R. B. K., Rasmussen, S., Nielsen, R. O., Kersting, U. G., Laessoe, U., and Voigt, M. (2017). Medial shoe-ground pressure and specific running injuries: A 1-year prospective cohort study. J. Sci. Med. Sport 20, 1–5. doi: 10.1016/j.jsams.2017.04.001
Chan-Roper, M., Hunter, I., Myrer, J. W., Eggett, D. L., and Seeley, M. K. (2012). Kinematic changes during a marathon for fast and slow runners. J. Sport Sci. Med. 11, 77–82. doi: 10.1162/qjec.122.2.831
Delp, S. L., Anderson, F. C., Arnold, A. S., Loan, P., Habib, A., John, C. T., et al. (2007). OpenSim: open-source software to create and analyze dynamic simulations of movement. IEEE Trans. Biomed. Eng. 54, 1940–1950. doi: 10.1109/TBME.2007.901024
DeMers, M. S., Pal, S., and Delp, S. L. (2014). Changes in tibiofemoral forces due to variations in muscle activity during walking. J. Orthop. Res. 32, 769–776. doi: 10.1002/jor.22601
Dugan, S. A., and Bhat, K. P. (2005). Biomechanics and analysis of running gait. Phys. Med. Rehabil. Clin. N. Am. 16, 603–621. doi: 10.1016/j.pmr.2005.02.007
Feng, Y., and Song, Y. (2017). The Categories of AFO and its effect on patients with foot impair: a systemic review. Phys. Activ. Health 1, 8–16. doi: 10.5334/paah.3
Fischer, K. M., Willwacher, S., Hamill, J., and Brüggemann, G. P. (2017). Tibial rotation in running: does rearfoot adduction matter? Gait Posture 51, 188–193. doi: 10.1016/j.gaitpost.2016.10.015
Fukano, M., Inami, T., Nakagawa, K., Narita, T., and Iso, S. (2018). Foot posture alteration and recovery following a full marathon run. Eur. J. Sport Sci. 18, 1338–1345. doi: 10.1080/17461391.2018.1499134
Gerus, P., Sartori, M., Besier, T. F., Fregly, B. J., Delp, S. L., Banks, S. A., et al. (2013). Subject-specific knee joint geometry improves predictions of medial tibiofemoral contact forces. J. Biomech. 46, 2778–2786. doi: 10.1016/j.jbiomech.2013.09.005
Giarmatzis, G., Jonkers, I., Wesseling, M., Rossom, S., and Van Verschueren, S. (2015). Loading of hip measured by hip contact forces at different speeds of walking and running. J. Bone Miner. Res. 30, 1431–1440. doi: 10.1146/annurev-bioeng-070909-105259
Hamner, S. R., and Delp, S. L. (2013). Muscle contributions to fore-aft and vertical body mass center accelerations over a range of running speeds. J. Biomech. 46, 780–787. doi: 10.1016/j.jbiomech.2012.11.024
Hamner, S. R., Seth, A., and Delp, S. L. (2010). Muscle contributions to propulsion and support during running. J. Biomech. 43, 2709–2716. doi: 10.1016/j.jbiomech.2010.06.025
Hanley, B., and Tucker, C. B. (2018). Gait variability and symmetry remain consistent during high-intensity 10,000 m treadmill running. J. Biomech. 79, 129–134. doi: 10.1016/j.jbiomech.2018.08.008
Hoenig, T., Hamacher, D., Braumann, K. M., Zech, A., and Hollander, K. (2019). Analysis of running stability during 5000 m running. Eur. J. Sport Sci. 19, 413–421. doi: 10.1080/17461391.2018.1519040
Hulme, A., Nielsen, R. O., Timpka, T., Verhagen, E., and Finch, C. (2017). Risk and protective factors for middle- and long-distance running-related injury. Sport Med. 47, 869–886. doi: 10.1007/s40279-016-0636-4
Knarr, B. A., and Higginson, J. S. (2015). Practical approach to subject-specific estimation of knee joint contact force. J. Biomech. 48, 2897–2902. doi: 10.1016/j.jbiomech.2015.04.020
Knechtle, B., Di Gangi, S., Rüst, C. A., Rosemann, T., and Nikolaidis, P. T. (2018). Men’s participation and performance in the boston marathon from 1897 to 2017. Int. J. Sports Med. 39, 1018–1027. doi: 10.1055/a-0660-0061
Kollock, R. O., Andrews, C., Johnston, A., Elliott, T., Wilson, A. E., Games, K. E., et al. (2016). A meta-analysis to determine if lower extremity muscle strengthening should be included in military knee overuse injury-prevention programs. J. Athl. Train. 51, 919–926. doi: 10.4085/1062-6050-51.4.09
Larson, P., Higgins, E., Kaminski, J., Decker, T., Preble, J., Lyons, D., et al. (2011). Foot strike patterns of recreational and sub-elite runners in a long-distance road race. J. Sports Sci. 29, 1665–1673. doi: 10.1080/02640414.2011.610347
Lerner, Z. F., and Browning, R. C. (2016). Compressive and shear hip joint contact forces are affected by pediatric obesity during walking. J. Biomech. 49, 1547–1553. doi: 10.1016/j.jbiomech.2016.03.033
Lerner, Z. F., DeMers, M. S., Delp, S. L., and Browning, R. C. (2015). How tibiofemoral alignment and contact locations affect predictions of medial and lateral tibiofemoral contact forces. J. Biomech. 48, 644–650. doi: 10.1016/j.jbiomech.2014.12.049
Levinger, P., Menz, H. B., Fotoohabadi, M. R., Feller, J. A., Bartlett, J. R., and Bergman, N. R. (2010). Foot posture in people with medial compartment knee osteoarthritis. J. Foot Ankle Res. 3:29. doi: 10.1093/rheumatology/kes222
Levinger, P., Menz, H. B., Morrow, A. D., Bartlett, J. R., Feller, J. A., and Bergman, N. R. (2013). Relationship between foot function and medial knee joint loading in people with medial compartment knee osteoarthritis. J. Foot Ankle Res. 6:33. doi: 10.1186/1757-1146-6-33
Levinger, P., Menz, H. B., Morrow, A. D., Feller, J. A., Bartlett, J. R., and Bergman, N. R. (2012). Foot kinematics in people with medial compartment knee osteoarthritis. Rheumatology 51, 2191–2198. doi: 10.1093/rheumatology/kes222
Luedke, L. E., Heiderscheit, B. C., Williams, D. S. B., and Rauh, M. J. (2015). Association of isometric strength of hip and knee muscles with injury risk in high school cross country runners. Int. J. Sports Phys. Ther. 10,868–876.
Malisoux, L., Chambon, N., Delattre, N., Gueguen, N., Urhausen, A., and Theisen, D. (2016). Injury risk in runners using standard or motion control shoes: a randomised controlled trial with participant and assessor blinding. Br. J. Sports Med. 50, 481–487. doi: 10.1136/bjsports-2015-095031
Mei, Q., Graham, M., and Gu, Y. (2014). Biomechanical analysis of the plantar and upper pressure with different sports shoes. Int. J. Biomed. Eng. Technol. 14, 181–191. doi: 10.1155/2019/7048345
Mei, Q., Gu, Y., Sun, D., and Fernandez, J. (2018). How foot morphology changes influence shoe comfort and plantar pressure before and after long distance running? Acta Bioeng. Biomech. 20, 179–186. doi: 10.5277/ABB-01112-2018-02
Meireles, S., De Groote, F., Van Rossom, S., Verschueren, S., and Jonkers, I. (2017). Differences in knee adduction moment between healthy subjects and patients with osteoarthritis depend on the knee axis definition. Gait Posture 53, 104–109. doi: 10.1016/j.gaitpost.2017.01.013
Nielsen, R. O., Buist, I., Parner, E. T., Nohr, E. A., Sørensen, H., Lind, M., et al. (2014). Foot pronation is not associated with increased injury risk in novice runners wearing a neutral shoe: a 1-year prospective cohort study. Br. J. Sports Med. 48, 440–447. doi: 10.1136/bjsports-2013-092202
Niemuth, P. E., Johnson, R. J., Myers, M. J., and Thieman, T. J. (2005). Hip muscle weakness and overuse injuries in recreational run. Clin. J. Sport Med. 15, 14–21. doi: 10.1097/00042752-200501000-00004
Nigg, B., Baltich, J., Hoerzer, S., and Enders, H. (2015). Running shoes and running injuries: mythbusting and a proposal for two new paradigms: ‘preferred movement path’ and ‘comfort filter’. Br. J. Sports Med. 49, 1290–1294. doi: 10.1136/bjsports-2015-095054
Nigg, B. M. (2011). The role of impact forces and foot pronation: a new paradgm. Clin. J. Sport Med. 11, 2–9. doi: 10.1097/00042752-200101000-00002
Novacheck, T. F., and Tom, N. (1998). The biomechanics of running. Gait Posture 7, 77–95. doi: 10.3233/BMR-1995-5404
Pataky, T. C. (2010). Generalized n-dimensional biomechanical field analysis using statistical parametric mapping. J. Biomech. 43, 1976–1982. doi: 10.1016/j.jbiomech.2010.03.008
Pataky, T. C., Vanrenterghem, J., and Robinson, M. A. (2015). Zero- vs. one-dimensional, parametric vs. non-parametric, and confidence interval vs. hypothesis testing procedures in one-dimensional biomechanical trajectory analysis. J. Biomech. 48, 1277–1285. doi: 10.1016/j.jbiomech.2015.02.051
Pollard, C. D., Har, J. A., Ter Hannigan, J. J., and Norcross, M. F. (2018). Influence of maximal running shoes on biomechanics before and after a 5K Run. Orthodaedic. J. Sport Med. 6, 1–5. doi: 10.1177/2325967118775720
Powell, D. W., Andrews, S., Stickley, C., and Williams, D. S. B. (2016). High- compared to low-arched athletes exhibit smaller knee abduction moments in walking and running. Hum. Mov. Sci. 50, 47–53. doi: 10.1016/j.humov.2016.10.006
Rajagopal, A., Dembia, C. L., DeMers, M. S., Delp, D. D., Hicks, J. L., and Delp, S. L. (2016). Full-body musculoskeletal model for muscle-driven simulation of human gait. IEEE Trans. Biomed. Eng. 63, 2068–2079. doi: 10.1109/TBME.2016.2586891
Redmond, A. C., Crosbie, J., and Ouvrier, R. A. (2006). Development and validation of a novel rating system for scoring standing foot posture: the foot posture idex. Gait Posture 21, 89–98. doi: 10.1016/j.gaitpost.2018.01.022
Reenalda, J., Maartens, E., Homan, L., and Buurke, J. H. J. (2016). Continuous three dimensional analysis of running mechanics during a marathon by means of inertial magnetic measurement units to objectify changes in running mechanics. J. Biomech. 49, 3362–3367. doi: 10.1016/j.jbiomech.2016.08.032
Sanno, M., Willwacher, S., Epro, G., and Brüggemann, G.-P. (2018). Positive work contribution shifts from distal to proximal joints during a prolonged run. Med. Sci. Sport Exerc. 50, 2507–2517. doi: 10.1249/MSS.0000000000001707
Santuz, A., Ekizos, A., Janshen, L., Baltzopoulos, V., and Arampatzis, A. (2017). The influence of footwear on the modular organization of running. Front. Physiol. 8:958. doi: 10.3389/fphys.2017.00958
Steele, K. M., DeMers, M. S., Schwartz, M. H., and Delp, S. L. (2012). Compressive tibiofemoral force during crouch gait. Gait Posture 35, 556–560. doi: 10.1016/j.gaitpost.2011.11.023
Ueda, T., Hobara, H., Kobayashi, Y., Heldoorn, T. A., Mochimaru, M., and Mizoguchi, H. (2016). Comparison of 3 methods for computing loading rate during running. Int J Sport Med. 37, 1087–1090. doi: 10.1055/s-0042-107248
van Gent, R. N., Siem, D., van Middeloop, M., van Os, A. G., Bierma-Zeinstra, S. M. A., and Koes, B. W. (2007). Incidence and determinants of lower extremity running injuries in long distance runners: a systematic review. Br. J. Sports Med. 40, 16–29. doi: 10.1136/bjsm.2006.033548
Videbæk, S., Bueno, A. M., Nielsen, R. O., and Rasmussen, S. (2015). Incidence of running-related injuries per 1000 h of running in different types of runners: a systematic review and meta-analysis. Sport Med. 45, 1017–1026. doi: 10.1007/s40279-015-0333-8
Vitti, A., Nikolaidis, P. T., Villiger, E., Onywera, V., and Knechtle, B. (2019). The “New York City Marathon”: participation and performance trends of 1.2M runners during half-century. Res. Sport Med. 19, 1–17. doi: 10.1080/15438627.2019.1586705
Wang, R., and Gutierrez-Farewik, E. M. (2011). The effect of subtalar inversion/eversion on the dynamic function of the tibialis anterior, soleus, and gastrocnemius during the stance phase of gait. Gait Posture 34, 29–35. doi: 10.1016/j.gaitpost.2011.03.003
Williams, D. S., McClay, I. S., and Hamill, J. (2001). Arch structure and injury patterns in runners. Clin. Biomech. 16, 341–347. doi: 10.1016/S0268-0033(01)00005-5
Xiang, L., Mei, Q., Fernandez, J., and Gu, Y. (2018). Minimalist shoes running intervention can alter the plantar loading distribution and deformation of hallux valgus: a pilot study. Gait Posture 65, 65–71. doi: 10.1016/j.gaitpost.2018.07.002
Keywords: foot posture, pronation, knee, ankle, contact force, OpenSim, statistical parametric mapping
Citation: Mei Q, Gu Y, Xiang L, Baker JS and Fernandez J (2019) Foot Pronation Contributes to Altered Lower Extremity Loading After Long Distance Running. Front. Physiol. 10:573. doi: 10.3389/fphys.2019.00573
Received: 13 February 2019; Accepted: 24 April 2019;
Published: 22 May 2019.
Edited by:
Pantelis Theodoros Nikolaidis, University of West Attica, GreeceReviewed by:
John Mercer, University of Nevada, Las Vegas, United StatesRamona Ritzmann, University of Freiburg, Germany
Copyright © 2019 Mei, Gu, Xiang, Baker and Fernandez. This is an open-access article distributed under the terms of the Creative Commons Attribution License (CC BY). The use, distribution or reproduction in other forums is permitted, provided the original author(s) and the copyright owner(s) are credited and that the original publication in this journal is cited, in accordance with accepted academic practice. No use, distribution or reproduction is permitted which does not comply with these terms.
*Correspondence: Yaodong Gu, Z3V5YW9kb25nQGhvdG1haWwuY29t
 Qichang Mei1,2,3
 Yaodong Gu
