
95% of researchers rate our articles as excellent or good
Learn more about the work of our research integrity team to safeguard the quality of each article we publish.
Find out more
ORIGINAL RESEARCH article
Front. Physiol. , 31 July 2018
Sec. Exercise Physiology
Volume 9 - 2018 | https://doi.org/10.3389/fphys.2018.01034
 Ibai Garcia-Tabar*
 Esteban M. Gorostiaga
Maximal Lactate Steady State (MLSS) and Lactate Threshold (LT) are physiologically-related and fundamental concepts within the sports and exercise sciences. Literature supporting their relationship, however, is scarce. Among the recognized LTs, we were particularly interested in the disused “Minimum Lactate Equivalent” (LEmin), first described in the early 1980s. We hypothesized that velocity at LT, conceptually comprehended as in the old days (LEmin), could predict velocity at MLSS (VMLSS) more accurate than some other blood lactate-related thresholds (BLRTs) routinely used nowadays by many sport science practitioners. Thirteen male endurance-trained [VMLSS 15.0 ± 1.1 km·h−1; maximal oxygen uptake () 67.6 ± 4.1 ml·kg−1·min−1] homogeneous (coefficient of variation: ≈7%) runners conducted 1) a submaximal discontinuous incremental running test to determine several BLRTs followed by a maximal ramp incremental running test for determination, and 2) several (4–5) constant velocity running tests to determine VMLSS with a precision of 0.20 km·h−1. Determined BLRTs include LEmin and LEmin-related LEmin plus 1 (LEmin+1mM) and 1.5 mmol·L−1 (LEmin+1.5mM), along with well-established BLRTs such as conventionally-calculated LT, Dmax and fixed blood lactate concentration thresholds. LEmin did not differ from LT (P = 0.71; ES: 0.08) and was 27% lower than MLSS (P < 0.001; ES: 3.54). LEmin+1mM was not different from MLSS (P = 0.47; ES: 0.09). LEmin was the best predictor of VMLSS (r = 0.91; P < 0.001; SEE = 0.47 km·h−1), followed by LEmin+1mM (r = 0.86; P < 0.001; SEE = 0.58 km·h−1) and LEmin+1.5mM (r = 0.84; P < 0.001; SEE = 0.86 km·h−1). There was no statistical difference between MLSS and estimated MLSS using LEmin prediction formula (P = 0.99; ES: 0.001). Mean bias and limits of agreement were 0.00 ± 0.45 km·h−1 and ±0.89 km·h−1. Additionally, LEmin, LEmin+1mM and LEmin+1.5mM were the best predictors of (r = 0.72–0.79; P < 0.001). These results support LEmin, an objective submaximal overlooked and underused BLRT, to be one of the best single MLSS predictors in endurance trained runners. Our study advocates factors controlling LEmin to be shared, at least partly, with those controlling MLSS.
The exercise intensity corresponding to the maximal lactate steady state (MLSS) is a consistent physiological phenomenon describing the highest constant velocity or power output that can be maintained over time without continual blood lactate concentration (BLC) accumulation (Beneke, 1995). Nowadays MLSS is considered the gold standard endurance performance marker among the vast majority of sport and exercise science physiologists (Beneke, 1995; Llodio et al., 2016; Messias et al., 2017). MLSS is valuable, and more sensitive than maximal oxygen uptake (), to diagnose endurance performance (Coyle et al., 1988), guide aerobic training (Haverty et al., 1988), evaluate endurance training-induced adaptations (Philp et al., 2008) and predict endurance performance (Haverty et al., 1988; Jones and Doust, 1998). Determination of MLSS is, however, cumbersome and interferes with the athlete's training program since it requires several (3–6) constant workload tests on separate days lengthening aerobic conditioning evaluation to a minimum of 1–3 week period (Heck et al., 1985).
In an attempt to overcome the shortcomings of multiple-day testing, simpler methods have been proposed to estimate MLSS from a single-day test, involving the use of either BLC-based measurements or some other bloodless simple measurements such as the peak workload reached during an incremental maximal test. Numerous studies conducted on competitive athletes have shown that the intensities corresponding to some blood lactate-related thresholds (BLRTs), such as the Onset of Blood Lactate Accumulation (OBLA) (Beneke, 1995; Van Schuylenbergh et al., 2004), Individual Anaerobic Threshold (IAT) (Beneke, 1995), Dmax (Van Schuylenbergh et al., 2004) or the Lactate Minimum Test (LMT) (Jones and Doust, 1998), predict MLSS with a wide range of correlation magnitudes (r = 0.61–0.85). However, these correlation magnitudes are equal, or even lower, than the ones reported in those same studies when the peak workload attained during an incremental maximal test was used as MLSS predictor (r = 0.85–0.94).
Before the appearance of the MLSS concept and based on the early works of Barr and Himwich (1923) and Owles (1930) published in the 1920s, several researchers independently found that during graded incremental exercise there is a critical exercise intensity level unique to each individual above which BLC initiates to increase beyond resting values. In the following years this critical workload level, which always occurs at lower intensities than MLSS (Lehmann et al., 1983; Aunola and Rusko, 1988; Faude et al., 2009; Ferguson et al., 2018) and is frequently called “Lactate Threshold (LT)” (Jones and Ehrsam, 1982) [although it has also been termed “Owles' Point” (Jones and Ehrsam, 1982), “Oxygen Endurance Performance Limit” (Hollmann, 1985), “Aerobic Threshold” (Kindermann et al., 1978) or “Anaerobic Threshold” (Wasserman et al., 1973)], was widely considered as the standard criterion measure to determine aerobic capacity (Weltman et al., 1987; Mezzani et al., 2012), predict endurance performance (Yoshida et al., 1990), and design endurance exercise training programs (Weltman et al., 1990); turning LT into a pivotal concept within the sports medicine and exercise sciences. Notwithstanding, there are still some relevant methodological limitations on the accurate and rigorous determination of LT, mainly when (a) it is determined by simple visual inspection of BLC-data plotted against workload due to the subjectivity of the analysis and poor inter-viewer and inter-method agreement (Yeh et al., 1983), (b) the initial workload and subsequent initial workload increments are not low enough to allow a preliminary BLC-baseline phase on the BLC kinetics during the graded exercise (Hollmann, 1985), and (c) the BLC-data-point interval is too large to detect LT with a suitable sensitivity (Hollmann, 1985). Beyond a shadow of a doubt, objective methodological approaches and appropriate rigorous protocols are needed to overcome these limitations (Brooks, 1985).
Despite MLSS and LT being physiologically different, but probably related, fundamental concepts within the sports and exercise sciences (Ferguson et al., 2018), literature concerning their relationship is scarce. As far as the authors are aware, whether the velocity at LT (VLT) obtained during an incremental exercise test predicts the velocity at MLSS (VMLSS) in endurance trained runners has not been fully explored, and deserves further attention. We hypothesized that VLT, conceptually comprehended as in the old days (Owles, 1930), could predict VMLSS more accurate than some others BLRTs used nowadays by many authors and other sport science practitioners. Accordingly, the primary purpose of this study was to determine the applicability of the classical gold standard vLT, calculated objectively and in a standardized manner, to predict VMLSS in comparison with some other more commonly used parameters of BLC changes during incremental exercise in a homogeneous group of endurance trained runners. Among the recognized BLRTs (Faude et al., 2009) we were particularly interested in the “Minimum Lactate Equivalent” (LEmin), initially described by German authors in the early 1980s (Berg et al., 1980; Lehmann et al., 1983). LEmin is the minimum value of the BLC/workload vs. workload curve fitting during an incremental exercises test. Using an appropriate protocol with adequate opening and incremental workloads, the incremental test produces an idiosyncratic “U-shaped” curve fitting profile allowing mathematical impartial location of the transition at VLT with a very fine resolution. This seldom used method (LEmin) should not be confused with the much more popular “Lactate Minimum Test” (LMT), which was originally described by Tegtbur et al. (1993) and uses a preliminary relatively high level of exertion phase (hyperlactatemia phase) to set-up the mentioned “U-shaped” curve fitting profile hampering heart rate (HR) data interpretation, and therefore, its on-field application.
A secondary purpose of this study was to determine the extent to which some variables not requiring blood sampling, such as , peak treadmill velocity (PTV) or the velocity corresponding to the 90% of maximal heart rate (V90) (Garcia-Tabar et al., 2015b), are of potential interest to estimate VMLSS. To the best of our knowledge literature concerning VMLSS prediction from such variables in well-trained endurance runners is limited. Assessment and monitoring of aerobic capacity in this kind of athletes is of paramount importance (Halson, 2014), and consequently, this study has the potential to contribute with noteworthy scientific-based practical endurance performance implications.
Fifteen male trained middle- and long-distance runners were recruited from regional athletic clubs. Runners were required to meet the following inclusion criteria: (1) being male runners aged between 18 and 40; (2) having a VMLSS >13 km·h−1, and (3) a training routine of ≥3 aerobic running training sessions per week. Exclusions criteria were: (1) being taking any medication/supplementation that could affect BLC or HR values and (2) having any known cardiovascular, respiratory or circulatory dysfunction. One runner withdrew from the study due to personal reasons and another runner did not meet the inclusion criteria. Thirteen runners completed the study. Mean (±SD) age, height, body mass and percentage of body fat of the thirteen participants were 28 ± 7 y, 1.76 ± 0.05 m, 68.8 ± 6.8 kg and 8.8 ± 3.1%, respectively. Runners competed in races ranging from 800-m to half-marathon.
The study was conducted according to the guidelines laid down in the Declaration of Helsinki and all procedures were approved by the local Institutional Review Committee of the Instituto Navarro del Deporte y Jueventud (Government of Navarre, Spain). Inclusion and exclusion criteria, experimental rationale, testing procedures and associated risks and benefits of participation were fully explained to participants and their coaches by an oral presentation. Prior to any testing, participants acknowledged voluntary participation through written informed consent.
A predictive cross-sectional study was conducted to determine VMLSS from a single-session submaximal discontinuous incremental running test (SD-IRT). Participants conducted 7–8 laboratory testing sessions. (1) Heath screening session: a maximal ramp incremental cycling test to discard any cardiovascular anomaly (12-lead electrocardiogram, GE Healthcare, CASE Marquette, Germany). (2) Familiarization session: a SD-IRT to accustom to the testing treadmill running protocol. This session was also utilized for anthropometric evaluation. (3) BLRTs and testing session: the SD-IRT previously used in the familiarization session to determine BLRTs, followed by a maximal ramp incremental running test (MR-IRT) to determine . (4) VMLSS testing: 4–5 constant velocity running tests (CVRTs) for VMLSS determination.
Participants were required to complete the study within 6 weeks. Testing sessions were performed at the same time of the day to lessen circadian variability, were preceded by 2 days of rest or very light exercise [<90 min at <70% maximal HR (HRmax)] and were separated from the last competitive race by ≥4 days to allow restoration of muscle glycogen. Runners arrived to each testing session in a rested and fully hydrated state, 2 h postprandial, having abstained from caffeinated and alcoholic beverages during the day. Subjects were asked to replicate diet and exercise regimens the 2 days preceding each testing session to limit fluctuations of initial glycogen concentration between trials (Van Schuylenbergh et al., 2004; Philp et al., 2008). Participants recorded their exercise training and diet throughout the experimental phase of the study on training and diet logs designed and provided by the authors. These detailed exercise and diet logs served to confirm fulfillment of diet and exercise instructions given for the 2 days preceding each testing session, and verified that only minor changes in training and aerobic conditioning occurred during the study (Farrell et al., 1979). Participants wore the same running trainers on each experimental day. Testing took place during May-June, i.e., beginning of the outdoor competitive season. All procedures were conducted on the same running ergometer (Kuntaväline, Hyper Treadmill 2040, Finland) with the gradient set at 1%, under temperature (22.3 ± 1.4°C), humidity (33 ± 4%) and luminosity controlled laboratory conditions.
Athletes performed a SD-IRT for BLRTs determination, followed by a MR-IRT to determine their . The submaximal trial began at 7 km·h−1. Speed was increased by 1 km·h−1 every 2-min, with 1-min intervals between stages until a BLC ≥3 mmol·L−1 was observed. On the basis that 1- to 4-min stage duration protocols do not notably affect BLRTs detection (Yoshida, 1984), 2-min duration stages were chosen not to unnecessary lengthen the SD-IRT according to previous LEmin detection protocols (Berg et al., 1980, 1990; Lehmann et al., 1983; Aunola and Rusko, 1988). Immediately after each stage, capillary blood samples for BLC measurements were obtained. After a 10-min rest, subjects began the MR-IRT. Initial speed was 10 km·h−1 and was increased by 1 km·h−1 every min until volitional exhaustion. Volunteers were vigorously encouraged to complete exhaustion. Post-exercise capillary blood samples after 3 min of passive recovery were obtained for peak BLC (BLCpeak) determination. HR during both trials (Polar Electro Oy, RS800CX, Finland) and metabolic data during the MR-IRT (Vista Mini-CPX, Vacu-Med, Silver Edition 17670, Ventura, CA, USA) were monitored and averaged over 30-s. PTV, HRmax (Garcia-Tabar et al., 2017) and (Garcia-Tabar et al., 2015a) were determined following procedures previously described.
On subsequent laboratory visits, runners completed 4–5 CVRTs. Each CVRT consisted of 30-min running at the selected speeds with 1-min interruptions every 10-min for blood sampling (i.e., 32-min duration CVRTs). Capillary blood samples were obtained at rest, and at min 10, 21 and 32 of exercise. An increase in BLC <1.0 mmol·L−1 during the last 20 min of exercise (i.e., between the 10th and the 32nd min of the CVRT) was defined as the criterion for BLC to be considered at a steady state (Beneke, 1995). VMLSS was defined as the highest running velocity meeting this stability criterion. Running velocity of the first CVRT corresponded to approximately 80% of the PTV achieved during the maximal trial. Depending on the BLC stability of this first CVRT, the velocity was increased or decreased in the following CVRTs. If during the first CVRT a steady state or decrease in BLC was found, the velocity for the next CVRT was increased by 0.4 km·h−1. Conversely, if an increase in BLC superior to the stability criterion was observed, running velocity for the next CVRT was decreased by 0.4 km·h−1. This process of increasing or decreasing running velocity by 0.4 km·h−1, and later by 0.2 km·h−1, was further repeated in subsequent tests until VMLSS was determined with a precision of 0.2 km·h−1. HR was monitored and averaged as abovementioned.
A hyperemic earlobe was cleaned and dried before puncturing by a lancet device to aspirate a 5 μL whole blood sample into an enzyme-coated electrode test strip. BLC was determined via amperometric measurement using a portable analyzer (Arkray KDK Corporation, Lactate Pro LT-1710, Shiga, Japan) calibrated before every test. Manufacturers report coefficients of variation (CVs) of 3.2 and 2.6% for lactate standards of 2 and 11 mmol·L−1, respectively.
Nine different BLRTs were determined. LT0.2mM and LT1. LT0.2mM was defined as the stage prior to a ≥0.2 mmol·L−1 BLC elevation above baseline values (Stratton et al., 2009). To overcome the error associated with the analyzer (Weltman et al., 1987), the highest stage above which BLC increased by ≥0.1 mmol·L−1 in the following stage and ≥0.2 mmol·L−1 in the subsequent stage was also chosen as a threshold and named LT1. LEmin, LEmin+1mM and LEmin+1.5mM. The velocity corresponding to the Minimum Lactate Equivalent (VLEmin) (Berg et al., 1990) was considered the minimum value of the quotient BLC/velocity in the individual BLC/velocity vs. velocity second-order polynomial curves. Velocity associated with the Minimum Lactate Equivalent plus 1 (VLEmin+1mM) and 1.5 mmol·L−1 (VLEmin+1.5mM) were defined as the running velocities at 1.0 and 1.5 mmol·L−1 above VLEmin in the individual BLC vs. velocity second-order polynomial curves, respectively. Dmax. Velocity at Dmax was considered the maximum perpendicular distance from the straight line between the first and final BLC data-points to the third-order polynomial curve describing the BLC kinetics during the SD-IRT (Cheng et al., 1992). Fixed blood lactate concentration (FBLC) thresholds. Velocities at FBLC thresholds of 2 (FBLC2mM), 2.5 (FBLC2.5mM) and 3 mmol·L−1 (FBLC3mM) commonly use in real practice (Seiler, 2010; Garcia-Tabar et al., 2017) were determined from the individual BLC vs. velocity second-order polynomial curves. Determination of BLRTs is illustrated in Figure 1.
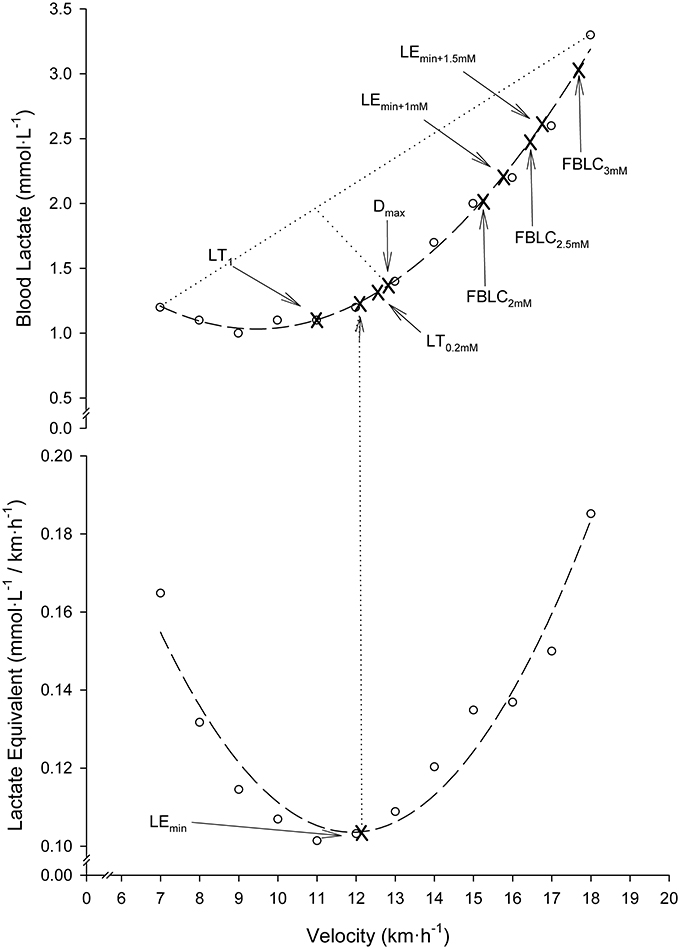
Figure 1. Illustration of blood lactate-related thresholds (BLRTs) determination in a representative participant. Dashed lines: second-order polynomial curve fits. Dotted lines: the greatest perpendicular distance from the third-order polynomial BLC-velocity curve fit to the generated straight line by the two end data-points of this curve. Note that for clearness of figure presentation, Dmax determination is illustrated together with the rest of BLRTs on a second-order polynomial curve fit, although actually it was determined on third-order curvilinear fits as originally described (Cheng et al., 1992).
Velocities at the BLRTs were determined using MATLAB R2015a (The MathWorks Inc., Natick, MA, USA). Coefficients of determination (R2) of the individual second- and third-order BLC vs. velocity and second-order BLC/velocity quotient vs. velocity polynomial curves were all >0.90. Velocities at BLRTs (Weltman et al., 1990), as well as VMLSS (Hauser et al., 2013), frequently show test-retest intraclass correlation coefficients >0.94, and CVs ≤3%. HR values at the BLRTs were computed from the individual HR vs. velocity linear regression equations (r > 0.98; P < 0.001). V90 was also calculated from the individual linear HR vs. velocity regressions obtained during the SD-IRTs (Garcia-Tabar et al., 2017).
Standard statistical methods were used for the calculation of means, standard deviations (SD), standard errors of the estimates (SEE) and confidence intervals (CI). Data were analyzed using parametric statistics following confirmation of normality (Kolmogorov–Smirnov test), homoscedasticity (Levene's test), and when appropriate sphericity (Mauchly's test). The Greenhouse-Geisser correction factor to reduce the risk of type I error was applied where sphericity assumptions were violated. Student's paired t-tests were used to evaluate differences between each BLRT with MLSS. The magnitudes of the differences were assessed using 90% CI and Hedges' g effect sizes (ES) (Hedges, 1981). Differences were considered non-substantial if the 90% CIs overlapped zero. ES values of 0.2, 0.5, and >0.8 were considered to represent small, moderate, and large differences, respectively. Differences in BLC and HR along the CVRTs were identified by one-way repeated measures ANOVA with Bonferroni correction for multiple comparisons. Two-factorial ANOVA with the Scheffé post-hoc test was used to identify differences in BLC and HR between the CVRTs at VMLSS and at 0.2 km·h−1 above VMLSS (VMLSS+0.2). Linear regression analyses with Pearson's correlation coefficients (r) were performed to determine the relationships between the variables of interest. When pertinent, slopes of regression lines were compared using analysis of covariance (ANCOVA). Agreement with the reference method (VMLSS) was assessed by mean bias and limits of agreement (LOAs) (Krouwer, 2008). Post-hoc power calculation for the linear regressions, assuming type I error of 0.05, indicated a power >99%. Analyses were performed using IMB SPSS Statistics 22 (IBM Corporation, NY, USA). Significance was set at P < 0.05 for the analyses that did not require post-hoc adjustment. Descriptive statistics are reported as means (±SD).
The SD-IRT lasted 32:00 ± 4:24 min:s. Runners achieved a treadmill velocity of 17.0 ± 1.5 km·h−1 (range 15.0–19.0). BLC and %HRmax at completion of the SD-IRT were 3.4 ± 0.6 mmol·L−1 (range 3.0–5.4) and 92 ± 2% (range 87–93), respectively. Figure 2 depicts BLC and %HRmax pattern responses to the SD-IRT. Descriptive characteristics of the BLRTs are depicted in Table 1. BLC resting values prior to the beginning of the MR-IRT were 1.1 ± 0.2 mmol·L−1 (range 0.8–1.7). Table 2 elucidated the maximal nature of the MR-IRT.
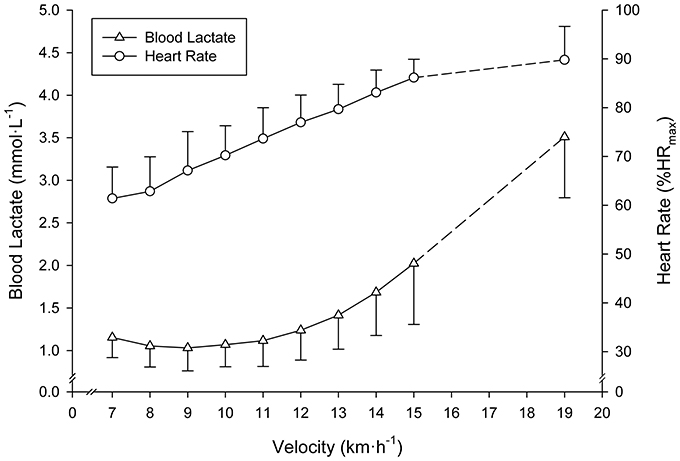
Figure 2. Mean (SD) blood lactate and heart rate responses to the submaximal discontinuous incremental running exercise test. All subjects terminated the 15 km·h−1 exercise stage. Mean (SD) values at completion of the test of subjects achieving ≥16 km·h−1 are indicated by dashed lines.
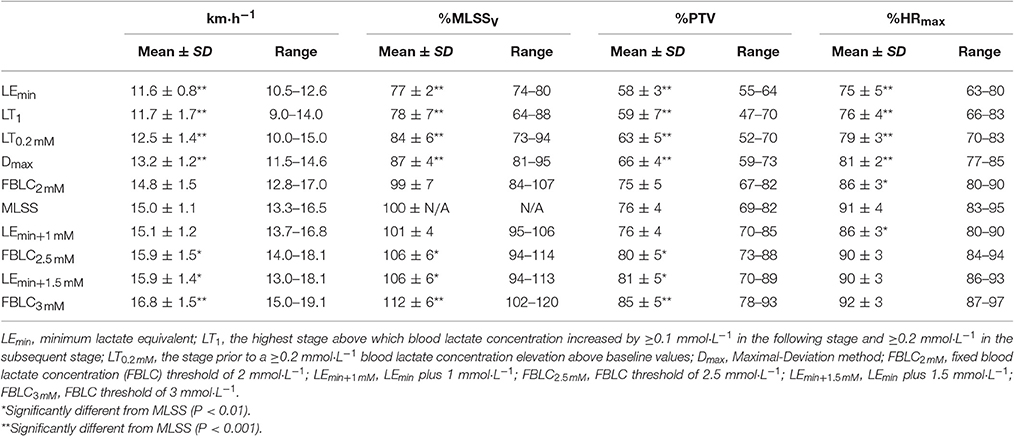
Table 1. Descriptive features of the determined blood lactate-related thresholds and maximal lactate steady state (MLSS) (n = 13).
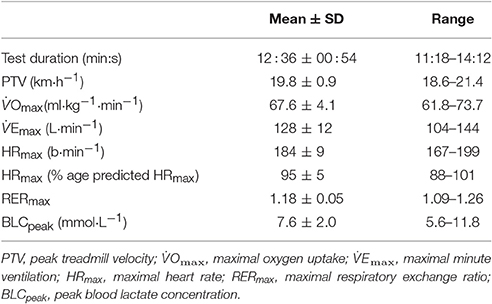
Table 2. Maximal values attained during the maximal ramp incremental running test (n = 13).
Descriptive features of the MLSS are displayed along with the BLRTs (Table 1). Velocity at LEmin did not differ from that at LT1 (P = 0.71; 90% CI: −0.74 to 0.47; ES: 0.08) and was 27% lower than VMLSS (P < 0.001; 90% CI: −3.80 to −2.83; ES: 3.54). Velocities at FBLC2mM (P = 0.50; 90% CI: −0.69 to 0.30; ES: 0.15) and LEmin+1mM (P = 0.47; 90% CI: −0.17 to 0.42; ES: 0.09) were not different from VMLSS. V90 (16.1 ± 1.2 km·h−1, range 13.9–18.1) was 1.1 km·h−1 (7%) higher than VMLSS (P < 0.001; 90% CI: 0.77–1.53; ES: 0.96), and not different from velocity at FBLC2.5mM (P = 0.619; 90% CI: −0.27 to 0.49; ES: 0.09) and VLEmin+1.5mM (P = 0.543; 90% CI: −0.42 to 0.87; ES: 0.15). HR associated with VMLSS during the SD-IRT was 86 ± 5% HRmax, and was not different from %HRmax at FBLC2mM (P = 0.93; 90% CI: −2.99 to 3.29; ES: 0.01), LEmin+1mM (P = 0.92; 90% CI: −2.56 to 2.86; ES: 0.04) and FBLC2.5mM (P = 0.08; 90% CI: 0.25–6.55; ES: 0.78). BLC and %HRmax responses to the CVRTs performed at VMLSS and at VMLSS+0.2 are illustrated in Figure 3. One runner exhausted at min 29 of the CVRT at VMLSS+0.2, and did not terminate the trial. BLC during the CVRT at VMLSS+0.2 increased >1 mmol·L−1 from the min 10 to the end of the trial (1.6 ± 0.7 mmol·L−1; P < 0.001; 90% CI: 1.26–1.95; ES: 0.82). During the CVRT at VMLSS, BLC from the 10th min to the end of the exercise increased significantly (0.4 ± 0.4 mmol·L−1; P = 0.02; 90% CI: 0.20–0.63; ES: 0.31), but the increment was <1 mmol·L−1 in every single case. This BLC stability criterion was obtained at ≈3.9 ± 1.3 mmol·L−1 (range ≈2.1–6.2). HR increased (P < 0.01) over the course of both VMLSS and VMLSS+0.2 CVRTs. During the VMLSS CVRT, absolute HR increased 7 ± 4 b·min−1 (P < 0.001; 90% CI: 5.0–9.0; ES: 0.70) from min 10 to the end of the test. HR (%HRmax) at min 5, 10, 21 and 32 of the VMLSS CVRT were 85 ± 3, 88 ± 3, 91 ± 4 and 92 ± 4%, respectively.
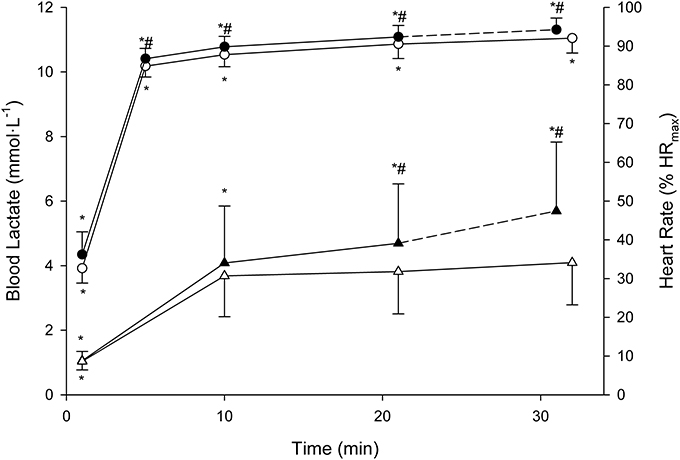
Figure 3. Mean (SD) blood lactate (triangles) and heart rate (circles) responses to the constant running velocities tests (CVRTs) at the maximal lactate steady state velocity (open symbols) and at 0.2 km·h−1 faster velocity (filled symbols). * Significantly different from the rest of the time-points within the same CVRT (P < 0.0125). #Significantly higher in comparison with the corresponding time-points at the maximal lactate steady state velocity CVRT (P < 0.0125).
Every bloody and bloodless measured endurance performance variables correlated significantly with VMLSS (Table 3). VLEmin was the best predictor of VMLSS (Figure 4), followed by VLEmin+1mM (r = 0.86; P < 0.001; SEE = 0.58; 95% CI: 0.50–1.13) and VLEmin+1.5mM (r = 0.84; P < 0.001; SEE = 0.86; 95% CI: 0.58–1.57). There was no statistical difference between VMLSS and estimated VMLSS using the formula exposed in Figure 4 (P = 0.99; 90% CI: −0.22 to 0.22; ES: 0.001). Mean bias and LOAs were 0.00 ± 0.45 km·h−1 and ±0.89 km·h−1, respectively, indicating that prediction of VMLSS from VLEmin could be biased up to 5.9% above or below actual VMLSS. VLEmin+1mM did not differ from VMLSS (P = 0.47; 90% CI: −0.17 to 0.42; ES: 0.09). Mean difference was −0.12±0.6 km·h−1 and LOAs were ±1.18 km·h−1 (±7.8%).
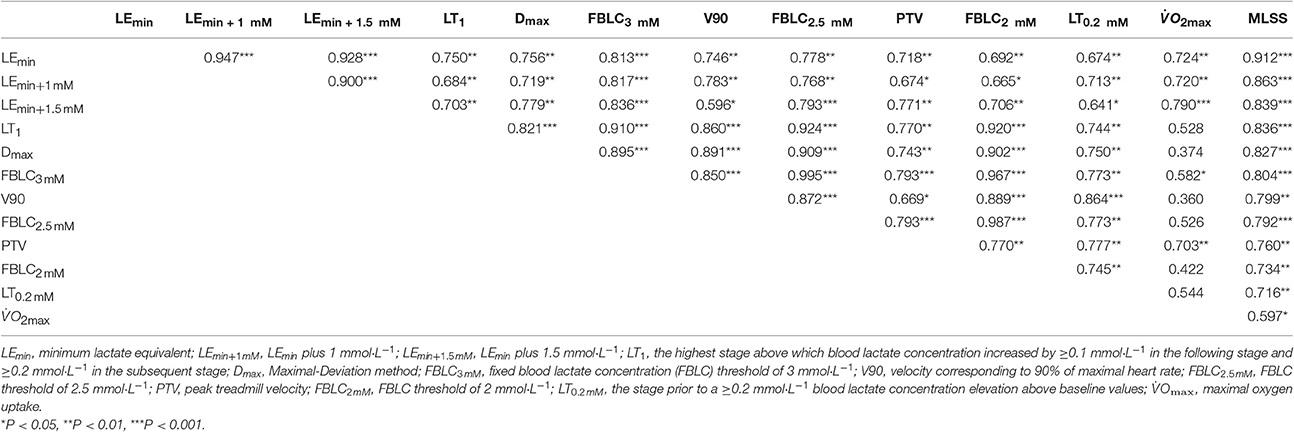
Table 3. Pearson's correlation magnitudes between the selected endurance performance variables (n = 13).
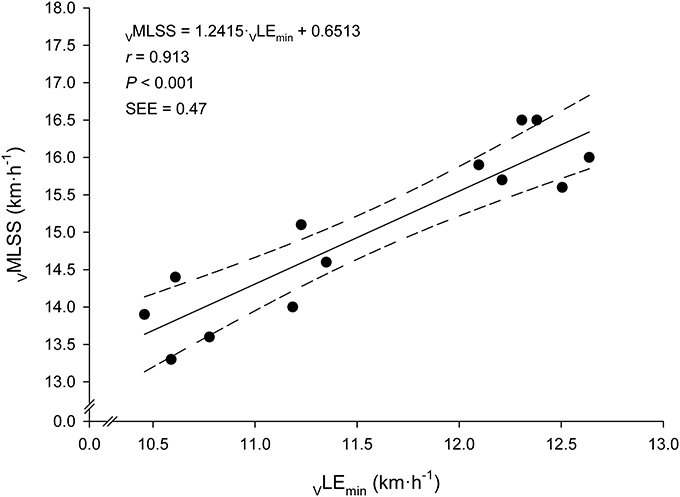
Figure 4. Linear relationship between the velocity at the Minimum Lactate Equivalent (VLEmin) and the velocity at the Maximal Lactate Steady State (VMLSS). Solid line: linear regression. Dashed lines: 95% confidence intervals.
Very large associations between VLEmin and VMLSS in absolute values (km·h−1) with their respective velocities in relative values (%PTV) were observed (Figure 5). According to the ANCOVA results, the slopes of these both regression lines were not different (P > 0.05). Very large associations were also found between HR at LEmin (HRLEmin) and HR throughout the VMLSS CVRT. These correlation magnitudes were r = 0.90 (Figure 6), r = 0.85 (P < 0.001; SEE = 4.9; 95% CI: 0.30–0.83), r = 0.79 (P = 0.004; SEE = 6.6; 95% CI: 0.25–0.96) and r = 0.74 (P = 0.009; SEE = 7.9; 95% CI: 0.20–1.06) for HR at min 5, 10, 21, and 32 of the VMLSS CVRT, respectively. Due to some technical problems with the HR monitors, HR linear regressions are based upon 11 data-points.
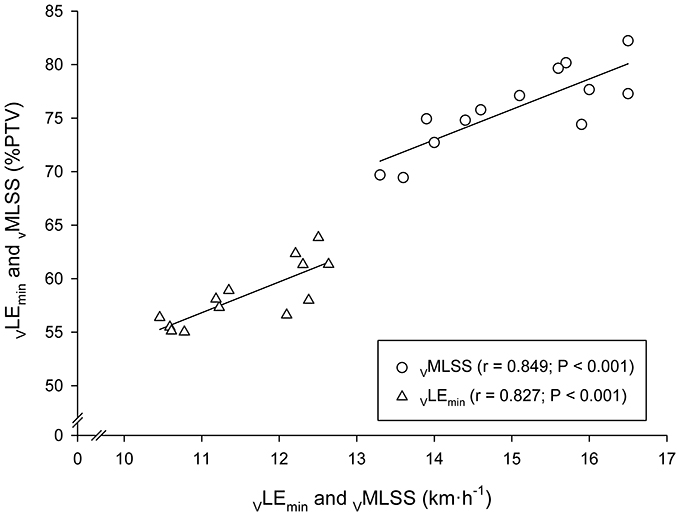
Figure 5. Linear regressions between the velocities at the Minimum Lactate Equivalent (VLEmin) and Maximal Lactate Steady State (VMLSS) in absolute values (km·h−1) with their respective velocities relative to peak treadmill velocity (PTV).
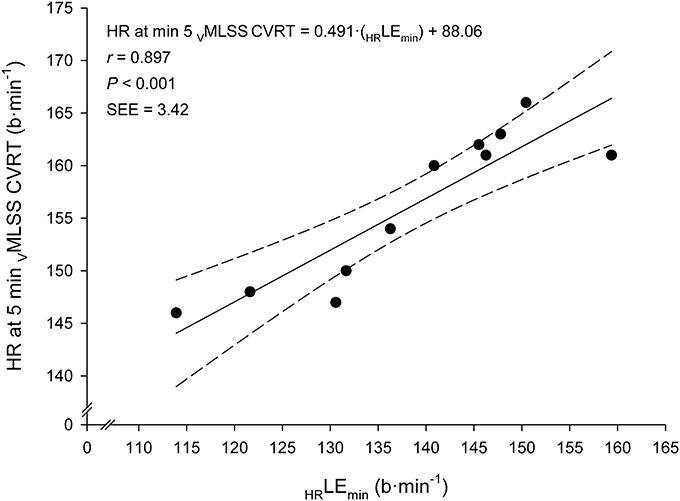
Figure 6. Linear regression between heart rate (HR) at the Lactate Minimum Equivalent (HRLEmin) and HR at min 5 of the constant velocity running test (CVRT) performed at the velocity of the maximal lactate steady state (VMLSS).
The major finding of this study was that VLEmin was the strongest predictor of VMLSS, followed by VLEmin+1mM, VLEmin+1.5mM, LT1 and the rest of the predictor variables (Table 3). These findings are in line with previous research showing that BLRTs, such as OBLA (Beneke, 1995; Van Schuylenbergh et al., 2004; Denadai et al., 2005; Vobejda et al., 2006; Figueira et al., 2008; Grossl et al., 2012), IAT (Beneke, 1995), Dmax (Van Schuylenbergh et al., 2004), LT (Philp et al., 2008), or other BLRTs (Grossl et al., 2012) obtained during an incremental single-test are significant determinants of MLSS. The high sustained variance by VLEmin in VMLSS prediction in this study (83%, Figure 4) is among the highest reported in the literature (50–88%). Homogeneity of the sample, specificity and characteristics of the test protocol, precision and stability criterion in MLSS determination, as well as the exact variables derived from the incremental test chosen for BLRTs determination are potential factors affecting correlation magnitude differences among studies. For instance, endurance trained runners in the present study were relatively homogeneous in terms of VMLSS (CV ≈7%), and determination of their MLSS was very accurate (±0.2 km·h−1; ±1.3% mean VMLSS). In contrast, study samples in the above-cited publications were more heterogeneous (CVs 7–16%) and precision in MLSS determination was much lower (7–15%), which are factors that can bias comparisons between studies. Concerning the aforementioned studies carried out in runners, LT (Philp et al., 2008) and OBLA (Vobejda et al., 2006) highly correlated with VMLSS, accounting for 72 and 81% of the variance, respectively. However, accuracy in VMLSS determination (3–4% mean VMLSS) was lower than in our study and the study samples composed of male and female runners were heterogeneous (VMLSS CVs 12–16%). It is well established that heterogeneity of the samples causes overestimation of correlation magnitudes; the greater the range or the heterogeneity of a group, the greater the magnitude of the correlation coefficient.
With regard to prediction accuracy, it is worth mentioning the relatively low SEE (0.47 km·h−1; 3.1% mean VMLSS) in VMLSS prediction from VLEmin found in this study (Figure 4). This SEE is lower than the accuracy in MLSS identification commonly utilized (as discussed in the previous paragraph) and compares favorably with other studies predicting MLSS from the intensity associated with OBLA, where SEE values of ≈5.5% (Vobejda et al., 2006; Figueira et al., 2008) and 20.7% (Figueira et al., 2008) of mean MLSS were reported for running and cycling exercise modes, respectively. The Bland-Altman's LOAs (±0.89 km·h−1; i.e., ±5.9% mean VMLSS) are also narrower compared to those of other studies predicting MLSS from LMT (±6.6% mean MLSS) (Sotero et al., 2009), OBLA (±10.3%) (Grossl et al., 2012) or other BLRTs (±9.5–16.5%) (Grossl et al., 2012). The strength of the relationship and prediction accuracy reported in the current study support LEmin to provide a better MLSS estimation than other BLRTs. This suggests VLEmin, an objective submaximal variable calculated during a SD-IRT, to be one of the best single VMLSS predictor in endurance trained runners.
The Minimum Lactate Equivalent (LEmin) concept was first described in the 1980s by German authors (Berg et al., 1980, 1990; Lehmann et al., 1983) and was suggested to objectively represent one of the two mentioned gold standard BLC thresholds, the exercise intensity level associated with the beginning of BLC accumulation above resting values during graded exercise, nowadays known as Lactate Threshold (LT). LEmin was defined as the workload corresponding to the nadir on the quadratic relationship between BLC/workload (or ) ratio vs. workload (or ) plot-data derived from an SD-IRT. Plotting BLC/workload vs. workload turns the BLC-shape during incremental exercise into a clear “U”-BLC-shape allowing the observation of BLC/workload decrement to a nadir (LEmin) just before a clear BLC/workload increment (Figure 1). In the present study average VLEmin (11.6 km·h−1) approximate average VLT1 (11.7 km·h−1) (Table 1). This suggests LEmin to represent the pivotal equilibrium point between blood lactate production and removal (Lehmann et al., 1983; Aunola and Rusko, 1988; Berg et al., 1990). LEmin might be associated with several physiological characteristics and mechanisms, such as glycolytic acceleration, muscle oxidative capacity, type II muscle fiber recruitment, intramuscular lactate production, lactate release and clearance, capillary density and increasing concentrations of circulating hormones (Ivy et al., 1980; Lehmann et al., 1983; Gladden, 2004). The reason why LEmin would offer significant prediction advantages over other BLRTs to estimate VMLSS can be related to: (1) the resolution of LEmin determination is finer than other BLRTs (e.g., LT) because all the data points before and after the transition are used to project the LEmin value; (2) undesired error effects due to statistical scatter of the data points are minimized by the least squares curve-fitting procedure; (3) LEmin could essentially take on an infinite number of values, whereas LT1 and LT0.2mM could only be based on the discrete values of the specific velocity-rate stages; (4) the troublesome identification of the first BLC elevation above baseline values (LT) due to initial BLC fluctuations associated with the error of the analyzer (Weltman et al., 1987) is resolved by the “U”-BLC-shape of LEmin identification without the need of a previous high level of exertion phase to induce hyperlactatemia, as it is required for LTM identification; and (5) relative changes in BLC based on the shape and slope of the BLC/workload vs. workload curve (i.e., LEmin) during incremental exercise may be more advantageous, sensitive and robust compared with the use of absolute BLC values (i.e., FBLC thresholds) (Dickhuth et al., 1999). The relevance of LEmin as a predictor variable is underpinned by the fact that the other two LEmin-related thresholds (LEmin+1mM and LEmin+1.5mM) were the second and third variables best correlated with VMLSS. Additionally, LEmin, LEmin+1mM and LEmin+1.5mM were the best predictors, whereas average VLEmin+1mM (15.1 km·h−1) was nearly identical to average VMLSS (15.0 km·h−1). This suggests that VLEmin+1mM may provide a close approximation of VMLSS. These results, therefore, support LE/running-velocity to be a very good predictor of the individual and group average VMLSS in endurance trained runners.
A substantial relationship (r = 0.85) was observed between VMLSS and %PTV at VMLSS. A similar correlation magnitude (r = 0.83) was observed between VLEmin and %PTV at VLEmin. According to our previous observations (Garcia-Tabar et al., 2015b; Llodio et al., 2015, 2016) and others (Hurley et al., 1984), these associations denote that those runners with higher VLEmin and VMLSS are more likely to possess their VLEmin and VMLSS at a higher %PTV (or %) compared to those runners with lower aerobic conditioning. It also indicates that %PTV and % do not adequately differentiate across subjects, and subsequently, that the relative PTV/ concept for training prescription purposes should be used with cautious (Garcia-Tabar et al., 2017). Prescribed training by relative PTV/ induces different training adaptation responses (Buchheit et al., 2010), most probably due to the differed level of metabolic acidosis across individuals at a given %PTV or % (Katch et al., 1978; Meyer et al., 1999), as Figure 5 depicts. One interesting additional finding was that VLEmin to VMLSS ratio was remarkably homogeneous among subjects (77% VMLSS, range: 74–80%) in comparison with the rest of the BLRTs exposed in Table 1 (e.g., 64–88% and 73–94% for LT1 and LT0.2mM, respectively). This low range (±3%) of the percentage of VMLSS at which vLEmin occurs is very close to the limit of the test-retest variability of MLSS workload determination (Hauser et al., 2013). This indicates that the VLEmin to VMLSS ratio is independent of the endurance capacity level of the assessed runners. Although VMLSS is substantially higher than VLEmin, it is likely that some degree of commonality exists among these two physiological parameters suggesting VLEmin as a major VMLSS determinant. Our study advocates factors controlling VLEmin to be shared, at least partly, with those controlling VMLSS.
Concerning our secondary purpose, V90 was the best bloodless predictor of VMLSS, accounting for 64% of the variance, followed by PTV (58%) and (36%) (Table 3). The magnitude of the relationship between V90 and VMLSS was similar to that between FBLC thresholds and VMLSS. In addition, V90 was a strong (r = 0.85–0.89) predictor of FBLC thresholds. These findings are in close agreement with previous HR-based studies in professional team-sport players (Garcia-Tabar et al., 2015b), elite Basque-ball players (Garcia-Tabar et al., 2017) and low-level (VMLSS ≈13.6 km·h−1) endurance runners (Kuphal et al., 2004) in which V90 was largely associated with VMLSS (Kuphal et al., 2004) and FBLC thresholds (Garcia-Tabar et al., 2015b, 2017). The relevance of V90 as a bloodless predictor of BLRTs is strengthened by (1) the relationship between V90 and BLRTs is quite stable despite alterations in BLRTs due to training, detraining or hypoxia (Hurley et al., 1984; Foster et al., 1999; Friedmann et al., 2004); (2) increases in V90 have been verified to predict longitudinal training-induced improvements in FBLC thresholds (Garcia-Tabar et al., 2017); and (3) V90 is determinable during a submaximal test, i.e., maximal exertion is not always necessary (Garcia-Tabar et al., 2017), what makes V90 sometimes more suitable than PTV and . Results indicate V90 to be an appealing variable since it is a valid, easy, noninvasive and low-cost suitable estimator of VMLSS and FBLC thresholds during a progressive running test in endurance trained runners facilitating the monitoring of aerobic conditioning.
During exercise at VMLSS, absolute HR markedly differed between subjects. Average relative HR (%HRmax), instead, was maintained within a reasonably narrow range over time (85–92% from min 5 to 30), although, in agreement with other studies in runners (Haverty et al., 1988; Llodio et al., 2016), it also significantly increased over time (Figure 3). This suggests that a HR zone, rather than a fixed absolute or relative HR value, should be considered during training sessions when the goal is to reach an exercise intensity related to VMLSS. However, the individual %HRmax values during VMLSS CVRTs varied considerably between individuals, ranging from 81 to 85% HRmax and from 85 to 98% HRmax after 5 and 30 min of exercise, respectively. This indicates that the HR zone corresponding to MLSS should be estimated on individual basis (Llodio et al., 2016). An interesting finding was the extremely large relationship observed between the individual absolute HRLEmin and the individual absolute HR values after 5 min at VMLSS (Figure 6). This association suggests that HRLEmin can be accurately used to predict HR value after 5 min at VMLSS. Determination of VLEmin and its corresponding HR is therefore advantageous over other BLRTs (e.g., LTM) whose HR values are not usable for training monitoring purposes (Messias et al., 2017, 2018).
The present study is limited in some aspects. First, the applicability of the results is limited to a homogeneous sample of relatively young male runners with VMLSS values ranging from 13.3 to 16.5 km·h−1 (i.e., VLEmin values from 10.5 to 12.6 km·h−1). It is possible that the results might differ for individuals with higher or lower VMLSS values. The same holds true for gender, because specific prediction models have not been developed for females. Second, the reported prediction equations are only recommended to be used with the specific testing procedures utilized and described in this study. It is known that BLC- and HR-based variables might be influenced by factors such as the blood sampling methods, pre-testing physical status, hydration and nutritional status, dietary or pharmacological manipulations, and environmental conditions (Halson, 2014). In addition, the choice of an appropriate initial running velocity and increment rate between stages utilized in the SD-IRT is also an essential aspect to permit fine resolution of LT and LEmin (Hollmann, 1985; Aunola and Rusko, 1988). The initial running velocity and the increment rate must be sufficiently small to allow enough data-points below the location of the LEmin to permit an adequate analysis of the two-segment model. Third, a test-retest analysis of LEmin was beyond the scope of this study, and therefore, whether LEmin is reliable was not verified. Dickhuth et al. (1999), however, found a good test-retest reproducibility (r = 0.90) of LEmin determined during a SD-IRT in young males. Finally, this study is a cross-sectional study. The almost perfect (Hopkins et al., 2009) relationship observed between VLEmin and VMLSS in this predictive cross-sectional study does not necessarily imply that changes observed over a period of time in VLEmin would predict changes in VMLSS. Further longitudinal studies are required to examine whether longitudinal training-induced changes in VMLSS could be predicted and monitored by VLEmin, as well as to clarify the degree of commonality between these two parameters. Despite these limitations, the results of the present study provide important and novel information about the prediction of MLSS from LEmin.
In conclusion, results of the current study indicate that when BLC assessment is available but only one testing session is feasible, VLEmin determined during a SD-IRT is a very good predictor of VMLSS in endurance trained runners. Average VLEmin resulted in similar mean value than the classical Lactate Threshold (LT1). Accuracy in MLSS prediction by LEmin found in this study is among the highest reported in the literature. LEmin is a continuous rather than a discrete variable and the minimum point on a U-shaped curve using the least squares curve-fitting procedure is determinable with a very fine resolution minimizing error effects due to statistical scatter of the data points. The current study, therefore, suggests VLEmin, an objective submaximal variable, to be probably the best single VMLSS predictor in endurance trained runners. If direct BLC measurement is undesirable or unfeasible, V90 is a non-invasive fairly good predictor of VMLSS. Precise estimation of VMLSS from a single-session discontinuous progressive running test is a reasonable alternative to reduce costs and considerably alleviate the burden associated with the classical MLSS assessment.
EG and IG-T equally contributed to the conception and design of the experiments; performing of the experiments; acquisition, registration, analysis and interpretation of the data; preparation of figures; and drafting of the manuscript; EG and IG-T warmly discussed about the manuscript; and critically reviewed and edited the drafts; EG and IG-T approved the final version of the manuscript.
The authors declare that the research was conducted in the absence of any commercial or financial relationships that could be construed as a potential conflict of interest.
We gratefully thank Nicolas Lopez for engineering programming, but mainly, athletes and coaches of the local regional clubs participatingin this study for their patient and stamina on MLSS assessment during the outdoor competitive season of 2013.
Aunola, S., and Rusko, H. (1988). Comparison of two methods for aerobic threshold determination. Eur. J. Appl. Physiol. Occup. Physiol. 57, 420–424. doi: 10.1007/BF00417987
Barr, D. P., and Himwich, H. E. (1923). Studies in the physiology of muscular exercise: III. Development and duration of changes in acid-base equilibrium. J. Biol. Chem. 55, 539–555
Beneke, R. (1995). Anaerobic threshold, individual anaerobic threshold, and maximal lactate steady state in rowing. Med. Sci. Sports Exerc. 27, 863–867. doi: 10.1249/00005768-199506000-00010
Berg, A., Jakob, E., Lehmann, M., Dickhuth, H. H., Huber, G., and Keul, J. (1990). Current aspects of modern ergometry. Pneumologie 44, 2–13.
Berg, A., Stippig, J., Keul, J., and Huber, G. (1980). Zur Beurteilung der Leistungsfähigkeit und Belastbarkeit von Patienten mit coronarer Herzkrankheit. Dtsch. Z. Sportmed. 31, 199–205.
Brooks, G. A. (1985). Anaerobic threshold: review of the concept and directions for future research. Med. Sci. Sports Exerc. 17, 22–34. doi: 10.1249/00005768-198502000-00005
Buchheit, M., Chivot, A., Parouty, J., Mercier, D., Al Haddad, H, Laursen, P. B., et al. (2010). Monitoring endurance running performance using cardiac parasympathetic function. Eur. J. Appl. Physiol. 108, 1153–1167. doi: 10.1007/s00421-009-1317-x
Cheng, B., Kuipers, H., Snyder, A. C., Keizer, H. A., Jeukendrup, A., and Hesselink, M. (1992). A new approach for the determination of ventilatory and lactate thresholds. Int. J. Sports Med. 13, 518–522. doi: 10.1055/s-2007-1021309
Coyle, E. F., Coggan, A. R., Hopper, M. K., and Walters, T. J. (1988). Determinants of endurance in well-trained cyclists. J. Appl. Physiol. (1985) 64, 2622–2630. doi: 10.1152/jappl.1988.64.6.2622
Denadai, B. S., Gomide, E. B., and Greco, C. C. (2005). The relationship between onset of blood lactate accumulation, critical velocity, and maximal lactate steady state in soccer players. J. Strength Cond. Res. 19, 364–368. doi: 10.1519/1533-4287(2005)19[364:TRBOOB]2.0.CO;2
Dickhuth, H. H., Yin, L., Niess, A., Röcker, K., Mayer, F., Heitkamp, H. C., et al. (1999). Ventilatory, lactate-derived and catecholamine thresholds during incremental treadmill running: relationship and reproducibility. Int. J. Sports Med. 20, 122–127. doi: 10.1055/s-2007-971105
Farrell, P. A., Wilmore, J. H., Coyle, E. F., Billing, J. E., and Costill, D. L. (1979). Plasma lactate accumulation and distance running performance. Med. Sci. Sports 11, 338–344. doi: 10.1249/00005768-197901140-00005
Faude, O., Kindermann, W., and Meyer, T. (2009). Lactate threshold concepts: how valid are they? Sports Med. 39, 469–490. doi: 10.2165/00007256-200939060-00003
Ferguson, B. S., Rogatzki, M. J., Goodwin, M. L., Kane, D. A., Rightmire, Z., and Gladden, L. B. (2018). Lactate metabolism: historical context, prior misinterpretations, and current understanding. Eur. J. Appl. Physiol. 118, 691–728. doi: 10.1007/s00421-017-3795-6
Figueira, T. R., Caputo, F., Pelarigo, J. G., and Denadai, B. S. (2008). Influence of exercise mode and maximal lactate-steady-state concentration on the validity of OBLA to predict maximal lactate-steady-state in active individuals. J. Sci. Med. Sport 11, 280–286. doi: 10.1016/j.jsams.2007.02.016
Foster, C., Fitzgerald, D. J., and Spatz, P. (1999). Stability of the blood lactate-heart rate relationship in competitive athletes. Med. Sci. Sports Exerc. 31, 578–582. doi: 10.1097/00005768-199904000-00014
Friedmann, B., Bauer, T., Menold, E., and Bärtsch, P. (2004). Exercise with the intensity of the individual anaerobic threshold in acute hypoxia. Med. Sci. Sports Exerc. 36, 1737–1742. doi: 10.1249/01.MSS.0000142307.62181.37
Garcia-Tabar, I., Eclache, J. P., Aramendi, J. F., and Gorostiaga, E. M. (2015a). Gas analyzer's drift leads to systematic error in maximal oxygen uptake and maximal respiratory exchange ratio determination. Front. Physiol. 6:308. doi: 10.3389/fphys.2015.00308
Garcia-Tabar, I., Izquierdo, M., and Gorostiaga, E. M. (2017). On-field prediction vs monitoring of aerobic capacity markers using submaximal lactate and heart rate measures. Scand. J. Med. Sci. Sports 27, 462–473. doi: 10.1111/sms.12853
Garcia-Tabar, I., Llodio, I., Sánchez-Medina, L., Ruesta, M., Ibañez, J., and Gorostiaga, E. M. (2015b). Heart rate-based prediction of fixed blood lactate thresholds in professional team-sport players. J. Strength Cond. Res. 29, 2794–2801. doi: 10.1519/JSC.0000000000000957
Gladden, L. B. (2004). Lactate metabolism: a new paradigm for the third millennium. J. Physiol. 558, 5–30. doi: 10.1113/jphysiol.2003.058701
Grossl, T., De Lucas, R. D., De Souza, K. M., and Antonacci Guglielmo, L. G. (2012). Maximal lactate steady-state and anaerobic thresholds from different methods in cyclists. Eur. J. Sport Sci. 12, 161–167. doi: 10.1080/17461391.2010.551417
Halson, S. L. (2014). Monitoring training load to understand fatigue in athletes. Sports Med. 44, S139–S147. doi: 10.1007/s40279-014-0253-z
Hauser, T., Bartsch, D., Baumgärtel, L., and Schulz, H. (2013). Reliability of maximal lactate-steady-state. Int. J. Sports Med. 34, 196–199. doi: 10.1055/s-0032-1321719
Haverty, M., Kenney, W. L., and Hodgson, J. L. (1988). Lactate and gas exchange responses to incremental and steady state running. Br. J. Sports Med. 22, 51–54. doi: 10.1136/bjsm.22.2.51
Heck, H., Mader, A., Hess, G., Mücke, S., Müller, R., and Hollmann, W. (1985). Justification of the 4-mmol/l lactate threshold. Int. J. Sports Med. 6, 117–130. doi: 10.1055/s-2008-1025824
Hedges, L. V. (1981). Distribution theory for Glass's estimator of effect size and related estimators. J. Educ. Behav. Stat. 6, 107–128 doi: 10.3102/10769986006002107
Hollmann, W. (1985). Historical remarks on the development of the aerobic-anaerobic threshold up to 1966. Int. J. Sports Med. 6, 109–116. doi: 10.1055/s-2008-1025823
Hopkins, W. G., Marshall, S. W., Batterham, A. M., and Hanin, J. (2009). Progressive statistics for studies in sports medicine and exercise science. Med. Sci. Sports Exerc. 41, 3–13. doi: 10.1249/MSS.0b013e31818cb278
Hurley, B. F., Hagberg, J. M., Allen, W. K., Seals, D. R., Young, J. C., Cuddihee, R. W., et al. (1984). Effect of training on blood lactate levels during submaximal exercise. J. Appl. Physiol. Respir. Environ. Exerc. Physiol. 56, 1260–1264. doi: 10.1152/jappl.1984.56.5.1260
Ivy, J. L., Withers, R. T., Van Handel, P. J., Elger, D. H., and Costill, D. L. (1980). Muscle respiratory capacity and fiber type as determinants of the lactate threshold. J. Appl. Physiol. Respir. Environ. Exerc. Physiol. 48, 523–527. doi: 10.1152/jappl.1980.48.3.523
Jones, A. M., and Doust, J. H. (1998). The validity of the lactate minimum test for determination of the maximal lactate steady state. Med. Sci. Sports Exerc. 30, 1304–1313. doi: 10.1097/00005768-199808000-00020
Jones, N. L., and Ehrsam, R. E. (1982). The anaerobic threshold. Exerc. Sport Sci. Rev. 10, 49–83. doi: 10.1249/00003677-198201000-00003
Katch, V., Weltman, A., Sady, S., and Freedson, P. (1978). Validity of the relative percent concept for equating training intensity. Eur. J. Appl. Physiol. Occup. Physiol. 39, 219–227. doi: 10.1007/BF00421445
Kindermann, W., Simon, G., and Keul, J. (1978). Dauertraining–Ermittlung der optimalen Trainingsherzfrequenz und Leistungsfähigkeit. Leistungssport 8, 34–39.
Krouwer, J. S. (2008). Why Bland-Altman plots should use X, not (Y+X)/2 when X is a reference method. Stat. Med. 27, 778–780. doi: 10.1002/sim.3086
Kuphal, K. E., Potteiger, J. A., Frey, B. B., and Hise, M. P. (2004). Validation of a single-day maximal lactate steady state assessment protocol. J. Sports Med. Phys. Fitness 44, 132–140. doi: 10.1097/00005768-200105001-01374
Lehmann, M., Berg, A., Kapp, R., Wessinghage, T., and Keul, J. (1983). Correlations between laboratory testing and distance running performance in marathoners of similar performance ability. Int. J. Sports Med. 4, 226–230. doi: 10.1055/s-2008-1026039
Llodio, I., Garcia-Tabar, I., Sánchez-Medina, L., Ibanez, J., and Gorostiaga, E. M. (2015). Estimation of the maximal lactate steady state in junior soccer players. Int. J. Sports Med. 36, 1142–1148. doi: 10.1055/s-0035-1554643
Llodio, I., Gorostiaga, E. M., Garcia-Tabar, I., Granados, C., and Sánchez-Medina, L. (2016). Estimation of the maximal lactate steady state in endurance runners. Int. J. Sports Med. 37, 539–546. doi: 10.1055/s-0042-102653
Messias, L. H. D., Gobatto, C. A., Beck, W. R., and Manchado-Gobatto, F. B. (2017). The lactate minimum test: concept, methodological aspects and insights for future investigations in human and animal models. Front. Physiol. 8:389. doi: 10.3389/fphys.2017.00389
Messias, L. H. D., Polisel, E. E. C., and Manchado-Gobatto, F. B. (2018). Advances of the reverse lactate threshold test: non-invasive proposal based on heart rate and effect of previous cycling experience. PLoS ONE 13:e0194313. doi: 10.1371/journal.pone.0194313
Meyer, T., Gabriel, H. H., and Kindermann, W. (1999). Is determination of exercise intensities as percentages of VO2max or HRmax adequate? Med. Sci. Sports Exerc. 31, 1342–1345. doi: 10.1097/00005768-199909000-00017
Mezzani, A., Hamm, L. F., Jones, A. M., McBride, P. E., Moholdt, T., Stone, J. A., et al. (2012). Aerobic exercise intensity assessment and prescription in cardiac rehabilitation: a joint position statement of the European Association for Cardiovascular Prevention and Rehabilitation, the American Association of Cardiovascular and Pulmonary Rehabilitation, and the Canadian Association of Cardiac Rehabilitation. J. Cardiopulm. Rehabil. Prev. 32, 327–350. doi: 10.1097/HCR.0b013e3182757050
Owles, W. H. (1930). Alterations in the lactic acid content of the blood as a result of light exercise, and associated changes in the co(2)-combining power of the blood and in the alveolar co(2) pressure. J. Physiol. 69, 214–237. doi: 10.1113/jphysiol.1930.sp002646
Philp, A., Macdonald, A. L., Carter, H., Watt, P. W., and Pringle, J. S. (2008). Maximal lactate steady state as a training stimulus. Int. J. Sports Med. 29, 475–479. doi: 10.1055/s-2007-965320
Seiler, S. (2010). What is best practice for training intensity and duration distribution in endurance athletes? Int. J. Sports Physiol. Perform. 5, 276–291. doi: 10.1123/ijspp.5.3.276
Sotero, R. C., Pardono, E., Landwehr, R., Campbell, C. S., and Simoes, H. G. (2009). Blood glucose minimum predicts maximal lactate steady state on running. Int. J. Sports Med. 30, 643–646. doi: 10.1055/s-0029-1220729
Stratton, E., O'Brien, B. J., Harvey, J., Blitvich, J., McNicol, A. J., Janissen, D., et al. (2009). Treadmill velocity best predicts 5000-m run performance. Int. J. Sports Med. 30, 40–45. doi: 10.1055/s-2008-1038761
Tegtbur, U., Busse, M. W., and Braumann, K. M. (1993). Estimation of an individual equilibrium between lactate production and catabolism during exercise. Med. Sci. Sports Exerc. 25, 620–627. doi: 10.1249/00005768-199305000-00015
Van Schuylenbergh, R., Vanden Eynde, B., and Hespel, P. (2004). Correlations between lactate and ventilatory thresholds and the maximal lactate steady state in elite cyclists. Int. J. Sports Med. 25, 403–408. doi: 10.1055/s-2004-819942
Vobejda, C., Fromme, K., Samson, W., and Zimmermann, E. (2006). Maximal constant heart rate–a heart rate based method to estimate maximal lactate steady state in running. Int. J. Sports Med. 27, 368–372. doi: 10.1055/s-2005-865717
Wasserman, K., Whipp, B. J., Koyl, S. N., and Beaver, W. L. (1973). Anaerobic threshold and respiratory gas exchange during exercise. J. Appl. Physiol. 35, 236–243. doi: 10.1152/jappl.1973.35.2.236
Weltman, A., Snead, D., Seip, R., Schurrer, R., Levine, S., Rutt, R., et al. (1987). Prediction of lactate threshold and fixed blood lactate concentrations from 3200-m running performance in male runners. Int. J. Sports Med. 8, 401–406. doi: 10.1055/s-2008-1025694
Weltman, A., Snead, D., Stein, P., Seip, R., Schurrer, R., Rutt, R., et al. (1990). Reliability and validity of a continuous incremental treadmill protocol for the determination of lactate threshold, fixed blood lactate concentrations, and VO2max. Int. J. Sports Med. 11, 26–32. doi: 10.1055/s-2007-1024757
Yeh, M. P., Gardner, R. M., Adams, T. D., Yanowitz, F. G., and Crapo, R. O. (1983). “Anaerobic threshold”: problems of determination and validation. J. Appl. Physiol. Respir. Environ. Exerc. Physiol. 55, 1178–1186. doi: 10.1152/jappl.1983.55.4.1178
Yoshida, T. (1984). Effect of exercise duration during incremental exercise on the determination of anaerobic threshold and the onset of blood lactate accumulation. Eur. J. Appl. Physiol. Occup. Physiol. 53, 196–199. doi: 10.1007/BF00776589
Keywords: lactate threshold, aerobic capacity, Owles' point, oxygen endurance performance limit, aerobic threshold, anaerobic threshold, endurance assessment, submaximal exercise testing
Citation: Garcia-Tabar I and Gorostiaga EM (2018) A “Blood Relationship” Between the Overlooked Minimum Lactate Equivalent and Maximal Lactate Steady State in Trained Runners. Back to the Old Days? Front. Physiol. 9:1034. doi: 10.3389/fphys.2018.01034
Received: 22 May 2018; Accepted: 11 July 2018;
Published: 31 July 2018.
Edited by:
Hassane Zouhal, University of Rennes 2 – Upper Brittany, FranceReviewed by:
Daniel A. Kane, St. Francis Xavier University, CanadaCopyright © 2018 Garcia-Tabar and Gorostiaga. This is an open-access article distributed under the terms of the Creative Commons Attribution License (CC BY). The use, distribution or reproduction in other forums is permitted, provided the original author(s) and the copyright owner(s) are credited and that the original publication in this journal is cited, in accordance with accepted academic practice. No use, distribution or reproduction is permitted which does not comply with these terms.
*Correspondence: Ibai Garcia-Tabar, aWJhaS5nYXJjaWEudGFiYXJAZ21haWwuY29t
Disclaimer: All claims expressed in this article are solely those of the authors and do not necessarily represent those of their affiliated organizations, or those of the publisher, the editors and the reviewers. Any product that may be evaluated in this article or claim that may be made by its manufacturer is not guaranteed or endorsed by the publisher.
Research integrity at Frontiers
Learn more about the work of our research integrity team to safeguard the quality of each article we publish.