 Laurent Schmitt
 Sarah J. Willis
 Nicolas Coulmy3
 Gregoire P. Millet
94% of researchers rate our articles as excellent or good
Learn more about the work of our research integrity team to safeguard the quality of each article we publish.
Find out more
ORIGINAL RESEARCH article
Front. Physiol., 19 July 2018
Sec. Exercise Physiology
Volume 9 - 2018 | https://doi.org/10.3389/fphys.2018.00932
This article is part of the Research TopicRecent Evolutions and Perspectives in Olympic Winter Sports Performance: to PyeongChang and Beyond…View all 19 articles
Purpose: To analyze the effects of different training strategies (i.e., mainly intensity distribution) during living high – training low (LHTL) between elite cross-country skiers and Nordic-combined athletes.
Methods: 12 cross-country skiers (XC) (7 men, 5 women), and 8 male Nordic combined (NC) of the French national teams were monitored during 15 days of LHTL. The distribution of training at low-intensity (LIT), below the first ventilatory threshold (VT1), was 80% and 55% in XC and NC respectively. Daily, they filled a questionnaire of fatigue, and performed a heart rate variability (HRV) test. Prior (Pre) and immediately after (Post), athletes performed a treadmill incremental running test for determination of O2max and O2 at the second ventilatory threshold (O2V T2), a field roller-skiing test with blood lactate ([La-]) assessment.
Results: The training volume was in XC and NC, respectively: at LIT: 45.9 ± 6.4 vs. 23.9 ± 2.8 h (p < 0.001), at moderate intensity: 1.9 ± 0.5 vs. 3.0 ± 0.4 h, (p < 0.001), at high intensity: 1.2 ± 0.9 vs. 1.4 ± 02 h (p = 0.05), in strength (and jump in NC): 7.1 ± 1.5 vs. 18.4 ± 2.7 h, (p < 0.001). Field roller-skiing performance was improved (-2.9 ± 1.6%, p < 0.001) in XC but decreased (4.1 ± 2.6%, p < 0.01) in NC. [La-] was unchanged (-4.1 ± 14.2%, p = 0.3) in XC but decreased (-27.0 ± 11.1%, p < 0.001) in NC. Changes in field roller-skiing performance and in [La-] were correlated (r = -0.77, p < 0.001). O2max increased in both XC and NC (3.7 ± 4.2%, p = 0.01 vs. 3.7 ± 2.2%, p = 0.002) but O2V T2 increased only in XC (7.3 ± 5.8%, p = 0.002). HRV analysis showed differences between XC and NC mainly in high spectral frequency in the supine position (HFSU). All NC skiers showed some signs of overreaching at Post.
Conclusion: During LHTL, despite a higher training volume, XC improved specific performance and aerobic capacities, while NC did not. All NC skiers showed fatigue states. These findings suggest that a large amount of LIT with a moderate volume of strength and speed training is required during LHTL in endurance athletes.
Live high train low (LHTL) is a hypoxic training method used by many endurance athletes (Stray-Gundersen and Levine, 1999). If correctly prescribed and monitored, LHTL has been shown to be effective for endurance athletes, including those with an initial high aerobic fitness or hemoglobin mass (Millet et al., 2017). Based on 20 years of research since the original study in Levine and Stray-Gundersen (1997), LHTL is known for inducing a 1–3% larger improvement in specific endurance performance, when compared to similar normoxic training (Bonetti and Hopkins, 2009; Millet et al., 2010). However, the responses to altitude training remain complex since hypoxia and training stresses are combined (Schmitt et al., 2006). In hypoxia, the reduced inspired pressure of oxygen (PiO2) represents an additional stress, which has been shown to alter the autonomous regulation of the nervous system and subsequently to modify responses in heart rate variability (HRV) (Schmitt et al., 2006) with a combination of increased sympathetic and decreased parasympathetic nervous activities (Sevre et al., 2001; Schmitt et al., 2006). Schmitt et al. (2006, 2008) have shown that HRV parameters are modified differently depending on the intensity of training performed in altitude. Specifically, the combination of moderate altitude (<3000 m) and low intensity training (LIT), below the first ventilatory threshold (VT1), has been shown to be quite favorable to the development of aerobic capacities (Schmitt et al., 2006, 2008). Conversely, high-intensity exercises and the training loads (TL) have to be reduced, particularly during the first 7–10 days of an altitude training camp (Millet et al., 2010). In the case that the recovery capacities of an athlete are compromised, the athlete enters an overreached state. In this case, HRV parameters help diagnosing different fatigue states (Schmitt et al., 2013, 2015).
It is of practical interest to compare different groups of athletes performing LHTL. Cross-country (XC) skiers and Nordic-combined (NC) athletes have different characteristics and training contents as reported in Norwegian elite athletes (Sandbakk et al., 2016): In XC skiers, the total annual volume was on average 794 h with 646 h (81%) of LIT, 31 h (4%) of moderate-intensity training (MIT), 46 h (6%) of high-intensity training (HIT), and 71 h (9%) of strength and speed training. In NC athletes, the total annual volume was 836 h with 435 h (52%) of LIT (representing 87% of the XC ski training), 24 h (3%) of MIT, 39 h (5%) of HIT and 338 h (40%) of strength, speed, and jump training (Sandbakk et al., 2016). It appears than the XC ski training is “polarized” (LIT > 75% of total training, 81 vs. 87%) in both XC skiers and NC athletes, whereas the total volume of aerobic training was logically much higher in XC skiers (646 vs. 435 h).
It remains unknown if these differences in training content could influence the responses to LHTL in XC skiers and NC athletes. Therefore, in the present study, we aimed to analyze the effects on performance, maximal oxygen uptake, and HRV of LHTL (same altitude, same location) in two groups of XC skiers and NC athletes. We tested the hypothesis that during the LHTL period, a difference in low-intensity training volume (with the biggest amount of LIT in XC) and more strength and speed volume would induce less HRV perturbation, fewer fatigue states, and larger aerobic and performance improvement.
Subjects were 20 elite Nordic-skiers, members of the XC skiing and NC French national teams. The characteristics of subjects were:
XC skiers group: 7 men (22.6 ± 2.8 year, 73.6 ± 5.9 kg, 179.9 ± 5.4 cm, O2max 69.3 ± 3.6 mL⋅kg-1⋅min-1), and 5 women (22.8 ± 4.1 year, 55.6 ± 4.4 kg, 163.6 ± 5.2 cm, O2max 58.9 ± 2.5 mL⋅kg-1⋅min-1).
NC group: 8 men (23.5 ± 4.5 year, 65.8 ± 3.1 kg, 176.3 ± 4.3 cm, O2max 66.1 ± 3.2 mL.ckg-1⋅min-1).
All these athletes competed in European cup or World cup levels and some were medalists in World championships.
The study design is shown in Figure 1. The study was approved by the local ethical committees (French National Conference of Research Ethics Committees; N°CPP EST I: 2014/33; Dijon, France). All experimental procedures conformed to the standards set by the Declaration of Helsinki (Harriss and Atkinson, 2015). All subjects provided written informed consent to participate in the study after having been informed in detail about the experimental procedure. Exclusion criteria for participation were any history of altitude-related sickness and health risks that could compromise the subject’s safety during training and/or hypoxic exposure. The study was performed at the French National Ski-Nordic Center which contains 11 hypoxic rooms and is located at an altitude of 1150 m. These hypoxic chambers were of medium size (15 ± 1 m2) and equipped with conventional beds. Two subjects were in each room and primarily spent time sleeping or resting between training sessions. The rooms were in normobaric hypoxic condition with FiO2 = 15.0% (2700 m) of simulated altitude and the training session were at 1150 m of real altitude. No athletes were under any medical treatment during the study.
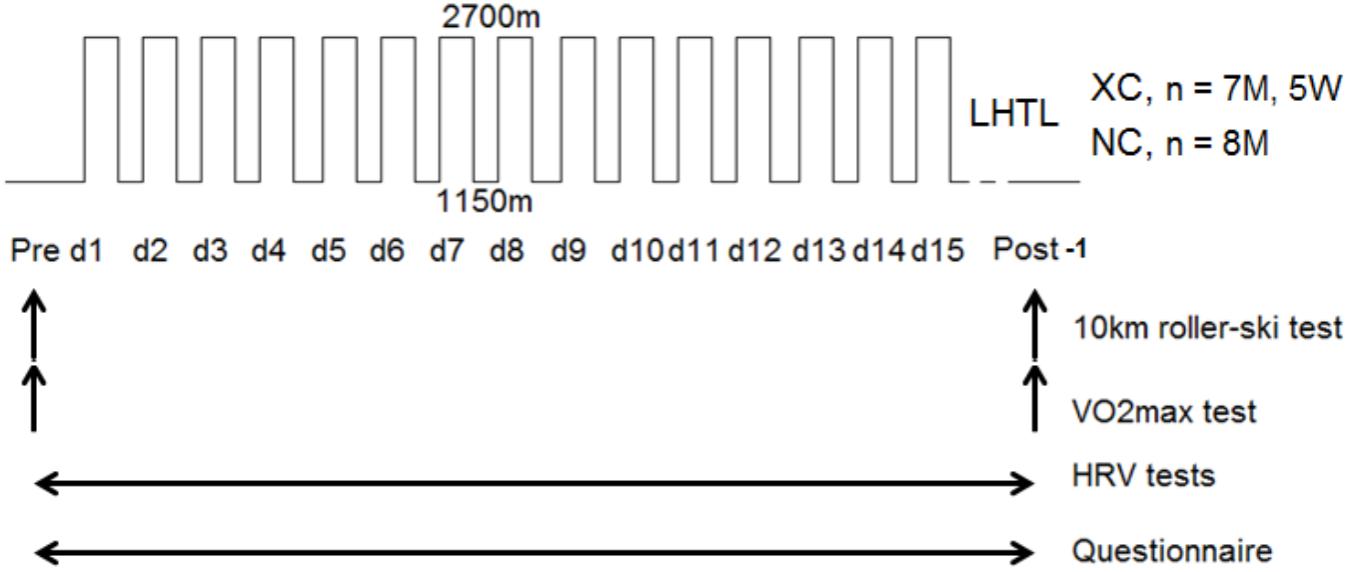
FIGURE 1. Experimental design. Cross-country skiers group (XC, men, n = 7, and women, n = 5), Nordic-combined group (NC, n = 8). The tests performed were a maximal field roller-skis test with blood lactate measurements 2 min after the end of exercise, a maximal oxygen uptake (O2max) on treadmill, a morning questionnaire upon awakening of fatigue, and an active Tilt test to measure the resting heart rate variability (HRV), and heart rate (HR). Vertical arrows indicate the day of the tests and horizontal arrows define the day-tests period.
The intensity distribution was quantified depending of the time spent in heart rate (HR) zones delimitated by the correspondence between HR and the ventilatory thresholds. The TL was organized in four training zones as presented recently (Solli et al., 2017): Intensity I for endurance training at an intensity below VT1; intensity II for endurance training at an intensity between VT1 and VT2; intensity III for training at an intensity at VT2, interval-training at intensity above VT2, and competitions; and intensity IV for strength, speed training sessions, as well as jumping for the NC group.
VT1 corresponds to the first non-linear increases in CO2, and VT2 was determined as the first rise in the ventilatory equivalent of oxygen (E/O2) without a concurrent rise in the ventilatory equivalent of carbon dioxide (E/CO2) (Reinhard et al., 1979).
Training loads were quantified as described previously (Mujika et al., 1996) but slightly adapted to Nordic skiing. TL, expressed in arbitrary units (a.u.), was calculated by multiplying the training duration (in min) spent in each intensity zone by a coefficient (i.e., 1, 2, 4, and 8 for the zones I, II, III, and IV, respectively).
For the LHTL intervention, the intensity distributions planned by the national coaches and the main investigator were 80 - 5 - 5 - 10 for the training loads in intensity zones I, II, III, and IV for XC and 55 - 15 - 5 - 25 (including 15% jumping) for NC.
Measurements were performed 1 day before (Pre) and 1 day after (Post) LHTL intervention.
A maximal roller-ski test was performed on an official FIS-accredited roller-ski asphalt track of the National French Ski-Nordic Center, with an equal alternation of up and down-hills, and flat parts. The women performed two laps, and the men three laps of 3.3 km in skating technique. Measurements were performed on each subjects’ own roller-skis and poles maintaining the same equipment use for each test.
The blood lactate concentration measurements ([La-], mmol.L-1) were performed 2 min after the end of the maximal roller-ski test with a Lactate Pro2® analyzer (ARKRAY, Japan).
The incremental running treadmill O2max protocol used in the present study is routinely used for the medical follow-up of the French Nordic-skiers in the same laboratory. The test started at 8 km.h-1 and 2%-grade for 3 min, followed by 9 km.h-1 and 2%-grade for 3 min, 9 km.h-1 and 4%-grade for 3 min, 9 km.h-1 and 6%-grade, then 10 km.h-1 and 6%-grade. Every 3 min, the stage increased first by speed, then by grade until the second ventilatory threshold (VT2) was passed. VT2 assessment was made by visual inspection of graphs of time plotted against each relevant respiratory variable measured during testing. VT2 was determined as the first rise in the ventilatory equivalent of oxygen (E/O2) without a concurrent rise in the ventilatory equivalent of carbon dioxide (E/CO2) (Reinhard et al., 1979). After VT2, the protocol changed to 1 min stages at the same speed while increasing grade to a maximum of 16% until exhaustion. The same protocol was applied at Pre and Post tests. After VT2, the protocol changed to 1 min stages at the same speed while increasing grade to a maximum of 16% until exhaustion. The O2max was determined by the highest 30 s average value. During all tests, HR was continuously monitored using a telemetry based HR monitor (Ambit3 Peak, Suunto®, Vantaa, Finland) and the maximum was obtained for further analysis. Oxygen (O2) and carbon dioxide (CO2) levels were continuously measured and monitored as breath-by-breath values in expired gas (Ultima Cardio 2® gas exchange analysis system, MGC Diagnostics with Breezesuite software, Saint Paul, MN, United States). The flow meter and the gas analyser were calibrated prior to each test with a 3L volume calibration syringe (Hans Rudholph®, Medgraphics), and with a 5% CO2 and 12% O2 gas mixtures (Medgraphics).
The questionnaire of the French society of sport medicine (QSFMS) was completed each morning by all athletes. This questionnaire is used routinely by French national teams in various sports (rugby, swimming, Nordic-ski, triathlon…). The state of fatigue was registered when the score exceeded 20 negative items out of 54 (Benhaddad et al., 1999).
The protocol of HRV tests is presented in detail in previous articles (Schmitt et al., 2013, 2015). Briefly, the HRV test consisted of a 15-min RR interval recording at rest with 8 min supine (SU) followed by 7 min standing (ST). The HRV recording was performed daily in the morning immediately after waking and voiding the urinary bladder. HRV analyses were performed on RR intervals between the 3rd and 8th min supine, and between the 9th and 14th min standing. Measurement of the interval duration between two R waves of the cardiac electrical activity were performed with a HR monitor (Ambit 3 Peak, Suunto®, Vantaa, Finland). Then the spectral power was calculated with the Fast Fourier Transform (FFT) using a software (Nevrokard® HRV, Medistar, Ljubljana, Slovenia). The power of spectral density was measured by frequency bands in ms2.Hz-1 and the spectral power was expressed in ms2 (Task, 1996). The high frequency (HF) power band (0.15–0.40 Hz) reflects alteration of the parasympathetic influence on the heart and is related to the respiratory sinus arrhythmia (Pomeranz et al., 1985). While the low frequency (LF) power band (0.04–0.15 Hz) is also driven by parasympathetic tone, and presently considered responsible for carrying vagal resonances to either changes in vasomotor tone (often sympathetic) or in central modulation of sympathetic tone (Reyes del Paso et al., 2013). The spectral power in the LF power band has also been shown to be related to fluctuations of arterial blood pressure (Akselrod et al., 1981; Pomeranz et al., 1985) and to baroreflex activity (Goldstein et al., 2011). Both in supine (SU) and in standing (ST) positions, LF and HF were calculated in absolute spectral power units (ms2) and in normalized units (nu) with LF(nu) = LF/(LF + HF) × 100 and HF(nu) = HF/(HF + LF) × 100. The total spectral power (TP) was calculated by adding LF and HF. Additionally, the temporal analysis of the square root of the mean of the sum of the squares of differences between adjacent normal R-R intervals (RMSSD) was assessed.
In the two groups, XC and NC, data were tested for equality of variance (Fisher–Snedecor F-test) and for normality (Shapiro–Wilk test). When both conditions were met, a two-way repeated measures ANOVA [group (XC vs. NC) vs. measurement (Pre and Post)] was performed with pairwise multiple comparison procedures (post hoc, Tukey method). When either equality of variance or normality were not satisfied, variables were analyzed for each condition using a Friedman test for repeated measures to determine time effects using pairwise multiple comparison procedures (Bonferroni test). In this case, differences between the groups were tested using a Mann–Whitney rank sum test. The Pearson product moment correlation was applied to analyze the relationship between specific performance and lactate concentration changes. Null hypotheses were rejected at P < 0.05. Data are reported as mean and standard deviation (SD). These analyses were completed using SigmaStat 3.5 software (Systat Software, San Jose, CA, United States).
The statistical method used to distinguish the different HRV fatigue patterns in the NC group has been detailed previously (Schmitt et al., 2015, 2016). First, the analysis focuses on the difference in absolute values between no-fatigue and fatigue conditions, where a non-parametric Mann–Witney test was used to analyze the differences. Then, the relative difference between the mean of all no-fatigue and each fatigue state were calculated. The set of relative differences was submitted to a hierarchical clustering on principal components, which includes two steps. Firstly, a principal component analysis (PCA) was performed to disclose the organization of variables and to select the PCA dimensions which embed the main part of variance. Secondly, a hierarchical ascendant classification was performed according to the first dimensions of the PCA. This process limits the statistical signal to noise ratio and delineates clusters of individuals with similar characteristics. These analyses were conducted using the R-statistics software (V3.1.2) with the FactoMineR package.
In the 3 weeks preceding the LHTL intervention, both weekly TL and training volume were not different between XC (1557 ± 141 a.u., 16.0 ± 1.6 h) and NC (1733 ± 304 a.u., 16.5 ± 2.6 h). The training load and training volume of the LHTL period are shown in Figure 2. The intensity distribution for both groups are reported in Table 1.
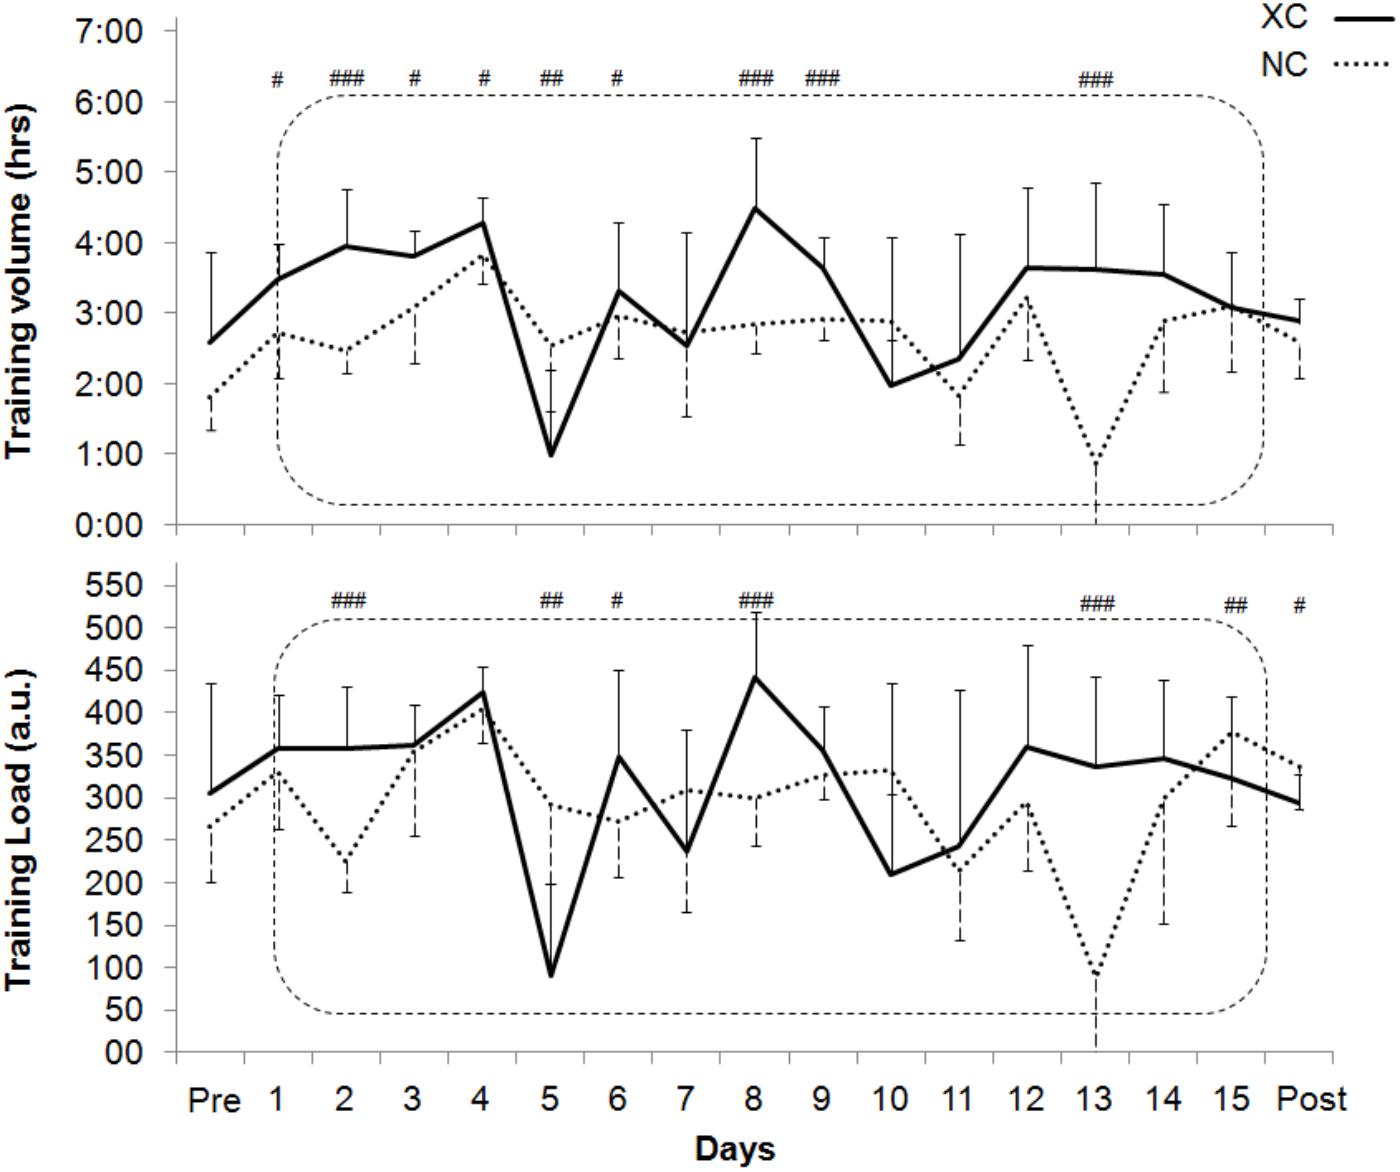
FIGURE 2. Volume of training (h), and training load (TL, in arbitrary unit, a.u.) performed during the Live High - Train Low study in the cross-country skiers (XC) and the Nordic-combined (NC) groups. With #p < 0.05, ##p < 0.01, ###p < 0.001 for differences between XC and NC.
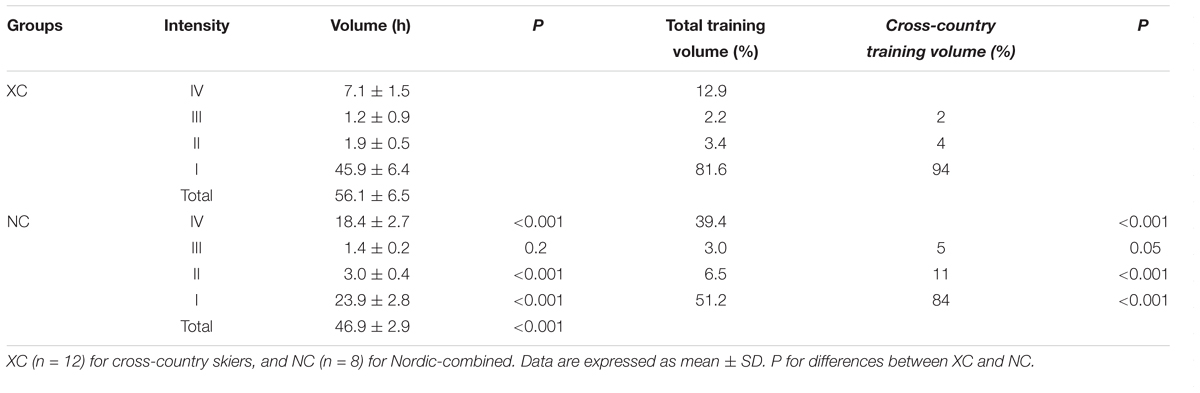
TABLE 1. Content of the training performed in intensity zones with I for low-intensity training (LIT) below the first ventilatory threshold (VT1), II for moderate-intensity training (MIT) between VT1 and second ventilatory threshold (VT2), III for high-intensity training (HIT) upper than VT2, and IV for strength, speed training sessions, and jumping (only for Nordic-combined).
Absolute values at Pre and Post are presented in Table 2.
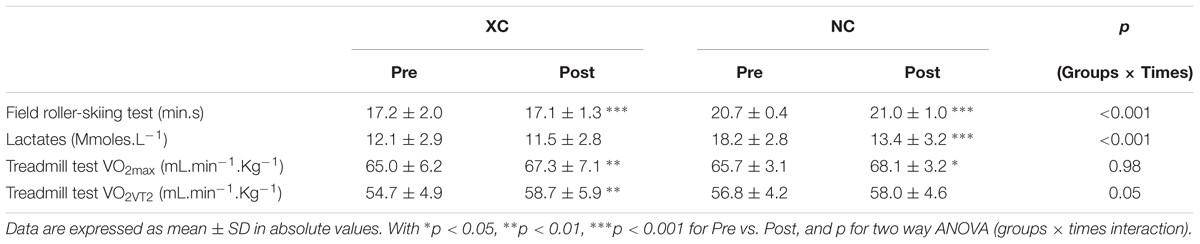
TABLE 2. In cross-country (XC) skiers (n = 12) and Nordic-combined (NC) athletes (n = 8) groups respectively, field maximal roller-skiing test (min.s), Lactates (Mmoles.L-1) measured 2 min after the end of the roller-skiing test, maximal oxygen uptake (O2max, mL.mn-1.kg-1), and oxygen consumption at the second ventilatory threshold (VT2) (O2V T2, mL.mn-1.kg-1) at Pre and Post.
The roller-ski performance was improved (-2.9 ± 1.6%, p < 0.001) in XC but decreased (4.1 ± 2.6%, p < 0.01) in NC (Figure 3). There was a significant group × measurement interaction (p < 0.001) (Table 2).
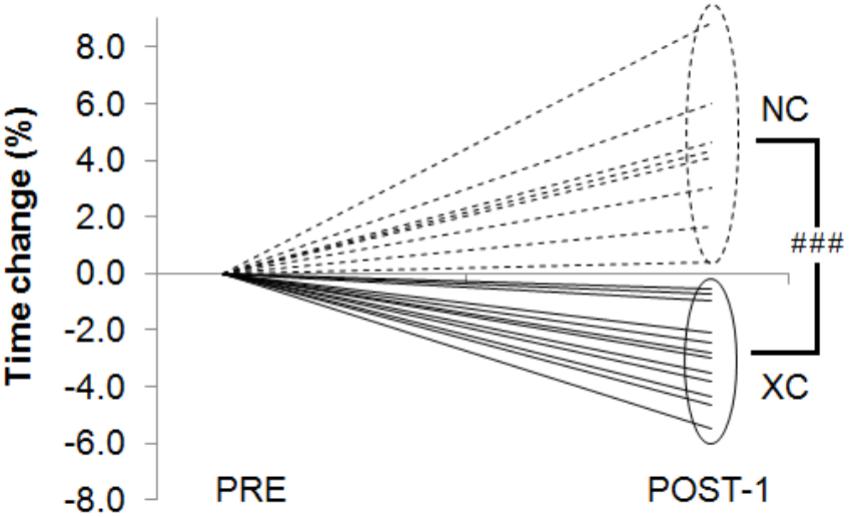
FIGURE 3. Time change (%) in the field roller-skiing test between Pre and Post in the cross-country skiers (XC) and the Nordic-combined (NC) groups. With ###p < 0.001 for differences between XC and NC.
[La-] did not change (-4.1 ± 14.2%, p = 0.3) in XC but was decreased in NC (-27.0 ± 11.1%, p < 0.001). There was a significant group × measurement interaction (p < 0.001). A negative correlation (r = -0.77, p < 0.001) was found between the changes in [La-] and in roller-ski performance time (Figure 4).
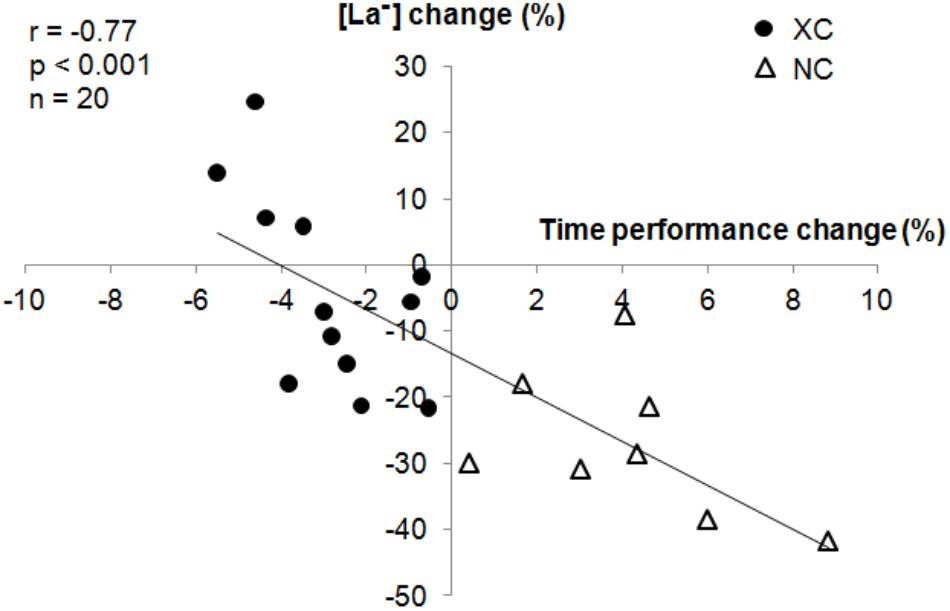
FIGURE 4. Correlation between changes (%) in blood lactate concentration ([La-]) and maximal field roller-skiing performance.
Absolute values at Pre and Post are presented in Table 2. From Pre to Post, maximal oxygen uptake (O2max) increased in both groups (XC: 65.0 ± 6.2 vs. 67.3 ± 7.1 mL.mn-1.kg-1, p = 0.01; NC: 65.7 ± 3.1 vs. 68.1 ± 3.2 mL.mn-1.kg-1, p = 0.002). The percent increase was not different between the two groups (3.7 ± 4.2%, p = 0.01 vs. 3.7 ± 2.2%, p = 0.002, for XC and NC, respectively). Oxygen consumption at VT2 (O2V T2) increased only in XC from Pre to Post-1 (7.3 ± 5.8%, p = 0.004 vs. 1.6 ± 4.3%, p = 0.31, for XC and NC, respectively).
None of the XC or NC subjects declared a state of fatigue during the LHTL intervention and no difference in QSFMS scores were found between the groups (1.6 ± 1.5 a.u. in XC vs. 1.2 ± 1.4 a.u. in NC).
The HRV parameters are displayed in Table 3. A trend was observed in difference of change between XC and NC (group × measurement interaction) in HFSU (p = 0.05) and RMSSDSU (p = 0.1).
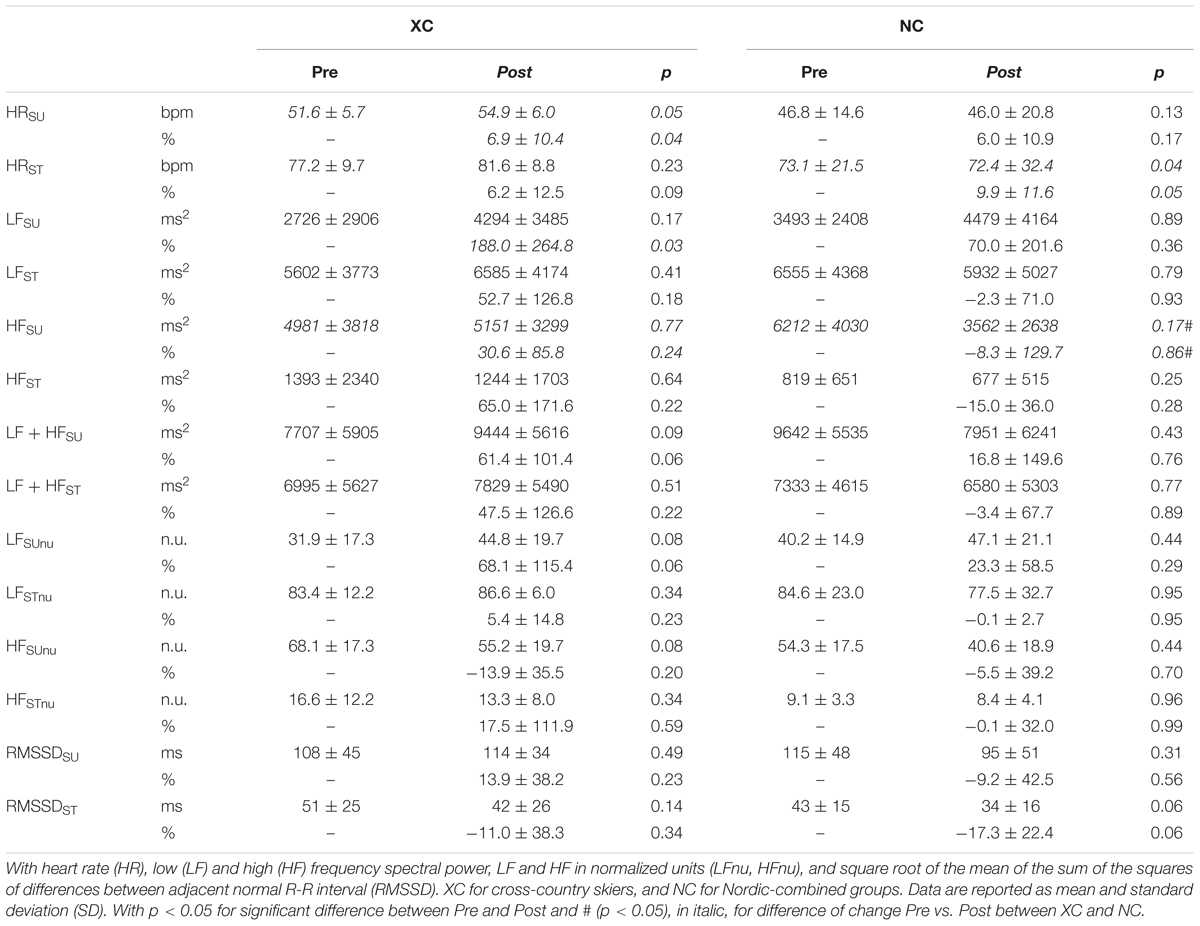
TABLE 3. Heart rate and heart rate variability (HRV) parameters (in absolute and relative units) in supine (SU) and standing (ST) positions, 1 day before (Pre) and 1 day after (Post) live high – train low (LHTL) intervention.
No fatigue states were observed in XC. In NC, four types of fatigue (F) were statistically sorted: F(LFSU+) for 1 subject, F(HFSU- LFST-) for 5 subjects, F(LF-HF-)ST, and F(LF-HF-)SU for one subject each (Figure 5).
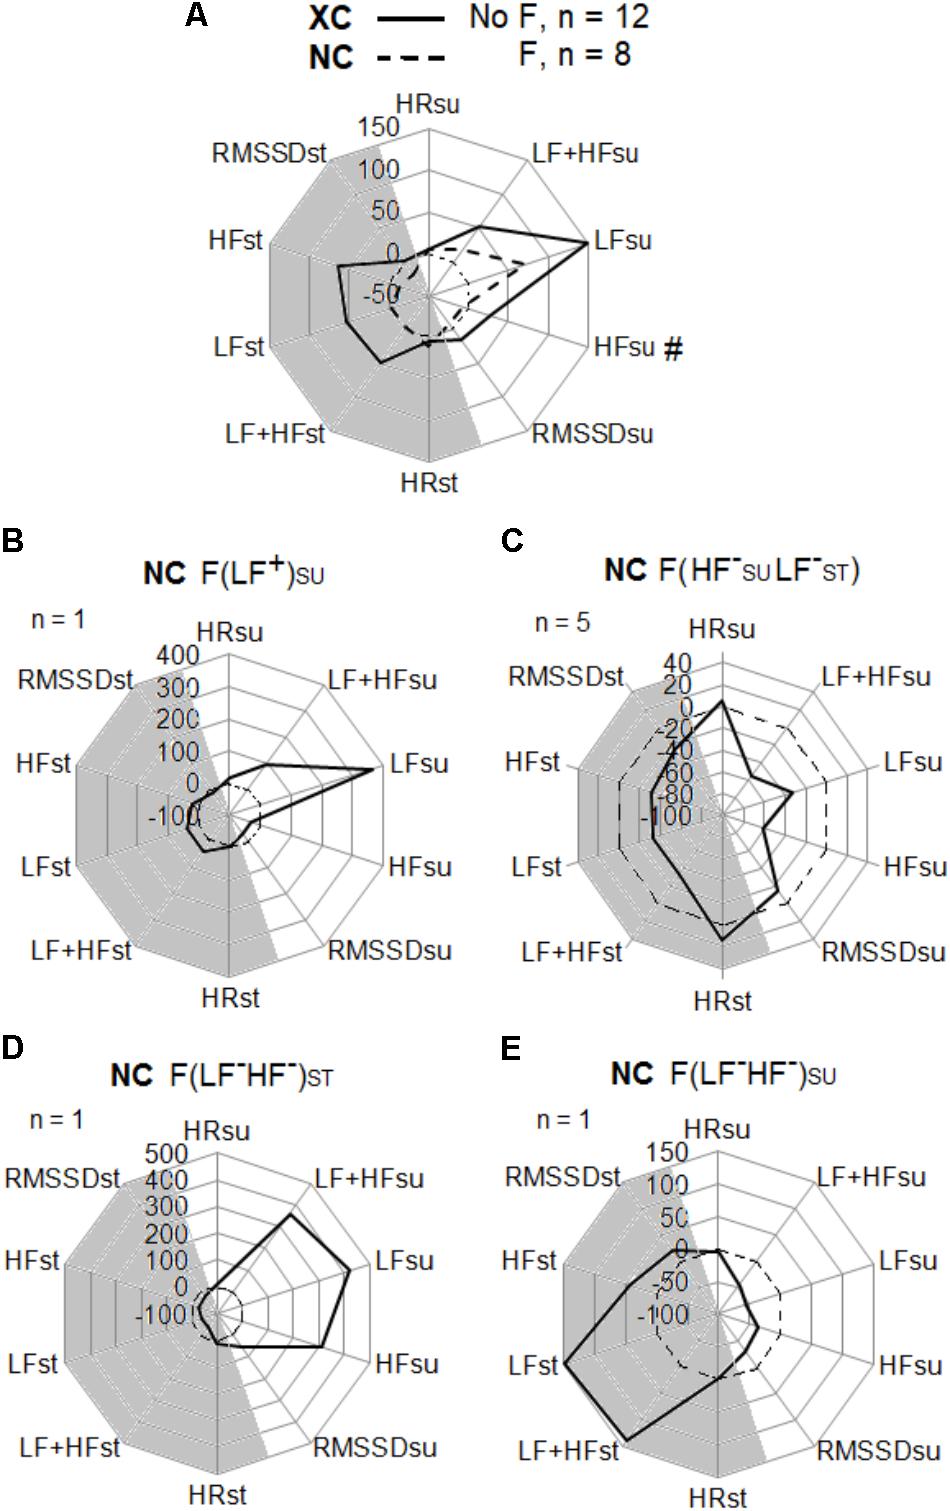
FIGURE 5. Heart rate variability, and heart rate change (%) between Pre and Post tests in the cross-country skiers (XC) and the Nordic-combined (NC) groups. HRV parameters in supine (SU) and standing (ST) positions with high (HF) and low (LF) spectral frequency powers, the addition of LF + HF, the temporal analysis of the square root of the mean of the sum of the squares of differences between adjacent normal R-R intervals (RMSSD), and the heart rate (HR). (A) XC (n = 12) with no fatigue (NF), and NC (n = 8) with fatigue (F). Fatigue (F) types were statistically sorted in NC: (B) F(LF+)SU for fatigue with LFSU increased, (C) F(HF-SULF-ST) for fatigue with HFSU and LFST decreased, (D) F(LF-HF-)ST for fatigue with LFST and HFST decreased, (E) F(LF-HF-)SU for fatigue with LFSU and HFSU decreased.
The main findings of this study were:
(1) LHTL induced specific endurance performance enhancement in XC but not in NC skiers, with a larger training volume in XC. The different total training intensity distribution between the two groups: in XC, 82-2-3-13 (i.e., ∼82% of TL < VT1) vs. in NC, 51-6-3-39 (i.e., ∼51% of TL < VT1), led to a specific (roller-skiing) performance enhancement in 100% of the XC subjects whereas it induced a performance decrease in all NC subjects.
(2) This was concomitant to different HRV responses between the groups since only NC athletes displayed fatigue states.
The training content of the present athletes is similar to the values reported in Norwegian athletes (Sandbakk et al., 2016). Of interest is that both TL and training volume were higher in XC skiers than in NC athletes (Figure 2 and Table 1). The XC skiing training performed by both groups is in accordance with the recommendation of the “polarized training” ‘75-5-20’ by Seiler (2010).
The training method named “polarized training” emphasizes the major influence of a high training volume performed at LIT (e.g., below the first ventilatory threshold, VT1) (Seiler and Kjerland, 2006). At the other range of the intensities spectrum, HIT is also a critical training component of all successful endurance athletes. It has been suggested (Seiler and Kjerland, 2006) that a ‘75-5-20’ training load (TL) distribution across the three intensity zones demarcated by VT1 and the second ventilatory threshold (VT2) would be optimal. Recently the intensity distribution ‘92-3-5’ was reported in the World’s most successful female XC skier over a 12-year period (Solli et al., 2017). Furthermore, “polarized” intensity distribution (‘80-12-8’) was more effective than “threshold training” (‘65-27-8’) in sub-elite runners over an 18-week period (10.4 km performance improvement of 157 vs. 121 s) (Esteve-Lanao et al., 2007). The XC training was polarized in NC athletes, but the high volume of strength-speed-jump training necessary for ski jumping performance possibly decreased the “polarization” influence (only 51% of TL at LIT). One may question if this low LIT volume would explain partly why LHTL was less effective in NC compared with XC.
The present results suggest that performing a high LIT volume is paramount during LHTL. In our view, this is particularly relevant and the “polarized” distribution is a prerequisite for inducing beneficial adaptations during altitude/hypoxic training period. It is known that training at LIT stimulates the parasympathetic branch of the neuro-vegetative system (Mourot et al., 2004). This type of training permits to avoid the onset of hypoxia-induced fatigue and is therefore effective for improving aerobic capacities and performance (Seiler et al., 2007; Schmitt et al., 2008). In NC, one may hypothesize that the pyramidal organization of the training intensities led to the observed misbalance in neuro-vegetative activity. The combination of a relative low stimulation effect of 51% of LIT on the parasympathetic activity and a high stress effect of 39% of strength-speed-jump training on the sympathetic activity could induce a fatigue effect and the subsequent decrease in specific performance reported in NC.
The large decrease in [La-] observed only in NC (Table 2) suggests a large reduction in the glycolysis and glycogenosis maximal power of these subjects. The correlation (r = -0.77) between [La-] and time in the roller-ski test illustrates the influence of the glycolysis power in maximal endurance performance, as previously described (Urhausen and Kindermann, 2002). The [La-] decrement during maximal aerobic exercise has been shown as a marker of fatigue (Meeusen et al., 2013). It is important to observe that the XC subjects did not degrade in glycolysis maximal power despite a large volume at LIT whereas at the opposite of the NC athletes who performed less LIT. One possible explanation for this could come from the autonomous fatigue induced by the combination of hypoxic exposure and the high volume of strength, speed training sessions, and jumping in the NC subjects.
Training loads was similar in XC and NC in the 3 weeks preceding LHTL and similar HR and HRV parameters were observed at Pre between XC and NC groups. Despite obvious physiological differences between these two groups, one could postulate that the fitness level was satisfying for both XC and NC at the beginning of LHTL.
The QSFMS questionnaire did not identify any fatigue during LHTL in both XC and NC. However, a HRV difference was observed in HF in supine position (Table 3), suggesting a lesser alteration of the neuro-vegetative balance in the XC group.
The current results are in accordance with those of Seiler et al. (2007), which demonstrated that highly trained athletes performing exercise for ≤120 min below the first ventilatory threshold (VT1) showed minimal disturbance in autonomic nervous system (ANS). Particularly in HRV temporal analysis with RMSSD and in spectral analysis with HF, these authors reported that the post-exercise parasympathetic reactivation/recovery was very fast. VT1 can be considered as a “binary” threshold for recovery in elite endurance athletes (Seiler et al., 2007).
In NC, four types of fatigue (F) were statistically determined (Figure 5). These types of fatigue were already described on Nordic-skiers (Schmitt et al., 2015) and in a swimming Olympic champion (Schmitt et al., 2016). For one subject, the fatigue type named F(LFSU+) was identified with increases in supine low frequency (LFSU) in spectral energy and in HR. This fatigue state represents a hypertonicity in sympathetic activity. The main type of fatigue F(HFSU- LFST-) was observed in five subjects and corresponds to a decrease in LF and high (HF) frequency observed in both supine and standing positions and accompanied by an increased HR. It presents a state of hypotonicity in the two branches (sympathetic and parasympathetic) of the neuro-vegetative system. For one subject, the fatigue type named F(LF-HF-)ST was characterized by a decrease in standing LF accompanied by an increase in HR. Finally for one subject, the fatigue type named F(LF-HF-)SU showed decreased LF and HF only in the supine position with increased HR and is related to a parasympathetic hypotonia (Seiler et al., 2007).
One important point of the present study is that these fatigue states were systematically associated to a decreased performance observed in all NC athletes but were not diagnosed by the questionnaire. This reinforces the practical usefulness of HRV that appears very sensitive to acute onset of fatigue in endurance athletes (Schmitt et al., 2015, 2016).
Several results of this study provide practical applications for sports coaches and researchers.
First, we confirm the effectiveness of LHTL in endurance athletes (as in the present elite XC skiers) as shown for 20 years in most of the existing literature (Bonetti and Hopkins, 2009; Millet et al., 2017) but also in excellent case studies (Solli et al., 2017). In addition, our results suggest that a large LIT volume is paramount during LHTL. We recommend having at least 80% of training time at LIT.
All the NC athletes reported a fatigue state at the end of LHTL. They had to perform a high percentage of strength and ski jumping training. This training in zone IV is focused on the development of force-speed and combined with a moderate volume of LIT could produce fatigue in LHTL. The present LHTL training content seems therefore less beneficial in NC athletes than in XC skiers.
Further research is needed to investigate if the addition/combination of recent hypoxic methods as resistance training in hypoxia or repeated sprint training in hypoxia (Girard et al., 2017) would be valuable in NC athletes.
The main limitation concerns the design of the study. With a small number of subjects in NC (only eight subjects of the A and B French national teams), it was not statistically possible to split the group in two conditions; i.e., predominance of LIT vs. lower LIT content. Amendment of the training distribution is very difficult with elite athletes and to our knowledge there are only descriptive studies in this area with World-level athletes.
It is an applied study in ecological situation with “true” elite athlete; i.e., competing in European and World cups. Another strength is that the HRV fatigue states were related to the specific performance decrease. This reinforces the usefulness of monitoring different fatigue sub-categories as previously described by our research group (Schmitt et al., 2015, 2016).
The present study showed that LHTL was beneficial in XC skiers but not in NC athletes. The training intensity distribution (i.e., ∼82% of LIT) of the XC group led to a specific (roller-ski) performance enhancement in 100% of the subjects whereas the lower LIT volume, and higher strength and speed training intensity distribution (i.e., ∼51% of LIT; ∼39% of strength and speed training) of the NC group induced an altered performance in all subjects, identified as overreached.
LS and GM designed the experimental protocol. LS, SW, NC, and GM performed the data collection and analysis. LS and GM wrote the manuscript. LS, SW, NC, and GM read and approved the final manuscript.
The authors declare that the research was conducted in the absence of any commercial or financial relationships that could be construed as a potential conflict of interest.
We thank the athletes of the French national XC skiing (men and women) and NC teams, and their coaches; for XC skiing: Vincent Vittoz and Thibaut Chene, for NC: Jérôme Laheurte and Cyril Michaud-Fidey.
Akselrod, S., Gordon, D., Ubel, F. A., Shannon, D. C., Berger, A. C., and Cohen, R. J. (1981). Power spectrum analysis of heart rate fluctuation: a quantitative probe of beat-to-beat cardiovascular control. Science 213, 220–222. doi: 10.1126/science.6166045
Benhaddad, A., Bouix, D., Khaled, S., Micallef, J. P., Mercier, J., Bringer, J., et al. (1999). Early hemorheologic aspects of overtraining in elite athletes. Clin. Hemorheol. Microcirc. 20, 117–125.
Bonetti, D. L., and Hopkins, W. G. (2009). Sea-level exercise performance following adaptation to hypoxia: a meta-analysis. Sports Med. 39, 107–127. doi: 10.2165/00007256-200939020-00002
Esteve-Lanao, J., Foster, C., Seiler, S., and Lucia, A. (2007). Impact of training intensity distribution on performance in endurance athletes. J. Strength Cond. Res. 21, 943–949.
Girard, O., Brocherie, F., and Millet, G. P. (2017). Effects of altitude/hypoxia on single- and multiple-sprint performance: a comprehensive review. Sports Med. 47, 1931–1949. doi: 10.1007/s40279-017-0733-z
Goldstein, D. S., Bentho, O., Park, M. Y., and Sharabi, Y. (2011). Low-frequency power of heart rate variability is not a measure of cardiac sympathetic tone but may be a measure of modulation of cardiac autonomic outflows by baroreflexes. Exp. Physiol. 96, 1255–1261. doi: 10.1113/expphysiol.2010.056259
Harriss, D., and Atkinson, G. (2015). Ethical standards in sports and exercise science research: 2016 update. Int. J. Sports Med. 36, 1121–1124. doi: 10.1055/s-0035-1565186
Levine, B. D., and Stray-Gundersen, J. (1997). “Living high-training low”: effect of moderate-altitude acclimatization with low-altitude training on performance. J. Appl. Physiol. 83, 102–112. doi: 10.1152/jappl.1997.83.1.102
Meeusen, R., Duclos, M., Foster, C., Fry, A., Gleeson, M., Nieman, D., et al. (2013). Prevention, diagnosis, and treatment of the overtraining syndrome: joint consensus statement of the European College of Sport Science and the American College of Sports Medicine. Med. Sci. Sports Exerc. 45, 186–205. doi: 10.1249/MSS.0b013e318279a10a
Millet, G. P., Chapman, R. F., Girard, O., and Brocherie, F. (2017). Is live high-train low altitude training relevant for elite athletes? Flawed analysis from inaccurate data. Br. J. Sports Med. doi: 10.1136/bjsports-2017-098083 [Epub ahead of print].
Millet, G. P., Roels, B., Schmitt, L., Woorons, X., and Richalet, J. P. (2010). Combining hypoxic methods for peak performance. Sports Med. 40, 1–25. doi: 10.2165/11317920-000000000-00000
Mourot, L., Bouhaddi, M., Perrey, S., Rouillon, J. D., and Regnard, J. (2004). Quantitative Poincare plot analysis of heart rate variability: effect of endurance training. Eur. J. Appl. Physiol. 91, 79–87. doi: 10.1007/s00421-003-0917-0
Mujika, I., Busso, T., Lacoste, L., Barale, F., Geyssant, A., and Chatard, J. C. (1996). Modeled responses to training and taper in competitive swimmers. Med. Sci. Sports Exerc. 28, 251–258. doi: 10.1097/00005768-199602000-00015
Pomeranz, B., Macaulay, R. J., Caudill, M. A., Kutz, I., Adam, D., Gordon, D., et al. (1985). Assessment of autonomic function in humans by heart rate spectral analysis. Am. J. Physiol. 248, 151–153. doi: 10.1152/ajpheart.1985.248.1.H151
Reinhard, U., Muller, P. H., and Schmulling, R. M. (1979). Determination of anaerobic threshold by the ventilation equivalent in normal individuals. Respiration 38, 36–42. doi: 10.1159/000194056
Reyes del Paso, G. A., Langewitz, W., Mulder, L. J., Van Roon, A., and Duschek, S. (2013). The utility of low frequency heart rate variability as an index of sympathetic cardiac tone: a review with emphasis on a reanalysis of previous studies. Psychophysiology 50, 477–487. doi: 10.1111/psyp.12027
Sandbakk, O., Rasdal, V., Braten, S., Moen, F., and Ettema, G. (2016). How do world-class nordic combined athletes differ from specialized cross-country skiers and ski jumpers in sport-specific capacity and training characteristics? Int. J. Sports Physiol. Perform. 11, 899–906. doi: 10.1123/ijspp.2015-0285
Schmitt, L., Fouillot, J. P., Millet, G. P., Robach, P., Nicolet, G., Brugniaux, J., et al. (2008). Altitude, heart rate variability and aerobic capacities. Int. J. Sports Med. 29, 300–306. doi: 10.1055/s-2007-965355
Schmitt, L., Hellard, P., Millet, G. P., Roels, B., Richalet, J. P., and Fouillot, J. P. (2006). Heart rate variability and performance at two different altitudes in well-trained swimmers. Int. J. Sports Med. 27, 226–231. doi: 10.1055/s-2005-865647
Schmitt, L., Regnard, J., Auguin, D., and Millet, G. (2016). Monitoring training and fatigue status with heart rate variability: case study in a swimming Olympic champion. J. Fit. Res. 5, 38–45.
Schmitt, L., Regnard, J., Desmarets, M., Mauny, F., Mourot, L., Fouillot, J. P., et al. (2013). Fatigue shifts and scatters heart rate variability in elite endurance athletes. PLoS One 8:e71588. doi: 10.1371/journal.pone.0071588
Schmitt, L., Regnard, J., Parmentier, A. L., Mauny, F., Mourot, L., Coulmy, N., et al. (2015). Typology of “fatigue” by heart rate variability analysis in elite Nordic-skiers. Int. J. Sports Med. 36, 999–1007. doi: 10.1055/s-0035-1548885
Seiler, K. S., and Kjerland, G. O. (2006). Quantifying training intensity distribution in elite endurance athletes: is there evidence for an “optimal” distribution? Scand. J. Med. Sci. Sports 16, 49–56. doi: 10.1111/j.1600-0838.2004.00418.x
Seiler, S. (2010). What is best practice for training intensity and duration distribution in endurance athletes? Int. J. Sports Physiol. Perform. 5, 276–291. doi: 10.1123/ijspp.5.3.276
Seiler, S., Haugen, O., and Kuffel, E. (2007). Autonomic recovery after exercise in trained athletes: intensity and duration effects. Med. Sci. Sports Exerc. 39, 1366–1373. doi: 10.1249/mss.0b013e318060f17d
Sevre, K., Bendz, B., Hanko, E., Nakstad, A. R., Hauge, A., Kasin, J. I., et al. (2001). Reduced autonomic activity during stepwise exposure to high altitude. Acta Physiol. Scand. 173, 409–417. doi: 10.1046/j.1365-201X.2001.00925.x
Solli, G. S., Tonnessen, E., and Sandbakk, O. (2017). The training characteristics of the world’s most successful female cross-country skier. Front. Physiol. 8:1069. doi: 10.3389/fphys.2017.01069
Stray-Gundersen, J., and Levine, B. D. (1999). “Living high and training low” can improve sea level performance in endurance athletes. Br. J. Sports Med. 33, 150–151. doi: 10.1136/bjsm.33.3.150
Task, F. (1996). Heart rate variability. Standards of measurement, physiological interpretation, and clinical use. Task force of the European society of cardiology and the North American society of pacing and electrophysiology. Eur. Heart J. 17, 354–381. doi: 10.1093/oxfordjournals.eurheartj.a014868
Keywords: altitude training, performance, Nordic-ski, fatigue, heart rate variability
Citation: Schmitt L, Willis SJ, Coulmy N and Millet GP (2018) Effects of Different Training Intensity Distributions Between Elite Cross-Country Skiers and Nordic-Combined Athletes During Live High-Train Low. Front. Physiol. 9:932. doi: 10.3389/fphys.2018.00932
Received: 24 March 2018; Accepted: 25 June 2018;
Published: 19 July 2018.
Edited by:
Martin Burtscher, Universität Innsbruck, AustriaReviewed by:
Ginés Viscor, University of Barcelona, SpainCopyright © 2018 Schmitt, Willis, Coulmy and Millet. This is an open-access article distributed under the terms of the Creative Commons Attribution License (CC BY). The use, distribution or reproduction in other forums is permitted, provided the original author(s) and the copyright owner(s) are credited and that the original publication in this journal is cited, in accordance with accepted academic practice. No use, distribution or reproduction is permitted which does not comply with these terms.
*Correspondence: Gregoire P. Millet, Z3JlZ29pcmUubWlsbGV0QHVuaWwuY2g=
Disclaimer: All claims expressed in this article are solely those of the authors and do not necessarily represent those of their affiliated organizations, or those of the publisher, the editors and the reviewers. Any product that may be evaluated in this article or claim that may be made by its manufacturer is not guaranteed or endorsed by the publisher.
Research integrity at Frontiers
Learn more about the work of our research integrity team to safeguard the quality of each article we publish.