- 1Department of Emergency Medicine, Tianjin Medical University General Hospital, Tianjin, China
- 2Hôpital de l'amitié Sino-Congolaise, Brazzaville, Congo
- 3School of Nursing, Tianjin Medical University, Tianjin, China
- 4Department of Neonatology, Tianjin Central Hospital of Gynecology Obstetrics, Tianjin, China
- 5International Diagnosis and Treatment Center, Tianjin First Central Hospital, Tianjin, China
- 6Educational Technology and Laboratory Management Centre, Tianjin Foreign Studies University, Tianjin, China
Objectives: The aim of this study was to investigate coronavirus disease 2019 (COVID-19) epidemic characteristics in Africa and provide some references to prevent pandemic.
Methods: We collect information of the laboratory-confirmed case of COVID-19 that has been reported since April 28, 2020 in Africa, describe the epidemic characteristics in different regions of Africa, and predict the spread trend.
Results: (1) There are 35,309 COVID-19 cases and 1,522 deaths in 54 African countries. Both case amount and death toll in Northern Africa are higher than those in other African regions, whereas the case fatality rate (CFR) in Africa is lower than that of the world. (2) Among the 54 countries in Africa, 39 of them (72.22%) report confirmed cases between 1 and 499. (3) In total, 596,146 tests have been conducted in 35 countries, and 28,271 patients have been confirmed, with a positive rate of 4.74%. However, there are only 335 tests (interquartile range: 145.5–874) for every 1 million people in Africa. (4) The number of infection cases will increase to around 150,000 at the end of May according to our model.
Conclusion: In Africa, COVID-19 spreads faster while with a relatively lower CFR, and it may be related to higher young people ratio. In addition, test intensity of COVID-19 is obviously insufficient in Africa.
Introduction
Since the first coronavirus disease 2019 (COVID-19) case was reported in Wuhan, China, a dramatically increasing number of cases had been identified, although its exact origin remained unknown until now [1]. As of April 28, 2020, there were a total of 3,136,508 cases from 210 countries and territories, and 217,813 cases died. Africa reported the first case of COVID-19 on February 14; currently, a total of 35,309 confirmed cases and 1,522 related deaths have been reported in 54 African countries [2].
Although African cases only account for 1.13% in the world, due to the unique demographic and geographic characteristics, COVID-19 spreads much faster in Africa than that in other regions. In addition, the African relatively higher ratio of young population and the fragile public health system have exacerbated the disease epidemic [3]. Hence, Africa is suffering from the huge challenge of the COVID-19 pandemic. This article introduces some epidemic characteristics of COVID-19 in Africa, such as the case number and distribution, the case fatality rate (CFR) and its regional difference, the total tests and test intensity, and the transmission type. In addition, as the COVID-19 is at the early stage, we use the Matlab Curve Fitting toolbox to fit the model with the outbreak data and make the forecasting. We hope that this article would make the government pay more attention to the epidemic and provide some references for effective prevention and control in Africa and other countries.
Materials and Methods
Materials
Data Sources and Definition
Population characteristics, such as population density (= people number/km2), urban population rate (= current urban people number/total population amount ×100%), age structure, median age (index by dividing a population into two numerically equally sized groups), and current population amount in each country, are searched on the website “Worldometer-Population” [4] and “Central Intelligence Agency” [5].
Data of total confirmed COVID-19 cases, total COVID-19 deaths, total test samples, test intensity (= test numbers/1 million population), the country reporting the first case, transmission type (imported or local), and amount are derived from the “Worldometer-Coronavirus” [2], “African Centers for Disease Control (CDC)” [6], and “COVID-19 Global Pandemic Real-time Report” [7]. The age and gender distributions of confirmed COVID-19 cases originated from the “World Health Organization” [8]. All data in this article are updated to April 28, 2020, unless otherwise stated.
Different organizations have different divisions of African regions. In this article, the regional classification of Eastern, Southern, Western, Northern, and Central Africa is based on the “African CDC” [6].
Methods
The total number of COVID-19 cases and deaths in African countries has been recorded each day since February 14. The total case number and the CFR in different African regions are calculated according to the regional division [6]. The global total number of COVID-19 cases, CFR, total test amount, and intensity are searched online [2]. At the same time, population characteristics of Africa and related 16 countries are investigated on the Internet.
We predict the required time that Africa arrives at the indicated case number (100, 500, 1,000, 5,000, 10,000, 50,000, and 100,000) using formulas (1) and (2):
notes: a = required in a country; α = case arrival indicated number in the country; β = the case first reported in the country; b = predicative case arrival indicated number in Africa; γ = the case first reported in Africa; δ = median Daya among 16 countries.
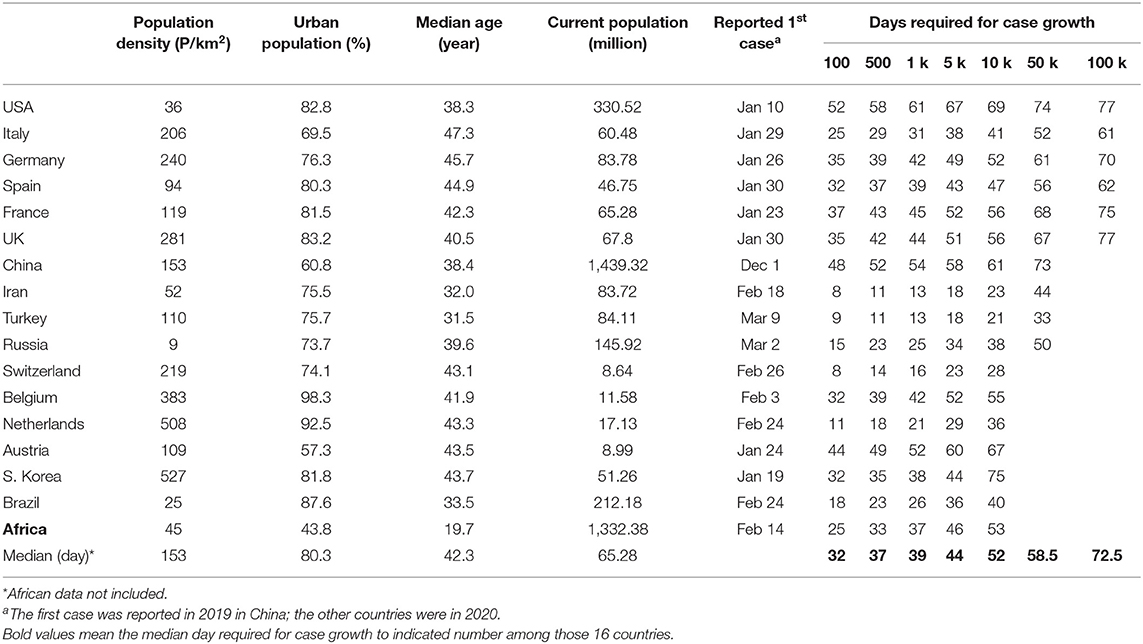
Data we use to calculate the median day is from 16 countries, including USA, Italy, Germany, and China, etc. (see Table 1). The test intensity in this article is defined as “test numbers/1 million population,” and test positive rate is calculated by formula (3):
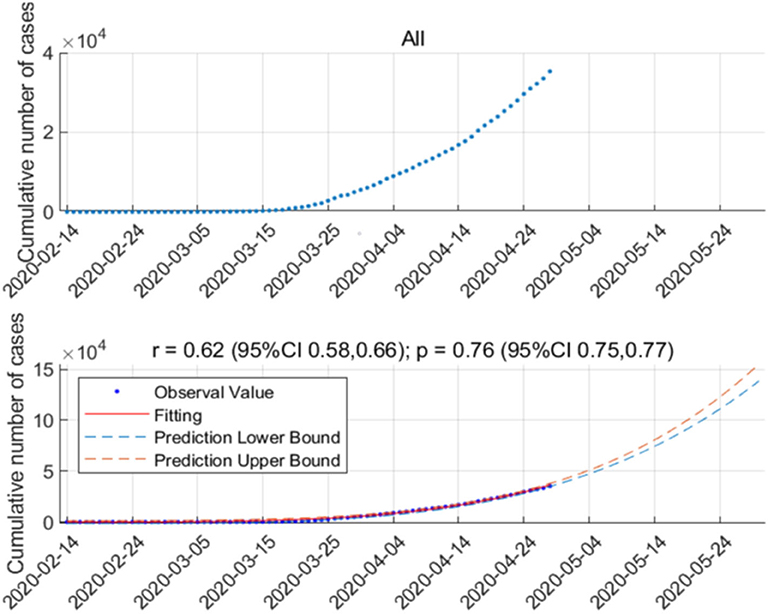
In addition, we use the Matlab Curve Fitting toolbox to fit the model with the outbreak data and make the forecasting. The number of cumulative number of cases at time interval t, C(t), is modeled by the following equation:
where p∈[0, 1] is a “deceleration of growth” parameter and r is a positive parameter denoting the growth rate.
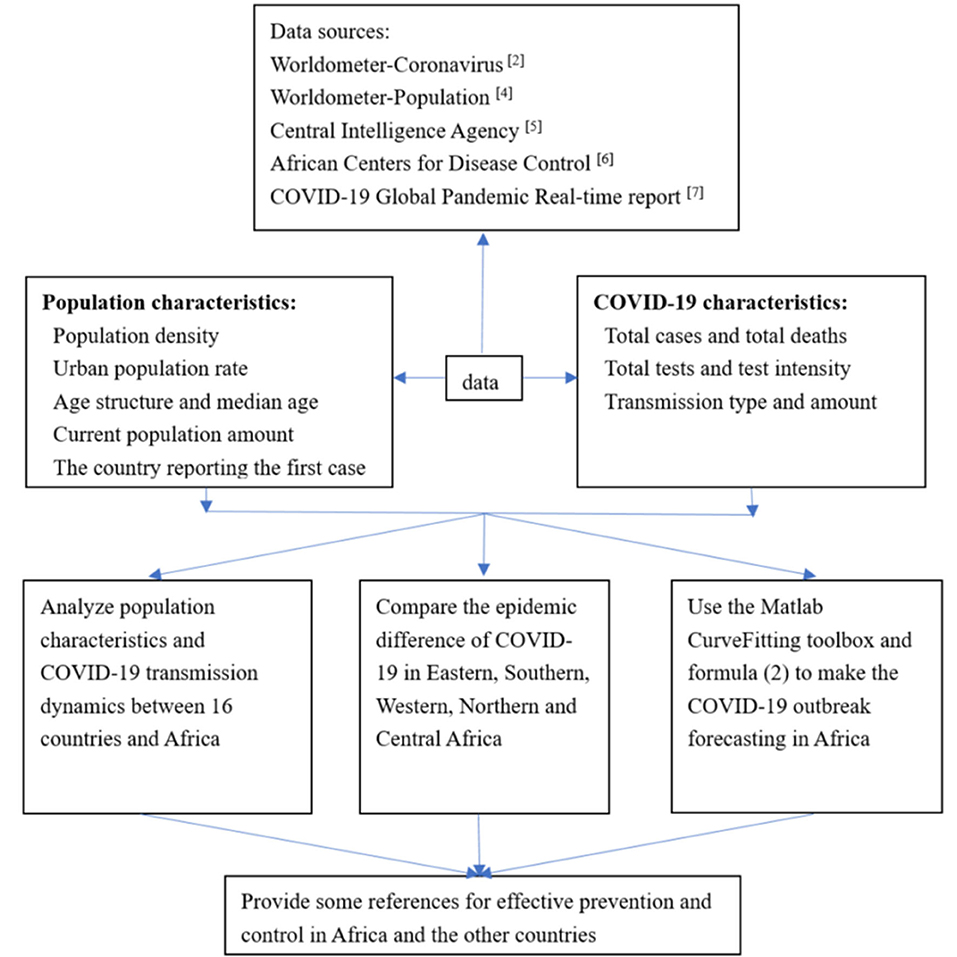
Figure 1 shows the flowchart in this article.
Statistical Methods
Categorical data are presented as frequencies and percentages, whereas continuous data without normal distribution are expressed as median and interquartile range (IQR). A chi-square test is used to compare the differences in CFR of COVID-19 or test positive rate among different regions. The Wilcoxon rank-sum test is applied to test intensity between the globe and Africa. Multiple linear regression analysis (stepwise linear regression) is used to explore the relationship between population characteristics and COVID-19 disease transmission speed in countries. Statistical analyses are performed using IBM SPSS Statistics for Windows (version 23.0, IBM Corp., Armonk, NY, USA), and p < 0.05 is considered statistically significant.
Results
Case Number and Distribution
Figure 2A shows the trend of COVID-19 cases in Africa: the daily increase was < 100 cases before March 19, whereas it reached up to 100–500 during March 19–24, and it exceeded 500 cases/day after March 24. Similar to the above-mentioned, there were only 13 countries that reported COVID-19 cases before March 13, whereas the entire African countries discovered the case on April 6 (Figure 2B). Figure 2C demonstrates the COVID-19 distribution in African countries on April 28.
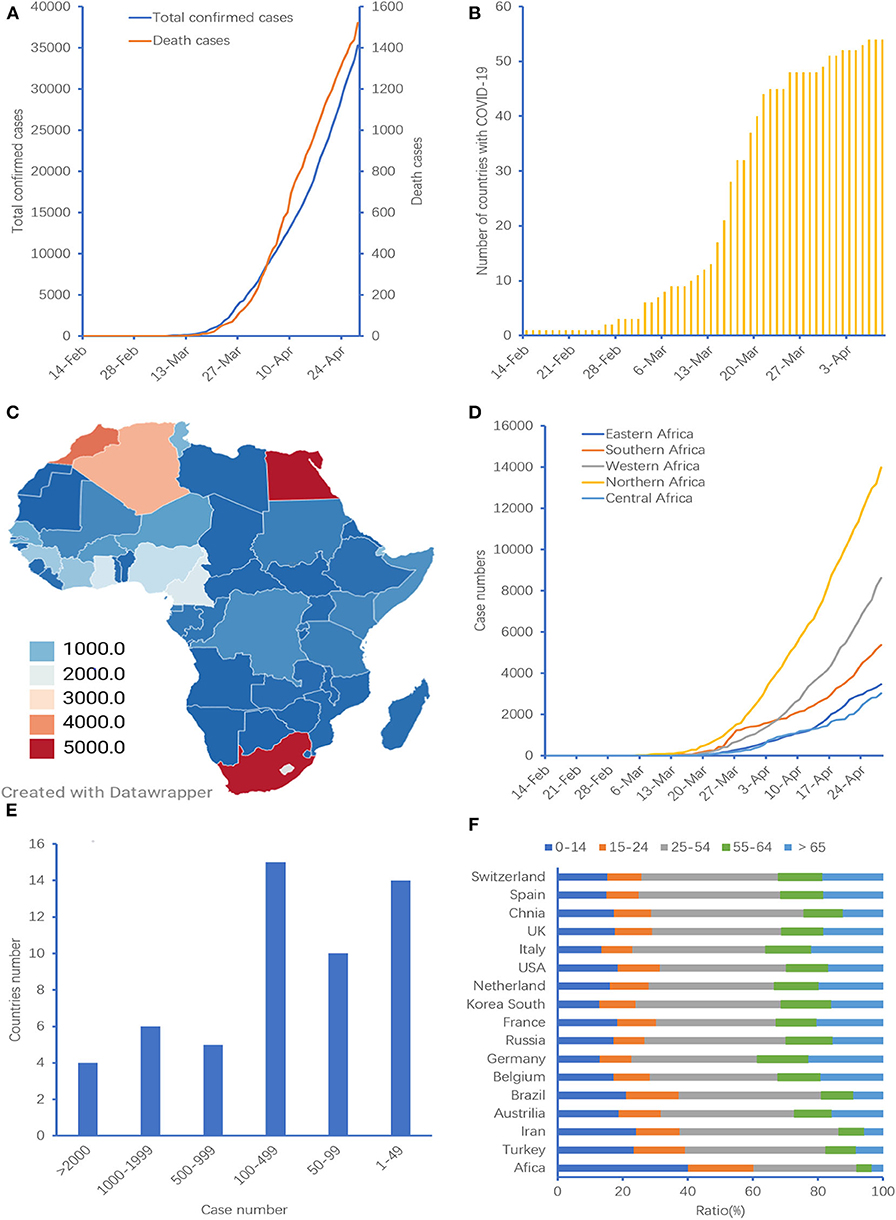
Figure 2. Case number and distribution in Africa. (A) Confirmed COVID-19 and death cases in Africa over time, (B) number of countries with COVID-19 over time, (C) case distribution in Africa, (D) confirmed COVID-19 cases in different African regions. Three countries of Sahrawi Arab Democratic Republic (Northern Africa), Union of the Comoros (Eastern Africa), and Kingdom of Lesotho (Southern Africa) are not included, (E) distribution of COVID-19 cases in different countries in Africa, (F) age structure in Africa and other countries. Two countries of Mayotte and Reunion are not included.
Regarding the case distribution, there were 13,986 cases coming from Northern Africa, taking account for 40.59%, followed by Western Africa (n = 8,614, 25.00%), Southern Africa (n = 5,364, 15.57%), Eastern Africa (n = 3,474, 10.08%), and Central Africa (n = 3,020, 8.76%). Figure 2D indicates that the case number in Northern Africa grew faster than that in other African regions.
The five countries in Africa with the highest cumulative number of cases (proportion of reported cases in Africa) were Egypt (n = 5,042, 14.28%), followed by South Africa (n = 4,996, 14.15%), Morocco (n = 4,252, 12.04%), Algeria (n = 3,649, 10.33%), and Cameroon (n = 1,705, 4.83%). These five countries accounted for 55.63% in entire Africa, whereas these ratios in Europe and China were 69.16 and 86.88%, respectively (χ2 = 10,526.70, p < 0.001). In addition, 39 (72.22%) countries reported cases between 1 and 499 (Figure 2E). All those data suggest that the case distribution in Africa is relatively scattered.
According to the available data [8] on the age and gender distributions of confirmed COVID-19 cases in the World Health Organization (WHO) African region (n = 4,639) from February 25 to May 5, the male to female ratio among confirmed cases was 1.8, and the median age was 42 years (range: 0–105). Males (62%) in the 31–39 and 40–49 age groups were more affected than females (38%) across the same age groups.
Case Fatality Rate and Regional Difference
The COVID-19 CFR in the globe gradually increased over time. However, the CFR in Africa increased from February 14, the peak value was on April 11 (5.24%), and it began to slowly decrease after that day. Moreover, there were 1,522 death tolls as of April 28 with a CFR of 4.31% in Africa, which was lower than the global CFR of 6.94% (χ2 = 113.96, p < 0.001; Figure 3A). The countries with the highest CFR in Africa were Algeria, followed by Liberia, Egypt, Burkina Faso, and Democratic Republic of the Congo (Figure 3B).
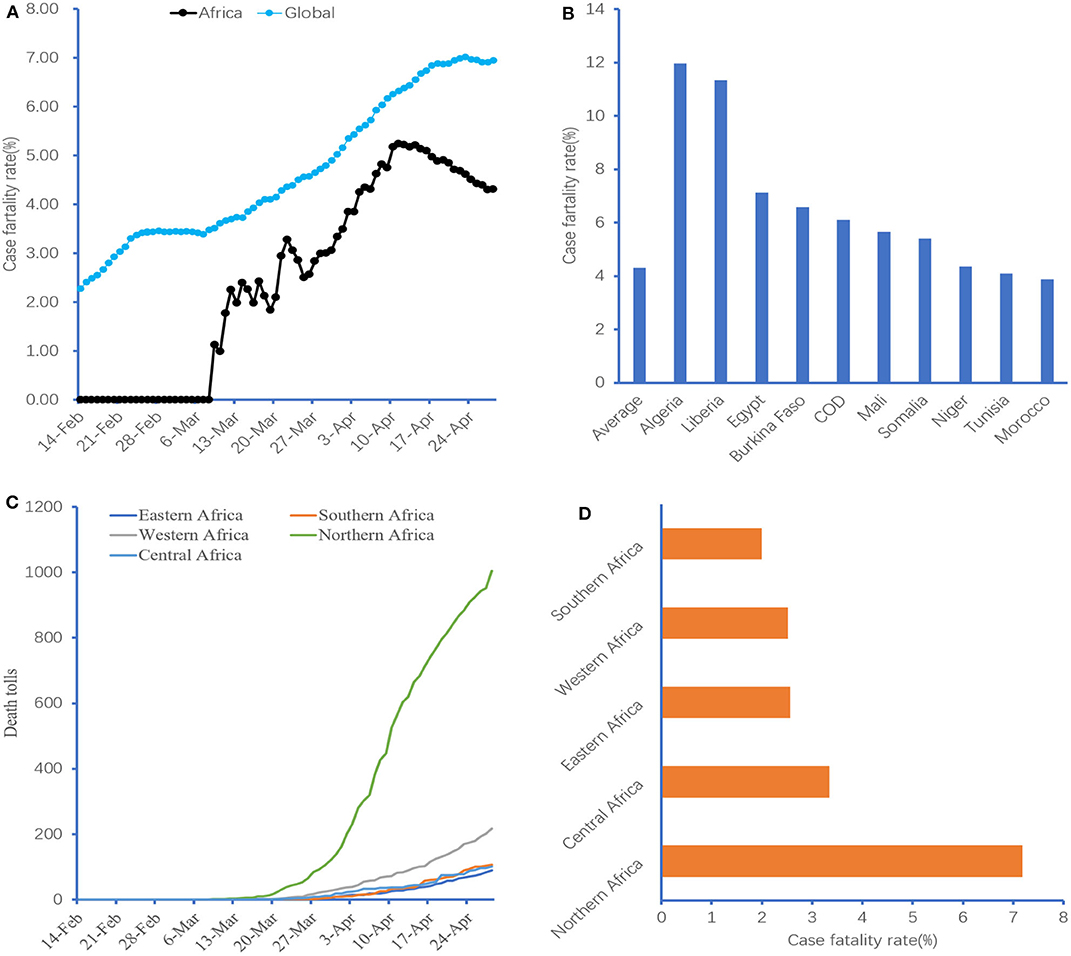
Figure 3. Case fatality rate and region difference. (A) CFR of COVID-19 in Africa, (B) the top 10 African countries with COVID-19 CFR. COD, The Democratic Republic of the Congo; CFR, case fatality rate. (C,D) Comparison of COVID-19 CFR in different African regions. Three countries of Sahrawi Arab Democratic Republic (Northern Africa), Union of the Comoros (Eastern Africa), and Kingdom of Lesotho (Southern Africa) are not included.
Figures 3C,D indicate that the COVID-19 death toll in Northern Africa has increased dramatically since March 28, and its CFR was higher than that of other regions in Africa (7.18 vs. 1.99–3.34%, χ2 = 228.18, p < 0.001).
Total Tests and Test Intensity
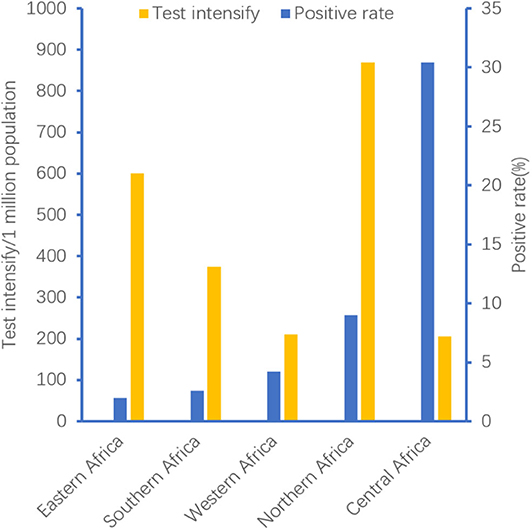
As of April 28, a total of 30,832,243 COVID-19 tests were conducted in 174 countries, and 3,070,343 patients were confirmed, with a positive rate of 9.96%. In these countries, there were 5,307 tests (IQR: 837.5–17,152.75) for every 1 million people. Regarding Africa, a total of 596,146 tests were conducted in 35 countries, and 28,271 patients were confirmed, with a positive rate of 4.74%. However, there were only 335 tests (IQR: 145.5–874) for every 1 million people in Africa. Both test intensity and test positive rate in Africa were lower than those in the globe (χ2 was 27.239 and 15,041.85, respectively, all p < 0.001). Moreover, the test positive rate and test intensity in African regions were different. Figure 4 demonstrates that the test intensity in Northern Africa was higher than that in other regions, whereas the test positive rate in Central Africa seemed better.
Transmission Type
The transmission type is divided into two ways: imported or local transmission. Just like in Tianjin, China, imported cases predominated at the early stage. However, local transmission patients became more and more over time [9]. In Africa, there were only 33.68% local transmission cases from February 14 to March 10, whereas this ratio was up to 99.06% in the first week in April (Table 2). However, the duration of imported transmission in Africa was longer than that in Tianjin (24 vs. 7 days).
A total of 105 cases were confirmed from February 14 to March 10. Among them, 63 imported cases were reported by nine countries. Forty-five cases (71.43%) came from an Egypt cruise ship (12 crew members, 14 Egyptians, and 19 foreigners), followed by France (n = 9), Italy (n = 5), Kazakh (n = 2), United Kingdom (n = 1), and Canada (n = 1) [6].
COVID-19 Case Dynamic Prediction for Africa
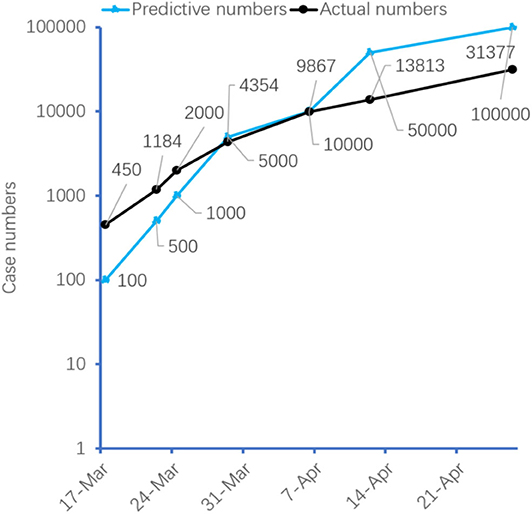
We analyze the population characteristics and COVID-19 transmission dynamics in 16 countries from different continents [2, 10] (Table 1). The median days required for arrival to 100 and 500 cases of COVID-19 in these countries are 32 and 37, respectively. However, it only requires 25 and 33 days in Africa, respectively. The age structure in Africa and other countries was shown in Figure 2F. It indicates that the ratio of 0–24 years old in Africa was significantly higher than that in the globe (50.06 vs. 40.75%, χ2 = 46,613,552.9, p < 0.001). Moreover, multivariate linear regression analysis shows that when the confirmed case is below 1,000, the transmission speed in these countries is only related to the median age (B = 2.044, t = 2.285, p = 0.043), whereas the other three variables, including population density, total population, and urban population rate, are not significantly different (p-value was 0.311, 0.051, and 0.414, respectively). According to the speed of virus transmission in these 16 countries, we predict that the African COVID-19 cases will reach 50,000 and 100,000 cases on April 12 and 26, respectively (Figure 5).
Moreover, in order to estimate the future situation of COVID-19 infection in Africa for the upcoming intervention policy planning, we analyze and forecast the number of infection cases in Africa. As the COVID-19 outbreak in Africa was at the early stage, we adopt the early epidemic growth model [10] developed to analyze the COVID-19 transmission pattern in Africa. Figure 6 (upper) shows the outbreak data of all countries in Africa. Figure 6 (lower) shows the fitting result and the forecast result until May 31, 2020. As shown in Figure 6 (lower), the early epidemic growth model well-characterizes COVID-19 transmission dynamics in Africa. According to the model, the number of infection cases will increase to around 150,000 at the end of May.
Discussion
In Africa, COVID-19 has spread to only 13 countries from February 14 to March 13, whereas up to the entire 54 countries on April 6. The virus in Africa spreads significantly faster at the early stage than that in other regions, as demonstrated by Figure 5. Our results show that the transmission speed of COVID-19 is related to the median age. The younger the population, the faster the virus spreads. Table 1 shows that the virus spreads significantly faster in Iran (median age = 32 years) or Turkey (median age = 31.5 years) than in other countries. Data analyzed about the first 425 confirmed cases in China suggest that the epidemic doubled in size every 7.4 days at the early stage, whereas it needs < 4 days in Africa (105 confirmed cases in 24 days) [6]. The median age of those patients is 59 years, and more than 80% of patients are ≥45 years in that Chinese study [11]. However, Africa is a high concentration of young people, with a median age of 19.7 years, which may lead to the faster spread of COVID-19.
In addition, cases distribution in Africa is relatively scattered. The top five countries with the largest cases account for 55.63% of all African cases, which is obviously lower than Europe (69.16%), Asia (68.62%), or North America (99.51%) [7]. On the other hand, although imported cases are predominant at the early stage of the African outbreak, community-transmitted cases have recently occurred in more and more countries over time. There are only 1–499 confirmed COVID-19 cases in 39 (72.22%) countries among Africa (Figure 2B); however, it will lead to the rapid spread of the epidemic, just like a single spark could start a prairie fire.
Furthermore, many people in Africa have serious health issues, such as malaria, HIV, and tuberculosis, that make them vulnerable to COVID-19 [12]. Sub-Saharan Africa has one of the highest levels of child malnutrition globally. Recent research finds that the stunting and underweight rates in Burundi are 57.7 and 28.8%, respectively, whereas the wasting rate is 18.0% in Niger, followed by Burkina Faso (15.50%). COVID-19 may put malnourished children at significant risk [13, 14].
Moreover, COVID-19 shares some of the highly similar symptoms with malaria, such as fever, difficulty in breathing, fatigue, and headaches of acute onset. What is more, both two diseases could affect similar organs of the body. Thus, a COVID-19 case may be misclassified as malaria if symptoms alone are used to define a case during this emergency period [15]. Hence, the actual case numbers at the early stage are much smaller than prediction, as shown in Figure 5. For example, predictive cases would reach 50,000, whereas actual cases were only 13,813 on April 12. Although the WHO has already supported Africa with early detection by providing thousands of COVID-19 testing kits to limit the widespread transmission, health officials in many African countries concede that the case amount is far higher than those confirmed [16, 17]. Meanwhile, the shortage of testing kits in Africa has induced that test intensity only accounts for 6.31% of the world (median: 335 tests vs. 5,307 tests/1 million population) [18].
The lower CFR of COVID-19 in Africa may relate to a higher proportion of younger population. Data from Italy indicate a much higher CFR among the elderly [19]. Another data also find that COVID-19 kills an estimated 13.4% of patients of 80 years old or older, compared with 1.25% of those in their 50's and 0.3% of those in their 40's [20]. In addition, over 80% of the deaths in China occur to people of 60 years old or older at the early stage of COVID-19 [21]. People in that age group account for 16% of the population, whereas in Africa, they only make up just 5% of the population [12]. Africa's relatively young population could help buffer the continent against CFR. Similarly, the relatively higher CFR in Northern Africa may relate to the lower ratio of younger people. For example, the median ages in Egypt, Algeria, and Morocco are 24.6, 28.5, and 29.5 years, respectively, whereas the median age in Africa is only 19.7 years [4]. On the other hand, Africa has a high incidence area of malaria, and chloroquine or hydroxychloroquine (HCQ) is the first-line drug for the treatment. Recently, research shows that chloroquine or HCQ is also a potential treatment for COVID-19 [22]. Is the lower CFR related to some changes in the body caused by repeated use of chloroquine or HCQ by Africans? Until now, however, there is no sufficient evidence whether the lower COVID-19 CFR in Africa is related to the exposure of chloroquine or HCQ.
The reason for the relatively lower test positive rate in Africa remains unclear until now. The current gold standard for the etiological diagnosis of COVID-19 is (real-time) reverse transcription polymerase chain reaction (rRT-PCR), which is affected by many factors, such as inadequate procedures for collection, handling, transport, and storage of the swabs and collection of inappropriate or inadequate material, as well as sample contamination [23]. On the other hand, a high proportion of young people in Africa may be another reason. Liu et al. [24] tested 4,880 cases using quantitative RT-PCR and found that a positive rate of 18–29 years in patients is only 24.90%, whereas it is ≥70 years with 61.81%. A single negative RT-PCR should not exclude COVID-19, especially if clinical suspicion is high. Chest CT has higher sensitivity for the diagnosis of COVID-19 than initial RT-PCR from swab samples [25].
According to the volume of air travel between China and Africa, a modeling study about African countries imported COVID-19 cases demonstrates that countries with the highest importation risk are Egypt, Algeria, and South Africa [26]. However, data from the African CDC indicate that the origin of imported cases in Africa is mainly from Europe (i.e., France, Italy, and United Kingdom), although COVID-19 is first reported in China [6, 27]. In addition, among these 105 patients reported as of March 10, 80 (76.19%) were distributed in Northern Africa, and most of them were imported from Europe. This may be the reason why the number of COVID-19 cases in Northern Africa is higher than that in other African regions.
Although accounting for 1.13% of the world cases, Africa also needs a response immediately to prevent its pandemic. However, most African countries remain woefully unprepared for what is coming [28]. So far, quarantine is the most effective measure to prevent virus transmission, but in African cities, particularly in tightly packed informal settlements, keeping people apart is very difficult because most people need daily income to survive. People are relatively dispersed in rural areas, while communicating information about social distancing will also be challenging [12, 17].
After closing borders and mitigated measures, including restrictions on movement, public gatherings, and schools, some countries have seen a reduction in the average daily case growth, whereas it will undoubtedly depress economics in Africa [27]. Whether lockdown is suitable for Africa remains unknown. However, Africa could work together to prevent the spread of COVID-19 and amplify their collaboration by sharing data, capabilities, and coordinating strategies. Global or regional unions (the WHO, African CDC, or West Africa Health Organization) can be powerful drivers of that cooperation [12, 27, 29]. In addition, regional workshops need to conduct to strengthen the capacity for enhanced surveillance at points of entry, infection prevention and control, risk communication, and clinical case management [27]. Countries in Africa can apply a combination of containment and mitigation measures to delay a surge in cases that could overwhelm the availability of hospital beds, while protecting the medically vulnerable, such as the elderly and those with comorbidities [27]. What is more, African countries should raise response fund to strengthen test capacity, effective surveillance and contact tracing, and isolation. For example, the Jack Ma Foundation has provided medical supplies, including diagnostics, and equipment to each of the 55 countries in Africa [30].
There are some limitations in this article. Firstly, some information, such as basic reproduction number (R0), incubation, clinical presentation, and treatment strategies are not collected in this study due to unavailable public data. Secondly, this article only considers population density, age, urban rate, and total population as factors affecting the spread of COVID-19. In fact, some factors, such as poverty and education level, may also affect the spread, and these factors will be researched in the future. Lastly, the epidemic characteristics of COVID-19 in each country are not the same, and the accuracy of the data provided by 16 countries is uncertain. Using the epidemiological characteristics of these countries to predict development trends in Africa may be biased. There are some new methods, such as multi-scale asynchronous belief percolation model, temporal networks, and dynamical clustering in electronic commerce systems [31–33], that may improve the limitations in this article. We will use these methods in the future research.
In total, COVID-19 spreads faster in Africa, with a relatively lower CFR, and it may be related to higher young people ratio. Test intensity of COVID-19 is obviously insufficient in Africa. Africa could work together to prevent the spread of COVID-19.
Data Availability Statement
All datasets presented in this study are included in the article/supplementary material.
Author Contributions
LW and YC wrote the original draft and edited and critically revised the manuscript. SD, YZ, FX, and JW collected the data. YG, JW, and MY analyzed and interpreted the data. All authors substantially contributed to the conception, writing, and revision of the work and approved the final content of the manuscript.
Conflict of Interest
The authors declare that the research was conducted in the absence of any commercial or financial relationships that could be construed as a potential conflict of interest.
Acknowledgments
We thank professor Cui Shuzhang and Shou Songtao of the Emergency Department of Tianjin Medical University General Hospital for the article review.
Abbreviations
COVID-19, coronavirus disease 2019; CDC, Centers for Disease Control; CFR: case fatality rate, ; IQR, interquartile range; HCQ, hydroxychloroquine; rRT-PCR, (real-time) reverse transcription polymerase chain reaction; WHO, World Health Organization.
References
1. Zhu N, Zhang D, Wang W, Li X, Yang B, Song J, et al. A novel coronavirus from patients with pneumonia in China, 2019. N Engl J Med. (2020) 382:727–33. doi: 10.1056/NEJMoa2001017
2. COVID-19 Coronavirus Pandemic. (2020). Available online at: https://www.worldometers.info/coronavirus/ (accessed April 29, 2020).
3. Azevedo MJ. The state of health system(s) in Africa: challenges and opportunities. In: Historical Perspectives on the State of Health and Health Systems in Africa, Volume II. African Histories and Modernities. Cham: Palgrave Macmillan. (2017). p. 1–73. doi: 10.1007/978-3-319-32564-4_1
4. World Population. Population. (2020) Available online at: https://www.worldometers.info/population/ (accessed April 29, 2020).
5. Central Intelligence Agency (2020). Available online at: https://www.cia.gov/library/publications/the-world-factbook/fields/341.html (accessed April 29, 2020).
6. African Centers for Disease Control. (2020) Available online at: https://africacdc.org/ (accessed April 29, 2020).
7. COVID-19, Global Pandemic Real-time Report. (2020) Available online at: https://ncov.dxy.cn/ncovh5/view/en_pneumonia?from=dxy&source=&link=&share= (accessed April 29, 2020)
8. WHO. COVID-19 Situation update for the WHO African Region, External Situation Report 10. (2020). Available online at: https://reliefweb.int/report/south-africa/covid-19-situation-update-who-african-region-external-situation-report (accessed May 5, 2020).
9. Wang L, Zhang H, Lu B, Wang J, Dong Q, Shou S, et al. Effects and strategies on Emergency department Caused by patients with 2019 novel coronavirus infection in Tianjin. Chin J Emerg Med. (2020) 29:515–7. doi: 10.3760/cma.j.issn.1671-0282-2020022.012
10. Chowell G, Sattenspiel L, Bansal S, Viboud C. Mathematical models to characterize early epidemic growth: a review. Phys Life Rev. (2016) 18: 66–97. doi: 10.1016/j.plrev.2016.07.005
11. Li Q, Guan X, Wu P, Wang X, Zhou L, Tong Y, et al. Early transmission dynamics in Wuhan, China, of novel coronavirus-infected pneumonia. N Engl J Med. (2020) 382:1199–207. doi: 10.1056/NEJMoa2001316
12. Fighting COVID-19 in Africa Will Be Different,. (2020). Available online at: https://www.bcg.com/publications/2020/fighting-covid-in-africa.aspx (accessed March 26, 2020).
13. Ginsburg AS, Izadnegahdar R, Berkley JA, Walson JL, Rollins N, Klugman KP. Undernutrition and pneumonia mortality. Lancet Global Health. (2015) 3:e735–6. doi: 10.1016/S2214-109X(15)00222-3
14. Chanda-Kapata P, Kapata N, Zumala A. COVID-19 and malaria A symptom screening challenge for malaria endemic countries. Int J Infect Dis. (2020) 94:151–3. doi: 10.1016/j.ijid.2020.04.007
15. Akombi BJ, Agho KE, Merom D, Renzaho AM, Hall JJ. Child malnutrition in sub-Saharan Africa: A meta-analysis of demographic and health surveys (2006-2016). PLoS ONE. (2017) 12:e0177338. doi: 10.1371/journal.pone.0177338
16. African Countries Move From COVID-19 Readiness to Response as Many Confirm Cases. (2020). Available online at: https://www.afro.who.int/health-topics/coronavirus-covid-19 (accessed March 25, 2020).
17. The Last Continent to Face up COVID-19 Africa ‘Needs to Wake up. (2020) Available online at: https://www.euractiv.com/section/coronavirus/news/the-last-continent-to-face-up-covid-19-africa-needs-to-wake-up/?_ga=2.188869291.144338809.1585666547-435116306.1585666547 (accessed March 23, 2020).
18. African Nations Try to Overcome Shortage of COVID-19 Test Kits. (2020). Available online at: https://www.voanews.com/africa/african-nations-try-overcome-shortage-covid-19-test-kits (accessed March 20, 2020).
19. Onder G, Rezza G, Brusaferro S. Case-fatality rate and characteristics of patients dying in relation to COVID-19 in Italy. JAMA. (2020) 323:1775–6. doi: 10.1001/jama.2020.4683
20. What Explains Covid-19's Lethality for the Elderly? Scientists Look to ‘Twilight' of the Immune System. (2020). Available online at: https://www.statnews.com/2020/03/30/what-explains-coronavirus-lethality-for-elderly/ (accessed March 30, 2020).
21. China CCDC. The Epidemiological Characteristics of an Outbreak of COVID19 China 2020. (2020) Available online at: http://weekly.chinacdc.cn/en/article/id/e53946e2-c6c4-41e9-9a9b-fea8db1a8f51 (accessed February 17, 2020).
22. Colson P, Rolain JM, Lagier JC, Brouqui P, Raoult D. Chloroquine and hydroxychloroquine as available weapons to fight COVID-19. Int J Antimicro Agents. (2020) 55:105932. doi: 10.1016/j.ijantimicag.2020.105932
23. Lippi G, Simundic AM, Plebani M. Potential preanalytical and analytical vulnerabilities in the laboratory diagnosis of coronavirus disease 2019 (COVID-19). Clin Chem Lab Med. (2020) 58:1070–6. doi: 10.1515/cclm-2020-0285
24. Liu R, Han H, Liu F, Lv Z, Liu Y, Feng Y, et al. Positive rate of RT-PCR detection of SARS-CoV-2 infection in 4880 cases from one hospital in Wuhan, China, from Jan to Feb 2020. Clin Chim Acta. (2020) 505:172–5. doi: 10.1016/j.cca.2020.03.009
25. Ai T, Yang ZL, Hou HY, Zhan C, Chen C, Lv W, et al. Correlation of chest CT and RT-PCR testing in coronavirus disease 2019 (COVID-19) in China: a report of 1014 cases. Radiology. (2020) 296:E32–40. doi: 10.1148/radiol.2020200642
26. Gilbert M, Pullano G, Pinotti F, Valdano E, Poletto C, Boëlle PY, et al. Preparedness and vulnerability of African countries against importations of COVID-19: a modelling study. Lancet. (2020) 395:871–7. doi: 10.1016/S0140-6736(20)30411-6
27. Loembé MM, Tshangela A, Salyer SJ, Varma JK, Ouma AEO, Nkengasong JN. Covid-19 in Africa: the spread and response. Nat Med. (2020) 26: 996–1008. doi: 10.1038/s41591-020-0961-x
28. El-Sadr WM, Justman J. Africa in the Path of Covid-19. N Engl J Med. (2020) 383:e11. doi: 10.1056/NEJMp2008193
29. Fairhead J, Leach M. One Size Fits all? Why Lockdowns Might not be Africa's Best Bet. (2020). Available online at: https://africanarguments.org/2020/04/22/one-size-fits-all-why-lockdowns-might-not-be-africa-best-bet/ (accessed April 22, 2020).
30. Africa CDC. (2020). Available online at: https://africacdc.org/news-item/africa-cdc-receives-third-donation-of-medical-supplies-from-jack-ma-foundation-co-hosts-global-medixchange-webinar-on-covid-19/ (accessed April 27, 2020).
31. Li HJ, Wang L. Multi-scale asynchronous belief percolation model on multiplex networks. N J Phys. (2019) 21:015005. doi: 10.1088/1367-2630/aaf775
32. Bu ZH, Wang YY, Li HJ, Jiang JC, Wu ZA, Cao J. Link prediction in temporal networks: Integrating survival analysis and game theory. Inform Sci. (2019) 498:41–6. doi: 10.1016/j.ins.2019.05.050
Keywords: COVID-19, Africa, pandemic, prediction, test intensity
Citation: Wang L, Dong S, Zhao Y, Gao Y, Wang J, Yu M, Xu F and Chai Y (2020) Epidemic Characteristics of COVID-19 in Africa. Front. Phys. 8:564698. doi: 10.3389/fphy.2020.564698
Received: 22 May 2020; Accepted: 12 August 2020;
Published: 29 September 2020.
Edited by:
Hui-Jia Li, Beijing University of Posts and Telecommunications (BUPT), ChinaReviewed by:
Zhanwei Du, University of Texas at Austin, United StatesChao Gao, Southwest University, China
Wen-xuan Wang, Beijing University of Posts and Telecommunications (BUPT), China
Copyright © 2020 Wang, Dong, Zhao, Gao, Wang, Yu, Xu and Chai. This is an open-access article distributed under the terms of the Creative Commons Attribution License (CC BY). The use, distribution or reproduction in other forums is permitted, provided the original author(s) and the copyright owner(s) are credited and that the original publication in this journal is cited, in accordance with accepted academic practice. No use, distribution or reproduction is permitted which does not comply with these terms.
*Correspondence: Yanfen Chai, Y2hhaXlhbmZlbjIwMTJAMTI2LmNvbQ==; Lijun Wang, d2FuZ2xpanVuMjAwNWljdUBmb3htYWlsLmNvbQ==
†These authors have contributed equally to this work
 Lijun Wang
 Shengwen Dong
 Ying Zhao4†
 Yulei Gao