- 1Department of Physics, Inha University, Incheon, South Korea
- 2Ecology and Future Research Institute, Busan, South Korea
- 3National Institute of Ecology, Seocheon-gun, South Korea
- 4Institute of Natural Basic Sciences, Inha University, Incheon, South Korea
- 5Institute of Advanced Computational Sciences, Inha University, Incheon, South Korea
We consider the pandemic spread of COVID-19 in selected countries after the outbreak of the SARS-CoV-2 coronavirus in Wuhan City, China. We estimated the infection rate and the initial individuals infected with COVID-19 by using officially reported data from the early stages of the epidemic for a model of susceptible (S), infectible (I), quarantined (Q), and officially confirmed recovered (Rk) populations (the so-called SIQRk model). In the officially reported data, we know the number of quarantined cases and the officially reported number of recovered cases. We cannot know about recovered cases from asymptomatic patients. In the SIQRk model, we can estimate the parameters and the initial infections (confirmed cases + asymptomatic cases) from fitted values. We obtained an infection rate in the range β = 0.233 ~ 0.462, a basic reproduction number of Ro = 1.8 ~ 3.5, and the initial number of infected individuals, I (0) = 10 ~ 8409, for selected countries. By using fitting parameters, we estimated that the maximum time span of the infection was around 50 days in Germany when the government invoked the quarantine policy. The disease is expected to subside about 6 months after the first patients are found.
Introduction
On December 31, 2019, Chinese authorities reported pneumonia from an unknown cause to the World Health Organization (WHO) in Wuhan City, Hubei province, China. On January 7, 2020, the virus was identified as a new coronavirus, first referred as 2019-nCov (SARS-CoV-2), which causes the disease named COVID-19. On January 11, 2020, China reported the first death from the novel coronavirus [1]. The victim was a 61-year-old man in Wuhan. On January 20, 2020, the WHO reported the first confirmed cases outside China (in Thailand, Japan, and South Korea [1]). The disease was spreading rapidly in Wuhan City, and cases were reported outside that city. On January 23, 2020, China placed Wuhan, a city of 11 million people, under quarantine. All transportation departures were canceled or suspended [1]. The president of the WHO declared COVID-19 a pandemic on March 11, 2020. After the first report on December 31, 2019, in Wuhan, COVID-19 was spreading very quickly all over the world [2] and is the first pandemic in the twenty first century.
Some states, such as the Republic of Korea, Taiwan, Singapore, and Hong Kong, have been controlling the disease successfully up to now. However, other countries, like the U.S.A., Italy, Spain, France, and the U.K., are suffering from the outbreak and from shortages of medical materials and overcrowded hospitals. Since the outbreak, scientists all over the world have been struggling to find a vaccine and drugs for treatment. In the highly connected societies, information and data on the disease are shared through the internet, social media, and mass media. We can obtain information from websites like worldometer1 or livecornamap in South Korea 2.
A flood of articles and preprints is appearing on many journal and preprint websites. Recently, preprint websites like arXiv.org3, bioRxiv4, and medRxiv5 are servicing a section with COVID-19 quick links. It is important to predict the spread of the disease in the early stages of the outbreak. Many epidemic models were proposed based on dynamic spreading models, agent-based models, the Monte Carlo model, and data-based spreading models [3–10].
The evolution of the virus was described with a modified susceptible (S), infectious (I), recovered (R) population, the so-called SIR model [3–7]. The prediction of COVID-19 evolution in Brazil was suggested by using the susceptible, infectious, quarantined, recovered (SIQR) model [5]. Numerical analysis provided an estimated basis reproduction number of Ro = 5.25, and a doubling time estimated at 2.72 days. The SIQR model includes a rate that quantifies the recovering of asymptomatic individuals for the evolution equation of the infection and the recovering population. Peng et al. introduced an epidemic model for COVID-19 including the exposed population [4]. A model by Carcione et al. is called the generalized susceptible, infectious, exposed, recovered (SEIR) model [6]. They introduced time-dependent parameters, such as mortality rate and protection rate. They applied the model to the situation in the Italian Region of Lombardy, and estimated a basic reproduction number of Ro = 2.6 in the early stages of the outbreak. Fanelli and Piazza analyzed and forecast COVID-19 spread by using the susceptible, infected, recovered, dead (SIRD) model in China, Italy, and France [3]. Pedersen and Meneghini quantified undetected COVID-19 cases and the effects of containment measures in Italy, introducing the SIQR model [7], which includes a rate for patients to become non-infectious.
There are some limitations in the SIR-type models because of the ignorance of the age-structure, spatial heterogeneities, activity types of the people, latent periods, the polices to prevent the spreading, etc. [8, 9]. In real situation the government of each country enforces the protection strategies such as physical distance, face masks, eye protection, wide testing, household quarantine, lockdown, and effects of media in the early phase of outbreak [10–16].
In this article, we consider a susceptible, infectible, quarantined, and confirmed recovered (SIQRK) model based on only known data for active cases and recovered cases. In particular, we cannot know the recovered cases of the asymptomatic infected individuals. In our model we can predict the whole infected cases, quarantined cases, and recovered cased based on the early data for the known quarantined cases and the officially recovered cases. We estimate the parameters of the model from data on reported cases for selected countries. We obtained the infection rate and the initial number of infected individuals. From the fitting parameters, we estimated the basis reproduction number, and predict the maximum time span of the infection and the annihilation period of the disease.
Epidemic Model
We consider an epidemic model for COVID-19 that is characterized by the variables {S (t), I (t), Q(t), R(t)} denoting the susceptible population, the infected population, the quarantined population, and the recovered population, all at time t. The total population satisfies the constraint N = S (t) + I (t) + Q(t) + R(t) where N is the total population. Let us define the recovered population as R (t) = Rk (t) + Ra(t), where Rk (t) is the known- or confirmed-as-recovered cases as reported officially, and Ra(t) is the unknown or asymptomatic recovered population (infected, but not showing symptoms). Under the homogenous mixing postulate, we consider the so-called SIQRK model as follows:
In this model, the parameter β denotes the infection rate, and α is the rate at which patients become non-infectious by recovering without showing any symptoms. The parameter η is the rate of detection for newly infected people, and γ is the rate of recovery for quarantined cases. In the SIQRk model, the infected populations are divided into officially confirmed cases and asymptomatic cases. We only know the official number of quarantined cases and the official number of recovered cases. We do not know the actual number in the infected population owing to the unknown number of asymptomatic cases. Some asymptomatic individuals have recovered without any severe suffering from the disease. We propose that the parameter included in the dynamic equations should be the initial number of infected cases, which is the sum of officially known cases and the unknown population of asymptomatic cases. In this model we don't include the number of deaths. The number of deaths is included implicitly in the number of quarantined cases. If the death is occurring, it is quarantined indefinitely. From this idea we can predict some parameters from the officially provided data.
Results
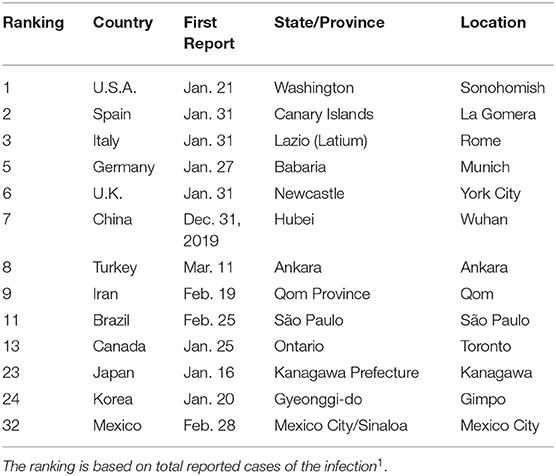
The outbreak of COVID-19 started around the world in January and February 2020, as summarized in Table 1. The disease was first reported in Wuhan City, Hubei province, China, on December 31, 2019. Some states, like the Republic of Korea, Taiwan, Hong Kong, etc., have controlled the disease well, up to now. They have executed massive inspections for the disease. When patients are found at a location, doctors and experts from the Korean Center for Disease Control and Prevention (KCDC) checked all people who had been in contact with those patients. All infected individuals were quarantined in hospitals or some remote places. Some persons suspected of infection would self-quarantine, and controllers checked on them frequently via cellphone app, the internet, and phone. However, many countries did not prepare to control and prevent the disease in the early stages, for example, the U.S.A. and Japan. Patients in these unprepared countries were incubating the disease in the early stages. Recently, these countries have suffered from abrupt outbreaks, and many people have died. We aggregate data set from worldometer website which is supported by the American Library Association1.

Table 1. Date of reporting the first case, plus the state and location of COVID-19 outbreaks for selected countries.
In the reported data for each state, the active cases are transferred immediately to quarantined cases. Therefore, active cases correspond to quarantined cases, Q. Almost-recovered cases come from the isolation cases. From the reported data for Q and Rk, we can fit (Q+Rk) as a function of time in the early stages of disease spread. (Q+ Rk) is fitted by the exponential function in the early stages of disease spread (see the Appendix). From the obtained fitting parameters a and b, we estimated model parameters such as a = ηI (0) and b = β − (α + η), where I(0) is the number of infected individuals at the outset. We have to determine four parameters: α, β, η, and I(0). We determined rates α, η, and γ according to the method used in Bjornstad et al. [8].
Let ε denote the fraction of infectious individuals entering Q. There is a controversy over the ratio of asymptomatic cases for COVID-19 [17–22]. The reported rate of people testing positive for COVID-19, but being asymptomatic, in several instances ranged between 5 and 80%. We set the fraction as ε = 1/3 [15, 17–22]. The average incubation time is about 5 days [17, 18], and the duration for milder cases of the disease is about 5 to 6 days [19]. The average duration from infection to recovery or death in non-isolated patients is about 10 days, corresponding to a rate of 0.1/day [7]. Therefore, we obtained α = (1 − ε) × 0.1/day and η = ε × 0.2/day. Finally, we obtained α = η = 0.067/day. Using these parameters and the fitting parameters a and b, we obtained parameters β and I(0) from the fitting parameters and the predetermined rates. We summarize the results obtained from the data of each country.
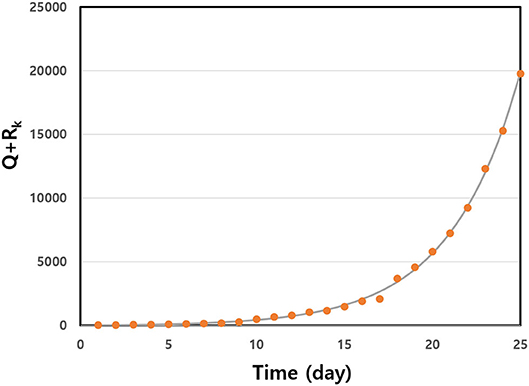
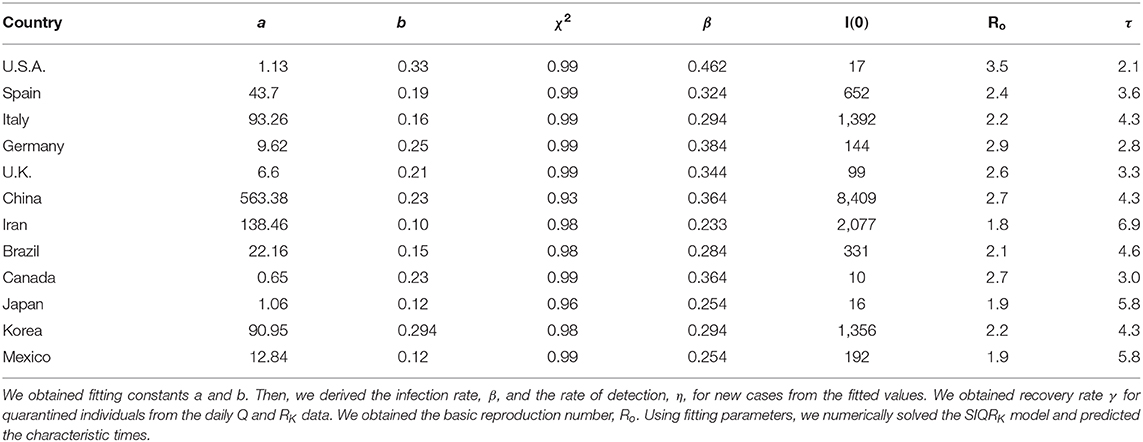
We estimated infection rate β and the initial number of infected individuals, I(0). The symptoms of COVID-19 do not appear in many cases. In Figure 1, we represent the non-linear least squares fit for Q+RK as a function of time in the early stages of disease spread in Germany. The early data fit the exponential function well. We give the fitted data for some selected countries in Table 2. We observed that there were large numbers of initially infected people. The infection rate shows a very high value in the range 0.233 ≤ β ≤ 0.462 for the selected countries. We calculated the basic reproduction numbers of the estimated parameters for the countries. The R for many countries was >2. In particular, the basic reproduction number, Ro, for the U.S.A. shows a high value of Ro = 3.45. This high value induced the large number of infected people throughout many of the states in America.

Figure 1. Q+RK data were fitted to a non-linear least squares fit early in the outbreak as a function of time for Germany. The solid line is from fitted data, and the solid circles are the real data. We obtained fitting parameters a = 9.62 and b = 0.25.
We observed the high number of initially infected individuals, I(0), from data fitting. In Table 1, we summarize the first official confirmed days for COVID-19 patients in many countries. Because of the incubation period and the asymptomatic cases in young, healthy people, we expect that there were many infected people when the health organizations of these countries reported their first cases. In China, we estimated I (0) = 8, 409. The first confirmed time for the virus in China was a long time after the first case, because this is a new type of coronavirus. For the U.S.A., the number of initially infected people is a small value at I (0) = 17. In the U.S., the first patient was found in the state of Washington. However, late inspections and the delayed quarantine policy from the US Centers for Disease Control and Prevention (CDC) and the US federal government resulted in the huge outbreak in the USA. South Korea is one of the countries that excellently controlled this disease. In the early stages of the outbreak, the initial cases were estimated at I (0) = 1, 356. In South Korea, a super-spreader was found in the metropolitan city of Daegu on Feb. 17, 2020, who attended worship services of a church gathering with a lot of people. Although the number of initially infected people is very big, the World Health Organization and the KCDC performed a wide range of inspections, imposed a strong policy for quarantines, and provided information on the people contacted by the confirmed patient. These strong protection policies have been preventing widespread infections of the disease up to now in South Korea.
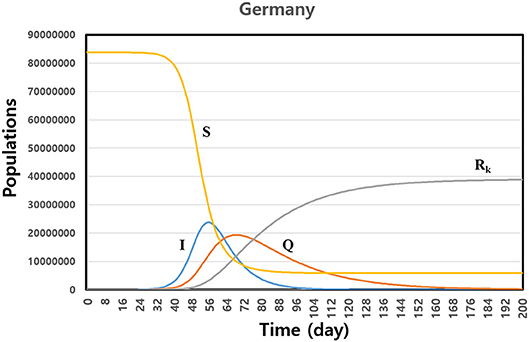
We calculated the SIQRK model by using fitting parameters for the countries. Figure 2 shows the predicted cases of susceptible (S), infecting (I), quarantined (Q), and individuals officially confirmed as accumulated recovered (Rk) for Germany. The maximum number of infected people was at around 50 days, when the government enforced quarantine on all infected persons. Of course, the maximum time and the lasting time of the disease depend on the fitting parameters and the number of initially infected people. For Germany, the disease subsides after 200 days. We need about 6 months to eradicate the disease, according to our model. We observed that the asymptomatic recovered population, Ra = N − (S + I + Q + Rk), dramatically increased after the maximum time span of the infection, as shown in Figure 2. When we predict the evolution of the disease by some model, we need to use a confirmed data set, such as active cases, recovered cases, and terminal cases. In some cases, it is possible that data reported officially include any errors in the early phase of the outbreak. Then the prediction of the model also includes the uncertainty. However, in that case, our model can use observing the changing trend of the epidemic spreading within errors. When we give some variations of the initial conditions by the intrinsic errors in data, we can observe some varying patterns of the evolving disease.

Figure 2. Prediction of the susceptible (S), infecting (I), quarantined (Q), and confirmed accumulated recovered (Rk) individuals based on numerical integration using fitting parameters for Germany. The disease is lasting 200 days after first infecting a patient.
Conclusions
We consider a spreading epidemic model called the SIQRK model. In this model, we include a dynamic equation for quarantined individuals. We estimate the parameters of the dynamic evolution equation from the sum of quarantined cases and recovered cases. We obtained the parameters via non-linear least squares fit by using the set of reported data. When we consider the fitting of the model, it is important to use data for both types of confirmed cases, official and asymptomatic individuals in the model. In particular, there are officially reported recovered cases and asymptomatic recovered cases. We cannot know the asymptomatic recovered cases because we have no data. In this study we suggest a model to overcome this difficulty. The observed high value of the basic reproduction number indicates COVID-19 is a pandemic. We predict that the maximum time span of the infection is around 50 days to 2 months. The disease should last about 6 months when we quarantine infected individuals. We predict based on the model that the epidemics will last in some countries if the policy of the quarantine is not strict. In this model we don't include the number of deaths which are implicitly included in the quarantined cases. If we include the number of deaths, there are some mathematical difficulties to predict the parameters of the model. We will extend this model to include the death case in general.
Data Availability Statement
Publicly available datasets were analyzed in this study. This data can be found here: https://www.worldometers.info/coronavirus/.
Author Contributions
All authors listed have made a substantial, direct and intellectual contribution to the work, and approved it for publication.
Funding
This study was supported by a National Research Foundation of Korea (NRF) grant funded by the Korean Government (Grant No. NRF-2020R1A2C1005334).
Conflict of Interest
The authors declare that the research was conducted in the absence of any commercial or financial relationships that could be construed as a potential conflict of interest.
Footnotes
1. ^Worldometer. Available online at: https://www.worldometers.info/coronavirus/
2. ^Livecoronamap. Available online at: https://livecorona.co.kr/
3. ^arXiv.org. https://arxiv.org/
4. ^bioRxiv.org. https://www.biorxiv.org/
5. ^medRxiv.org. https://www.medrxiv.org/
References
2. WHO Director-General's Opening Remarks at the Media Briefing on COVID-19 - 11 March 2020 (2020). Available online at: https://www.who.int/dg/speeches/detail/who-director-general-s-opening-remarks-at-the-media-briefing-on-covid-19
3. Fanelli D, Piazza F. Analysis and forecast of COVID-19 spreading in China, Italy and France. Chaos Solitons Fractals. (2020) 134:109761. doi: 10.1016/j.chaos.2020.109761
4. Peng P, Yang W, Zhang E, Zhuge C, Hong L. Epidemic analysis of COVID-19 in China by dynamical modeling. arXiv:2002.06563v1. (2020) doi: 10.1101/2020.02.16.20023465
5. Crokidakis N. Data analysis and modeling of the evolution of COVID-19 in Brazil. arXiv:2003.12150v1. (2020).
6. Carcione JM, Santos J, Bagaini C, Ba J. A simulation of a COVID-19 epidemic based on a deterministic SEIR model. arXiv:2004.035752v2. (2020) doi: 10.1101/2020.04.20.20072272
7. Pedersen MG, Meneghini M. Quantifying undetected COVID-19 cases and effects of containment measures in Italy: predicting phase 2 dynamics. [Preprint]. (2020). doi: 10.13140/RG.2.2.11753.85600
8. Bjornstad ON, Shea K, Krzywinski M, Altman N. Modeling infectious epidemics. Nature Methods. (2020) 17:453–6. doi: 10.1038/s41592-020-0822-z
9. Okell LC, Verity R, Watson OJ, Mishra S, Walker P, Whittaker C, et al. Have deaths from COVID-19 in Europe plateaued due to herd immunity? Lancet. (2020) 395:e111. doi: 10.1016/S0140-6736(20)31357-X
10. Walker PGT, Wittaker C, Watson OJ, Beguelin M, Winskill P. The impact of COVID-19 and strategies for mitigation and suppression in low- and middle- income countries. Science. (2020) 369:413–22. doi: 10.1126/science.abc0035
11. Maclndtyre CR, Wang Q. Physical distance, face masks, and eye protection for prevention of COVID-19. Lancet. (2020) 27:1950–1. doi: 10.1016/S0140-6736(20)31183-1
12. Prather KA, Wang CC, Schooley RT. Reducing transmission of SARS-CoV2. Science. (2020) 368:1422–4. doi: 10.1126/science.abc6197
13. Chu DK, Duda S, Solo K, Yaacoub S, Schunemann HJ. Physical distancing, face masks, and eye protection to prevent person-to-person transmission of SARS_CoV-2 and Covid-19: a systematic review and meta-analysis. Lancet. (2020) 395:1973–87. doi: 10.1016/s0140-6736(20)31142-9
14. Tsallis C, Tirnakli U. Predicting COVID-19 peaks around the world. Front Phys. (2020) 8:1–6. doi: 10.3389/fphy.2020.00217
15. Yang J, Wang G, Zhang S. Impact of household quarantine on SARS-Cov-2 infection in mainland China: a mean-field modelling approach. Math Biosci Eng. (2020) 17:4500–12. doi: 10.3934/mbe.2020248
16. Zhou W, Wang A, Xia F, Xiao Y, Tang S. Effects of media reporting on mitigating spread of COVID-19 in the early phase of the outbreak. Math Biosci Eng. (2020) 17:2693–707. doi: 10.3934/mbe.2020147
17. Li Q, Guan X, Wu P, Wang X, Zhou L, Tong Y, et al. Early transmission dynamics in Wuhan, China, of novel coronavirus-infected pneumonia. N Eng J Med. (2020) 382:1199–207. doi: 10.1056/NEJMoa2001316
18. Lauer SA, Grantz KH, Bi Q, Jones FK, Zheng Q, Meredith HR, et al. The incubation period of Coronavirus Disease 2019 (COVID-19) from publicly reported confirmed cases: estimation and application. Ann Intern Med. (2020) 172:577–582. doi: 10.7326/M20-0504
19. Bai Y, Yao L, Wei T, Tian F, Jin DY, Chen L, et al. Presumed asymptomatic carrier transmission of COVID-19. JAMA. (2020) 323:1406–7. doi: 10.1001/jama.2020.2565
20. Nishiura H, Kobayashi T, Suzuki A, Jung SM, Hayashi K, Kinoshita R, et al. Estimation of the asymptomatic ratio of novel coronavirus infections (COVID-19). Int J Infect Dis. (2020) 94:154–5. doi: 10.1016/j.ijid.2020.03.020
21. Mizumoto K, Kagaya K, Zarebski A, Chowell G. Estimating the asymptomatic proportion of coronavirus disease 2019 (COVID-19) cases on board the Diamond princess cruise ship, Yokhama, Japan. Euro Surveill. (2020) 25:1–5. doi: 10.2807/1560-7917.ES.2020.25.10.2000180
22. Day M. Covid-19: identifying and isolating asymptomatic people helped eliminate virus in Italian village. BMJ. (2020) 368:m11165. doi: 10.1136/bmj.m1165
Appendix
Let us examine the SIQRK model. In the early phase of disease spread, we expect that the susceptible population is similar to the total population, S/N ≈ 1. Therefore, we can write a dynamic infection equation as found in Crokidakis [5] and Carcione et al. [6]:
By integrating this equation with initial condition I (0), we obtain the solution
The reproduction number, Ro, is given by
With COVID-19, the reproduction number is >1. The disease can spread easily through contact between individuals. The doubling time, τ, is given by . Infection rate β and the rate of detection of new cases, η, can be derived from the evolution time after early infection. Adding equations (3) and (4), we obtained a quantity such as
Therefore, we obtain the sum of quarantined cases and recovered cases as follows:
We calculated recovery rate γ obtained from the data set. The recovery rate is given by γ = (Rki − Rki−1)/Qi−1. The value of the recovery rate depends on time in the early stages, and converges to a constant value. We obtained a recovery rate of γ = 0.036/day.
Keywords: coronavirus (2019-nCoV), epidemic model, SIR (Susceptible Infected-Recovered) model, quarantine, asymptomatic
Citation: Chae SY, Lee K, Lee HM, Jung N, Le QA, Mafwele BJ, Lee TH, Kim DH and Lee JW (2020) Estimation of Infection Rate and Predictions of Disease Spreading Based on Initial Individuals Infected With COVID-19. Front. Phys. 8:311. doi: 10.3389/fphy.2020.00311
Received: 18 May 2020; Accepted: 06 July 2020;
Published: 14 August 2020.
Edited by:
Aristides (Aris) Moustakas, Natural History Museum of Crete, University of Crete, GreeceReviewed by:
Antonio Cadilhe, Universidade Federal da Bahia, BrazilAlexis Toda, University of California San Diego, United States
Copyright © 2020 Chae, Lee, Lee, Jung, Le, Mafwele, Lee, Kim and Lee. This is an open-access article distributed under the terms of the Creative Commons Attribution License (CC BY). The use, distribution or reproduction in other forums is permitted, provided the original author(s) and the copyright owner(s) are credited and that the original publication in this journal is cited, in accordance with accepted academic practice. No use, distribution or reproduction is permitted which does not comply with these terms.
*Correspondence: Jae Woo Lee, amFld2xlZSYjeDAwMDQwO2luaGEuYWMua3I=
 Seo Yoon Chae1
 Hyun Min Lee
 Quang Anh Le
 Tae Ho Lee
 Jae Woo Lee