- 1Tata Institute of Fundamental Research, Hyderabad, India
- 2Centre for Condensed Matter Theory, Department of Physics, Indian Institute of Science, Bangalore, India
- 3International Centre for Theoretical Sciences, Bangalore, India
Dynamic heterogeneity, believed to be one of the hallmarks of the dynamics of supercooled liquids, is expected to affect the diffusion of the particles comprising the liquid. We have carried out extensive molecular dynamics simulations of two model glass forming liquids in three dimensions to study the time scales at which Fick's law of diffusion starts to set in. We have identified two different Fickian time scales: one at which the mean squared displacement begins to show a linear dependence on time, and another one at which the distribution of particle displacements becomes Gaussian. These two times scales are found to be very different from each other and from the α relaxation time in both systems. An interesting connection is found between one of these Fickian time scales and the time scale obtained from the bond-breakage correlation function. We discuss the relation among these different time scales and their connection to dynamic heterogeneity in the system.
1. Introduction
One of the important unsolved problems in condensed matter physics is to understand the complex dynamics of supercooled liquids near the glass transition. In the last several decades, immense efforts have been made to understand the rapid rise of the viscosity and the slowing down of the dynamics of supercooled liquids as the glass transition is approached [1–12]. It is now well-accepted that the slow dynamics become increasingly heterogeneous near the glass transition. Numerous studies have been performed to understand this behavior [12–14]. While the origin of dynamic heterogeneity is still not fully understood, the lifetime of these heterogeneities are also debated. In a dynamically heterogeneous system, there are regions in which the local dynamics are considerably faster or slower than the dynamics averaged over the whole sample. One can consider any quantity that characterizes the local dynamics over a time scale τ and define the lifetime of dynamical heterogeneity as the minimum value of τ for which this quantity becomes homogeneous in space. In an earlier study [15], it has been shown that the lifetime of dynamic heterogeneity grows faster than the α-relaxation time, whereas in some other works [16–20], the ratio of this time scale with the α-relaxation time is found to depend sensitively on the temperature.
It is well-known that the mean squared displacement (MSD), 〈Δr2〉, computed for a supercooled liquid shows an initial ballistic growth with time and then tends to plateau at an intermediate time scale. The plateau is followed by a diffusive region. The plateau in the MSD appears because of the hindrance of the motion of a particle caused by the “cage” formed by its neighbors. The diffusive regime sets in when the particles manage to break out of the cage, but the dependence of the MSD on time does not become linear until a time scale that is larger than the α-relaxation time. Although the MSD shows diffusive behavior at this time scale, the dynamics of the system remain spatially heterogeneous. In [15], it has been shown that the distribution of the displacements of the particles becomes Gaussian at a time scale that is at least 30 − 40 times larger than the α-relaxation time. True Fickian diffusion starts after this time scale. Two different time scales related to diffusion therefore exist. One of these is the time at which the slope of the MSD vs. time in a log-log plot becomes unity. We call this time scale τD. The other one is the time at which the distribution of the displacements of the particles becomes Gaussian. We call this time τF. A similar time scale, τH, is obtained via the Binder cumulant of the van Hove correlation function.
It is interesting to inquire whether the Fickian time scales defined above are related to the lifetime of dynamic heterogeneity. In recent studies [21, 22], it has been shown that the short-time β-relaxation in supercooled liquid is a cooperative process. It is also shown that the temperature dependence of the length scale associated with the cooperative β-relaxation process is the same as that of the dynamic heterogeneity length scale obtained at the α-relaxation time. Note that the α-relaxation time can be many orders of a magnitude larger than the β-relaxation time, especially at low temperatures. Thus, the dynamics of a supercooled liquid is heterogeneous at time scales that can be as short as the β-relaxation time, and these heterogeneities persist up to time scales that can be much longer. In the experimental studies of Cicerone and Ediger [16, 17], the lifetime of dynamic heterogeneity was defined as the time scale over which the local dynamics in a region where it is slower than the dynamics averaged over the whole system continues to remain so. The difference between this time scale and the α-relaxation time was found [16, 17] to increase with increasing supercooling. Numerical studies [4, 23–25] have suggested that dynamic heterogeneity in glass-forming liquids of binary hard-sphere systems can survive up to a time scale that is larger than the α-relaxation time by a factor of a few tens. In [15], it has been suggested that the time scale obtained from the distribution of single particle displacements may provide a lower bound for the lifetime of dynamic heterogeneities present in the system, but the actual lifetime of the heterogeneities may be much larger. The violation of the Stokes-Einstein relation between the diffusion coefficient and the viscosity [26–28], another poorly understood phenomenon in glassy dynamics, is also believed to be closely related to dynamic heterogeneity.
In this paper, we have addressed some of the issues mentioned above via extensive molecular dynamics simulations of two well-known model glass forming liquids in three spatial dimensions. The primary objective of this study is to estimate the time scales τD, τF, and τH in different generic glass-forming liquids and to compare them with other well-known important time scales in the system, such as the α-relaxation time τα and the bond-breakage time scale τBB (to be defined later) We have looked for the existence of correlations among these different time scales and tried to figure out their consequence in understanding the dynamics of glass forming liquids approaching the glass transition. We find that the time scales of diffusion, τD, τF, and τH, are longer than τα in the temperature range considered here. The temperature dependence of τF is similar to that of τH and their growth with decreasing temperature is faster than that of τα. The growth of τD as the temperature is reduced but is, on the other hand, slower than that of τα. We find that the relations between pairs of these time scales are described by power laws at low temperatures, so that the glass transition temperatures obtained from Vogel-Fulcher-Tammann [29, 30] (VFT) or mode coupling [31, 32] (power law) fits to the temperature dependence of these time scales and are the same within error bars. We also find an intriguing connection between τD and the bond-breakage time scale τBB. The implications of these findings for the violation of the Stokes-Einstein relation and the kinetic fragility are discussed.
The rest of the paper is organized as follows. We present the details of the models studied and the simulation methodology in section 2. We then introduce different correlation functions that are computed to estimate different time scales and present our results for two different generic glass-forming liquids. Finally, we conclude with a discussion of the importance of these different time scales for understanding the intricate role played by dynamic heterogeneity in the dynamics of glass-forming liquids.
2. Models and Methods
We have studied two different model glass forming liquids in three dimensions.
• 3dKA Model [33]: This is a well-known 80:20 binary Lennard-Jones mixture in three dimensions. Particles interact via the following pairwise interaction
where α, β ∈ {A, B} and ϵAA = 1.0, ϵAB = 1.5, ϵBB = 0.5, σAA = 1.0, σAB = 0.80, σBB = 0.88. We cut off the interaction potential at 2.50σαβ. A quadratic polynomial is used to make the potential and its first two derivatives smooth at cutoff distance. The temperature range for the simulations is T ∈ [0.450 − 1.000] and the system size is N = 8, 000.
• 3dR10 Model [34]: It is a 50:50 binary mixture where the particles interact via
with n = 10. The potential is cut off at a distance 1.38σαβ and again, a quadratic polynomial is used to make potential and its first two derivative smooth at the cutoff distance. Here ϵαβ = 1.0, σAA = 1.0, σAB = 1.22, and σBB = 1.40. The temperature range for the simulations is T ∈ [0.520 − 1.000] and N = 1, 0000.
For all the studied models we have performed NVT molecular dynamics (MD) simulations with a modified leap-frog algorithm. We used the Berendsen thermostat to keep the temperature constant. Our integration time step is dt = 0.005. The number of MD steps are 107 − 108, depending on the temperature.
3. Correlation Functions
3.1. Overlap Correlation Function
We characterize the dynamics by calculating the well-known two-point density-density correlation function Q(t). It measures the overlap between two configurations separated by time t. The self-part of this correlation function is defined as
where w(x) is a window function with
The value of a is chosen to be 0.30 which is close to the value at which the MSD forms a plateau. The window function is chosen to remove the possible decorrelation due to the vibrational motion of the particles inside their cage. A different choice of the parameter a does not change the results qualitatively. The α-relaxation time τα is obtained from Qs(t) using the condition Qs(t = τα) = exp(−1).
3.2. van Hove Correlation Function
The van Hove correlation function measures the probability that a particle has displacement x after time t. The self-part of the van Hove correlation function [35] is defined as
where xi(t) is the x-component of the position vector of particle i at time t.
3.3. Bond-Breakage Correlation Function
The bond-breakage correlation function is defined in the following way [36–38]. At t = t0 a pair of particle i (of type α) and j (of type β) is considered to be bonded if
If rij(t) ≤ 1.35σαβ, the bond is said to have survived at time t. We calculate the number of bonds that survive at time t and the bond-breakage correlation function is defined as the ratio of this number to the initial number of bonds. The bond-breakage time scale τBB is the time at which the correlation function goes to 1/e of its initial value.
4. Results
We show below the results for only one type of particle (type A). The results for the other type of particle (type B) are qualitatively similar [15]. In the 3dKA model (80:20 mixture), the number of B-type particles is substantially smaller, resulting in larger statistical fluctuations. So, we prefer to show the results for A-type particles.
4.1. Time Scale From the Mean Square Displacement
As mentioned before, the mean square displacement (MSD) shows three distinct regimes for a supercooled liquid: initial ballistic growth i.e., 〈Δr2〉 ~ t2, then a plateau followed by a diffusive regime i.e., 〈Δr2〉 ~ t. So, a plot of the logarithmic derivative of the MSD with respect to time starts from 2, goes to a minimum and then eventually goes to 1, corresponding to the above three distinct regimes. The time scale where it goes to 1 is of importance as this is the time at which the system begins to show diffusive behavior. We have calculated this time scale, τD, for different temperatures for both the model systems. In the top panel of Figure 1, we show the logarithmic derivative of the MSD as a function of time for all the studied temperatures for the 3dR10 model. We have taken to define the time scale τD. The temperature dependence of this time scale is shown in the bottom panel of the same figure. The temperature dependence can be fitted very well using the VFT form with the divergence temperature TVFT≃0.406, which is close to ~0.404, the value obtained using τα. We consider two other characteristic temperatures—the mode coupling critical temperature Tc obtained from fitting the temperature dependence of a time scale to a power-law divergence, and the “glass transition temperature” Tg defined as the temperature at which the time scale being considered reaches the value 106 (this is similar to the definition of the experimental glass transition temperature). The values of Tc and Tg obtained from the temperature dependence of τD are ~0.495 and ~0.484, respectively. These values are close to those (~0.491 and ~0.481, respectively) obtained using τα.
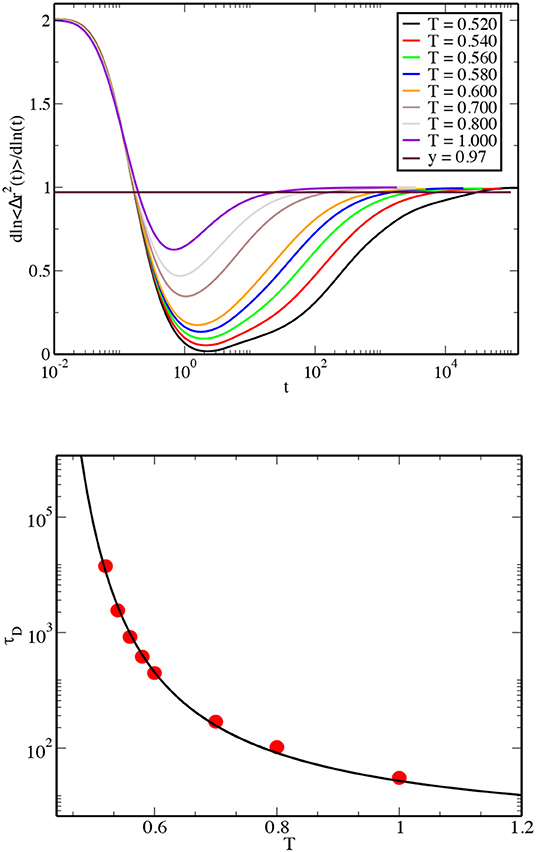
Figure 1. (Top) Log-derivative of MSD is plotted vs. time for the 3dR10 model. The horizontal line corresponds to 0.97. (Bottom) The dependence of the time scale τD on the temperature. The line passing through the data points is a fit of the data to the VFT form, .
To understand the mutual relationship between τD and τα, we have plotted the ratio of these two time scales (τD/τα) as a function of temperature in the top panel of Figure 2. As the temperature is decreased, this ratio first increases, reaches a maximum near T = 0.8, and then decreases as the temperature is lowered further. The temperature at which τD/τα peaks is close to the onset temperature Ton [39] for this model. Thus, at temperatures lower than Ton which corresponds to the temperature below which the effects of the potential energy landscape becomes important, the diffusion time scale τD grows more slowly than the structural relaxation time τα with decreasing temperature.
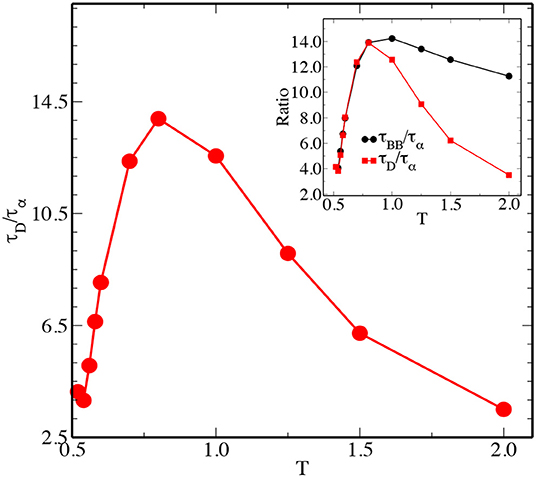
Figure 2. The ratio τD/τα is plotted as a function of T for the 3dR10 model. The inset shows a comparison of this ratio with the ratio of τBB/τα for the same model.
We have also calculated the bond-breakage time scale τBB following the method described in section 3. It is the time scale where most of the particles have gone though some amount of reshuffling of their neighbors, as measured using the breakage of nearest neighbor bonds. The temperature dependence of τBB/τα is similar to that of τD/τα, as shown in the inset of Figure 2. In particular, these two ratios exhibit nearly identical temperature dependence for values of T lower than that at which they exhibit a peak. This observation suggests an intriguing connection between diffusion and bond breakage processes at temperatures lower than the onset temperature. Possible significance of this observation is discussed in section 8.
To calculate τD, we have chosen the cutoff value of the logarithmic derivative of the MSD to be 0.97. Ideally, τD should be calculated where this value actually goes to unity. This is quite challenging as for low temperatures, the derivative does not reach the value of unity in our simulation time scale. Even if the derivative goes to unity within the simulation time scale, the noise in its measurement makes it difficult to accurately determine the time at which it first reaches this value. To check whether the non-monotonic behavior of the temperature dependence of τD/τα depends on how we calculate τD, we have done a systematic study of this ratio by changing the cutoff. Figure 3 shows the cutoff dependent ratio for the 3dKA model systems. From the plot, it is clear that the non-monotonic behavior is a feature that is independent of the choice of the cutoff: the non-monotonicity increases systematically as the cutoff approaches unity.
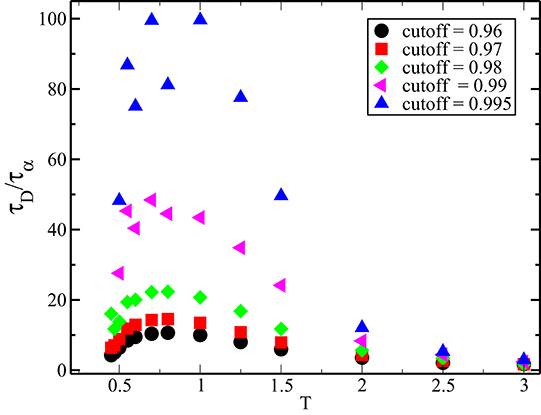
Figure 3. Cutoff dependence of τD/τα for the 3dKA model. It is clear that although the value of this ratio depends on the cutoff, the non-monotonic temperature dependence is present for all values of the cutoff.
4.2. Time Scale From the Distribution of Single-Particle Displacements
Next, we estimate the time scale of the onset of Fickian diffusion by following the procedure discussed in [15]. To study the onset of Fickian diffusion, it is important to calculate the distribution of single particle displacements, P(log10(δr), t) at time t. As discussed in [15], this distribution is connected to the self part of the van Hove correlation function as
If the motion of the particles is governed by Fick's law of diffusion, the distribution of single particle displacements i.e., P[log10(δr, t)], should become Gaussian and remain so at longer times. Moreover, the peak value of the distribution should reach a value ≈2.13. Any deviation from this behavior would indicate non-Fickian diffusion as well as dynamic heterogeneity [15, 40]. Figure 4 shows plots for P(log10(δr, t)) at different times for two different temperatures T = 0.450 and 1.000 for the 3dKA model. For the lower temperature (T = 0.450), deviations from Gaussian behavior are clearly visible at smaller times, whereas the distribution approaches a Gaussian shape for longer times and the peak value of the distribution also approaches ≈2.13.
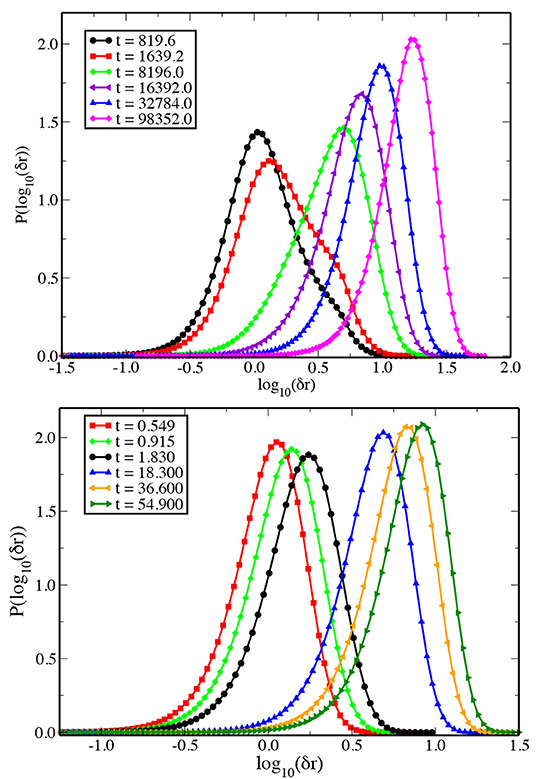
Figure 4. (Top) Distribution of the logarithm of single particle displacements at different times at T = 0.450 for the 3dKA model. For relatively short times, the distribution shows signs of bimodality, whereas at longer times it tends to be more Gaussian. (Bottom) Similar plot at T = 1.000.
At the higher temperature, T = 1.000, deviations from the Gaussian shape are not very clear, but the peak value reaches the value ~2.13 only after a few τα. This suggests that even at high temperatures, the dynamics are affected by the presence of spatial heterogeneity at time scales larger than τα. We define the time scale of onset of Fickian diffusion as the time at which the peak value of the distribution goes to ≈1.92, similar to the criterion adopted in [15] and refer to this time scale as τF. In the left panel of Figure 5, we show plots of the peak value of P(log10(δr), t) with increasing time for all the studied temperatures. In the right panel we show the temperature dependence of the time scale τF. The temperature dependence of this time scale can be fitted very well to the VFT formula. The line passing through the data points in the right panel shows the VFT fit with TVFT≃0.289.
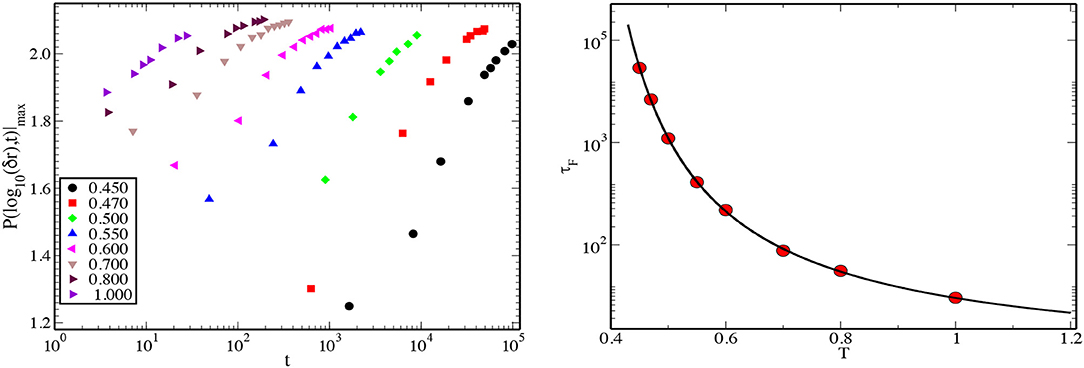
Figure 5. (Left) Value of the maximum of P(log10(Δr), t) is plotted against time t for different temperatures for the 3dKA model. The time where it reaches 1.92 is defined as the Fickian time scale τF. (Right) Variation of the logarithm of the time scale τF with temperature T. The line passing through the data points is a fit to the VFT form.
To see the mutual relationship between τα and τF, in Figure 6 we have plotted the ratio (τF/τα) for all the studied temperatures. From the plot, one can see that τF increases much more rapidly than τα when the temperature is decreased. The ratio changes from 5 to 25 in the temperature window T ∈ [1.000 − 0.450] as shown in Figure 6.
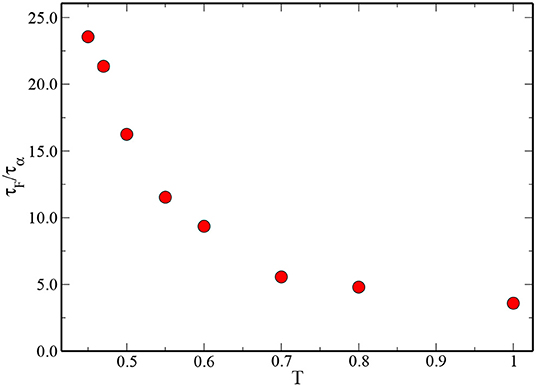
Figure 6. The ratio of τF/τα is plotted as a function of T for the 3dKA model. Note that τF increases much faster than τα with decreasing temperature.
Ideally, one should use a cutoff at 2.13 in order to calculate τF. We could not do that because reaching this value within our simulation time scale is not possible. We have, however, checked that the difference between τF and the other time scale τD related to diffusion is not an artifact of using a cutoff lower than 2.13 in the calculation of τF and a cutoff lower than 1.0 in the calculation of τD. It is evident from the data that τF is larger than τD and it increases faster than τD as the temperature is reduced. There are indications that these two time scales approach each other at temperatures higher than 3.0.
The van Hove function is expected to have a Gaussian form for Fickian diffusion. In the top panel of Figure 7, we have plotted the van Hove function for the 3dKA model at T = 0.450 for different times. From the plots, one can see evidence for non-Gaussian behavior for smaller times and an approach to a Gaussian form for longer times. The bottom panel shows similar plots for T = 1.000. To get a second measure of the degree of non-Gaussianity, we have calculated the Binder cumulant of the van Hove function for different times. The Binder cumulant, which provides a measure of the excess kurtosis of the distribution, is defined as
If the van Hove function is perfectly Gaussian, the Binder cumulant should be zero. For that to happen, one needs to run the simulations for very long times. Here we have defined a time scale τH as the time where the Binder cumulant of the van Hove function becomes ≈0.07. In the top panel of Figure 8, we show the Binder cumulant for all studied temperatures at different times for the 3dKA model. The horizontal line in the figure corresponds to the value of 0.07. The bottom panel shows the ratio of τH and τα as a function of temperature. The temperature dependence of τH/τα is similar to that of τF/τα. This is not surprising because both τF and τH correspond to the time at which the distribution of particle displacements becomes Gaussian. Note that τH is larger than τF for our choice of the cutoffs used for measuring these time scales. The values of the ratio τH/τα lie in the range ~6 − 35 for temperatures in the range T ∈ [1.000 − 0.450]. The characteristic temperatures, TVFT, Tc and Tg, obtained from the different time scales in the 3dKA model are listed in Table 1. The values of TVFT and Tc obtained from the α-relaxation time are found to be close to those obtained from the other time scales. The value of Tg, which is sensitive to the absolute value of the time scale, depends of the time scale used to define it. At this point it is worth mentioning that another time scale τ4, obtained from the four-point susceptibility χ4(t) [3] (τ4 is the time scale where the χ4(t) attains its maximum value), is proportional to τα with proportionality constants close to one [3]. Therefore, this time scale does not provide any new information.
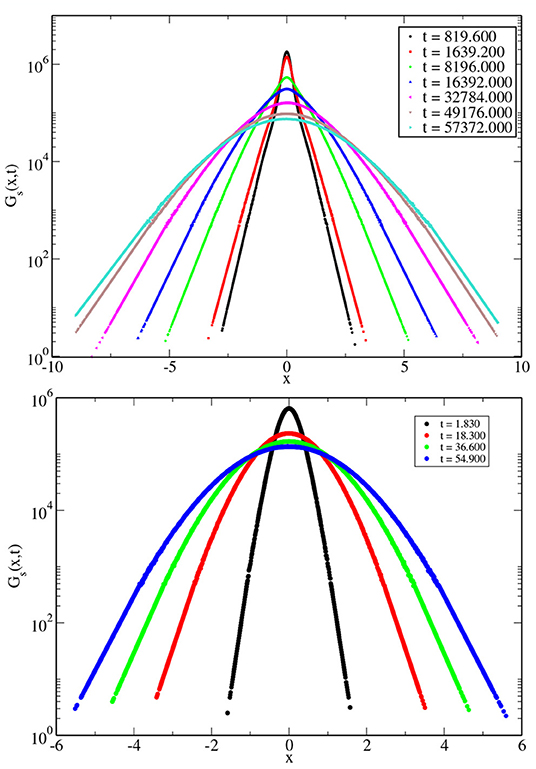
Figure 7. (Top) The van Hove correlation function at different times at T = 0.450 for the 3dKA model. (Bottom) Similar plot for T = 1.000.
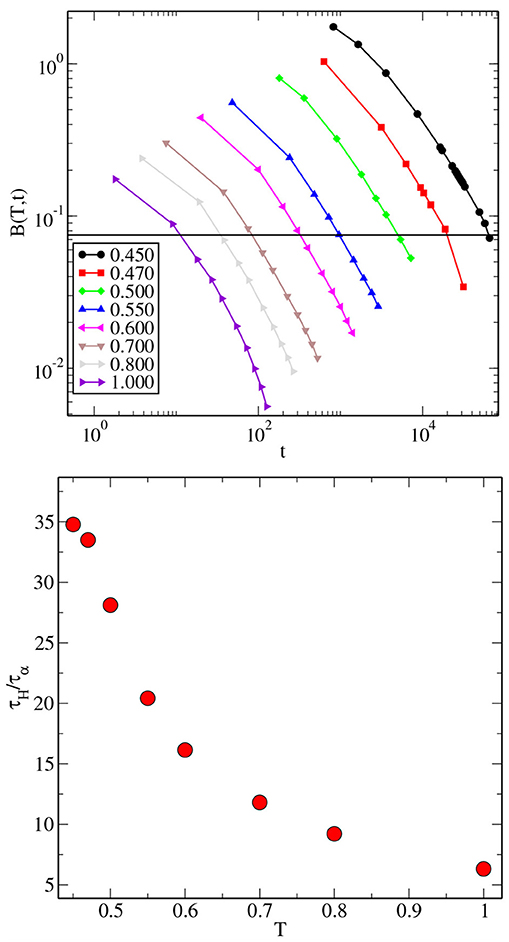
Figure 8. (Top) The Binder Cumulant of the van Hove correlation function for different times and all studied temperatures for the 3dKA model. The horizontal line corresponds to B(T, t) = 0.07. The time scale τH is defined as the time at which B(T, t) attains this value. (Bottom) The temperature dependence of the ratio τH/τα.
As suggested in [15], the time scales τF and τH may be thought of as lower bounds of the lifetime of dynamic heterogeneity. As reported in [41, 42], the distribution of diffusion constants is a good measure of dynamic heterogeneity in the system. The distribution of diffusion constants is obtained from the self-part of the van Hove function using Lucy iteration [43]. We have followed the method described in [41, 42]. In the top and bottom panels of Figure 9, we show the distribution of diffusion constants for T = 0.450 and T = 1.000, respectively, for different times for the 3dKA model. For a high temperature e.g., T = 1.000, the distribution does not have multiple peaks but the broadness of the distribution reflects the underlying heterogeneity. For T = 0.450, one can see that there are multiple peaks in the distributions even at time scales longer than τF. It approaches unimodal behavior at much longer time scales. So, heterogeneity survives even after the system starts to follow Fick's law of diffusion, which is in agreement with the conclusion of previous studies [15].
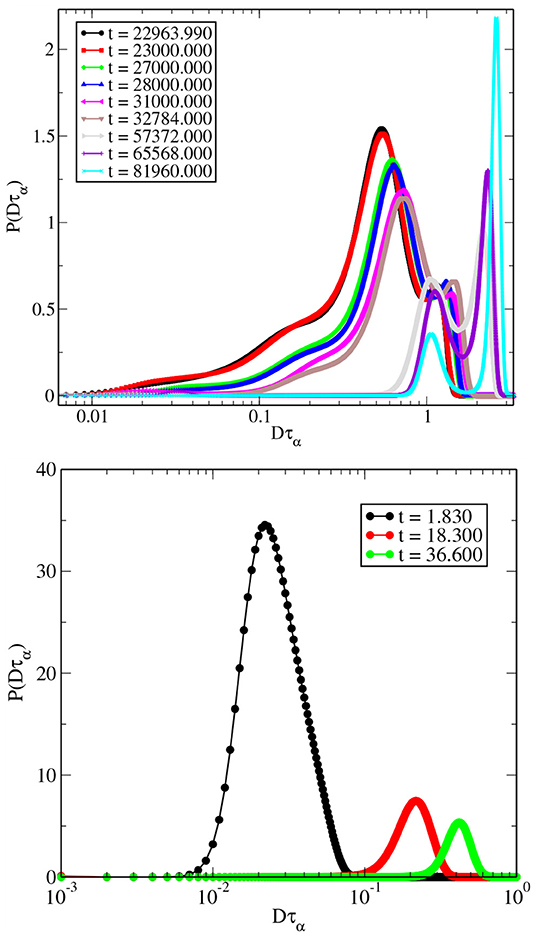
Figure 9. (Top) Distribution of diffusion constants for T = 0.450 for 3dKA model. (Bottom) Similar plot for T = 1.000.
5. Relation Between Different Time Scales
In the previous section, we found that the temperature dependence of the different time scales (τα, τD, τF, and τH) can be well-fitted by the VFT form with very similar values of the divergence temperature TVFT. This suggests that the different time scales are related to one another via power laws. In Figure 10, we have shown such a relationship between different time scales. The linear dependence in a log-log plot confirms that a power-law relation describes the data quite well, especially at low temperatures. The exponent m that describes the power-law relation between one of the time scales of diffusion and the α-relaxation time is ≃0.83 for τD, implying that τD increases more slowly than τα with decreasing temperature. The values of m for τF and τH obtained from the fits, m≃1.21 and m≃1.17, respectively, are close to one another. This is consistent with the observation, mentioned above, that these two time scales have a very similar temperature dependence. The larger than unity values of m for these time scales imply that their growth, with decreasing temperature, is faster than the growth of τα. Since τF and τH are believed to provide lower bounds to the lifetime of dynamic heterogeneity, this result implies that dynamic heterogeneities exist over time scales that are much longer than the α-relaxation time at low temperatures. The values of m for τD, τF and τH also imply that τF and τH increase faster than τD as the temperature is decreased, indicating that at low temperatures, there is a large time interval over which the MSD is linear in time, but the distribution of particle displacements is not Gaussian. Yet another consequence of the observed power-law dependence of the diffusion-related time scales on τα is that the transition temperature of mode-coupling theory obtained by fitting the temperature dependence of τD, τF or τH to a power law would be the same as that obtained from a power-law fit to the temperature dependence of τα. However, the exponent of the power-law would depend on which time scale is considered.
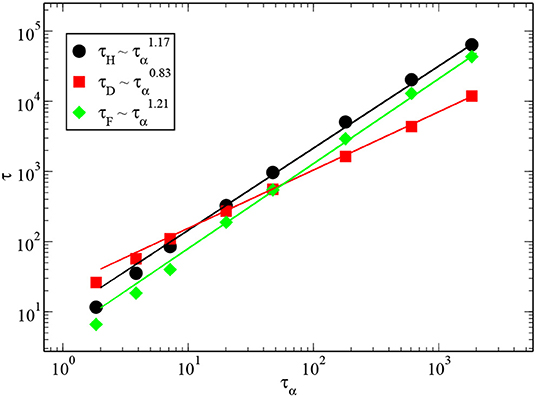
Figure 10. Different relaxation times, τD, τF, and τH, are plotted against the α-relaxation time τα for 3dKA model. Reasonable linear dependence in a log-log plot suggests that they are related to one another via power laws. The lines passing through the data points are best fits to power laws.
6. Stokes-Einstein Relation and Kinetic Fragility
The violation of the Stokes-Einstien relation [26–28] between the diffusion coefficient D and the viscosity (or a suitable time scale τ) in deeply supercooled liquids [41, 42] is believed to be closely related to dynamic heterogeneity. It is interesting to examine the extent of violation of the SE relation when one of the time scales studied above is considered to be the relevant time scale τ. It is known from earlier work [41] that D∝1/τα (i.e., the SE relation is satisfied) at high temperatures, but a modified relation, , where ω is called the fractional SE exponent, is satisfied at lower temperatures. The value of the exponent (1 − ω) is 0.78 and 0.75 for 3dKA and 3dR10 models, respectively.
The power-law dependence of the time scales of diffusion on τα implies that these time scales also satisfy a modified SE relation with values of the fractional SE exponent given by (1 − ω)/m. Since m for τD for the 3dKA model is close to the value of (1 − ω), the SE relation is expected to be valid for this time scale (i.e., D∝1/τD) at low temperatures. On the other hand, the fractional SE exponent is expected to be small (close to 0.65) for the two other time scales. The plots of the diffusion coefficient vs. different time scales shown in Figure 11 illustrate this behavior. The SE relation is found to be satisfied for τD, whereas the fractional SE exponent for τF is 0.65. Similar behavior is found for the 3dR10 model, as illustrated in the bottom panel of Figure 11. The SE relation between D and τD≃τBB was also reported in an earlier study [44].
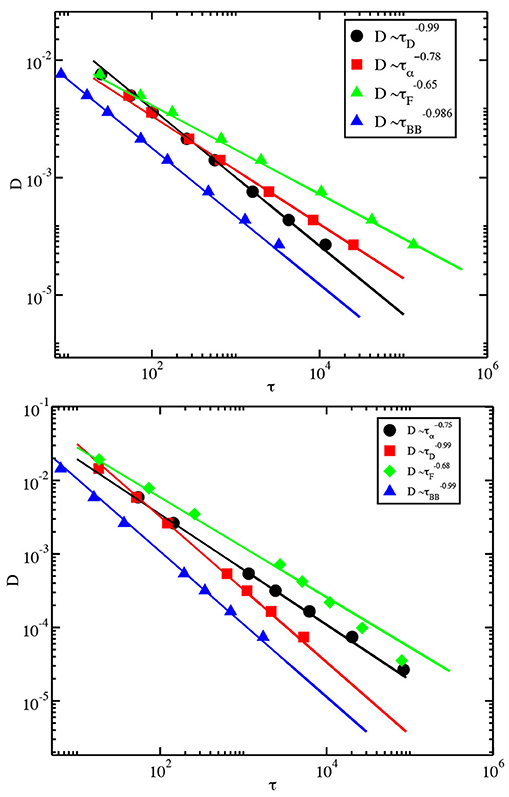
Figure 11. (Top) The diffusion constant D is plotted against different time scales for the 3dKA model system. The lines passing through the data points are power-law fits. (Bottom) Similar plot for the 3dR10 model.
As noted above, τα satisfies the SE relation at temperatures higher than the onset temperature. Since the temperature dependence of the diffusion-related time scales is different from that of τα, even at these higher temperatures, these time scales do not satisfy the SE relation at temperatures near the onset temperature. The SE relation may be restored for these time scales at temperatures substantially higher than the onset temperature.
The power-law dependence of the diffusion-related time scales on τα also implies that the kinetic fragility parameter κ, obtained from a fit of the temperature dependence of a time scale τ to the VFT form, τ(T) = τ0exp[1/(κ(T/TVFT − 1)], for these time scales is different from that for τα. The value of κ for one of these time scales would be 1/m times the value for τα, implying that the fragility for τD is higher than that for τα, whereas the temperature dependence of τF and τH corresponds to a smaller value of the fragility.
7. System-Size Dependence of Time Scales
In Figure 12, we show the system-size dependence of τD (left panel) at different temperatures for the 3dKA model. Almost no system-size dependence is observed at the higher temperatures, and only a small dependence is found at the lowest temperature for system sizes in the range N ∈ [500 − 10, 000]. We have done simulations for smaller system sizes in the range N ∈ [100 − 1, 000] for the 3dR10 model. Note that for this model, one can simulate systems with smaller sizes as the inter-particle potential has shorter range. The results are shown in the right panel of Figure 12 where one can clearly see the evidence for an initial increase of the time scale with system size at low temperatures. Note that τα has a very different system size dependence—its value decreases with increasing system size at low temperatures [7]. This observation is puzzling and warrants further investigation.
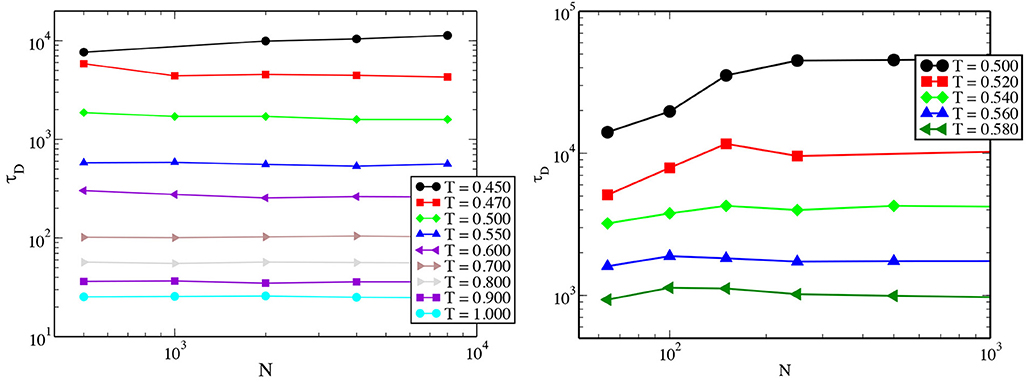
Figure 12. (Left) System size dependence of τD at different temperatures for the 3dKA model system. The observed system size dependence for N ∈ [500 − 10, 000] is very weak and only small dependence is observed at the low temperature. (Right) Zoomed in version of similar plot but for small system sizes N ∈ [100 − 1, 000] for the lowest four temperatures for the 3dR10 model. Note for the 3dR10 model, one can simulate smaller sizes as the range of the inter particle potential is small. See text for details.
8. Summary and Conclusions
In summary, we have estimated different time scales related to diffusion for two well-known glass-forming liquids. One of these time scales, τD, is the time at which the dependence of the MSD on time becomes linear. The other, τF or τH, represents the time at which the distribution of particle displacements becomes Gaussian. The actual values of these time scales depend on the cutoff or tolerance factor used in their measurement from MD simulations. However, our investigation of the dependence of the time scales on the cutoff suggests that the qualitative behavior we find is independent of the choice of the cutoff. The results obtained for the two model systems are similar. We show that both τD and τF are larger than the α-relaxation time τα in the temperature range considered in our simulations. At low temperatures (T lower than the onset temperature Ton), the growth of τD with decreasing temperature is slower, whereas the growth of τF is faster than that of τα. Between the two diffusion-related time scales, τF is substantially larger than τD, indicating that there is a long time interval over which the MSD is linear in time, but the distribution of the displacements is not Gaussian. If both linear dependence of the MSD on time and Guassian distribution of displacements are considered to be essential features of Fickian diffusion, then the longer time scale τF should be identified as the time at which Fickian diffusion sets in. Our results then imply that Fickian diffusion sets in at times much longer than the α-relaxation time in deeply supercooled liquids. This is in agreement with earlier results [15].
We find that the ratio τD/τα is a non-monotonic function of temperature and it peaks at a temperature close to the onset temperature Ton at which the dynamics starts being influenced by the energy landscape. This observation suggests an intriguing connection between the behavior of the MSD as a function of time and the influence of the energy landscape on the dynamics. Another interesting observation is that τD is close to the bond-breakage time scale τBB for temperatures lower than Ton.
The diffusion-related time scales τD and τF and the α-relaxation time τα are mutually correlated and the relation between pairs of them is well-described by a power law at low temperatures. This implies that if any one of them diverge at some temperature, then the others also diverge at the same temperature. Thus, the VFT temperature and the critical temperature of mode-coupling theory are the same for all these time scales. The power-law relation also implies that the fractional SE exponent and the kinetic fragility associated with the diffusion-related time scales are simply related to those obtained for τα. An interesting result in this context is that the time scale τD and the diffusion coefficient D satisfy the SE relation at temperatures lower than Ton. Similar results, τD≃τBB∝1/D, have been found in simulations of supercooled water [45, 46] and supercooled silica [47]. These results suggest that the observed relations among τD, τBB, and D are probably universal in the sense that they are satisfied in all supercooled liquids.
On the other hand, the Fickian time scale τF exhibits strong violation on the SE relation, with a fractional SE exponent close to 0.65. This is puzzling because one would naively expect the SE relation to be valid when the diffusion is Fickian. However, the violation of the SE relation is believed to be caused by dynamic heterogeneity and the lifetime of dynamic heterogeneity may be longer than τF. We have found some evidence for this from a calculation of the distribution of local diffusion constants (Figure 9) which exhibits multiple peaks for time scales longer than τF, indicating that the lifetime of the heterogeneity is longer than the Fickian time scale. This is consistent with the suggestion [15] that τF is a lower bound to the lifetime of dynamic heterogeneity.
At present, there is no clear understanding of the origin of most of the observations described above. A few conclusions can be drawn from these observations. The equality of the time scales τD and τBB at temperatures lower than the onset temperature indicates that the onset of linear diffusion (MSD proportional to time) depends crucially on bond-breaking events that lead to the escape of a particle from the “cage” formed by its neighbors. The fact that the structural relaxation time τα increases faster than τBB at low temperatures (the ratio τBB/τα decreases as the temperature is reduced below the onset temperature) suggests that structural relaxation involves additional processes that are slower than bond-breaking. The observations that the time scale τF of Fickian diffusion is much longer than τD and the lifetime of dynamic heterogeneity obtained from the distribution of local diffusion constants is even longer indicate that dynamic heterogeneities persist in the system and continue to influence diffusive behavior over time scales that are much longer than the time scale of linear diffusion.
These observations suggest the following picture for the dynamics over time scales longer than τD but shorter than τF: the dynamically heterogeneous system consists of groups of particles with the property that the particles belonging to a particular group exhibit linear diffusion with diffusion constant D, but the value of D is different for different groups. Under these circumstances, the mean square displacement averaged over all the particles will be linear in time with a diffusion constant that is a properly weighted average of the diffusion constants of individual groups. However, the distribution of the displacements of all the particles will not be Gaussian, even if the distribution is Gaussian for the particles in a particular group—a Gaussian distribution will be obtained only after a longer time scale τF at which the heterogeneity in the values of the diffusion constants disappears. This time scale τF is clearly related to the lifetime of dynamic heterogeneity, but as far as we know, a theoretical understanding of the magnitude and temperature dependence of τF is not yet available.
All these observations raise several interesting questions about the characteristics of the dynamics of supercooled liquids. Answers to these questions will be important in understanding the role of dynamic heterogeneity in glassy relaxation.
Data Availability Statement
All datasets generated for this study are included in the article/supplementary material.
Author Contributions
SK and CD designed the project. RD carried out the research. RD, CD, and SK analyzed the data and wrote the paper. All authors contributed to the article and approved the submitted version.
Funding
This project was funded by intramural funds at TIFR Hyderabad from the Department of Atomic Energy (DAE). Support from Swarna Jayanti Fellowship grants DST/SJF/PSA-01/2018-19 and SB/SFJ/2019-20/05 are also acknowledged.
Conflict of Interest
The authors declare that the research was conducted in the absence of any commercial or financial relationships that could be construed as a potential conflict of interest.
References
1. Cavagna A. Supercooled liquids for pedestrians. Phys Rep. (2009) 476:51–124. doi: 10.1016/j.physrep.2009.03.003
2. Berthier L, Biroli G. Theoretical perspective on the glass transition and amorphous materials. Rev Mod Phys. (2011) 83:587–645. doi: 10.1103/RevModPhys.83.587
3. Karmakar S, Dasgupta C, Sastry S. Growing length scales and their relation to timescales in glass-forming liquids. Annu Rev Condens Matter Phys. (2014) 5:255–84. doi: 10.1146/annurev-conmatphys-031113-133848
4. Berthier L, Biroli G, Bouchaud JP, Cipelletti L, Masri DE, L'Hôte D, et al. Direct experimental evidence of a growing length scale accompanying the glass transition. Science. (2005) 310:1797–800. doi: 10.1126/science.1120714
5. Biroli G, Bouchaud JP, Miyazaki K, Reichman DR. Inhomogeneous mode-coupling theory and growing dynamic length in supercooled liquids. Phys Rev Lett. (2006) 97:195701. doi: 10.1103/PhysRevLett.97.195701
6. Biroli G, Bouchaud JP, Cavagna A, Grigera TS, Verrocchio P. Thermodynamic signature of growing amorphous order in glass-forming liquids. Nat Phys. (2008) 4:771. doi: 10.1038/nphys1050
7. Karmakar S, Dasgupta C, Sastry S. Growing length and time scales in glass-forming liquids. Proc Natl Acad Sci USA. (2009) 106:3675–9. doi: 10.1073/pnas.0811082106
8. Karmakar S, Dasgupta C, Sastry S. Length scales in glass-forming liquids and related systems: a review. Rep Prog Phys. (2015) 79:016601. doi: 10.1088/0034-4885/79/1/016601
9. Kirkpatrick TR, Thirumalai D, Wolynes PG. Scaling concepts for the dynamics of viscous liquids near an ideal glassy state. Phys Rev A. (1989) 40:1045–54. doi: 10.1103/PhysRevA.40.1045
10. Lubchenko V, Wolynes PG. Theory of structural glasses and supercooled liquids. Annu Rev Phys Chem. (2007) 58:235–66. doi: 10.1146/annurev.physchem.58.032806.104653
11. Biroli G, Bouchaud J. Structural Glasses and Supercooled Liquids: Theory, Experiment, and Applications. Hoboken, NJ: Wiley publication (2012).
12. Ediger MD. Spatially heterogeneous dynamics in supercooled liquids. Annu Rev Phys Chem. (2000) 51:99–128. doi: 10.1146/annurev.physchem.51.1.99
13. Richert R. Heterogeneous dynamics in liquids: fluctuations in space and time. J Phys. (2002) 14:R703. doi: 10.1088/0953-8984/14/23/201
14. Andersen HC. Molecular dynamics studies of heterogeneous dynamics and dynamic crossover in supercooled atomic liquids. Proc Natl Acad Sci USA. (2005) 102:6686–91. doi: 10.1073/pnas.0500946102
15. Szamel G, Flenner E. Time scale for the onset of Fickian diffusion in supercooled liquids. Phys Rev E. (2006) 73:011504. doi: 10.1103/PhysRevE.73.011504
16. Cicerone MT, Ediger MD. Relaxation of spatially heterogeneous dynamic domains in supercooled orthoterphenyl. J Chem Phys. (1995) 103:5684–92. doi: 10.1063/1.470551
17. Wang CY, Ediger MD. How long do regions of different dynamics persist in supercooled o-Terphenyl? J Phys Chem B. (1999) 103:4177–84. doi: 10.1021/jp984149x
18. Deschenes LA, Vanden Bout DA. Single-molecule studies of heterogeneous dynamics in polymer melts near the glass transition. Science. (2001) 292:255–8. doi: 10.1126/science.1056430
19. Böhmer R, Hinze G, Diezemann G, Geil B, Sillescu H. Dynamic heterogeneity in supercooled ortho-terphenyl studied by multidimensional deuteron NMR. Europhys Lett. (1996) 36:55.
20. Böhmer R, Diezemann G, Hinze G, Sillescu H. A nuclear magnetic resonance study of higher-order correlation functions in supercooled ortho-terphenyl. J Chem Phys. (1998) 108:890–9. doi: 10.1063/1.475452
21. Das R, Tah I, Karmakar S. Possible universal relation between short time β-relaxation and long time α-relaxation in glass-forming liquids. J Chem Phys. (2018) 149:024501. doi: 10.1063/1.5033555
22. Karmakar S, Dasgupta C, Sastry S. Short-time beta relaxation in glass-forming liquids is cooperative in nature. Phys Rev Lett. (2016) 116:085701. doi: 10.1103/PhysRevLett.116.085701
23. Flenner E, Szamel G. Dynamic heterogeneity in a glass forming fluid: susceptibility, structure factor, and correlation length. Phys Rev Lett. (2010) 105:217801. doi: 10.1103/PhysRevLett.105.217801
24. Lačević N, Starr FW, Schrøder TB, Glotzer SC. Spatially heterogeneous dynamics investigated via a time-dependent four-point density correlation function. J Chem Phys. (2003) 119:7372–87. doi: 10.1063/1.1605094
25. Crauste-Thibierge C, Brun C, Ladieu F, L'Hôte D, Biroli G, Bouchaud JP. Evidence of growing spatial correlations at the glass transition from nonlinear response experiments. Phys Rev Lett. (2010) 104:165703. doi: 10.1103/PhysRevLett.104.165703
27. Einstein A. Über die von der molekularkinetischen Theorie der Wärme geforderte Bewegung von in ruhenden Flüssigkeiten suspendierten Teilchen. Ann Phys. (1905) 322:549–60. doi: 10.1002/andp.19053220806
28. Landau LD, Lifshitz EM. Chapter VI: Diffusion. In: Landau LD, Lifshitz EM, editors. Fluid Mechanics. 2nd edition ed. Pergamon (1987). p. 227–37. Available online at: http://www.sciencedirect.com/science/article/pii/B9780080339337500143
29. Fulcher GS. Analysis of recent measurements of the viscosity of glasses. J Am Ceram Soc. (1925) 8:339–55. doi: 10.1111/j.1151-2916.1925.tb16731.x
30. Vogel DH. Das temperaturabhaengigkeitsgesetz der viskositaet von fluessigkeiten. Phys Zeitsch. (1921) 22:645.
32. Gotze W, Sjogren L. Relaxation processes in supercooled liquids. Rep Prog Phys. (1992) 55:241–376. doi: 10.1088/0034-4885/55/3/001
33. Kob W, Andersen HC. Testing mode-coupling theory for a supercooled binary Lennard-Jones mixture I: the van Hove correlation function. Phys Rev E. (1995) 51:4626–41. doi: 10.1103/PhysRevE.51.4626
34. Karmakar S, Lerner E, Procaccia I. Direct estimate of the static length-scale accompanying the glass transition. Phys A. (2012) 391:1001–8. doi: 10.1016/j.physa.2011.11.020
35. Van Hove L. Correlations in space and time and born approximation scattering in systems of interacting particles. Phys Rev. (1954) 95:249–62. doi: 10.1103/PhysRev.95.249
36. Shiba H, Yamada Y, Kawasaki T, Kim K. Unveiling dimensionality dependence of glassy dynamics: 2D infinite fluctuation eclipses inherent structural relaxation. Phys Rev Lett. (2016) 117:245701. doi: 10.1103/PhysRevLett.117.245701
37. Yamamoto R, Onuki A. Kinetic heterogeneities in a highly supercooled liquid. J Phys Soc Jpn. (1997) 66:2545–8. doi: 10.1143/JPSJ.66.2545
38. Tah I, Sengupta S, Sastry S, Dasgupta C, Karmakar S. Glass transition in supercooled liquids with medium-range crystalline order. Phys Rev Lett. (2018) 121:085703. doi: 10.1103/PhysRevLett.121.085703
39. Sastry S, Debenedetti PG, Stillinger FH. Signatures of distinct dynamical regimes in the energy landscape of a glass-forming liquid. Nature. (1998) 393:554–7. doi: 10.1038/31189
40. Ikeda A, Miyazaki K. Slow dynamics of the high density Gaussian core model. J Chem Phys. (2011) 135:054901. doi: 10.1063/1.3615949
41. Sengupta S, Karmakar S. Distribution of diffusion constants and Stokes-Einstein violation in supercooled liquids. J Chem Phys. (2014) 140:224505. doi: 10.1063/1.4882066
42. Bhowmik BP, Das R, Karmakar S. Understanding the stokes–Einstein relation in supercooled liquids using random pinning. J Stat Mech. (2016) 2016:074003. doi: 10.1088/1742-5468/2016/07/074003
43. Lucy LB. An iterative technique for the rectification of observed distributions. Astron J. (1974) 79:745.
44. Kawasaki T, Onuki A. Slow relaxations and stringlike jump motions in fragile glass-forming liquids: breakdown of the Stokes-Einstein relation. Phys Rev E. (2013) 87:012312. doi: 10.1103/PhysRevE.87.012312
45. Kawasaki T, Kim K. Identifying time scales for violation/preservation of Stokes-Einstein relation in supercooled water. Sci Adv. (2017) 3:e1700399. doi: 10.1126/sciadv.1700399
46. Kawasaki T, Kim K. Classification of mobile- and immobile-molecule timescales for the Stokes–Einstein and Stokes–Einstein–Debye relations in supercooled water. J Stat Mech. (2019) 2019:084004. doi: 10.1088/1742-5468/ab3114
Keywords: supercooled liquid, Fickian and non-Fickian behaviors, glass transition, van Hove correlation function, dynamic heterogeneities
Citation: Das R, Dasgupta C and Karmakar S (2020) Time Scales of Fickian Diffusion and the Lifetime of Dynamic Heterogeneity. Front. Phys. 8:210. doi: 10.3389/fphy.2020.00210
Received: 20 December 2019; Accepted: 18 May 2020;
Published: 07 July 2020.
Edited by:
Junko Habasaki, Tokyo Institute of Technology, JapanCopyright © 2020 Das, Dasgupta and Karmakar. This is an open-access article distributed under the terms of the Creative Commons Attribution License (CC BY). The use, distribution or reproduction in other forums is permitted, provided the original author(s) and the copyright owner(s) are credited and that the original publication in this journal is cited, in accordance with accepted academic practice. No use, distribution or reproduction is permitted which does not comply with these terms.
*Correspondence: Smarajit Karmakar, c21hcmFqaXRAdGlmcmgucmVzLmlu
 Rajsekhar Das
 Chandan Dasgupta
 Smarajit Karmakar