- Singular Optics Laboratory, Department of Physics, Indian Institute of Technology Delhi, New Delhi, India
In optical testing, the well-known peak valley detection ambiguity exhibited by degenerate interference intensity patterns is due to phase. The interplay between phase and polarization is evident in coherence theory. So the theme of intensity degeneracy arising due to polarization is taken up in this article for discussion. Fringes with high contrast (visibility) occur when the interfering beams are in same state of polarization (SOP). But when multiple beams are involved in interference, high contrast fringes are possible even if the SOP of each of the interfering beams is different. We show the superposition of multiple beams in different SOPs form lattice patterns consisting of polarization singularities and the intensity distribution in the interference patterns exhibit high contrast. By changing the SOPs of the individual beams, same intensity distributions can be produced. These intensity patterns are termed as degenerate intensity patterns, but have different polarization distributions. The SOP changes must follow certain rules to achieve degenerate intensity patterns. We also demonstrate intensity degeneracies in Fraunhoffer diffraction patterns of apertures illuminated by beams having polarization singularities. This study therefore illustrates the limitations on intensity based measurements in identifying polarization singularities as these singularities are expected to play a major role in future in diverse areas of optics.
1. Introduction
Linear, circular, and elliptical are fundamental polarization states that have homogeneous spatial polarization distributions. In 1892, Poincaré proposed a geometric representation of the polarization of light, known as Poincaré sphere [1–4]. In this representation, any general polarization state of light is represented as a point on the surface of a Poincaré sphere. The coordinates of a point on the surface of the Poincaré sphere is given as (S1, S2, S3) where S1, S2, and S3 are normalized Stokes parameters. The North and South Poles of the Poincaré sphere denote spin eigen states namely, right and left circularly polarized light, respectively, such that any point on the Poincaré sphere can be described as superposition of these spin states. The use of Poincaré sphere has greatly simplified the understanding of geometric phase in polarization optics. Pancharatanam found that when the polarization of light is subjected to changes and brought back to the initial state, there is an additional phase that purely depends on the way the changes in the state of polarization (SOP) are carried out [5, 6]. These SOP changes can be mapped on the Poincaré sphere as trajectories. The extra phase acquired in this process is called Pancharatnam phase and this phase is equal to half the solid angle at the center of the Poincaré sphere subtended by area enclosed by the closed trajectories on the Poincaré sphere. Similarly, the trajectories can be drawn on a sphere that is constructed in a parameter space, for example, on a momentum sphere [7]. In this case, a light is transported through a closed trajectory in the momentum space and is seen to acquire a Berry phase [8]. In this experiment [7], light propagation through a coiled optical fiber is studied. Phase control by Pancharatnam phase in coherent optical circuits is also possible [9]. There are many basic papers explaining the Pancharatnam phase [10–14]. Berry-Pancharatnam phase in beams carrying orbital angular momentum (OAM) were also investigated in detail by many authors [15–21]. For light beams carrying OAM, a Modal sphere (orbital sphere) [22] equivalent to Poincaré sphere was introduced recently. Analogous to Poincaré sphere, the North and South poles of the Modal sphere correspond to the OAM eigen states with opposite topological charges. These OAM eigen states are Laguerre-Gaussian (LG) modes with an azimuthal phase terms of exp{±imϕ}, where m is the topological charge. The equatorial points on the Modal sphere correspond to Hermite-Gaussian (HG) modes. The HG modes are superposition states of LG modes carrying OAM. Each point on the surface of the Poincaré sphere can be used to represent a beam with homogeneous polarization. Beams with homogeneous polarization can also be treated as scalar beams. From this view point, one can see that both Poincaré sphere and Modal sphere are useful in representing non-singular and singular scalar beams, respectively.
In recent years, singular optical beams with homogeneous [23, 24] and inhomogeneous polarization distributions have attracted immense attention [25–31]. These inhomogeneously polarized beams may contain polarization singularities [32–34]. In three dimensional fields these polarization singularities form optical Mobius strips [35]. Beams with polarization singularities are gaining interest due to wide range of their applications [36–42]. To describe such beams different geometric representations have been introduced by combining the concepts of Poincaré and Modal spheres. Such geometric representations introduced in recent years are Higher order Poincaré sphere (HOPS) [18, 43], Hybrid order Poincaré sphere (HyOPS) [44, 45], and Generalized Poincaré sphere (GPS) [46]. In HOPS, North and South Poles denote right and left circularly polarized vortex beams of topological charges m and −m, respectively. Each point on the HOPS except the polar points, represents a vector vortex beam (VVB) with constant ellipticity and varying azimuth. Thus HOPS is a geometric representation for VVBs as these beams are superpositions of left and right circularly polarized vortex beams. Similarly every C-point polarization singularity distribution can be represented by a non-polar point on the HyOPS. In a HyOPS, North and South Poles denote right and left circularly polarized vortex beams of different topological charges m and n, respectively. In the earlier classification of polarization singular beams by Freund [27] and Dennis [47], the SOP distributions in ellipse field singularities are predominantly ellipses and in vector field singularities the SOP distributions are predominantly linear. The nomenclature of VVB however does not mean that the wavefront of these inhomogeneous polarization distributions are helical. They are actually plane waves with spatially varying SOPs. Since the beam represented by a non-polar point on a HOPS or on a HyOPS is made of vortex superpositions and the resulting field has inhomogeneous polarization, it is termed as VVB. Therefore, according to Freund [27] and Dennis [47] the V-point singularities are represented by equatorial points on the HOPS whereas the C-point singularities are represented by non-polar points of HyOPS. The non-equatorial and non-polar points on HOPS are new class of VVBs that were not covered by the classification by Freund and Dennis. However these beams have SOP distributions in which the ellipticity is constant (non-zero), like a V-point singularity (where the constant value of ellipticity is zero), but have same polarization singularity index.
Figure 1 shows a fundamental Poincaré sphere, a HOPS and a HyOPS. The two superscripts (m, n) in Figure 1, on the coordinate axes S1, S2, and S3 denote the OAM content in the right and left circular polarization eigen states. The points marked on these spheres denote beams in some polarization states (or distributions in case of HOPS and HyOPs) with the corresponding amplitude distributions. A polarization singularity represented by a point on the HOPS or HyOPS, has SOP distribution in which the azimuth of the polarization states around the singularity undergoes a rotation. The total amount of rotation the azimuth undergoes is given by Δγ = ∮∇γ · dl, where ∇γ is the azimuth gradient and dl is the line element. For any polarization distribution represented by a point on a HOPS, Δγ is integral multiples of 2π and this integral value is known as Poincaré-Hopf index η. But for any polarization distribution represented by a point on a HyOPS, Δγ can be half-integral multiples of 2π and this value is called C-point index Ic. All the non-equatorial points on a HOPS or HyOPS have same polarization singularity index. This means that for every index value η there is a unique HOPS and for every Ic index there is a HyOPS which need not be unique. Say for example, for (m, n) = (1, 2), (2, 3),…, the index Ic is same but for each (m, n) combination there exists a separate HyOPS.
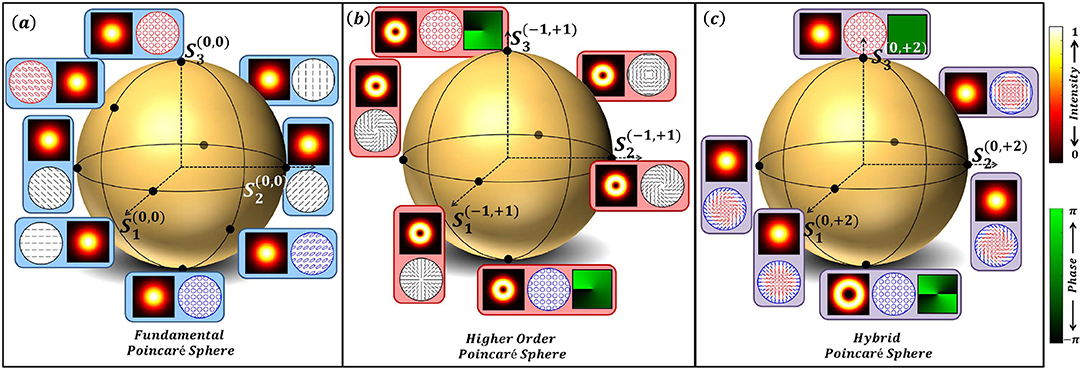
Figure 1. (a) Fundamental Poincaré sphere, (b) Higher order Poincaré sphere (HOPS). (c) Hybrid order Poincaré sphere (HyOPS). In each sphere, the superscripts in the coordinate axes S1, S2, and S3 denote the content of orbital angular momentum in the right (R) and left circular polarization (LCP) eigen states, respectively. Beam with constant ellipticity and varying azimuth across the beam cross-section can be represented by a point on the HOPS. HyOPS is used to represent beams with varying azimuth and ellipticity. In a Poincaré sphere Poles represent plane waves in RCP and LCP whereas in HOPS the Poles represent vortex beams of same magnitude with opposite sign. In a HyOPS, Poles denote vortex beams of different charges. All the non-polar points are obtained by superposition in the corresponding circular basis states.
Any SOP can be decomposed into its orthogonal polarization components and the phase difference between the orthogonal component states is called Stokes phase. In circular decomposition, this Stokes phase is proportional to the azimuth of SOP and is given by ϕ12. All the polarization singularities represented by points on a given HOPS or HyOPS have same polarization singularity index as the ϕ12 Stokes phase distribution is same for all the SOP distributions. The SOP distribution described by a non-polar point on HOPS is a constant ellipticity field whereas the SOP distribution described by a non-polar point on the HyOPS has both spatially varying ellipticity and azimuth. This is similar to vector field singularities (that are constant ellipticity fields) and ellipse field singularities (where both ellipticity and azimuth are spatially varying), respectively. The non-polar point of a HyOPS represents a singularity whose SOPs can be mapped on to a region on the Poincaré sphere whereas the non-polar point on a HOPS represents a singularity whose SOPs can be mapped on to a latitude of the Poincaré sphere. Therefore a Poincaré beam can be represented by a point on the HyOPS, whereas none of the points on the HOPS represents a Poincaré beam.
In this article, the intensity degeneracies exhibited by polarization singularities in the interference and diffraction patterns are discussed. Many of the intensity detectors, therefore fail to classify these singularities as they do not capture the polarization distribution. In the first part, interference of multiple plane waves each in different states of polarization and with different tilts (k vector of each beam having different direction) is discussed. These interference patterns are polarization lattice fields. We report that the resultant fringe patterns exhibit degeneracy in intensity distributions when plane of polarization of the interfering beams are derived from a particular index polarization singular beam. In particular, we consider the V-point singular beams that are represented by the equatorial points of a HOPS for η = ±1. The points in this equatorial plane represent radially polarized, azimuthally polarized and spirally polarized SOP distributions. These inhomogeneously polarized states are known to contain V-points of Poincaré-Hopf index η = ±1. We have also presented simulated intensity patterns of three-plane wave interference in which each of the beam is elliptically polarized and derived from a C-point beam represented by a point on a HyOPS.
In the second part, diffraction of polarization singularities through triangular aperture is shown to exhibit intensity degeneracy in the diffraction patterns. Here again we consider all states in the equatorial plane on the HOPS. The concept of intensity degeneracy in interference and in diffraction is demonstrated through some experimental interference and diffraction patterns.
2. Degenerate Intensity in Interference
In two beam interference, high contrast fringes can be ensured by maintaining same SOP of the interfering beams. However, in multiple beam interference of non-coplanar plane waves, high contrast fringes can be obtained by modulating the SOPs of the interfering beams. Such an interference of plane waves generates periodic structures of electromagnetic fields known as optical lattices. Optical lattices can exist in various parameters of an electromagnetic field such as intensity [48], phase [49, 50], or in polarization. In this section, we present lattices in intensity and polarization, obtained by interference of multiple plane waves whose propagation vectors are non-coplanar. The propagation vector of the mth plane wave is given by
The symbols θm and ϕm are spherical polar coordinate system angles and k0 is the propagation constant. As an example, the orientation of the propagation vectors of the three plane waves, their individual SOPs and the schematic explaining the overlap of these beams are depicted in Figure 2. The resultant amplitude is given by
where plane of polarization of each beam is denoted by derived from the SOP distribution of the radial polarization as shown in Figure 2. In Equation (2) radial polarization is considered but other polarization states can also be assigned to plane waves by appropriate arrangement. These SOPs are assigned to the N plane waves in the Fourier plane in which an S-waveplate is inserted. Each plane wave will appear as a dot (point) at this plane and pick up the required SOP. Such experimental arrangements have been earlier employed in polarization singularity lattice generation [51–57]. Therefore, the SOPs and the tilts of each plane waves can be represented in the k-space as arrows and dots respectively placed on a ring as in Figure 2, where the case of three beam interference is presented.
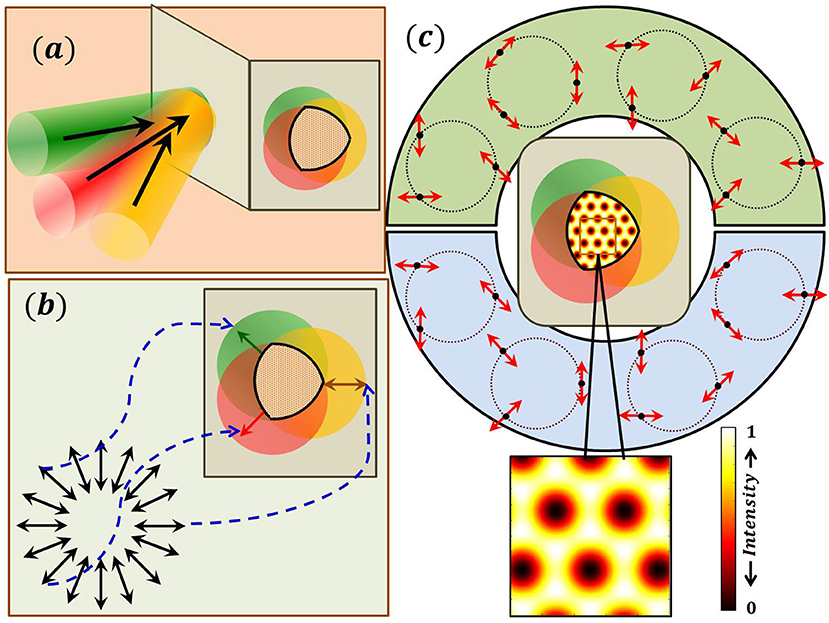
Figure 2. (a) Schematic showing three non-coplanar plane wave interference. (b) The SOPs of the three interfering beams are different and are chosen from a SOP distribution of that of a radially polarized beam. (c) In the region where the three beams overlap polarization singularity lattice is produced. The intensity pattern is same (degenerate) if the SOPs of the three interfering beams are chosen from any one of the depicted sets. In fact, the set can be chosen from any polarization distribution that has same magnitude of η to produce degenerate intensity distribution.
2.1. Three Beam Interference
The degenerate intensity patterns with different polarization distributions are shown in Figures 3, 4. These patterns arise due to interference of three beams and the SOP of these three interfering plane waves are indicated by arrows in the respective interference patterns. All the four interference patterns have same intensity distribution as given at the center. The SOP distribution in each of them in Figure 3, consists lattice of star patterns and in Figure 4 lattice of lemon patterns. Lattice patterns generated by simulation are shown in left side whereas, experimentally obtained lattices structures are depicted in right side. It can be noticed that the intensity patterns in both the figures are same. From Figures 3, 4 it can be seen that polarity of the Poincaré-Hopf index of the V-point from which the SOPs of three interference beams are chosen is immaterial.
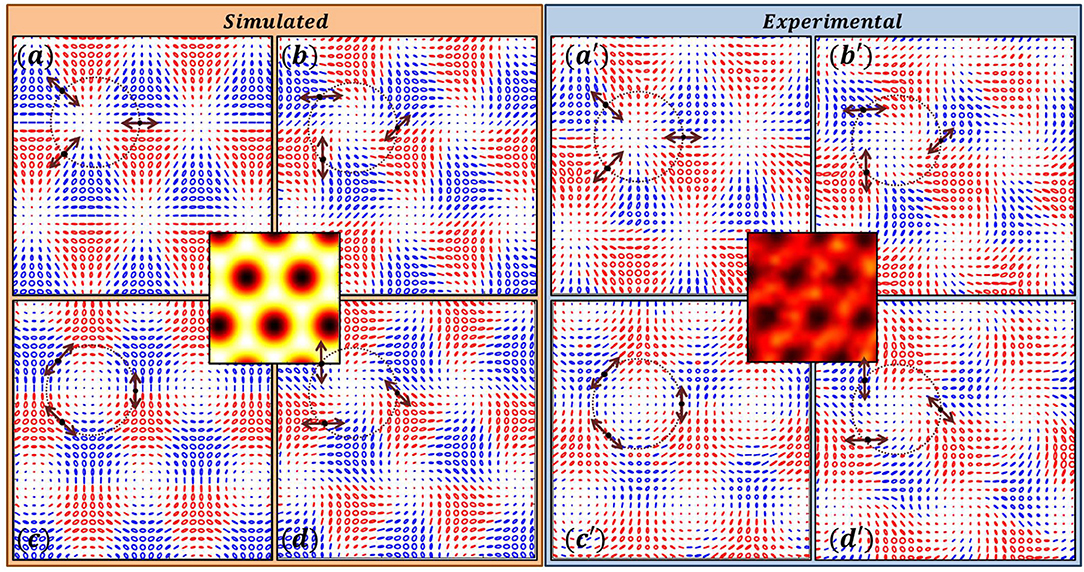
Figure 3. Three-Beam Interference of plane polarized plane waves producing lattice of stars. (a–d) Simulation; (a′–d′) Experimental results. This and in the following figures the intensity distribution shown at the center is same for different SOP distributions shown around it. The SOPs of the interfering plane waves are shown on a ring in k-space, with the positions of the dots indicating the transverse components of the propagation vectors. The SOPs of the plane waves in all the interference patterns are chosen from the polarization distributions of V-point singularities having same Poincaré-Hopf index, in this case η = +1.
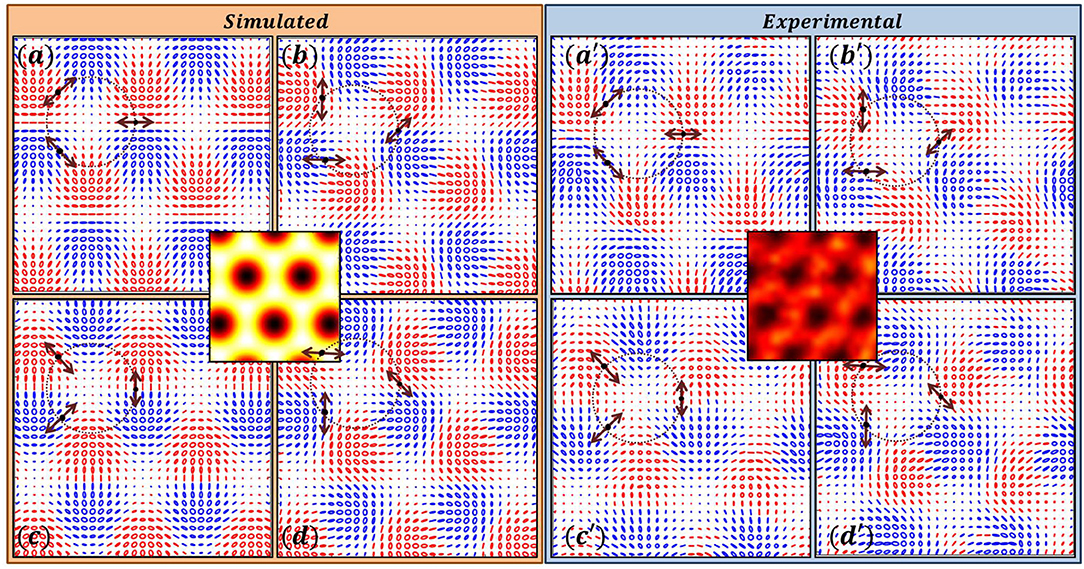
Figure 4. Three Beam Interference producing lattice of lemons. The SOPs of the three plane waves are derived from a V-point with η = −1. Simulated results in (a–d) and experimental results in (a′–d′).
To understand the intensity degeneracy, let us consider the case of three plane wave interference. The SOPs of the three linearly polarized plane waves are given in Figure 5a. Each of the beam is decomposed into its respective x and y components and the component-wise resultant amplitudes are presented in Figures 5a1,a2, respectively. In Figure 5a3 the intensity distribution due to three beam interference is shown. This is obtained by simply adding the intensities due to x and y component fields as there is no interference between beams in orthogonal states. Now consider that the SOPs of the three plane waves are changed from the one shown in Figure 5a to Figure 5b or Figure 5c or Figure 5d. In Figures 5b,c the SOPs are derived from positive index η beam, whereas in Figure 5d the SOPs are derived from negative index η beam. Since a beam with a given index η has a spatial structure, the changes (from Figures 5a–d) that happen to the components for one particular linear polarization state is compensated by appropriate changes that occurs to the other two linear states in a three beam interference. As a result the intensity distribution remains the same. At the hindsight one can intuitively see that by rotating each of the SOP by a fixed angle, the resultant intensity remains invariant. But a comparison between a positive and negative η beams shows that such an intuitive understanding becomes difficult.

Figure 5. Intensity degeneracy in the interference of three non-coplanar plane waves. The SOPs of the three plane waves in four different cases are presented in (a–d). In each case, the SOPs of the three plane waves are segregated in x and y components and components wise interference patterns are analyzed. By adding the component wise intensity patterns, the total intensity pattern is obtained. Note that in each case the component wise interference patterns are different but at the end the total intensity remains the same. This means the spatial arrangement of polarization states leads to readjustment in their components without any change in final intensity distribution. (a1 − d1), resultant x− component complex amplitudes; (a2 − d2), resultant y− component complex amplitude; (a3 − d3), total intensities; Insets show the respective phases.
2.2. Four- and Six- Beam Interferences
When the number of interfering beams are even and are symmetrically placed on the ring in k-space, V-point polarization singularity lattices are produced [53]. In Figure 6, four-beam interference patterns and in Figures 7, 8 six-beam interference patterns are shown. All the interference patterns contain V-point singularity lattices. In Figure 6, the SOPs of the interfering plane waves are selected from radial, azimuthal, and spiral polarization distributions. All the patterns have same intensity distribution. For six-beam interference the interfering plane waves are derived from positive (Figure 7) and negative (Figure 8) Poincaré-Hopf index SOP distributions, but all produce same intensity distributions in the interference pattern.
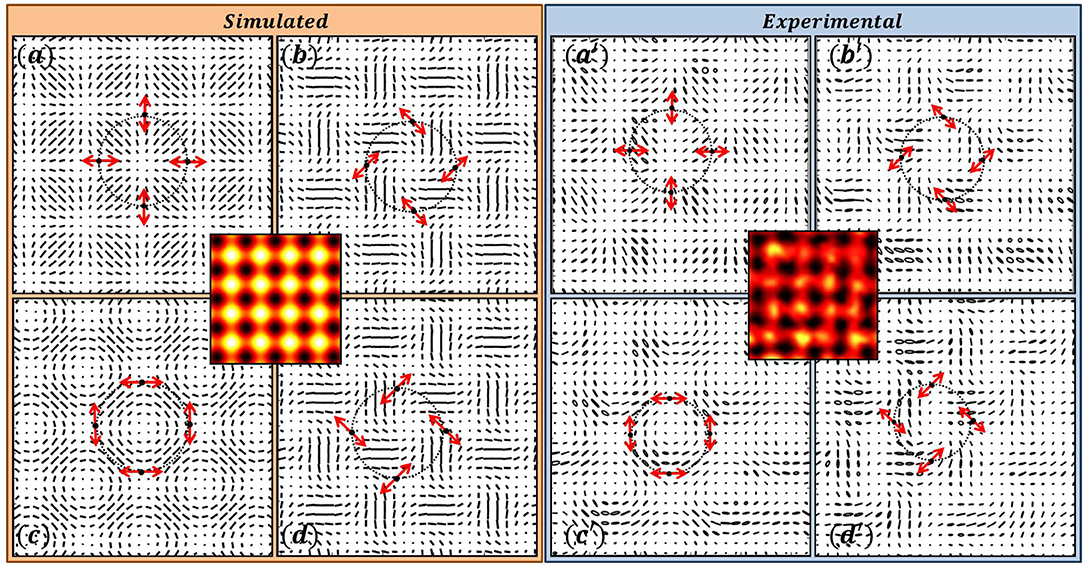
Figure 6. Four Beam Interference producing lattice of V-points. The SOPs of the four plane waves are derived from a V-point with η = +1. having radial, spiral, and azimuthal SOP distributions. (a–d) Simulation; (a′–d′) Experimental results.
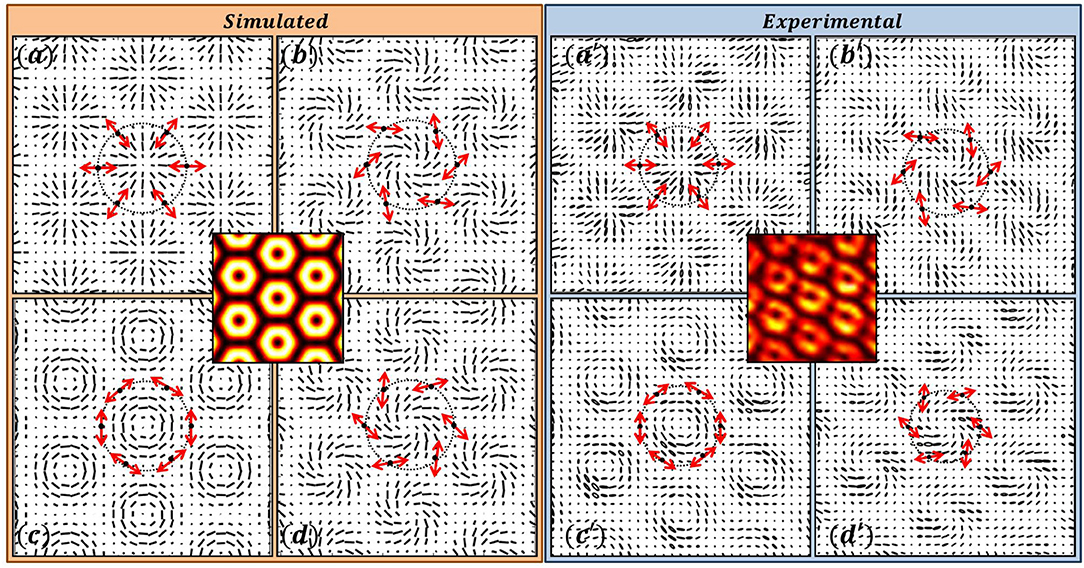
Figure 7. Six Beam Interference producing lattice of V-points. The SOPs of the six plane waves are derived from a V-point with η = +1. having radial, spiral, and azimuthal SOP distributions. Simulated results in (a–d) and experimental results in (a′–d′).
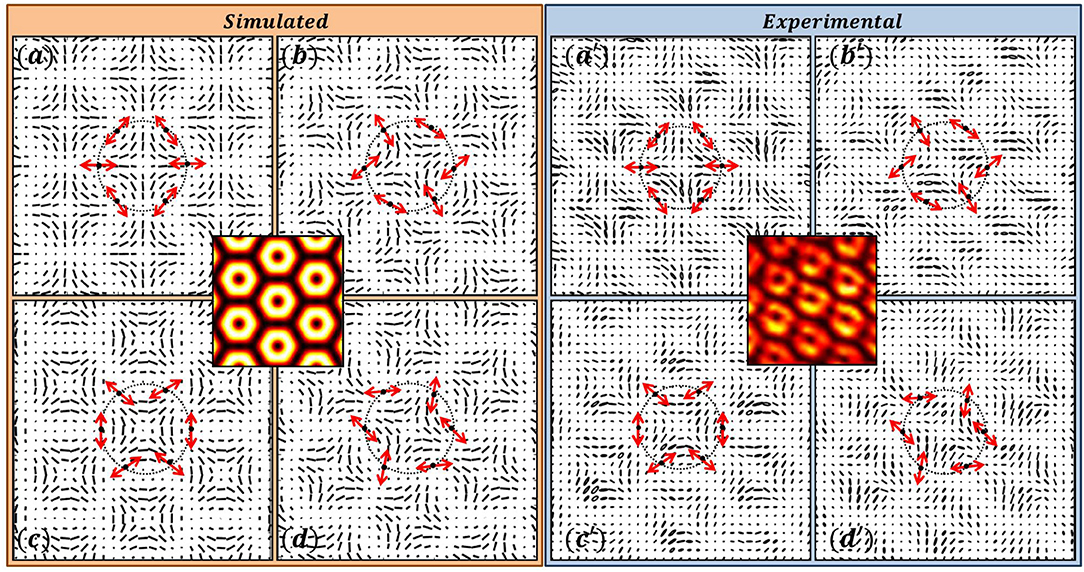
Figure 8. Six Beam Interference producing lattice of V-points. The SOPs of the six plane waves are derived from a V-point with η = −1. (a–d) Simulation; (a′–d′) Experimental results.
In all these interference patterns (Figures 3–8) one can observe that the intensity distribution is degenerate for a given |η|, eventhough each of them have different SOP distributions. The SOPs of the plane waves for interference are derived from equatorial points on a HOPS of order 1 or −1 in Figures 3–8. Simulation shows that another set of degenerate intensity patterns are produced, if the SOPs are derived from equatorial points of HOPS of order |η| > 1. One such case is shown in Figure 9, where the SOP of the plane waves are selected from V-points represented by equatorial points of HOPS (η = 2) for six-beam interference. If the SOPs of the interfering beams are derived from beams represented by points on any latitude of the HOPS, they produce different degenerate interference intensity distributions.
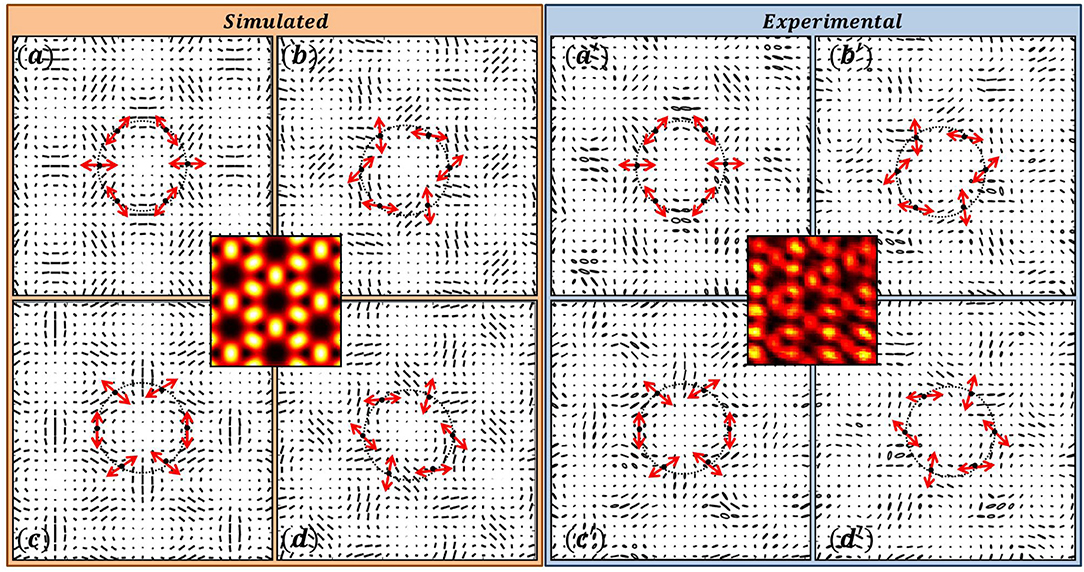
Figure 9. Six Beam Interference: SOPs of the interfering beams are selected from V-points represented by the equatorial points of HOPS (η = 2). (a–d) Simulation; (a′–d′) Experimental results.
2.3. Three Beam Interference-SOPs Derived From a C-Point
So far we have shown that the SOPs of the plane waves that take part in the interference are derived from a beam having vector field singularity, namely V-points. For the case of interference of three plane waves whose SOPs are chosen from a C-point we present the simulation patterns in Figure 10. Each C-point is represented by a point on the surface of HyOPS. Experimental realization is comparatively difficult as we do not have a single element that can directly produce a C-point. Note for V-point generation a single element namely S-waveplate was used. Since in a C-point the ellipticity varies as a function of radial coordinate, the selection of three different SOPs for three plane waves is also difficult and depends on the choice of the r-coordinate. The SOPs of three plane waves are shown in Figure 10a1, the resulting interference intensity pattern is shown in Figure 10b1, and the SOP distribution of the lattice is shown in Figure 10c1. It can be seen that if the SOPs of the three plane waves are chosen from a negative index C-point as shown in Figure 10a2, the interference would produce an intensity pattern as shown in Figure 10b2 with the SOP distribution as depicted in Figure 10c2. Note that the intensity patterns shown in Figures 10b1,b2 are degenerate.

Figure 10. Intensity degeneracy in the interference of three non-coplanar plane waves-SOPs derived from a C-point. Arrangement of SOPs for a positive (a1) and negative (a2) index C-point; (b1, b2) resultant intensity patterns; (c1, c2) Resultant SOP distribution. Note the degeneracy in the resultant intensity distributions in (b1, b2).
2.4. Experimental Description
For interference experiments, the resultant phase distribution due to the interference of multiple beams is computed and a mirror is deformed to produce a wavefront structure corresponding to the computed resultant phase distribution. This is normally done by using a reflective spatial light modulator (SLM). A schematic of the experimental setup is shown in Figure 11. Any plane wave incident on SLM will acquire the shape of the complicated wavefront structure. This wavefront is Fourier transformed (FT) by using a lens. At the FT plane, corresponding to each plane wave a bright spot appears. This means, for the multiple beam interference there are multiple bright spots in the Fourier plane. By placing a S-waveplate, at the FT plane, each spot is made to assume different SOPs. A second lens converts these spots back into plane waves. In the overlap region interference pattern is observed and corresponding Stokes parameters are captured by using a high resolution Stokes camera (Salsa full Stokes polarization imaging camera, 1,040 × 1,040 pixels, Bossa Nova, USA).
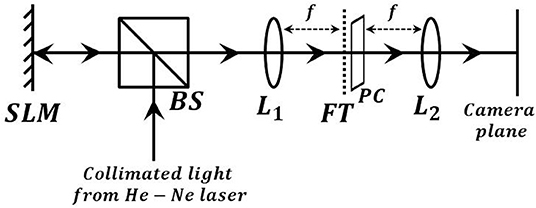
Figure 11. Schematic of setup for multiple beam interference. SLM, spatial light modulator; BS, beam splitter; L1, L2, lenses; FT, Fourier transform plane; PC, polarization convertor; Camera plane.
3. Intensity Degeneracy in Diffraction
Diffraction patterns produced by singular beams can be used to find the charge of the scalar vortex [58, 59]. But for polarization singularities, diffraction methods are not effective for identification of OAM and spin angular momentum (SAM) content in the beam. The diffraction patterns of polarization singularities show degenerate intensity distributions. Therefore, for intensity based detection of such singularities, apart from diffraction, polarization transformations are also used in tandem to determine the polarization singularity index. In this section, diffraction patterns of polarization singular beams diffracted through triangular aperture are presented. V-points represented by equatorial points of a HOPS are made to diffract through a triangular aperture.
Diffraction patterns of V-points having Poincaré-Hopf index η = +1 are presented in Figure 12. Simulated and experimentally recorded input SOPs of V-points with index η = +1 are shown in Figure 12a. The locations of these inhomogeneous polarization distributions are marked as points 1–8 on a HOPS in Figure 12c. These V-points on a HOPS are superpositions of m = −1 and n = 1 scalar vortex beams in RCP and LCP state, respectively. Figures 12b[d] show simulated [experimentally recorded] input and diffracted intensity when such beams are passed through a triangular aperture. Diffraction disintegrates the V-points into C-points. The simulated and experimentally recorded diffracted polarization distributions are shown in Figure 12e. Note that each of the input V-point distribution marked on a HOPS disintegrates into two lemons (each with index Ic = +1/2) of opposite handedness upon diffraction. The number of C-points in the diffracted patterns are such that, in this process there is index conservation [60, 61]. The C-points occur in pairs with opposite handedness indicating that there is also helicity conservation [62, 63]. Interestingly, the polarization singularity incident on the diffracting aperture can be represented by a point on the HOPS whereas the singularities in the diffracted field can be represented by points on many HyOPS.
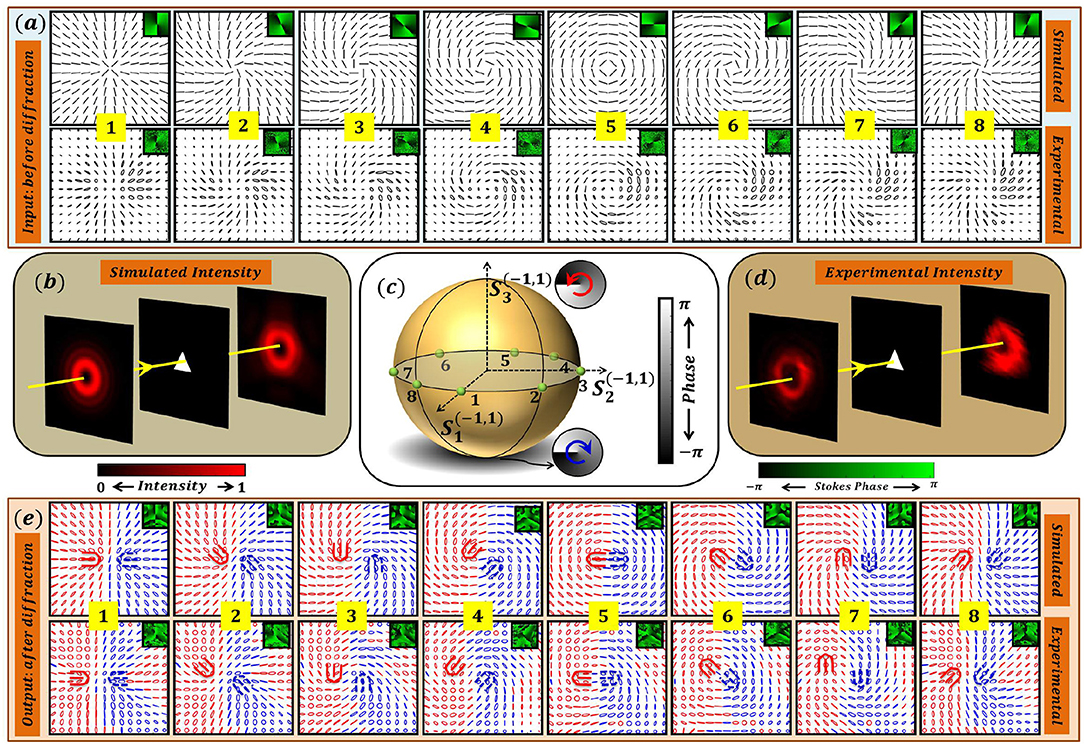
Figure 12. Intensity degeneracy in Fraunhoffer diffraction of V-point beam with index η = +1 through a triangular aperture. (a) Simulated and experimentally recorded input polarization distributions corresponding to points 1 − 8 marked on a HOPS in (c). Note that all these distributions lie at the equator of a HOPS and have same polarization singularity index η = +1. (b) Simulation: Schematic of the setup with Input intensity, aperture, and diffracted intensity. (d) Experimentally recorded input and far field intensity. (e) simulated and experimentally observed polarization patterns after the diffraction through aperture. Note that for each of the input SOPs marked on HOPS, the diffracted intensity exhibit degeneracy. Further each of the input V-point distribution disintegrates into two lemons (each with index Ic = +1/2) of opposite handedness upon diffraction.
3.1. Experimental Description
For diffraction experiments the polarization singular beam is generated either by using a S-waveplate or by using an interferometric setup. In Figure 13, we have shown the schematic of the diffraction experiment where S-waveplate is used for V-point generation. The polarization singular beam is then passed through a diffracting triangular aperture. The far-field diffraction pattern is observed and captured by the Stokes Camera at the back focal plane of a lens.

Figure 13. Schematic of setup for diffraction through aperture: S-waveplate-spatially varying half waveplate; Diffracting triangular aperture; L- lens; Camera plane.
Figure 14 depicts diffraction patterns of V-points with Poincaré-Hopf index η = −1. V-points with negative Poincaré-Hopf indices are located on a different HOPS as these are superpositions of m = 1 and n = −1 scalar vortex beams in RCP and LCP state, respectively. Some simulated and experimentally obtained V-points are shown in Figure 14a and their locations are marked as points 1–8 on a HOPS in Figure 14c. The simulated [experimental] input and far field intensities are depicted in Figures 14b[d]. Diffraction of a negative V-point beam of index η = −1 produces two C-point polarization singularities of index Ic = −1/2 (stars) with opposite handedness, thereby following index and helicity conservation. From Figures 12, 14, one can observe that the diffracted intensity exhibit degeneracy when diffraction of V-points with Poincaré-Hopf index |η| = 1 is considered. This indicates that the polarity of η is insignificant and it cannot be determined from the intensity measurements alone.
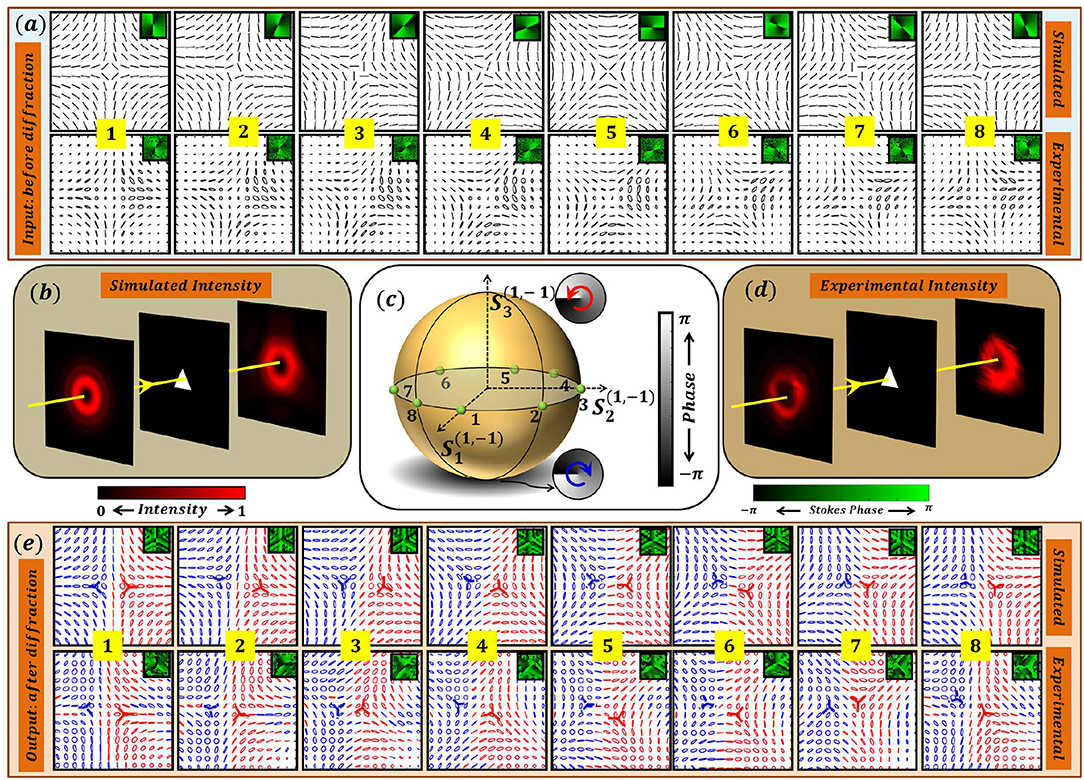
Figure 14. Intensity degeneracy in the diffraction patterns of V-point beam with index η = −1 through a triangular aperture. Simulated and Experimentally observed (a) input and (e) diffracted SOP distributions. (b) Simulation: Schematic of the setup with input intensity, aperture, and diffracted intensity. (c) Locations of input SOPs (shown in a,e) labeled as 1 − 8 on a HOPS. All these SOPs when diffracted through triangular aperture produce same intensity patterns and hence exhibit degeneracy. (d) Experimental: Schematic of the setup with input intensity, aperture, and diffracted intensity. Note in this case, the V-points disintegrate into two stars of opposite handedness with Ic = −1/2.
Far field diffraction intensity patterns of V-points with |η| = 2 also exhibit degeneracy. This is shown in Figure 15. Simulated input SOP distributions and their far field diffracted polarization distributions for some V-points (labeled as points 1–4 on a HOPS) with index η = +2 [η = −2] are depicted in Figures 15a[c]. Corresponding experimentally recorded input SOPs and diffracted SOP distributions are shown in Figures 15a′[c′]. Diffraction of V-points of index η = +2 (η = −2) produces four C-point polarization distributions each with index Ic = +1/2 (Ic = −1/2), following the index and helicity conservation. Note that all V-points with index |η| = 2 produce same intensity patterns as shown in Figure 15b (simulated) and Figure 15b′ (experimentally recorded), respectively. Infact, different shape apertures can be used in the diffraction experiments yielding similar results. For V-point diffraction, use of diamond shaped aperture [64], right triangular aperture [60], and circular aperture [65] have been reported. There is no literature available at this point in time on diffraction of V-points through apertures of different shapes. Although diffraction of scalar vortices through different apertures like triangular [58], circular [66], diamond shaped [67], hexagonal shaped [68], isosceles right triangular [69], single slit [59], annular apertures [70, 71], have been reported.
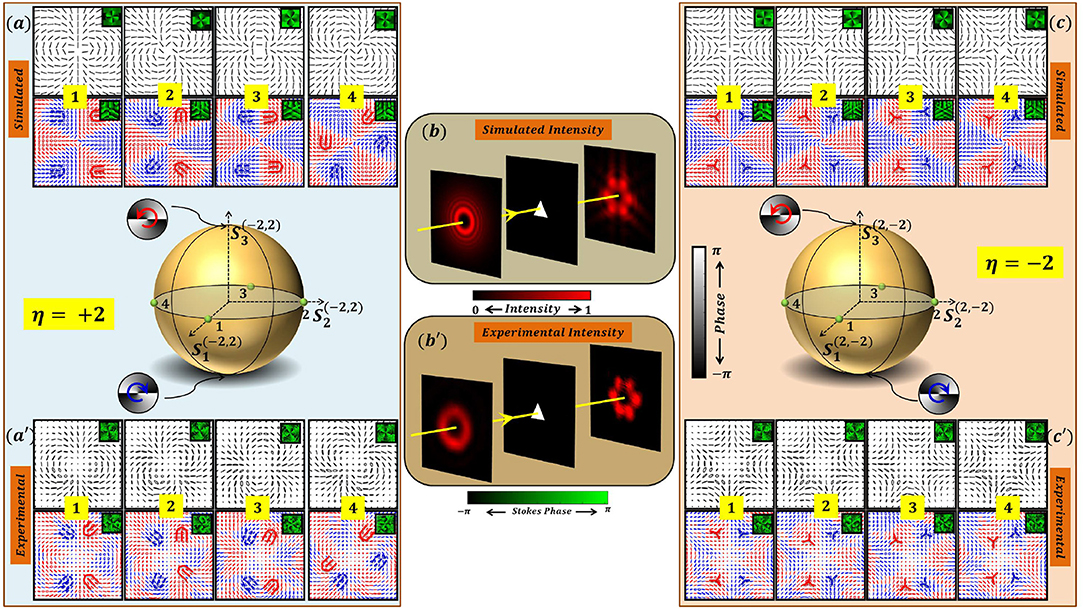
Figure 15. Intensity degeneracy in the diffraction patterns of V-point beam with index |η| = 2 through a triangular aperture. Figures in left column: Input (first row) and diffraction (second row) field SOPs—(a) simulated and (a′) experimental; Center column: (b) Simulated and (b′) experimental schematic of the setup with input intensity, aperture, and diffracted intensity. Figures in the right column: Input (first row) and diffraction (second row) field SOPs—simulated (c) and experimental (c′); In the center of the left and right column a HOPS is shown with numbers indicating the beams being diffracted, i.e., input beams.
4. Discussion
The intensity distributions obtained in the interference of multiple plane waves each in different SOPs have been observed as identical. But the polarization distribution in each of them is different. The selection of SOPs of the interfering plane waves are from V-point polarization distribution having same magnitude of Poincaré-Hopf index and the method adopted to assign different SOPs to each beam is by introducing a S-waveplate at the Fourier plane. For a given Poincaré-Hopf index the number of possible polarization distributions are many and they can be represented by equatorial points of HOPS. For each index and polarity there is a separate HOPS. This means that the SOPs of the individual plane waves can be tuned by large number of ways so that the resulting interference intensity pattern remains invariant. This degeneracy has been experimentally demonstrated by taking many examples.
This intensity degeneracy is very similar to identical interferograms that can be obtained (say for example) from convex or concave wavefront structures with a given reference wave. In interferometry this peak-valley degeneracy leads to phase ambiguity. It is known that the phase information of an optical signal is lost in intensity patterns. Likewise polarization information of optical fields is also lost in intensity patterns. Phase and polarization are inter-related quantities and by modulating one the other can be modulated. But phase is scalar and polarization is vector. Using intensity distributions and experimental parameters, algorithms for phase retrieval, phase estimation, phase detection have been developed in the past. Similarly it may be possible to retrieve polarization from single (or minimum) intensity measurements by some smart researchers in future.
5. Conclusion
In scalar optics, phase introduced ambiguities in the interference intensity patterns lead to occurrence of degenerate states. In this article we have shown polarization introduced degeneracies in the intensity patterns. This has been explained by interference and diffraction patterns obtained using polarization singular beams. The polarization singular beams are selected from HOPS for our discussion. In the resulting interference/diffraction patterns, the polarization singularities observed are found to be from many HyOPS. This study therefore illustrates the limitations on intensity based measurements in identifying polarization singularities as these singularities are expected to play a major role in future in diverse areas of optics.
Data Availability Statement
The datasets generated for this study are available on request to the corresponding author.
Author Contributions
R and PS conceived the idea. R performed the experiments. Both authors analyzed the results, wrote, and reviewed the manuscript.
Funding
The authors acknowledge the financial support from CSIR, India through the research grant 03(1430)∕18∕EMR−II.
Conflict of Interest
The authors declare that the research was conducted in the absence of any commercial or financial relationships that could be construed as a potential conflict of interest.
References
1. Born M, Wolf E. Principles of Optics: Electromagnetic Theory of Propagation, Interference and Diffraction of Light, 7th Edn. New York, NY: Cambridge University Press (1999).
5. Pancharatnam S. Generalized theory of interference, and its applications. Proc Indian Acad Sci. (1956) 44:247–62. doi: 10.1007/BF03046050
6. Pancharatnam S. Generalized theory of interference, and its applications-PartII. Proc Indian Acad Sci. (1956) 44:398–417. doi: 10.1007/BF03046095
7. Tomita A, Chiao RY. Observation of Berry's topological phase by use of an optical fiber. Phys Rev Lett. (1986) 57:937–40. doi: 10.1103/PhysRevLett.57.937
8. Berry MV. The adiabatic phase and Pancharatnam's phase for polarized light. J Mod Opt. (1987) 34:1401–7. doi: 10.1080/09500348714551321
9. Martinelli M, Vavassori P. A geometric (Pancharatnam) phase approach to the polarization and phase control in the coherent optics circuits. Opt Commun. (1990) 80:166–76. doi: 10.1016/0030-4018(90)90380-C
10. Rakhecha VC, Wagh AG. Geometric phase a la Panchartnam. Pramana. (1996) 46:315–22. doi: 10.1007/BF02847005
11. Hannay JH. The Majorana representation of polarization, and the Berry phase of light. J Mod Opt. (1998) 45:1001–8. doi: 10.1080/09500349808230892
12. van Dijk T, Schouten HF, Visser TD. Geometric interpretation of the Pancharatnam connection and non-cyclic polarization changes. J Opt Soc Am A. (2010) 27:1972. doi: 10.1364/JOSAA.27.001972
13. Kurzynowski P, Woźniak WA. Geometric phase for dichroic media. J Opt Soc Am A. (2011) 28:1949. doi: 10.1364/JOSAA.28.001949
14. Kurzynowski P, Woźniak WA, Szarycz M. Geometric phase: two triangles on the Poincaré sphere. J Opt Soc Am A. (2011) 28:475. doi: 10.1364/JOSAA.28.000475
15. Galvez EJ, Crawford PR, Sztul HI, Pysher MJ, Haglin PJ, Williams RE. Geometric phase associated with mode transformations of optical beams bearing orbital angular momentum. Phys Rev Lett. (2003) 90:4. doi: 10.1103/PhysRevLett.90.203901
16. Niv A, Biener G, Kleiner V, Hasman E. Manipulation of the Pancharatnam phase in vectorial vortices. Opt Express. (2006) 14:4208. doi: 10.1364/OE.14.004208
17. Lopez-Mago D, Canales-Benavides A, Hernandez-Aranda RI, Gutiérrez-Vega JC. Geometric phase morphology of Jones matrices. Opt Lett. (2017) 42:2667. doi: 10.1364/OL.42.002667
18. Milione G, Evans S, Nolan DA, Alfano RR. Higher order Pancharatnam-Berry phase and the angular momentum of light. Phys Rev Lett. (2012) 108:1–4. doi: 10.1103/PhysRevLett.108.190401
19. Reddy SG, Prabhakar S, Chithrabhanu P, Singh RP, Simon R. Polarization state transformation using two quarter wave plates: application to Mueller polarimetry. Appl Opt. (2016) 55:B14. doi: 10.1364/AO.55.000B14
20. Ruchi, Bhargava Ram BS, Senthilkumaran P. Hopping induced inversions and Pancharatnam excursions of C-points. Opt Lett. (2017) 42:4159. doi: 10.1364/OL.42.004159
21. Liu Y, Liu Z, Zhou J, Ling X, Shu W, Luo H, et al. Measurements of Pancharatnam-Berry phase in mode transformations on hybrid-order Poincaré sphere. Opt Lett. (2017) 42:3447. doi: 10.1364/OL.42.003447
22. Padgett MJ, Courtial J. Poincaré-sphere equivalent for light beams containing orbital angular momentum. Opt Lett. (2008) 24:430. doi: 10.1364/OL.24.000430
23. Hajnal JV, Nye JF. Singularities in the transverse fields of electromagnetic waves. I. Theory. Proc R Soc Lond A Math Phys Sci. (1987) 414:433–46. doi: 10.1098/rspa.1987.0153
24. Hajnal JV, Nye JF. Singularities in the transverse fields of electromagnetic waves. II. Observations on the electric field. Proc R Soc Lond A Math Phys Sci. (1987) 414:447–68. doi: 10.1098/rspa.1987.0154
25. Nye JF. Lines of circular polarization in electromagnetic fields. Proc R Soc Lond Ser A. (1983) 389:279–90. doi: 10.1098/rspa.1983.0109
26. Berry MV, Dennis MR. Polarization singularities in isotropic random vector waves. Proc R Soc Lond Ser A Math Phys Eng Sci. (2001) 457:141–55. doi: 10.1098/rspa.2000.0660
27. Freund I. Polarization singularity indices in Gaussian laser beams. Opt Commun. (2002) 201:251–70. doi: 10.1016/S0030-4018(01)01725-4
28. Mokhun AI, Soskin MS, Freund I. Elliptic critical points: C-points, α-lines, and the sign rule. Opt Lett. (2002) 27:995–7. doi: 10.1364/OL.27.000995
29. Soskin MS, Denisenko V, Freund I. Optical polarization singularities and elliptic stationary points. Opt Lett. (2003) 28:1475–7. doi: 10.1364/OL.28.001475
30. Chen RP, Zhong LX, Chew KH, Gu B, Zhou G, Zhao T. Effect of a spiral phase on a vector optical field with hybrid polarization states. J Opt. (2015) 17:065605. doi: 10.1088/2040-8978/17/6/065605
31. Chernyshov AA, Felde CV, Bogatyryova HV, Polyanskii PV, Soskin MS. Vector singularities of the combined beams assembled from mutually incoherent orthogonally polarized components. J Opt A Pure Appl Opt. (2009) 11:094010. doi: 10.1088/1464-4258/11/9/094010
32. Berry MV. The electric and magnetic polarization singularities of paraxial waves. J Opt A. (2004) 6:475–81. doi: 10.1088/1464-4258/6/5/030
33. Freund I. Ordinary polarization singularities in three-dimensional optical fields. Opt Lett. (2012) 37:2223. doi: 10.1364/OL.37.002223
34. Freund I. Polychromatic polarization singularities. Opt Lett. (2007) 28:2150. doi: 10.1364/OL.28.002150
35. Freund I. Optical Möbius strips in three-dimensional ellipse fields: I. Lines of circular polarization. Opt Commun. (2010) 283:1–15. doi: 10.1016/j.optcom.2009.09.042
36. Lochab P, Senthilkumaran P, Khare K. Designer vector beams maintaining a robust intensity profile on propagation through turbulence. Phys Rev A. (2018) 98:1–9. doi: 10.1103/PhysRevA.98.023831
37. Shvedov V, Davoyan AR, Hnatovsky C, Engheta N, Krolikowski W. A long-range polarization-controlled optical tractor beam. Nat Photon. (2014) 8:846–50. doi: 10.1038/nphoton.2014.242
38. Ram BSB, Senthilkumaran P, Sharma A. Polarization-based spatial filtering for directional and nondirectional edge enhancement using an S-waveplate. Appl Opt. (2017) 56:3171–8. doi: 10.1364/AO.56.003171
40. Chen M, Huang S, Shao W. Tight focusing of radially polarized circular Airy vortex beams. Opt Commun. (2017) 402:672–7. doi: 10.1016/j.optcom.2017.06.089
41. Marrucci L, Manzo C, Paparo D. Optical spin-to-orbital angular momentum conversion in inhomogeneous anisotropic media. Phys Rev Lett. (2006) 96:1–4. doi: 10.1103/PhysRevLett.96.163905
42. Verma M, Pal SK, Jejusaria A, Senthilkumaran P. Separation of spin and orbital angular momentum states from cylindrical vector beams. Optik. (2017) 132:121–6. doi: 10.1016/j.ijleo.2016.12.018
43. Milione G, Sztul HI, Nolan DA, Alfano RR. Higher-order Poincaré sphere, stokes parameters, and the angular momentum of light. Phys Rev Lett. (2011) 107:1–4. doi: 10.1103/PhysRevLett.107.053601
44. Ling X, Yi X, Dai Z, Wang Y, Chen L. Characterization and manipulation of full Poincaré beams on the hybrid Poincaré sphere. J Opt Soc Am B. (2016) 33:2172. doi: 10.1364/JOSAB.33.002172
45. Fu S, Zhai Y, Wang T, Yin C, Gao C. Tailoring arbitrary hybrid Poincaré beams through a single hologram. Appl Phys Lett. (2017) 111:211101. doi: 10.1063/1.5008954
46. Ren Zc, Kong Lj, Li SM, Qian Sx, Li Y, Tu C, et al. Generalized Poincaré sphere. Opt Exp. (2015) 23:26586. doi: 10.1364/OE.23.026586
47. Dennis MR. Polarization singularities in paraxial vector fields: morphology and statistics. Opt Commun. (2002) 213:201–21. doi: 10.1016/S0030-4018(02)02088-6
48. Senthilkumaran P, Sirohi R. Michelson interferometers in tandem for array generation. Opt Commun. (1994) 105:158–60. doi: 10.1016/0030-4018(94)90706-4
49. Vyas S, Senthilkumaran P. Interferometric optical vortex array generator. Appl Opt. (2007) 46:2893. doi: 10.1364/AO.46.002893
50. Vyas S, Senthilkumaran P. Vortex array generation by interference of spherical waves. Appl Opt. (2007) 46:7862–7. doi: 10.1364/AO.46.007862
51. Pal SK, Senthilkumaran P. Cultivation of lemon fields. Opt Express. (2016) 24:28008–13. doi: 10.1364/OE.24.028008
52. Pal SK, Ruchi, Senthilkumaran P. C-point and V-point singularity lattice formation and index sign conversion methods. Opt Commun. (2017) 393:156–68. doi: 10.1016/j.optcom.2017.02.048
53. Ruchi, Pal SK, Senthilkumaran P. Generation of V-point polarization singularity lattices. Opt Express. (2017) 25:19326–31. doi: 10.1364/OE.25.019326
54. Pal SK, Senthilkumaran P. Generation of orthogonal lattice fields. J Opt Soc Am A. (2019) 36:853. doi: 10.1364/JOSAA.36.000853
55. Arora G, Pal SK, Senthilkumaran P. Spatially varying lattice of C points. OSA Continuum. (2019) 2:416. doi: 10.1364/OSAC.2.000416
56. Pal SK, Senthilkumaran P. Phase engineering methods in polarization singularity lattice generation. OSA Continuum. (2018) 1:193. doi: 10.1364/OSAC.1.000193
57. Pal SK, Senthilkumaran P. Synthesis of stokes vortices. Opt Lett. (2019) 44:130. doi: 10.1364/OL.44.000130
58. Hickmann JM, Fonseca EJS, Soares WC, Chávez-Cerda S. Unveiling a truncated optical lattice associated with a triangular aperture using light's orbital angular momentum. Phys Rev Lett. (2010) 105:53904. doi: 10.1103/PhysRevLett.105.053904
59. Ghai DP, Senthilkumaran P, Sirohi RS. Single-slit diffraction of an optical beam with phase singularity. Opt Lasers Eng. (2009) 47:123–6. doi: 10.1016/j.optlaseng.2008.07.019
60. Ram BSB, Sharma A, Senthilkumaran P. Diffraction of V-point singularities through triangular apertures. Opt Express. (2017) 25:10270. doi: 10.1364/OE.25.010270
61. Bhargava Ram BS, Sharma A, Senthilkumaran P. Probing the degenerate states of V-point singularities. Opt Lett. (2017) 42:3570. doi: 10.1364/OL.42.003570
62. Deepa S, Bhargava Ram BS, Senthilkumaran P. Helicity dependent diffraction by angular momentum transfer. Sci Rep. (2019) 9:12491. doi: 10.1038/s41598-019-48923-6
63. Khan SN, Deepa S, Senthilkumaran P. Helicity conservation in V-point diffraction. Opt Lett. (2019) 44:3913. doi: 10.1364/OL.44.003913
64. Khan SN, Deepa S, Arora G, Senthilkumaran P. Perturbation induced morphological transformations in vector-field singularities. J Opt Soc Am B. (2020) 37:1577–86. doi: 10.1364/JOSAB.386553
65. Cui X, Wang C, Jia X. Nonparaxial propagation of vector vortex beams diffracted by a circular aperture. J Opt Soc Am A. (2018) 36:115. doi: 10.1364/JOSAA.36.000115
66. Ambuj A, Vyas R, Singh S. Diffraction of orbital angular momentum carrying optical beams by a circular aperture. Opt Lett. (2014) 39:5475. doi: 10.1364/OL.39.005475
67. Liu Y, Sun S, Pu J, Lu B. Propagation of an optical vortex beam through a diamond-shaped aperture. Opt Laser Technol. (2013) 45:473–9. doi: 10.1016/j.optlastec.2012.06.007
68. Liu Y, Pu J. Measuring the orbital angular momentum of elliptical vortex beams by using a slit hexagon aperture. Opt Commun. (2011) 284:2424–9. doi: 10.1016/j.optcom.2011.01.021
69. Bahl M, Senthilkumaran P. Energy circulations in singular beams diffracted through an isosceles right triangular aperture. Phys Rev A. (2015) 92:1–6. doi: 10.1103/PhysRevA.92.013831
70. Yongxin L, Hua T, Jixiong P, Baida L. Detecting the topological charge of vortex beams using an annular triangle aperture. Opt Laser Technol. (2011) 43:1233–6. doi: 10.1016/j.optlastec.2011.03.015
Keywords: phase singularities, polarization singularities, interference, diffraction, singular optics
Citation: Ruchi and Senthilkumaran P (2020) Polarization Singularities and Intensity Degeneracies. Front. Phys. 8:140. doi: 10.3389/fphy.2020.00140
Received: 20 January 2020; Accepted: 08 April 2020;
Published: 13 May 2020.
Edited by:
Mikhail V. Vasnetsov, National Academy of Sciences of Ukraine, UkraineReviewed by:
Jacopo Parravicini, University of Milano-Bicocca, ItalyXiaojun Yu, Nanyang Technological University, Singapore
Valeriy Pas'ko, National Academy of Sciences of Ukraine, Ukraine
Copyright © 2020 Ruchi and Senthilkumaran. This is an open-access article distributed under the terms of the Creative Commons Attribution License (CC BY). The use, distribution or reproduction in other forums is permitted, provided the original author(s) and the copyright owner(s) are credited and that the original publication in this journal is cited, in accordance with accepted academic practice. No use, distribution or reproduction is permitted which does not comply with these terms.
*Correspondence: Ruchi, cnVjaGlyYWpwdXQxOSYjeDAwMDQwO2dtYWlsLmNvbQ==
 Ruchi
Ruchi Paramasivam Senthilkumaran