 Ruwei Zhao
 Yian Cui
 Xuenu Liu
- 1School of Business, Jiangnan University, Wuxi, China
- 2Research Institute, Shenzhen Stock Exchange, Shenzhen, China
- 3College of Intelligence and Computing, Tianjin University, Tianjin, China
This study investigated the dynamics between tick size and market quality using an agent-based multiple-order-book stock-market model. Given the multiple-order-book setting, we integrated the model with small-, medium-, and large-cap stocks and conducted the analysis from both a tick-size-series and cross-sectional perspective. The simulation results showed that small-cap stocks were of the lowest quality. Furthermore, quality was generally weakened as tick-size value increased, with expanded bid-ask spreads, elevated market volatility, and reduced market efficiency.
1. Introduction
As one of the fundamental transaction requirements, tick size (i.e., the minimum movement of stock price) has received considerable research attention with regard to its powerful effects on market quality [1–19]. In light of the newly introduced tick-size policy change by the Chicago Mercantile Exchange, Martinez and Tse [9] investigated the relationship between tick-size reduction and market quality in the foreign currency futures market. They found that reduced tick size powerfully promoted the market quality of the Mexican peso, dramatically dropping pricing errors, greatly improving pricing discovery capacity, and considerably reducing informed trading. Similarly, in consideration of the 2016 US SEC tick-size pilot program, Griffith and Roseman [15] studied the market-liquidity reaction to the rising movement of tick size. They found that market liquidity would be severely weakened by an increase in tick size. Lepone and Wong [18] examined market-quality evolution with tick-size changes in the Singapore stock market. They found significant drops in the bid-ask spread and order depth following the reduction of tick size, and lower-priced stocks were favored through disguised market markers with higher returns. However, most of these prior studies were based on policy changes made by regulating authorities, which are extremely rare.
To avoid the quantity deficiencies of tick-size changes, this study used an agent-based multiple-order-book model, adopting six gradually increasing tick sizes to investigate the dynamics between tick size and market quality. Many studies have investigated the feasibility of agent-based modeling as an effective vehicle for stock-market simulation [20–34]. However, most of those studies were oriented using one stock, which limited the credibility of the models. Thus, to be more in line with market reality, we followed Wei et al. [35] and constructed an agent-based stock-market model with three stocks as representatives of large, medium, and small stocks. We found that as tick size rises, the bid-ask spread generally increases, which is consistent with findings for liquidity indexes, showing a decreasing trend in market liquidity. We also found that small-cap stocks have the worst liquidity with the highest bid-ask spreads and lowest liquidity index values at cross-sectional levels. We also took the return standard deviation as the measurement of market volatility. We found that market volatility increased dramatically with the rise in tick size, and the small-cap stocks were of the highest volatility with the largest values. Furthermore, we investigated market efficiency with three types of stocks. We found that the market efficiency demonstrates monotone increasing character with the expansion of tick size interval, and mid- and small-cap stocks had the highest and lowest market efficiency, respectively. Finally, we checked investor wealth evolution using tick-size changes and found that the wealth changes demonstrated a concave shape.
This study contributes to the literature in three ways. First, our agent-based stock-market model originates from a multiple-order-book perspective. Using the model, our study investigated the dynamics between tick size and market quality with small-, medium-, and large-cap stocks, which improves upon the limitations of prior one-stock models [27, 28]. Second, compared to previous tick-size studies [9, 18], our study covers six tick sizes, providing more detailed insights into the dynamics of tick size. Third, this study was based on the largest emerging Chinese stocks; thus, it can provide valuable risk-management suggestions for both international investors and regulatory authorities.
The rest of this paper is organized as follows. Section 2 illustrates the method. Section 3 describes the simulation results, and section 4 concludes the paper.
2. Methods
2.1. Agent-Based Multiple-Order-Book Model
We introduced three types of stocks with variations in capitalization to construct an agent-based multiple-order-book model. In the model, investors adopt mixed heterogeneous beliefs and adaptive asset allocations in stock-price prediction and cash distribution, respectively.
2.1.1. Market Design
(1) Asset Design
In the Chinese stock market, there are three types of boards: the main board, the SME board (small and medium enterprise board), and the ChiNext board (growth enterprise market board). These three boards represent completely different types of stocks. The main board is constituted by large-cap stocks, while the SME and ChiNext boards consisted of medium- and small-sized stocks, respectively. Also, Xiong et al. [36] found that the average shares of the main board stocks, the Shenzhen 100 Index, SME Index, and ChiNext Index, are 1,975, 912, and 637 million shares, respectively. However, the average prices of the three boards are 20, 19, and 19 CNYs. In consideration of the actual market structure with three board indices, we set three stocks—one large-cap stock, one mid-cap stock, and one small-cap stock as well as a risk-free asset—in the agent-based multiple-order-book model. The shares of large-, mid-, and small-cap stocks are set as 2,000,000, 1,000,000, and 500,000, respectively, which are close to the one thousandths of real numbers, and the initial prices of the three stocks were 20 CNYs, as shown in Table 1. Also, we assumed there was no fundamental value correlation among the three stocks and that the interest rate of cash was zero.
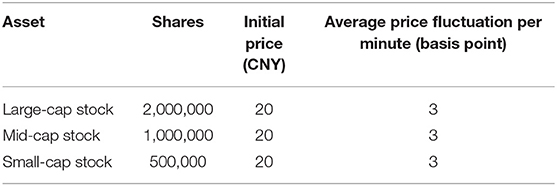
Table 1. Asset setting in the agent-based multiple-order-book model.
(2) Investor design
Considering the calculation capacity limits of the simulation platform, we set the number of total investors as N = 5,000. When investors engage in the market the first time, they are allocated a certain amount of initial stocks and cash. The initial position of investor i of stock j, , is
where is the average position of stock j allocated to each investor as the total shares of stock j over total investors. φ refers to the uniform distribution with the boundary limit, [0.1, 1.9], complying with the heterogeneity of investors. Also, we assumed the initial cash of the investors was equal to the capitalization of stocks at the beginning of the simulation. In this view, the initial cash of investor i, , is
where is the initial price of stock j. In addition, when the investor's wealth is too low, we recognize the investor as bankrupt. Meanwhile, a new investor will be enrolled in the simulation market to ensure the normal operation of the agent-based model.
2.1.2. Investor Price Prediction
Following Chiarella et al. [37], we adopted three types of investorsfundamental investor, technical investor, and a noise investor—which is in accordance with the market-participator reality in the Chinese stock market. In this view, in our model, the investor makes a price prediction based on a mixed-heterogeneity belief. The return prediction of investor i of stock j is
where ε is responsible for the investor's noise belief, and denotes the predicted return by investor i of stock j based on fundamental belief. Incorporated with investor trading horizon τi, is calculated as the natural log value of the fundamental value of stock j, denoted as , over price , as shown in Equation (4). Also, refers to the predicted return by investor i of stock j based on technical belief, calculated as the natural log value of short-term average price over long-term average price , as shown in Equation (5).
In addition, xi, yi, and zi represent the weight of technical, fundamental, and noise belief, following the constraints as xi = x*θ, yi = (1−x* − z*)θ, and zi = z*θ, where θ is of uniform distribution with [0, 1] as the boundary limit. x*, y*, and z* are the given exogenous technical, fundamental, and noise parameters, respectively, in the agent-based model, and the sum of the three parameters is equal to one, as shown in Equation (6):
The trading horizon of investor i, τi, is determined by the relation between technical belief weight xi and fundamental belief weight yi. If the technical belief weight xi grows, the trading horizon begins to be narrowed. Meanwhile, the larger the fundamental belief weight yi, the longer the trading horizon, as shown in Equation (7). We set the initial trading horizon τ* = 5days = 1200t. The possibility of investor arrival at the market is inverse to trading horizon τi and follows Poisson distribution with the parameter of λi = ω /τi.
In the end, the investor makes a stock-return prediction with regard to mixed fundamental, technical, and noise beliefs. The predicted price of stock j at time t, , is derived from the price of stock j at time t, , as shown in Equation (8):
2.1.3. Investor-Adaptive Asset-Allocation Model
Asset allocation is the most important procedure in the investor-trading decision-making process. In the 1950s, Markowitz [38] introduced the well-known “mean-variance” model as the first scientific calculation of optimal portfolio weights upon equities risks. However, based on the survey results of the Shanghai Stock Exchange Market Quality Report 2016, we found that, in the Chinese stock market, most individual investors show intensely irrational compulsions when making asset-allocation decisions. In fact, most Chinese investors favor stocks with better performances or that have been extensively covered by the media in recent weeks, indicating a hot-topic-chasing preference in investors' adaptive asset-allocation processes. Follow Brock and Hommes [39], we integrated the adaptive belief-transfer mechanism to investors' asset-allocation decision-making processes and constructed an investor-adaptive asset-allocation model.
In our model, when investors come to the stock market, they spread their wealth into the positions of four assets based on the predicted returns1. The distributed wealth ratio of asset j by investor i, , is
where is the predicted return of asset j by investor i, and β is the adaptive transfer degree.
With the wealth ratio allocated to each asset, we can get the cash balance of investor i in asset j at time t, , as
where is the total balance of investor i at time t.
2.1.4. Investor Order-Placing Rule
In the model, the investors decide the order direction, order type, and order size based on the analysis of the predicted return and temporal status of the order book. Following Gil-Bazo et al. [40], we assume that investors reserve part of their return, μ, as compensation for the transaction cost2. The reserved return is
where is the midpoint of the optimal bid and ask spread.
Table 2 shows the detailed order-placing rules of the investors. We follow this mechanism design proposed by Gil-Bazo et al. [40]. As shown in the table, investor i decides the order type by comparing the distance between asset predicted price, , and reserved return, μ. For example, when both the bid and ask orders exist in the order book (scenario 1), if the difference between the predicted price, , and reserved return, μ, is higher than the optimal ask price, the investor places a market bid order with a price of . If the predicted price, , is not larger than the optimal ask price, , plus the reserved return, μ; not smaller than the optimal bid price, , minus the reserved return, μ; and larger than the midpoint of the optimal bid-ask spread, , the investor would place a limit bid order with a price of .
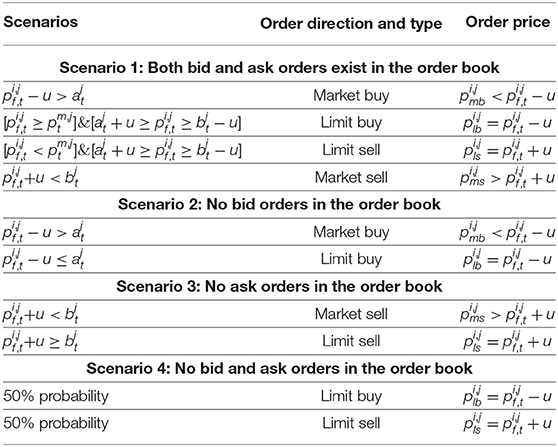
Table 2. Order-placing rules of investors.
In the end, the model determines the order size of the investor. When the investor decides to buy a stock, he or she will place all cash allocated to the stock into the bid order, and the size of the bid order is . Meanwhile, when the investor decides to sell a stock, he or she will leave no positions left.
3. Simulation Results
3.1. Price Pattern
Figure 1 shows the dynamics of the price series of the large-cap stock with small and large ticker sizes (0.001 and 0.1, respectively). We can found that under a ticker size of 0.001, the price pattern shows powerful evidence for stock-liquidity sufficiency with a smooth and continuous line. Also, the price pattern of the small ticker size, 0.001, presents mild fluctuation with a narrow range, gradually increasing and descending from 20.5 to 21. Meanwhile, the price line with regard to the large ticker size, 0.1, is of adequate liquidity with a jagged shape, indicating a low degree of participation in the placement of bid-ask orders. In addition, we found that the price range of the large ticker size varies from 0 to 21, which is much larger than that of the small ticker size, indicating a higher degree of volatility.
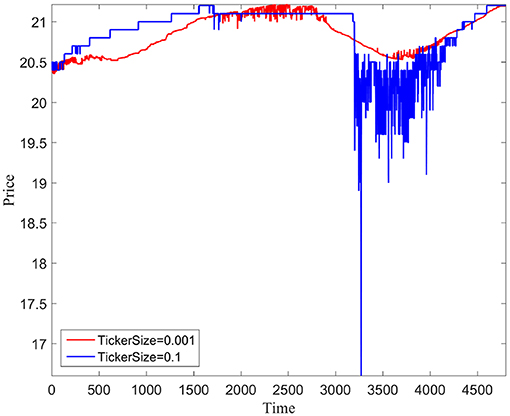
Figure 1. Price-evolution pattern of the large-cap stock.
Figure 2 shows the price-evolution series of the mid-cap stock with small and large ticker sizes. We can see that, similarly to Figure 1, the price pattern of the small ticker size shows more liquidity than the large ticker size with a flatter line. Also consistent with Figure 1, the price pattern of the small ticker size shows higher stability with a limited price range of 20.5–19.5 compared to the large ticker's wild range of 18–23. However, the price trends of the mid-cap stock show few differences from those of the large-cap stock. We can see in Figure 2 that, unlike the rising trends at the beginning of the large-cap stock simulation, the price evolutions of the small and large ticker sizes of the mid-cap stock are of a declining character at the beginning of the simulation and gradually bounce back later in the simulation.
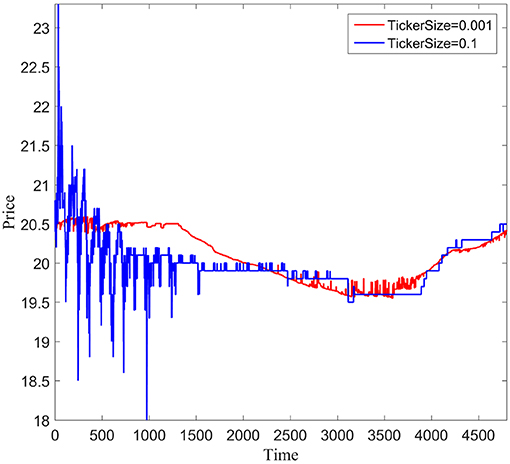
Figure 2. Price-evolution pattern of the mid-cap stock.
Figure 3 shows the price pattern of the small-cap stock under the circumstances of small and large ticker sizes. We can found that, different from Figures 1, 2, the price evolution of the small ticker size with the small-cap stock shows no noticeable curves, indicating a higher degree of stability. Consistent with Figures 1, 2, the price pattern of the large ticker size shows more volatility with vast price changes from 0 to 80 in contrast to the near-zero price change of the small ticker. Also, we can see that the maximum price of the small-cap stock with a large ticker size is roughly four times that of the large- and mid-cap stocks, and the price pattern exhibits more peaks with those in Figures 1, 2, indicating a further lower level of stability.
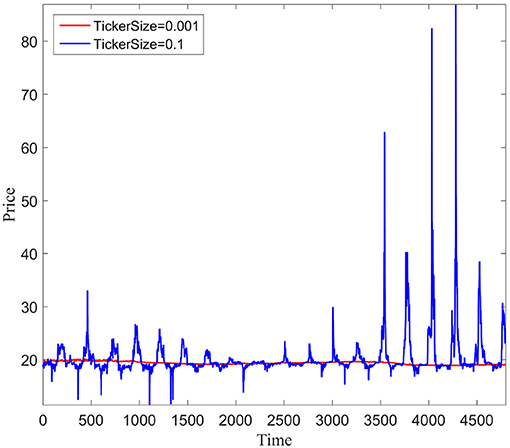
Figure 3. Price-evolution pattern of the small-cap stock.
3.2. Market Liquidity
For market liquidity, we adopted three primary measurements. The first one lies in the bid-ask spread, which is widely used in prior research. Also, to obtain more comprehensive insight, we introduced a second measurement, order depth, which is calculated as the average of the sum of the bid-ask order volumes. The construction process is as follows
where Volume_askj,t is the j-th ask-order volume at time t, Volume_bidj,t is the j-th bid-order volume at time t, and Deptht is the order depth at time t, k=5.
The third is the liquidity index, LSSE, proposed by the Shanghai Stock Exchange, one of the two leading exchanges in China. The index measures the elasticity of the trading CNY change upon the variation in stock price, Δ3. The more CNY initiated in the stock-price change, the greater the index, indicating a higher degree of liquidity. The specific calculation process is as follows
where Bj and Aj are the j-th bid and ask quotations. Dj is the order depth with the j-th quotation.
Table 3 reports the bid-ask spreads of the large-, mid-, and small-cap stocks with escalating levels of tick sizes from 0.001 to 0.1. We found clear variations in the spread traces at the cross-sectional and tick-size-series levels. From the cross-sectional perspective, we find that within each tick size, the small-cap stock has the lowest liquidity and the largest bid-ask spread value. Meanwhile, in view of the tick-size series, we found that market liquidity shows the greatest favor with a tick size of 0.001 by the minimum average bid-ask spread value. We could also see that the average bid-ask spread value shows a noticeable growing trend with increasing bid-ask spread values, indicating a lower level of market liquidity.
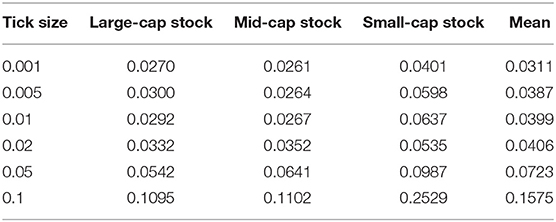
Table 3. Bid-ask spreads of large-, mid-, and small-cap stocks.
Table 4 shows the results of the second market-liquidity measuring instrument, the order depth, with the integration of trading volume, across the three types of stocks. Consistent with Table 3, we conducted the analysis from both tick-size-series and cross-sectional perspectives. We found that, within the tick-size series, the order depths generally show continuous growth, with the exception of tick size 0.05, which is in line with findings of Lepone and Wong [18] by the large. From the cross-sectional perspective, we found that at each tick-size level, the large-cap stock has the largest order depth, which is roughly 1.67 and 3.29 times those of the mid- and small-cap stocks, respectively.
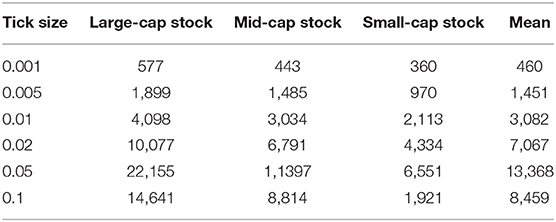
Table 4. Order depths of large-, mid-, and small-cap stocks.
Table 5 shows the results of the third market liquidity indicator, the liquidity indices, through large-, mid-, and small-cap stocks. Consistent with Tables 3, 4, we initiated tick-size-series and cross-sectional checks of the dynamics of the liquidity indices. The average and large cap market-liquidity indices show apparent falls with increasing tick-size values from 0.005 to 0.1, indicating an impairing trend in market liquidity. We can also found that the large-cap stocks have the largest liquidity index values, showing a considerable edge in market liquidity at each tick-size level.
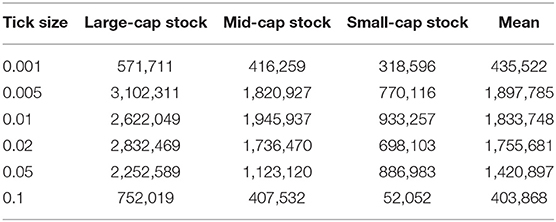
Table 5. Liquidity indices of large-, mid-, and small-cap stocks.
3.3. Volatility
For market volatility, we took the traditional standard deviation in stock price as the indicator. Table 6 shows that the average market volatilities grew following the expansion of tick sizes, with the exception of tick size 0.02, which is generally consistent with findings of Griffith and Roseman [15]. Also, within each tick size, we can find that large-cap stocks usually have the least volatility and the smallest numbers. Meanwhile, mid- and small-cap stocks had the second- and first-highest volatilities with the second-largest and largest deviations, respectively.
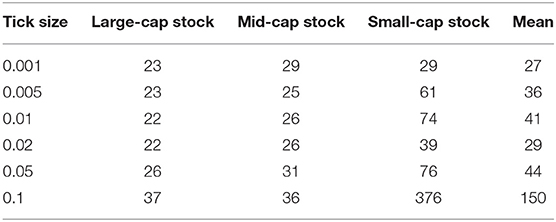
Table 6. Volatilities of large-, mid-, and small-cap stocks.
3.4. Market-Pricing Efficiency
For market-pricing efficiency, we took two indicators, MAE and MRE, as the measuring instruments. MAE refers to the absolute distance between stock price, pt, and stock fundamental value, ft. Similarly, MRE is the relative distance between stock price, pt, and stock fundamental value, ft. The smaller the indicator number, the higher the pricing efficiency of the market. The detailed constructions of both indicators are as follows
Tables 7, 8 show the results for the market-pricing-efficiency indicators, MAE and MRE, with large-, mid-, and small-cap stocks. We found that, if expanded intervals are taken, such as 10 times, the average MAEs and MREs of 0.1 (0.01) are much larger than those of 0.01 (0.001), respectively. In this view, we believe that the market efficiency generally falls with the increase of tick sizes, especially when the size intervals are of huge differences4. We can also find that in most cases, mid- and small-cap stocks have the best and worst market-pricing efficiencies, respectively, with smallest and largest MAE and MRE values for each tick size.
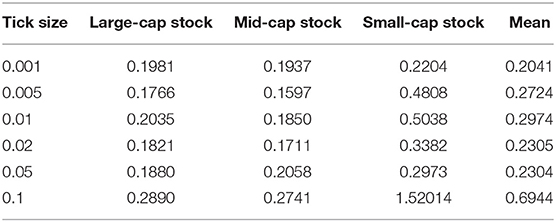
Table 7. MAEs of large-, mid-, and small-cap stocks.

Table 8. MREs of large-, mid-, and small-cap stocks.
3.5. Investor Wealth
Table 9 shows the results for the investor wealth dynamics with each distinct tick size. We found that the dynamic pattern of investor wealth has a concave character, and the maximum value of investor wealth corresponds to a tick size of 0.001. Also, with increasing tick-size value, investor wealth shows a falling trend with reduced values, reaching the lowest point at tick size 0.01. After that, investor wealth starts to rebound with growing values from tick sizes 0.02 to 0.1.
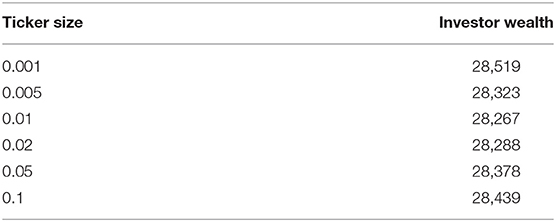
Table 9. Investor wealth and ticker sizes.
4. Conclusion
This study used an agent-based multiple-order-book stock-market model to investigate the relationship between tick size and market quality. We set six tick sizes from 0.001 to 0.1. With a gradual increase in tick size, market liquidity showed a significant drop with amplified bid-ask spreads and shrunken liquidity index values. Also, for market volatility, we found noticeable volatility decreases with declining tick sizes. In addition, we investigated market efficiency, which is a major element of market quality. We found that market efficiency would be weakened upon the increase of tick size, especially when the interval is of large distance. Furthermore, from a cross-sectional perspective, we found that small-cap stocks had the worst market quality with the least satisfactory indicator values.
Data Availability Statement
The raw data supporting the conclusions of this article will be made available by the authors, without undue reservation.
Author Contributions
RZ and XL conceived the method and conducted the model. YC analyzed the results and detailed the method. All authors reviewed the manuscript.
Funding
We affirm that this work was supported by the National Natural Science Foundation of China (No. 71901107) and the Fundamental Research Funds for the Central Universities (Nos. JUSRP11996 and 2019JDZD16).
Disclaimer
The views expressed in this paper are those of the author(s) and do not necessarily represent the views of the Shenzhen Stock Exchange.
Conflict of Interest
The authors declare that the research was conducted in the absence of any commercial or financial relationships that could be construed as a potential conflict of interest.
Footnotes
1. ^The predicted return of cash is zero.
2. ^We do not implement a specific check of the size of reserved return. However, with the simulation tests, we find that a limited variation of reserved return presents no impact to the final results.
3. ^We set the price change magnitude, Δ, as 1%.
4. ^The original evolutions of average MAEs and MREs in Tables 7, 8 demonstrate faulty monotonicity, with certain breaks at 0.02 and 0.05. We attribute this phenomenon as the result of narrowed interval setting from 0.005 to . Each interval from 0.005 to is 2 or 2.5 times, much smaller than that between 0.1 (0.01) and 0.01 (0.001). Also, if we designate the 0.001 and 0.005, 0.01 and 0.02, and 0.05 and 0.1, as hypothetical low, medium and high tick size subgroups, it is evident to see that the averages of MAE and MRE grow with the escalation of subgroup sizes. In this view, the monotone increasing characters of MAEs and MREs are perfectly presented with the expansion of size intervals.
References
1. Zhao X, Chung KH. Decimal pricing and information-based trading: tick size and informational efficiency of asset price. J Bus Finance Account. (2006) 33:753–66. doi: 10.1111/j.1468-5957.2006.00622.x
2. Chakravarty S, Wood RA, Van Ness RA. Decimals and liquidity: a study of the NYSE. J Financ Res. (2004) 27:75–94. doi: 10.1111/j.1475-6803.2004.00078.x
3. Aitken M, Comerton-Forde C. Do reductions in tick sizes influence liquidity? Account Finance. (2005) 45:171–84. doi: 10.1111/j.1467-629x.2004.00128.x
4. Pan W, Song FM, Tao L. The effects of a tick-size reduction on the liquidity in a pure limit order market: evidence from Hong Kong. Appl Econ Lett. (2012) 19:1639–42. doi: 10.1080/13504851.2011.650327
5. Goldstein MA, Kavajecz KA. Eighths, sixteenths, and market depth: changes in tick size and liquidity provision on the NYSE. J Financ Econ. (2000) 56:125–49. doi: 10.1016/S0304-405X(99)00061-6
6. Alampieski K, Lepone A. Impact of a tick size reduction on liquidity: evidence from the Sydney Futures Exchange. Account Finance. (2009) 49:1–20. doi: 10.1111/j.1467-629X.2008.00279.x
7. Kuo SW, Huang CS, Chen CC. Impact of the change in tick size on transaction costs and liquidity: an empirical investigation of the Taiwan Stock Exchange. Asia Pac J Financ Stud. (2010) 39:524–51. doi: 10.1111/j.2041-6156.2010.01020.x
8. Hsieh TY, Chuang SS, Lin CC. Impact of tick-size reduction on the market liquidity—evidence from the emerging order-driven market. Rev Pac Basin Financ Markets Policies. (2008) 11:591–616. doi: 10.1142/S0219091508001490
9. Martinez V, Tse Y. The impact of tick-size reductions in foreign currency futures markets. Finance Res Lett. (2019) 28:32–8. doi: 10.1016/j.frl.2018.03.023
10. Comerton-Forde C, Grégoire V, Zhong Z. Inverted fee structures, tick size, and market quality. J Financ Econ. (2019) 134:141–64. doi: 10.1016/j.jfineco.2019.03.005
11. Yamamoto R. Limit order submission risks, order choice, and tick size. Pac Basin Finance J. (2020) 59:101261. doi: 10.1016/j.pacfin.2019.101261
12. Chung D, Hrazdil K. Liquidity and market efficiency: a large sample study. J Bank Finance. (2010) 34:2346–57. doi: 10.1016/j.jbankfin.2010.02.021
13. Chung DY, Hrazdil K. Liquidity and market efficiency: analysis of NASDAQ firms. Glob Finance J. (2010) 21:262–74. doi: 10.1016/j.gfj.2010.09.004
14. Chung KH, Kim KA, Kitsabunnarat P. Liquidity and quote clustering in a market with multiple tick sizes. J Financ Res. (2005) 28:177–95. doi: 10.1111/j.1475-6803.2005.00120.x
15. Griffith TG, Roseman BS. Making cents of tick sizes: the effect of the 2016 US SEC tick size pilot on limit order book liquidity. J Bank Finance. (2019) 101:104–21. doi: 10.1016/j.jbankfin.2019.01.017
16. Chung KH, Van Ness RA. Order handling rules, tick size, and the intraday pattern of bid-ask spreads for Nasdaq stocks. J Financ Markets. (2001) 4:143–61. doi: 10.1016/S1386-4181(00)00021-5
17. Bacidore J, Battalio RH, Jennings RH. Order submission strategies, liquidity supply, and trading in pennies on the New York Stock Exchange. J Financ Markets. (2003) 6:337–62. doi: 10.1016/S1386-4181(03)00003-X
18. Lepone A, Wong JB. Pseudo market-makers, market quality and the minimum tick size. Int Rev Econ Finance. (2017) 47:88–100. doi: 10.1016/j.iref.2016.10.002
19. Chung KH, Chuwonganant C. Tick size and quote revisions on the NYSE. J Financ Markets. (2002) 5:391–410. doi: 10.1016/S1386-4181(01)00029-5
20. Xiong X, Liang J, Cui Y, Zhang W, Zhang Y. Analysis of the spot market's T+ 1 trading system effects on the stock index futures market. Eurasia J Math Sci Technol Educ. (2017) 13:7679–93. doi: 10.12973/ejmste/77941
21. Zhang Y, Zhang W. Can irrational investors survive? A social-computing perspective. IEEE Intell Syst. (2007) 22:58–64. doi: 10.1109/MIS.2007.4338495
22. Wei L, Xiong X, Zhang W, He XZ, Zhang Y. The effect of genetic algorithm learning with a classifier system in limit order markets. Eng Appl Artif Intell. (2017) 65:436–48. doi: 10.1016/j.engappai.2017.07.006
23. Wei L, Zhang W, Xiong X, Zhao Y. A multi-agent system for policy design of tick size in stock index futures markets. Syst Res Behav Sci. (2014) 31:512–26. doi: 10.1002/sres.2292
24. Yeh CH, Yang CY. Examining the effectiveness of price limits in an artificial stock market. J Econ Dyn Control. (2010) 34:2089–108. doi: 10.1016/j.jedc.2010.05.015
25. Dieci R, He XZ. Heterogeneous agent models in finance. In: Hommes C, LeBaron B, editors. Handbook of Computational Economics. Vol. 4. Amsterdam: Elsevier (2018). p. 257–328.
26. Hoffmann AOI, Jager W, Von Eije JH. Social simulation of stock markets: taking it to the next level. J Artif Soc Soc Simul. (2007) 10:7. Available online at: http://jasss.soc.surrey.ac.uk/10/2/7.html
27. Zhang W, Bi Z, Shen D. Investor structure and the price-volume relationship in a continuous double auction market: an agent-based modeling perspective. Phys A Stat Mech Appl. (2017) 467:345–55. doi: 10.1016/j.physa.2016.10.044
28. Zhao R, Xiong X, Shen D, Zhang W. Investor structure and stock price crash risk in a continuous double auction market: an agent-based perspective. Int J Inform Technol Decis Making. (2019) 18:695–715. doi: 10.1142/S0219622019500081
29. Sornette D. Physics and financial economics (1776–2014): puzzles, Ising and agent-based models. Rep Prog Phys. (2014) 77:062001. doi: 10.1088/0034-4885/77/6/062001
30. Zhou WX, Sornette D. Self-organizing Ising model of financial markets. Eur Phys J B. (2007) 55:175–81. doi: 10.1140/epjb/e2006-00391-6
31. Sornette D, Zhou WX. Importance of positive feedbacks and overconfidence in a self-fulfilling Ising model of financial markets. Phys A Stat Mech Appl. (2006) 370:704–26. doi: 10.1016/j.physa.2006.02.022
32. Jiang ZQ, Xie WJ, Zhou WX, Sornette D. Multifractal analysis of financial markets: a review. Rep Prog Phys. (2019) 82:125901. doi: 10.1088/1361-6633/ab42fb
33. Meng H, Ren F, Gu GF, Xiong X, Zhang YJ, Zhou WX, et al. Effects of long memory in the order submission process on the properties of recurrence intervals of large price fluctuations. Europhys Lett. (2012) 98:38003. doi: 10.1209/0295-5075/98/38003
34. Zhou J, Gu GF, Jiang ZQ, Xiong X, Chen W, Zhang W, et al. Computational experiments successfully predict the emergence of autocorrelations in ultra-high-frequency stock returns. Comput Econ. (2017) 50:579–94. doi: 10.1007/s10614-016-9612-1
35. Wei L, Zhang W, Xiong X. The mechanism and solution for the liquidity stampede crisis in stock markets. J Manag Sci China. (2017) 20:1–23. Available online at: https://kns.cnki.net/KCMS/detail/detail.aspx?dbcode=CJFQ&dbname=CJFDLAST2017&filename=JCYJ201703001&v=MjA2MjJDVVI3cWZZK1JuRnlublVyclBMeTdTWkxHNEg5Yk1ySTlGWllSOGVYMUx1eFlTN0RoMVQzcVRyV00xRnI=
36. Xiong X, Yian C, Wei L, Chen S, Zhang W. Adaptive asset allocation and commonality in multi order books. In: The 23rd International Conference on Computing in Economics and Finance, June 28–30, 2017, New York NY.
37. Chiarella C, Iori G, Perelló J. The impact of heterogeneous trading rules on the limit order book and order flows. J Econ Dyn Control. (2009) 33:525–37. doi: 10.1016/j.jedc.2008.08.001
38. Markowitz H. Portfolio selection. J Finance. (1952) 7:77–91. doi: 10.1111/j.1540-6261.1952.tb01525.x
39. Brock WA, Hommes CH. Heterogeneous beliefs and routes to chaos in a simple asset pricing model. J Econ Dyn Control. (1998) 22:1235–74. doi: 10.1016/S0165-1889(98)00011-6
Keywords: tick size, market quality, agent-based modeling, multiple order books, market capitalization
Citation: Zhao R, Cui Y and Liu X (2020) Tick Size and Market Quality Using an Agent-Based Multiple-Order-Book Model. Front. Phys. 8:135. doi: 10.3389/fphy.2020.00135
Received: 15 January 2020; Accepted: 06 April 2020;
Published: 08 May 2020.
Edited by:
Wei-Xing Zhou, East China University of Science and Technology, ChinaReviewed by:
Yajun Xiao, University College Dublin, IrelandWen Long, University of Chinese Academy of Sciences, China
Copyright © 2020 Zhao, Cui and Liu. This is an open-access article distributed under the terms of the Creative Commons Attribution License (CC BY). The use, distribution or reproduction in other forums is permitted, provided the original author(s) and the copyright owner(s) are credited and that the original publication in this journal is cited, in accordance with accepted academic practice. No use, distribution or reproduction is permitted which does not comply with these terms.
*Correspondence: Yian Cui, eWFjdWkmI3gwMDA0MDtzenNlLmNu