 Yingjie Qu1
 Yuquan Meng2
 Sui Feng1Maoyu Liu3Linlin Xiao3Xiaoyuan Zhang3Jinjin Zheng1Shufang Chang3*Ronald X. Xu1,4*
- 1Department of Precision Machinery and Precision Instrumentation, University of Science and Technology of China, Hefei, China
- 2Department of Thermal Science and Energy Engineering, University of Science and Technology of China, Hefei, China
- 3Department of Obstetrics and Gynecology, Second Affiliated Hospital of Chongqing Medical University, Chongqing, China
- 4Department of Biomedical Engineering, The Ohio State University, Columbus, OH, United States
Vulvar lichen sclerosus (VLS) is a common inflammatory condition associated with an increased risk of developing vulvar carcinoma. Recently, high-intensity focused ultrasound (HIFU) has been identified as a promising treatment modality for VLS in several clinical trials. However, in HIFU therapy, therapeutic outcome is routinely assessed visually by an expert using standardized grading criteria. Furthermore, such a therapeutic assessment cannot be made until at least 3 months after treatment. Therefore, an objective and timely method capable of quantitatively evaluating HIFU treatment effectiveness is desired, which may help identify patients whose treatment is insufficient promptly and prevent delay in re-treatment. The purpose of this study is to investigate the feasibility of using active dynamic thermal imaging (ADT) and hyperspectral imaging (HSI) as two individual objective and non-invasive optical methods for prompt quantitative assessment of the therapeutic response to HIFU treatment in VLS. From December 2018 to March 2019, 20 female VLS patients who underwent HIFU treatment were evaluated using both the ADT and HSI methods. The effective damage rate from the ADT method and the entropy of feature index from the HSI method were used to develop a multivariate linear discriminant classification model for grading the effectiveness of HIFU treatment in comparison with clinical evaluation gold standard. It was found that ADT was able to correctly differentiate ineffective treatments from effective ones with a sensitivity of 100% and specificity of 100%, while the sensitivity and specificity of HSI were 75 and 87.5%, respectively. The classification results demonstrate the clinical potential of the ADT and HSI methods for timely non-invasive and quantitative assessment of HIFU treatment for VLS.
1. Introduction
Vulvar Lichen Sclerosus (VLS) is a chronic mucocutaneous disorder, which is likely to lead to impairment in sexual function and the potential for malignant transformation [1–4]. Early diagnosis, prompt treatment, and appropriate follow-up are extremely important to prevent these negative sequelae [4–6].
Since the etiology of VLS has not yet been fully explained, effective treatments are lacking [7]. Current treatment for VLS mostly focuses on symptomatic relief [7]. Potent corticosteroids applied topically are generally considered as the first-line treatment [8, 9]. When properly administered, these can help to resolve the symptoms of pruritus. However, safety concerns exist regarding long-term use [10, 11]. As this standard treatment can cause side effects, such as atrophy, and has a high recurrence rate, new effective alternatives should be studied for clinical practice.
Considering the serious side effects of traditional treatment, high-intensity focused ultrasound (HIFU) treatment, which uses ultrasound as a carrier of energy, has gradually gained popularity as an alternative treatment for VLS [2, 4, 12–16]. Propagating harmlessly, HIFU causes a sufficient local rise in temperature for the thermal destruction of target tissues without damaging surrounding or overlying tissues [17]. Due to its non-invasive nature, this technology has been used for the ablation of solid tumors [18]. Furthermore, HIFU has been used for several other therapeutic applications [13, 19]. Recently, several clinical trials have shown that HIFU treatment could relieve itching of the vulva and recover the vulvar skin's elasticity and appearance [12–16]. HIFU appears to be a promising treatment modality for vulvar diseases, including VLS. Today, this technique is regularly used for treating this condition in many centers of China.
Although HIFU treatment is recognized as an effective therapy for VLS, there is a lack of quick, quantitative assessment methods for therapeutic response to HIFU in VLS. In clinical settings, patient symptoms, including pruritus and skin appearance, were investigated by a questionnaire before and after the treatment [20–22]. The scores on the questionnaire were used to evaluate effectiveness [12, 14], but these are subjective and may cause mis-assessment. Since this assessment method is based on symptoms, evaluation of therapeutic effectiveness cannot be carried out until at least 3 months after treatment, which is time-consuming and may lead to delayed re-treatment. Thus, it is important to find a new non-invasive and quantitative assessment method to help the gynecologist evaluate therapeutic response in a timely manner.
Ultrasound interacts with biological tissue through both thermal and mechanical mechanisms [23–25]. The biological effects of ultrasound pulses are determined by both ultrasound beam parameters and tissue property alterations [26]. Considering the changes of thermal and optical properties during HIFU treatment, infrared (IR)-thermography-based methods and spectral imaging-based methods are expected to serve as viable solutions for quantitative assessment of HIFU-induced tissue injuries.
Classical IR-thermography has been widely applied for medical diagnostics of burns and wounds by measuring the surface temperature distribution of the target area [27–30]. However, the distribution of temperature on a patient may be strongly affected by physiological and environmental conditions. In active dynamic IR thermal imaging (ADT), an external excitation source is used to induce thermal transient processes in a tested object in order to retrieve the thermal properties of tissue, such as its conductivity, diffusivity, and equivalent thermal time constant, with reduced artifacts of temperature fluctuations [27, 28]. Since the main mechanisms of HIFU treatment for VLS are thermal effects, which cause temperature increase in the vulvar skin [23, 24], the ADT method, which shows changes in tissue thermal properties instead of changes in temperature distribution, can be used for quantitative objective assessment of HIFU treatment efficacy.
In addition to measuring the changes in thermal properties by the ADT method, detecting the changes in optical properties by a spectral imaging method seems to be a promising alternative to evaluate the efficacy of HIFU treatment for VLS. Hyperspectral imaging (HSI) is an emerging technique that can provide both spatial and spectral information for an object. Recently, it has been widely used for measurements of specific chromophores within skin tissue for thermal injury assessment [31–33]. During HIFU treatment, both optical scattering and absorption coefficients increase as heat is applied to tissue [34]. HSI combines high spatial and spectral resolution in one modality, giving optical information on the target area. This makes it a promising tool for quantifying the changes in the optical properties of vulvar skin before and after HIFU treatment for therapeutic assessment.
In this paper, we investigate the feasibility of ADT with cold excitation and HSI as two individual objective and non-invasive optical methods for quick non-invasive assessment of the therapeutic response to HIFU in VLS based on the changes caused in tissue properties by HIFU treatment. To our knowledge, we are the first to propose such a prompt, non-invasive, and quantitative method for evaluation of HIFU treatment effectiveness in VLS patients.
2. Materials and Methods
HIFU therapy is a treatment in which ultrasound is applied to the target skin, i.e., infected area. During this process, low-level thermal injury occurs so that parts of unhealthy tissues are destroyed. Thus, the treatment will change the physical properties of the target skin area, e.g., its thermal conductance, specific heat capacity, and absorption spectrum [34, 35]. Hence, by quantifying the difference between the values of the physical properties before and after HIFU treatment, the therapeutic response to HIFU treatment can be accessed. The study overview is shown in Figure 1.
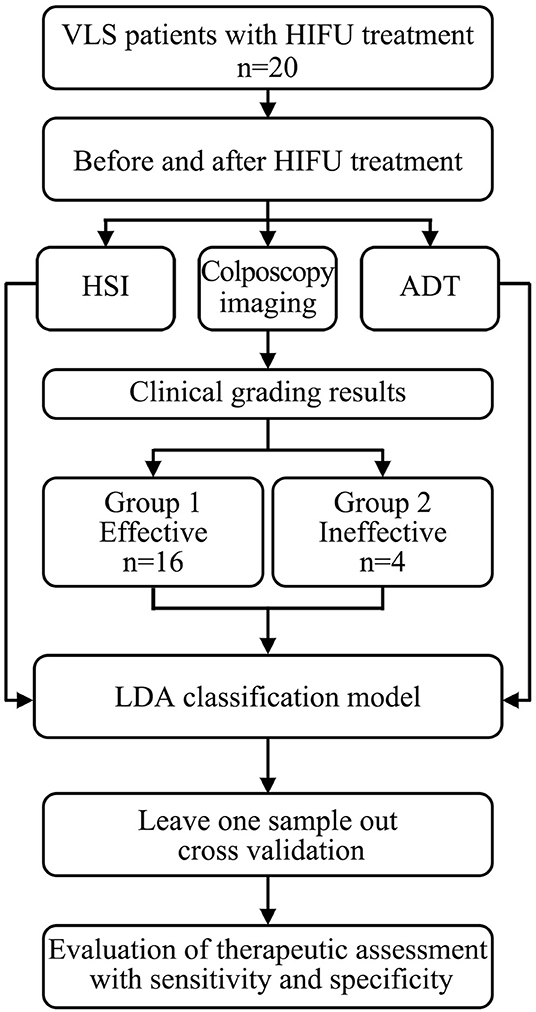
Figure 1. Flow chart of this study, in which we explored the feasibility of the ADT and HSI methods for non-invasive and quantitative assessment of HIFU treatment for VLS.
2.1. Theory
2.1.1. Physical Principles of Focused Ultrasound Therapy
The working mechanisms of HIFU therapy can be divided into two categories: mechanical effects and thermal effects [23–25, 36]. Those two effects play equally important roles in the ablation of solid tumors. However, in the HIFU treatment for VLS, the focused intensity is much lower than that in regular HIFU treatment for cancers. The dominant effects may alter due to the reduction in sound intensity. To quantify the therapeutic outcome, it is necessary to identify the dominant physical effects during HIFU treatment for VLS.
2.1.2. Thermal Effects
When ultrasound is transmitted through tissue, the sound energy is absorbed by the medium and converts to thermal energy of the tissue. The heat generated can be expressed as ter Haar and Coussios [23]:
where q is the heat generated (W/cm3), I is the intensity (W/cm2), a is the sound pressure absorption coefficient (cm−1), and t is the exposure time (s).
The relationship between a and sound frequency f can be approximated by the formula:
where the units of f and a are MHz and cm−1, respectively.
Consequently, we have:
The thermal effects are a function of the frequency of ultrasound. Under exposure to high-intensity ultrasound for a certain time, the temperature of tissue increases dramatically, which contributes to the denaturation of proteins and permanent damage of the focal zone so that lesions or tumor cells are killed. Consequently, the physical properties of the tissue, e.g., thermal conductivity, density, and heat capacity, alter owing to the thermal damage.
2.1.3. Mechanical Effects
The mechanical effect of ultrasound in a biomedical context is mainly a cavitation effect, which is ascribed to rapid changes in sound pressure [37]. During this process, the formation and blast of cavitation bubbles cause mechanical damage, and hence tissue ablations. To quantify the damage caused by the cavitation effect, the mechanical index (MI) is usually adopted [37]:
where Pra is the peak negative pressure (MPa) and fc is the central frequency of the ultrasound wave (MHz).
A lower MI indicates a lower degree of cavitation effect. A value lower than 0.5 is considered to indicate no bubble growth [37, 38], whereas 1.9 is considered to be the maximal threshold of no bioeffects, which is a value that is also adopted by the Food and Drug administration in its regulation for diagnostic ultrasound [37]. In regular HIFU treatment for cancers, which utilizes a high intensity of ultrasound, the cavitation effect plays an important role in curing lesions. However, the focal intensity of ultrasound in the VLS application is usually intermediate, as the goal is merely to stimulate the reconstruction and growth of tissues. To estimate the cavitation effect, 1,000 W/cm2 of underwater intensity or 4.6 MPa of subsurface pressure is chosen. The derated peak negative pressure is then formulated as [39]:
where Pr is measured peak negative sound pressure, which is usually assessed underwater, -0.0345 Np/(cm· MHz) is the attenuation factor used to obtain the approximate pressure in tissue, and z is the distance from the transducer.
In the HIFU treatment for VLS, the MI of ultrasound is estimated to be 1.5, which is less than the threshold of noticeable bioeffect. Therefore, in VLS treatment, the cavitation effect can be ignored. The treatment efficacy is mainly ascribed to the thermal effect of ultrasound. Therefore, the quantified thermal effect is applied as the index of treatment performance in the rest of this paper.
2.1.4. Active Dynamic Thermal Imaging (ADT)
It has been widely accepted that thermal damage is dependent on duration of exposure to the heat source and radiation power. Henriques utilized an Arrhenius equation to describe damage to the tissues [40]:
ω is the reaction rate, A is frequency factor, E is activation energy, R is the universal gas factor, and T is temperature. The total degree of tissue injury Ω is the integration of ω:
Since skin treated by HIFU suffers thermal injury, the variation of thermal properties can be implemented to quantify how effective the treatment. In our case, we first exert cold excitation to the target area and then remove the cold source and have the skin warm up. The advantage of taking this approach is that such a procedure is a routine in HIFU therapy of VLS. Therefore, no redundant steps are added during treatment. The general governing equation for heat transfer in this process is described by Pennes' equation [41]:
In our case, Buettner simplifies the equation by assuming [42, 43]:
1) The temperature is just a function of depth and time.
2) Heat convection to the air is negligible.
3) Material constants are uniform in time and space.
4) There is a linear temperature profile at the skin surface before the cold source is removed.
5) The temperature at depth d remains constant.
Then, the equation is simplified as 1-D heat transfer equation:
with the boundary condition:
By plugging in the boundary condition and using an inverse Fourier transformation, we finally obtain:
In our study, we only investigate the superficial temperature response after removing the cold source, and, for ease of analysis, only three terms of the series survive. That is:
where,
Here, we use τ to represent the time it takes for the skin surface temperature to stabilize. This depends on the density, thermal conductivity, heat capacity, and depth of the target skin domain. However, since the before-mentioned parameters vary considerably among patients, it does not suffice to infer the treatment level just by measuring post treatment τ. An alternative is to use the difference between pre-treatment and post-treatment τ. In our study, we adopt effective damage rate e:
where τref is τ of the affected vulvar area before treatment as a reference to calculate the effective damage rate e and τ corresponds to the affected area after treatment. To reduce the noise of raw data, the following model is utilized:
i.e.,
To fit the model, we take the average of raw data to time, then input the post-processed data into Equation (18).
2.1.5. Hyperspectral Imaging (HSI)
Reflection, scattering, and absorption are the optical properties affecting the nature of the interaction of ultrasound with biological tissues [34]. In this paper, we used the visible range for measurement, in which melanin and different types of hemoglobin are mainly considered to identify the optical properties of skin tissue [44–48]. Changes in the content of these absorbents will affect the diffuse reflectance of the skin tissue [49]. Thus, by analyzing the diffuse reflectance spectrum of the skin tissue before and after HIFU treatment, it is possible to determine how the content of different components changes in the skin tissue, which will be a potential tool for therapeutic assessment. According to the characteristic peaks of the spectra of the treated areas before and after HIFU treatment, oxy-hemoglobin(HbO2), deoxy-hemoglobin(Hb), and methemoglobin (mHb) were used as the three main absorption components for further analysis.
The absorption spectrum A(λ) in a skin model of N chromophores would be Equation (19) [17, 50]:
where ai is the absorption spectrum of each chromophore in tissues, Ci is the corresponding contribution of each chromophore, and G(λ) is used to take into account attenuation due to scattering. The average content of each component, defined as the feature index (FI), can then be calculated as Equation (20).
where is the average absorption contributed by component i and FIi is the corresponding contribution feature index (FI).
2.1.6. Patients and HIFU Treatment
This clinical trial was conducted in the Second Affiliated Hospital of Chongqing Medical University according to the protocol approved by the Institutional Review Board (IRB) of the Second Affiliated Hospital of Chongqing Medical University (IRB No: 2018KLS092). Each participant signed an informed consent document before enrolment. From December 2018 to March 2019, 20 female participants aging from 19 to 51 years with histological diagnoses of VLS were included in the study. Their disease duration was from 2 months to 4 years. No participant had received any treatment in the 3 months preceding HIFU treatment. Women who were pregnant or who had accompanying gynecologic diseases were excluded from the study.
The HIFU machine used was a Model CZF-300 manufactured by Chongqing Haifu Medical Technology Co., Ltd., Chongqing, China. It comprised a user console, the main system, a water cabinet, an electric control part, and a therapeutic transducer, as described by [12]. The frequency of the transducer is from 8 to 12 MHz, and its power ranges from 3.0 to 4.7 W. The probe was in contact with the lesion area via an ultrasound coupling and performed consecutive scanning at a speed of 3–5 mm/s. The treatment lasted from 15 to 30 min, depending on lesion size and skin reaction during treatment. For post-treatment management, ice packs were intermittently applied to affected skin (5 min ice application at 5 min intervals) within the first 24 h, and moist burn ointment was applied locally for a week.
2.2. Clinical Data Collection
Every patient's conditions, including itching and skin lesion appearance, were reported, and RGB images of the vulva were captured by colposcopy before and after HIFU treatment as clinical routines. In our experiment, before and immediately after the HIFU treatment, both the ADT and HSI methods were used for a quick quantitative evaluation of therapeutic response to HIFU. The full process is presented in Figure 2.
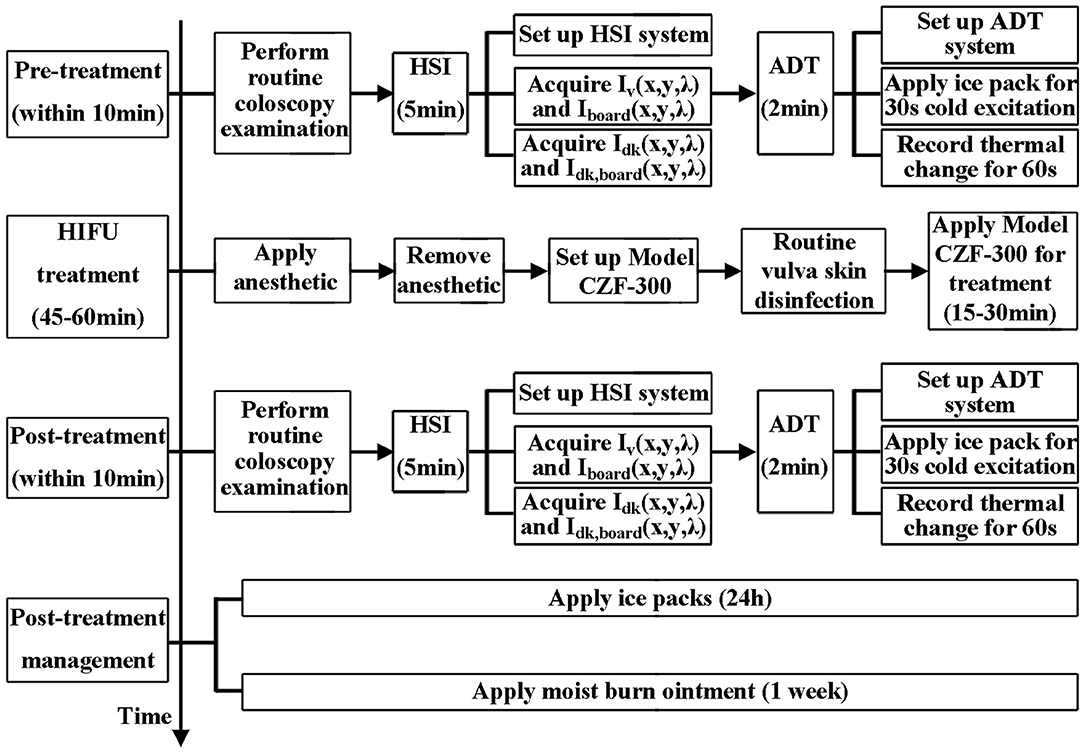
Figure 2. Flow chart of the clinical data collection process.
2.2.1. Active Dynamic Thermal Imaging (ADT)
To achieve high accuracy, the experiments were conducted in an air-conditioned operation room. The temperature and humidity in the room were respectively in the range of 22–23°C and 45–55%. An ice pack was applied to the entire vulva. Typically, the cooling phase lasted for 30–60 s, until the surface temperature of the vulva reached the temperature of the room. The self-warming phase equaled three times the cooling time. When the ice pack was removed from the vulva, a thermography IR camera (FLIR T460) with a high thermal resolution of 0.03 degrees was used to record the surface temperature of the vulva at a speed of 30 frames/s. Its thermal range for detection is 7.5–13 μm. The ice pack was only used once for cold excitation and was used again for the subsequent post-treatment management.
2.2.2. Hyperspectral Imaging (HSI)
A Brimrose hyperspectral imager (Brimrose, Sparks, Maryland) with a 500-Watt continuous white light source (Xenon Lamp Source, Beijing Optical Century Instrument Co., CHINA) was used to produce hyperspectral images of the target area from 450 to 650 nm with an internal of 2 nm [51, 52], as shown in Figure 6A.
2.3. Data Processing
2.3.1. Clinical Evaluation Method for HIFU Treatment Efficacy
Therapeutic response to HIFU was graded by a clinical scoring method, as shown in Table 1 [20–22]. All patients were followed up on by the same gynecologist once per month for the next 3 months (defined as short term), and each patient's condition before and after treatment was reported as clinical scores. Then, the therapeutic index was obtained: [(score before the treatment-score after treatment)/score before treatment] ×100%. The results were as follows:
1) Cured (Therapeutic index ≥90%);
2) Effective (Therapeutic index: 21–89%);
3) Ineffective (Therapeutic index ≤ 20%);
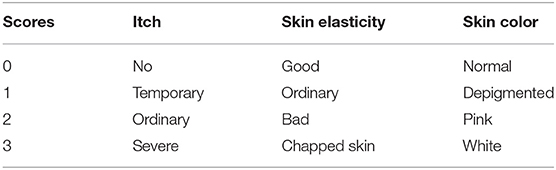
Table 1. Clinical evaluation method for HIFU treatment efficacy.
2.3.2. Image Registration
Though all enrolled patients were required to keep still for the acquisition of images of the vulva during data collection, image shifting was expected, which could introduce errors into the subsequent data analysis. In this paper, we used an improved SIFT (Scale Invariant Feature Transform) registration algorithm for image registration.
The traditional SIFT algorithm proposed by Lowe [53] has been widely used in video stabilization. In the SIFT method, the criterion for selecting feature points is to detect blobs in a frame. In our case, we focus on slow and accumulated movement. Thus, each frame has the same importance in the frame reconstruction. For example, in frame I, we first get all the SIFT descriptors from encompassing blobbed points. Then, the distances between those points to those in the previous frame are calculated. For each point, the point pairs with the least distance and less than a preset threshold will be preserved as matched feature points.
A flow chart showing the specifics of its implementation in this study is presented in Figure 3 and comprised the following steps:
1) Calculating the Gauss convolution of the logarithms of the temperature frames to construct an image Pyramid.
2) Detecting the extremum of pixel interpolation in a 4 × 4 area and leaving out the low response points or the sharp points.
3) Describing feature points. Figure 4A shows an example of feature points in two frames.
4) Numerous feature points were found in each frame after step 1, step 2, and step 3. By adding a localization limitation that loosens as the time difference increases, we can get matched sets and their match degrees. The matched point sets are shown in Figure 4B.
5) Initializing the movement weight matrix as a null matrix.
6) Calculating the movement weight matrix from the best-matched point sets. If the movement exceeds 3σ of the expected movement, the set of points will be neglected. Using a linear insertion method to fill in the movement weight matrix.
7) Finally, rebuilding the frames with the movement weight matrix.
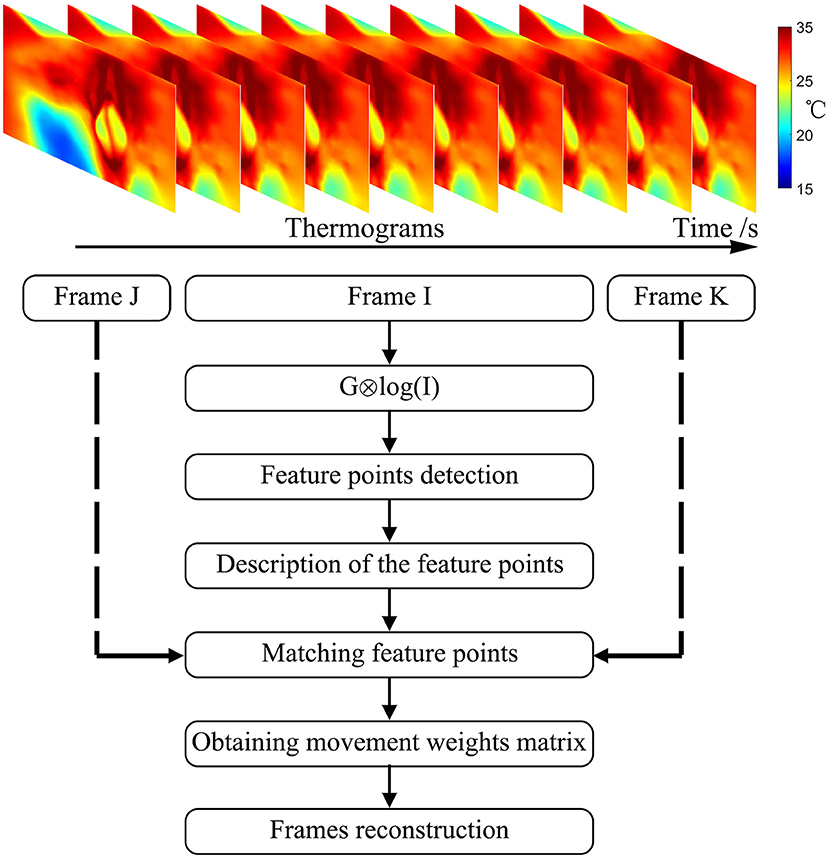
Figure 3. Flow chart of imaging registration.
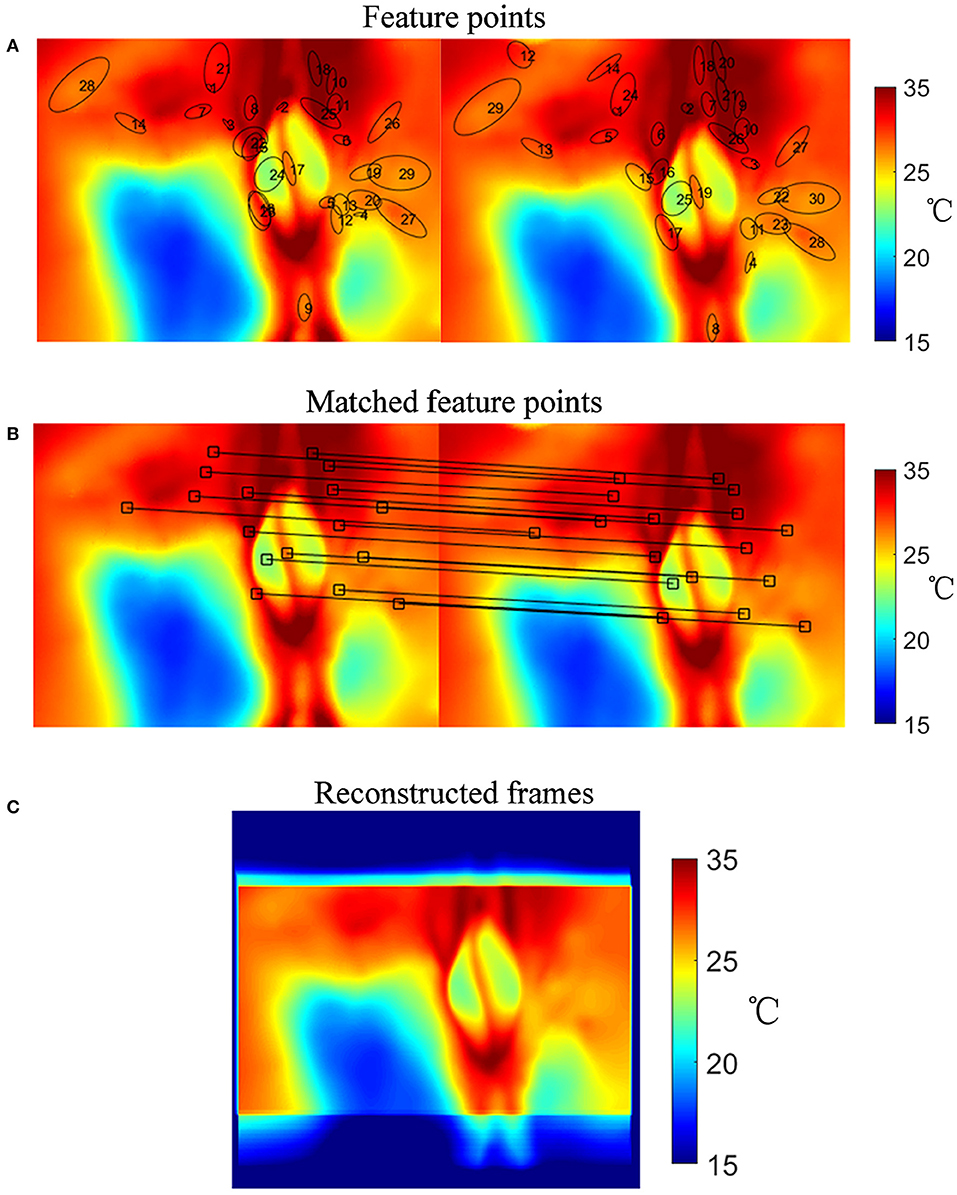
Figure 4. Image registration procedure. (A) Selected feature points in frames. (B) Matched point sets. (C) Reconstructed temperature image after image registration.
The result of the image registration is presented in Figure 4. Figure 4C shows the reconstructed temperature image after image registration. The number of feature points is not specified. The initial movement weight matrix is a null matrix, and the matched points change the weight matrix. Aside from the matched points, the weight matrix is filled by linear interpolation. If there was a frame with no matched point, its movement matrix would be evaluated by the linear interpolation between its prior and subsequent matrices.
2.3.3. Effective Damage Rate e From Active Dynamic Thermal Imaging (ADT)
In the ADT method, after the image registration process, we traced the temperature in every 2 × 2 pixels ROI of the vulva surface for every frame for the treatment areas, taken during the self-heating phase (after the cooling phase). This procedure is illustrated in Figure 5.
1) Acquiring the raw temperature curve vs. time T(0, t) for each ROI.
2) Reducing the noise of raw data by integrating as in Equation (17).
3) Calculating thermal time constant τref for each ROt by fitting G(0, t) as in Equation (18).
4) Calculating thermal time constant τ for each ROI by fitting G(0, t) as in Equation (18).
5) Calculating effective damage rate e for each ROI with Equation (16).
6) Plotting a histogram of the effective damage rate e of the selected treatment areas.
7) Extracting effective damage rates e less than a 3σ lower limit in the histogram and calculating the average of the extracted e.
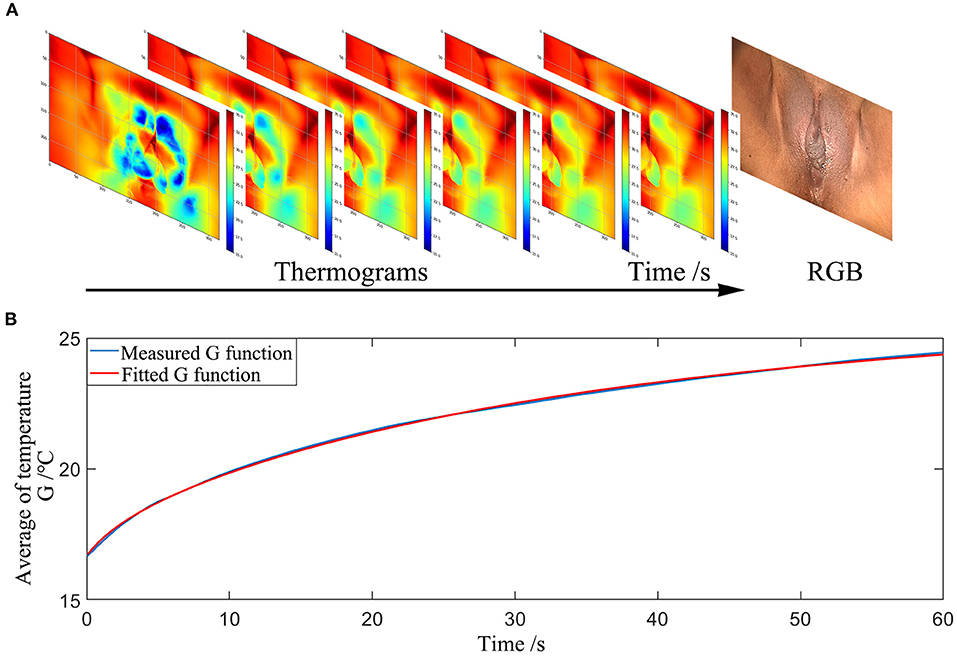
Figure 5. Measurement procedures of the ADT method (A) Thermograms of the temperature distribution at the surface of the vulvar skin recorded over time. (B) The average temperature trend of a selected area during the self-warming phase.
2.3.4. Entropy of Feature Index [H(FI)] From Hyperspectral Imaging (HSI)
The absorption spectrum of the affected vulvar skin was extracted at every 1 × 1 pixel for each patient. The reflectance spectrum R(x, y, λ) is corrected by a standard NIST traceable white diffuser (NIST, Gaithersburg, Maryland) with Equation (21), as shown in Figures 6B,C:
where Iv(x, y, λ) is the reflection intensity of the skin in band λ at point (x, y), and Iboard(x, y, λ) is the reflection intensity of a PTFE board covering the skin in band λ at point (x, y). There are two ways of acquiring the dark frames for reflectance correction. One is to keep the lens covered during exposure [54] and the other is to switch off the light source [48]. In our study, the dark frames, Idk(x, y, λ) and Idk, board(x, y, λ), are measured with the light source switched off [48].
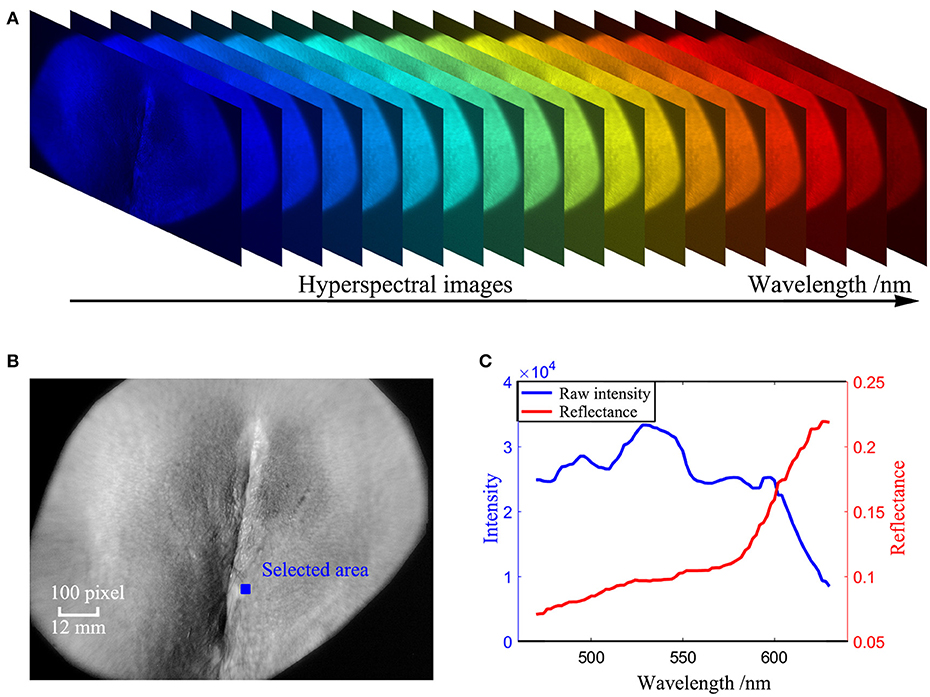
Figure 6. Measurement procedures of the HSI method (A) Hyperspectral images of the vulva captured in the wavelength range 450 nm to 650 nm. (B) A hyperspectral image of the vulva at a single wavelength of 550 nm after image registration. (C) absorption spectrum retrieved from the blue area in (B).
The absorption spectrum is given by Equation (22):
For quantifying the difference in the absorption spectrum between the effective treatment group and the ineffective treatment group, three independent features were selected according to the absorption curves of the treated areas before and after HIFU treatment. The index of each feature was calculated by the least-squares method as in Equations (19, 20). We used the entropy H(FI) of each feature index for further classification, which calculates the amount of uncertainty of a random variable. It is defined as follows:
2.3.5. Statistical Analysis
Data were analyzed using MATLAB software. We adopted a linear discriminant analysis (LDA) algorithm to classify the HIFU patient into two types: effective and ineffective treatment. The classification ability of both the ADT and HSI methods to detect whether the HIFU treatment was from a patient with effective treatment (group 1) or ineffective treatment (group 2) were evaluated using leave-one-out cross-validation to reduce the probability of a type 1 error (false positive). The statistical significance of any observed difference was analyzed by the Hotelling T2-test. Statistical significance was defined as P < 0.05.
3. Results
3.1. Clinical Evaluation for 20 HIFU Patients
A total of 20 patients with a 100% follow-up rate were followed up for 3 months. Complete data on the clinical therapeutic effects in all patients were obtained and are shown in Table 2: group 1 comprised 16 HIFU patients with effective HIFU treatment, and group 2 comprised 4 HIFU patients with ineffective HIFU treatment.
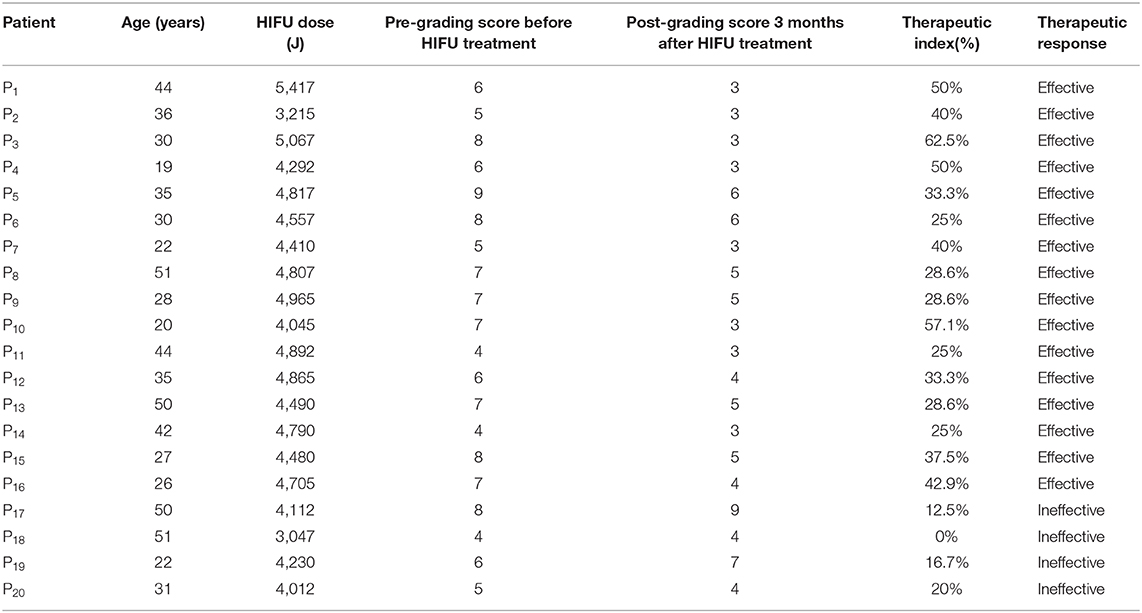
Table 2. Clinical grading results of HIFU treatment.
3.1.1. Thermal Time Constant τ Between Effective and Ineffective HIFU Treatment Groups
The statistical results of thermal time constant τ are presented in Figure 7C. , defined as τ measured before HIFU treatment in effective treatment group (group 1) showed statistical difference (P < 0.05) compared with τEffective measured immediately after HIFU treatment in group 1. However, for the ineffective treatment group (group 2), and τIneffective did not show statistical difference (P > 0.1).
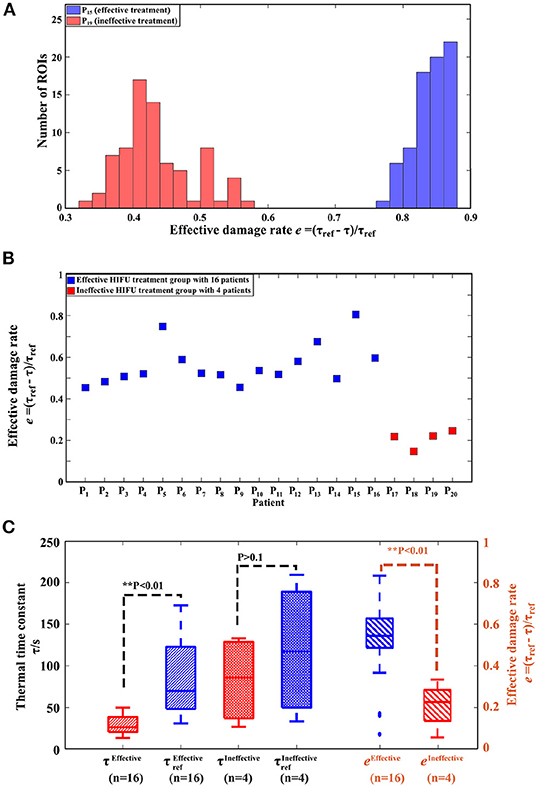
Figure 7. Results of the ADT method. (A) Histogram of effective damage rate e from one patient (P15) with effective treatment and one patient (P19) with ineffective treatment. (B) Effective damage rate e of all patients. (C) Boxplot of the thermal time constant τ, τref and effective damage rate e from the effective treatment group with 16 patients and the ineffective treatment group with 4 patients. Note: τref is the thermal time constant of the treatment area measured before HIFU treatment, while τ of the same area is measured immediately after HIFU treatment.
3.1.2. Effective Damage Rate e Between Effective and Ineffective HIFU Treatment Groups
Figure 7A show histograms of e between an effective HIFU patient P19 and an ineffective HIFU patient P15. Here, we used e values less than a 3σ lower limit to calculate the average e. The average e of effective treatments was significantly higher than that of ineffective treatment groups in Figures 7B,C (P < 0.05).
3.2. Hyperspectral Imaging (HSI) for 20 HIFU Patients
3.2.1. Reflectance Absorption Spectra Between Effective and Ineffective HIFU Treatment Groups
Figure 8 shows the hyperspectral results of one effective HIFU treatment patient P15 and one ineffective HIFU treatment patient P19. Figure 8A shows an RGB image of P15 captured by colposcopy and the corresponding hyperspectral image at a single wavelength of 550 nm before HIFU treatment. Figure 8B shows an RGB image of P15 captured by colposcopy and the corresponding hyperspectral image at a single wavelength of 550 nm immediately after HIFU treatment. Figure 8D shows an RGB image of P19 captured by colposcopy and the corresponding hyperspectral image at a single wavelength of 550 nm before HIFU treatment. Figure 8E shows an RGB image of P19 captured by colposcopy and the corresponding hyperspectral image at a single wavelength of 550 nm immediately after HIFU treatment. The red cycles in Figures 8A,B,D,E were the general treatment areas marked by an experienced gynecologist. After image registration, the corresponding treatment areas were selected in every hyperspectral image from 450 to 650 nm with an interval of 2 nm, shown in Figures 8A,B,D,E. A few biases may occur between the marked ROI in colposcopy and the selected ROI in hyperspectral images. However, for VLS, the affected areas usually cover more than 80% of the whole vulva and so are not difficult to recognize. Despite the possible small differences, the ROI in the hyperspectral images has included most of the general treatment areas. In this paper, we explored the absorption spectrum of the affected labia majora. For further analysis, 6 × 10⁴ ROIs of a size of 1 × 1 pixel within the treatment areas of the labia majora of every patient were selected randomly. Figures 8C,F show the reflectance absorption curves of all selected ROIs for P15 and P19. The blue curves are averaged reflectance absorption spectra of the 6 × 10⁴ ROIs before HIFU treatment, and the red ones are averaged curves immediately after HIFU treatment. There is a new peak around 630 nm in the red curve after HIFU treatment compared with the blue one in both P15 and P19. However, the peak for P15 is more recognizable than that for P19.
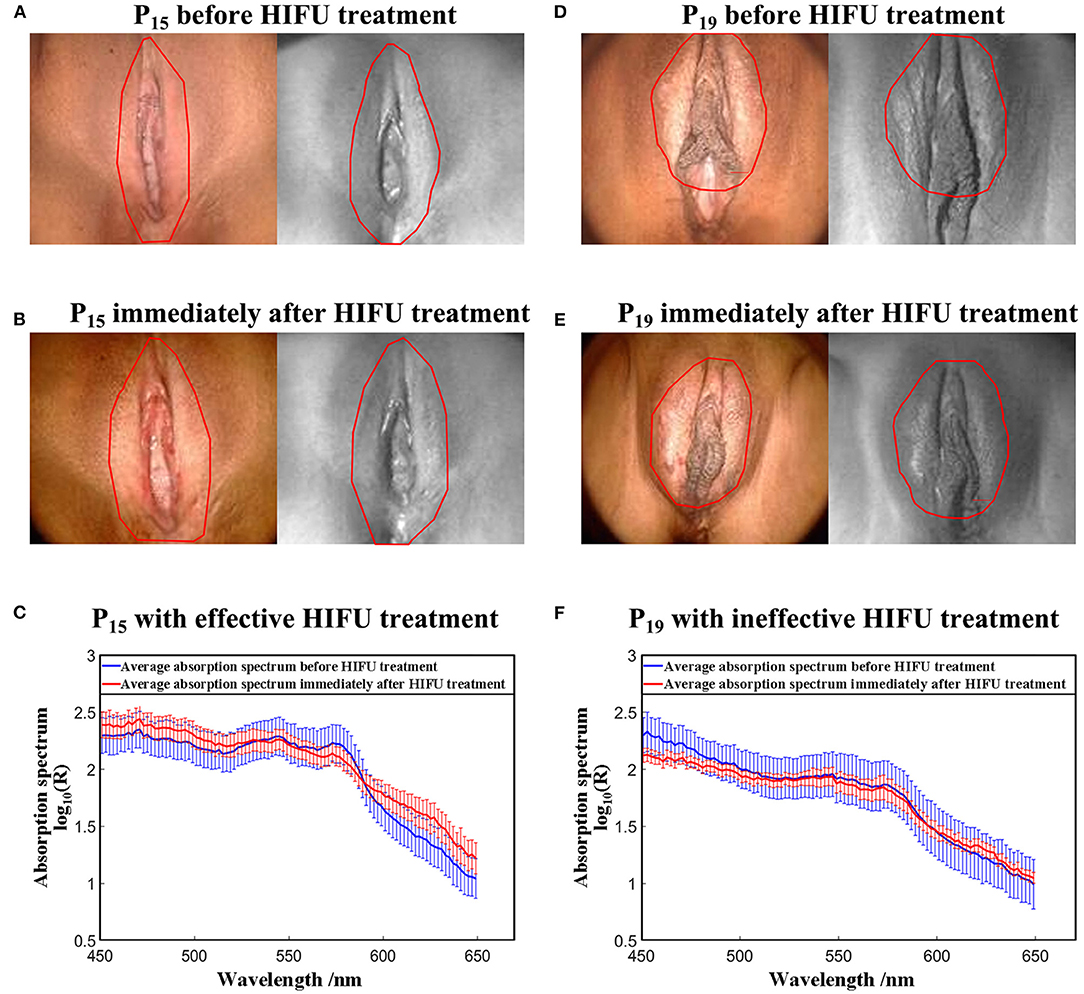
Figure 8. Results of the HSI method. (A) RGB image of P15 captured by coloscopy and the corresponding hyperspectral image at a single wavelength of 550 nm before HIFU treatment. (B) RGB image of P15 captured by coloscopy and the corresponding hyperspectral image at a single wavelength of 550 nm immediately after HIFU treatment. (C) Average absorption spectrum from the affected areas of P15 before and immediately after HIFU treatment. (D) RGB image of P19 captured by coloscopy and the corresponding hyperspectral image at a single wavelength of 550 nm before HIFU treatment. (E) RGB image of P19 captured by coloscopy and the corresponding hyperspectral image at a single wavelength of 550 nm immediately after HIFU treatment. (F) Average absorption spectrum from the affected areas of P19 before and immediately after HIFU treatment. Note: The red outlines demarcate the general treatment areas marked by the same gynecologist.
3.2.2. Feature Index (FI) Between Effective and Ineffective HIFU Treatment Groups
The histograms of (FI1, FI2, FI3) extracted from absorption spectrum curves are shown in Figure 9. The blue histograms in Figures 9A–F are for (FI1, FI2, FI3) before HIFU treatment, and the red ones represent the results immediately after HIFU treatment. The histogram of each index from P15 immediately after HIFU treatment became wider than the histogram before the treatment and compared with P19.
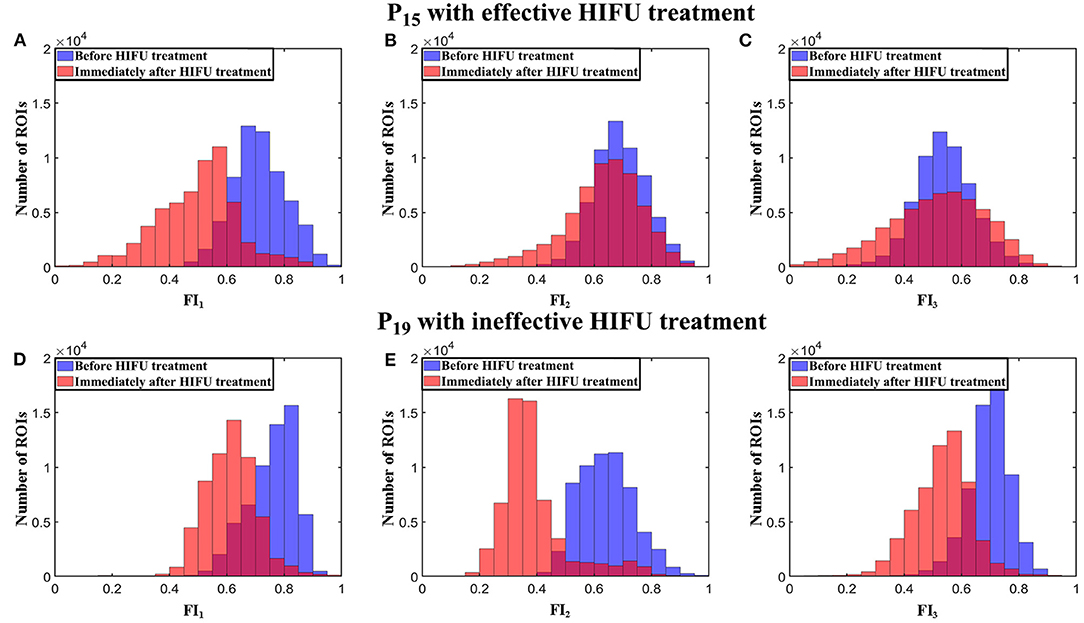
Figure 9. Histograms of (FI1, FI2, FI3) from P15 and P19 before and immediately after HIFU treatment. (A-C) (FI1, FI2, FI3) from P15. (D-F) (FI1, FI2, FI3) from P19.
3.2.3. Entropy H(FI) Between Effective and Ineffective HIFU Treatment Groups
For additional analysis of the histograms, we calculated the entropy H(FI) of the index histogram of each feature as H(FI1), H(FI2), and H(FI3). Figure 10 presents box plots of [H(FI1), H(FI2), H(FI3)] of all 20 HIFU patients before and immediately after HIFU treatment. The effective group was significantly different from the ineffective group after HIFU treatment (P < 0.05), while the two groups did not show significant difference before HIFU treatment (P > 0.1).
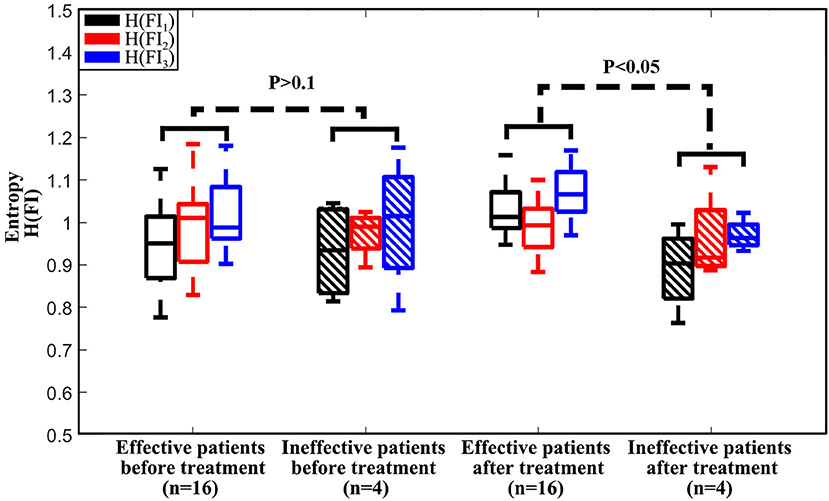
Figure 10. Boxplot of (H(FI1), H(FI2), H(FI3)) from the effective treatment group with 16 patients and the ineffective treatment group with 4 patients before and immediately after HIFU treatment.
3.3. Therapeutic Assessment for 20 HIFU Patients by the ADT and HSI Methods
We used a leave-one-out LDA model to evaluate the performance of both the average e and [H(FI1), H(FI2), H(FI3)] of all 20 patients for therapeutic assessment of HIFU treatment. The results were very promising, with a high sensitivity of 100% and specificity of 100% for the ADT method and of 75% and 87.5%, respectively, for the HSI method.
4. Discussion
During HIFU treatment for VLS, the ultrasound beams are focused on the target about 4–6 mm under the skin. The vulvar skin can be easily damaged by this exposure. The main possible side effects due to exposure may be superficial local skin burns and superficial ulcers [16]. However, the estimation of damage is difficult because it requires subjective inspection by skillful physicians. Excessive thermal damage of tissue leads to tissue charring. Insufficient heat will lead to an increased risk of recurrence of VLS. During the HIFU treatment process, vulvar tissues undergo both microscopic and macroscopic changes in their structures and physiological properties. Monitoring such changes would be a direct means of estimating the extent of thermal damage. Thus, an objective index of skin properties is needed. Numerous factors (such as surface temperature and reflectance) are used to evaluate skin properties. In this study, we focus on both the absorption reflection and thermal time constant τ of affected vulvar skin for therapeutic assessment of HIFU for VLS.
For the ineffective treatment group, , defined as τ measured before HIFU treatment, showed no statistical difference (P > 0.1) from τIneffective, measured immediately after HIFU treatment. However, for the effective treatment group, τEffective decreased to a statistically different level (P < 0.05), compared with . These results indicated that different HIFU treatments led to a different extents of thermal damage for each patient, resulting in a distinct change in thermal properties.
Thus, we proposed a new parameter, effective damage rate e (as in Equation 16), to quantify the degree of thermal damage for each HIFU treatment. The histogram of e from an effectively treated patient was separated from that of an ineffectively treated patient, shown in Figure 7A. However, it was improper to use the average e of the whole histogram to represent each HIFU treatment for effectiveness classification, because ineffective treatment of a patient does not imply that all treated skin areas undergo insufficient HIFU treatment. In the ineffective case where 60–70% of the infected areas were treated effectively, the direct average e could also be large, which would be difficult to be distinguished from effective treatment. A better criterion is to use e from the relatively less-treated area instead of the whole treated area. Considering this, we took the average of e values smaller than a 3σ lower limit to represent the lower bound of the degree of thermal damage for each treatment so that the bias introduced by the areas with effective treatment in an ineffective treatment could be reduced. The effective treatment group had a larger average e than the ineffective treatment group at a statistically different level (P < 0.05), which showed that the index was positively related to the degree of thermal damage and could be used for therapy effectiveness classification.
Before HIFU treatment, the reflectance absorption spectra of the effective treatment group and the ineffective treatment group were similar. However, immediately after HIFU treatment, there was a new peak around 630 nm for both the effective treatment group and the ineffective treatment group, which did not appear in the absorption curves before treatment. The shoulder around the 630 nm region of absorption spectrum curves is specific to methemoglobin (mHb). The hemoglobin absorbance demonstrates a characteristic change following heat exposure. This change is partly due to oxidative reactions, with the formation of met-hemoglobin, and also by protein denaturation [55, 56], which may help in the study of the unclear etiology of VLS. In the HSI method, we used incident light in the visible wavelength range of 450–650 nm where melanin and different types of hemoglobin are dominant absorbers [44–48]. After comparing the reflectance spectra of the effective treatment group and the ineffective treatment group, we found that the primary spectral differences between these groups occur at the peak wavelength of oxy-hemoglobin (HbO2), deoxy-hemoglobin (Hb), and methemoglobin (mHb). In order to simplify the analysis and highlight the spectral characteristics of effective treatment, we carried out absorption analysis in a human skin model with the assumption that HIFU-induced changes in scattering and other chromophores are secondary. We used (H1, H2, H3) extracted from the absorption curves to quantify the difference between an effective group and an ineffective group. There was no statistical difference in [H(FI1), H(FI2), H(FI3)] between the two groups before treatment (P > 0.1), which indicated that there was no significant difference in the optical properties of the enrolled 20 patients before HIFU treatment. However, they were significantly different after HIFU treatment (P < 0.05). Thus, the absorption properties of patients were changed differently by HIFU treatment, which can be utilized for treatment efficacy evaluation.
In our manuscript, a leave-one-out LDA model was used for classification, which is a relatively simple method for classifying both the ADT and HSI images and comparing the two imaging approaches quantitatively. Besides the LDA method, we have also tried SVM, K-means, and SAM for image classification with accuracies of 80, 100, and 80% for ADT and 80, 80, and 65% for his, respectively, which did not show better performance than LDA (100% for ADT and 85% for HSI). This lower performance is partially due to the unbalanced and relatively small dataset, which is suboptimal for implementing these machine learning methods. In order to enable those methods to be used, more data is necessary for future study and better classification performance.
Though the preliminary results are very encouraging, with a sensitivity of 100% and specificity of 100% for the ADT method and 75 and 87.5% for the HSI method, this study has several limitations. First, the sample size is small, and there is a lack of other vulvar diseases apart from VLS with HIFU treatment for comparison. Due to the limitation of sample size, the relatively high sensitivity and specificity results can only reveal the feasibility of the ADT and HSI methods for therapeutic assessment of HIFU treatment for VLS. More subjects will be recruited so that the sample size will be increased for further validation of their clinical performance in the future. Secondly, in the HSI method, we only used the visible range for measurement. A broader wavelength range, such as 400–1,000 nm, may provide more spectral information for improved assessment of therapeutic effect. The current wavelength range is limited by the hyperspectral imager used, which has a detection range from 400 to 700 nm. Considering that ADT is able to capture the thermal effect that plays a prominent role in the possible bioeffects and that visible light spectroscopy has been used for burning and wound assessment similar to HIFU-induced skin changes [31–33], our spectral measurements only cover the visible wavelength range. Since the classification outcome of the HSI method in the visible wavelength range is not optimal, we will carry out HSI data acquisition in a broader wavelength range to provide a fair comparison between the HSI and ADT methods in the future study. Thirdly, we chose one-time acquisition of post-treatment assessment data for 10 min instead of continuous monitoring of the treatment outcome. The current clinical practice of HIFU outcome assessment in VLS patients is subjective and cannot be carried out until 3 months post treatment. We propose to predict the therapeutic outcome by ADT and HSI evaluation of HIFU-induced tissue alternations and by establishing the correlation between these tissue alternations and the actual clinical outcome. Since the primary focus of this study is to predict the long-term outcome of HIFU therapy through post-treatment image analysis, we did not monitor the tissue changes over time. In the future, we may consider continuously monitoring the therapeutic responses over the course of a long recovery time in order to provide precise guidance for the treatment plan. Finally, the follow-up time was 3 months. Only the short-term efficacy of HIFU treatment for VLS was assessed. More studies with a larger sample size of HIFU treatment for different types of vulvar diseases and longer observation time are necessary to evaluate its long-term effects.
5. Conclusions
In this study, we focused on the use of two individual objective and non-invasive optical approaches, the ADT and HSI methods, to evaluate the therapeutic response to HIFU treatment in VLS, which can help identify patients with ineffective treatment promptly and prevent delay of re-treatment. Both the ADT and HSI modalities were used for HIFU outcome assessment because they provide complementary information closely relevant to the bioeffects of the therapy. On the one hand, ADT reveals the change of tissue thermal properties in response to HIFU. On the other hand, HSI reveals the tissue edema and perfusion properties relevant to HIFU-induced injury. Combinatory use of these two aspects of tissue properties may yield greater accuracy in the prediction of long-term therapeutic outcome. We are the first to study the technical feasibility of dual-modal ADT and HSI assessment of HIFU treatment in a small population of VLS patients. A large population of patients will be needed in future study in order to provide more effective evaluation of the proposed HIFU assessment technique with both accuracy and statistic power.
Data Availability Statement
The datasets generated for this study are available on request to the corresponding author.
Ethics Statement
The studies involving human participants were reviewed and approved by The Institutional Review Board (IRB) of the Second Affiliated Hospital of Chongqing Medical University (IRB No: 2018KLS092) on the date of 12/07/2018. The patients/participants provided their written informed consent to participate in this study.
Consent for Publication
Written informed consent was obtained from the from the individuals for the publication of any potentially identifiable images or data included in this article.
Author Contributions
Experiment design, data acquisition, and analysis, drafting of the manuscript, and final approval of the version to be published were carried out by YQ, YM, and SF. Data acquisition, final approval of the version to be published were contributed by ML, LX, XZ, and JZ. RX and SC were responsible for the initial concept and final review of the manuscript. YQ, YM, and SF are co-first authors.
Funding
The study was partially supported by the Natural Science Foundation of China (Nos. 81271527 and 81327803), the Fundamental Research Funds for the Central Universities (WK2090090013), and Chongqing Health and Family Planning Committee (2015ZDXM010).
Conflict of Interest
The authors declare that the research was conducted in the absence of any commercial or financial relationships that could be construed as a potential conflict of interest.
Acknowledgments
The authors thank the women who participated in the study and the clinicians who helped in the examinations.
References
1. Rodke G, Friedrich JE, Wilkinson E. Malignant potential of mixed vulvar dystrophy (lichen sclerosus associated with squamous cell hyperplasia). J Reprod Med. (1988) 33:545–50.
2. Krapf JM, Goldstein AT. Vulvar dermatoses: diagnosis, management, and impact on sexual function. Curr Sex Health Rep. (2016) 8:222–30. doi: 10.1007/s11930-016-0090-1
3. Bleeker MC, Visser PJ, Overbeek LI, van Beurden M, Berkhof J. Lichen sclerosus: incidence and risk of vulvar squamous cell carcinoma. Cancer Epidemiol Prevent Biomark. (2016) 25:1224–30. doi: 10.1158/1055-9965.EPI-16-0019
4. Krapf JM, Mitchell L, Holton MA, Goldstein AT. Vulvar lichen sclerosus: current perspectives. Int J Womens Health. (2020) 12:11. doi: 10.2147/IJWH.S191200
5. Maclean AB. Vulval cancer: prevention and screening. Best Pract Res Clin Obstetr Gynaecol. (2006) 20:379–95. doi: 10.1016/j.bpobgyn.2005.11.001
6. Jensen LS, Bygum A. Childhood lichen sclerosus is a rare but important diagnosis. Dan Med J. (2012) 59:A4424.
7. Zorlu C, Cobanoglu O. Medical treatment of squamous hyperplasia and lichen sclerosus of the vulva. Int J Gynecol Obstetr. (1995) 51:235–8. doi: 10.1016/0020-7292(95)80012-3
8. Lorenz B, Kaufman R, Kutzner S. Lichen sclerosus. Therapy with clobetasol propionate. J Reprod Med. (1998) 43:790–4.
9. Chi C, Kirtschig G, Baldo M, Brackenbury F, Lewis F, Wojnarowska F. Topical interventions for genital lichen sclerosus. Cochrane Database Syst Rev. (2011) 2011:CD008240. doi: 10.1002/14651858.CD008240.pub2
10. Renaud-Vilmer C, Cavelier-Balloy B, Porcher R, Dubertret L. Vulvar lichen sclerosus: effect of long-term topical application of a potent steroid on the course of the disease. Arch Dermatol. (2004) 140:709–12. doi: 10.1001/archderm.140.6.709
11. Smith YR, Haefner HK. Vulvar lichen sclerosus. Am J Clin Dermatol. (2004) 5:105–25. doi: 10.2165/00128071-200405020-00005
12. Li C, Bian D, Chen W, Zhao C, Yin N, Wang Z. Focused ultrasound therapy of vulvar dystrophies: a feasibility study. Obstetr Gynecology. (2004) 104:915–21. doi: 10.1097/01.AOG.0000139835.34168.b0
13. Zhou YF. High intensity focused ultrasound in clinical tumor ablation. World J Clin Oncol. (2011) 2:8. doi: 10.5306/wjco.v2.i1.8
14. Wu C, Zou M, Xiong Y, Wang L, Chen H, Fan Y, et al. Short- and long-term efficacy of focused ultrasound therapy for non-neoplastic epithelial disorders of the vulva. BJOG Int J Obstetr Gynaecol. (2017) 124:87–92. doi: 10.1111/1471-0528.14747
15. Ye M, Deng X, Mao S, Xue M. High intensity focused ultrasound treatment for non-neoplastic epithelial disorders of the vulva: factors affecting effectiveness and recurrence. Int J Hyperther. (2015) 31:771–6. doi: 10.3109/02656736.2015.1053101
16. Ruan L, Xie Z, Wang H, Jiang J, Shi H, Xu J. High-intensity focused ultrasound treatment for non-neoplastic epithelial disorders of the vulva. Int J Gynecol Obstetr. (2010) 109:167–70. doi: 10.1016/j.ijgo.2009.12.014
17. Kim Ys, Rhim H, Choi MJ, Lim HK, Choi D. High-intensity focused ultrasound therapy: an overview for radiologists. Korean J Radiol. (2008) 9:291–302. doi: 10.3348/kjr.2008.9.4.291
18. Orsi F, Arnone P, Chen W, Zhang L. High intensity focused ultrasound ablation: a new therapeutic option for solid tumors. J Cancer Res Therapeut. (2010) 6:414. doi: 10.4103/0973-1482.77064
19. Hsiao YH, Kuo SJ, Tsai HD, Chou MC, Yeh GP. Clinical application of high-intensity focused ultrasound in cancer therapy. J Cancer. (2016) 7:225. doi: 10.7150/jca.13906
20. Cattaneo A, Bracco G, Maestrini G, Carli P, Taddei G, Colafranceschi M, et al. Lichen sclerosus and squamous hyperplasia of the vulva. A clinical study of medical treatment. J Reprod Med. (1991) 36:301–5.
21. Carlson JA, Lamb P, Malfetano J, Ambros RA, Mihm JM. Clinicopathologic comparison of vulvar and extragenital lichen sclerosus: histologic variants, evolving lesions, and etiology of 141 cases. Modern Pathol. (1998) 11:844–54.
22. Clark T, Etherington I, Luesley D. Response of vulvar lichen sclerosus and squamous cell hyperplasia to graduated topical steroids. J Reprod Med. (1999) 44:958–62.
23. ter Haar G, Coussios C. High intensity focused ultrasound: physical principles and devices. Int J Hyperther. (2007) 23:89–104. doi: 10.1080/02656730601186138
24. Banerjee RK, Dasgupta S. Characterization methods of high-intensity focused ultrasound-induced thermal field. Adv Heat Transf . (2010) 42:137–77. doi: 10.1016/S0065-2717(10)42002-X
25. Shehata IA. Treatment with high intensity focused ultrasound: secrets revealed. Eur J Radiol. (2012) 81:534–41. doi: 10.1016/j.ejrad.2011.01.047
26. Wang Z, Bai J, Li F, Du Y, Wen S, Hu K, et al. Study of a “biological focal regio” of high-intensity focused ultrasound. Ultrasound Med Biol. (2003) 29:749–54. doi: 10.1016/S0301-5629(02)00785-8
27. Renkielska A, Nowakowski A, Kaczmarek M, Ruminski J. Burn depths evaluation based on active dynamic IR thermal imaging–a preliminarystudy. Burns. (2006) 32:867–75. doi: 10.1016/j.burns.2006.01.024
28. Kaczmarek M, Nowakowski A. Active IR-thermal imaging in medicine. J Nondestruct Eval. (2016) 35:19. doi: 10.1007/s10921-016-0335-y
29. Jaspers ME, Carriare M, Meij-de Vries A, Klaessens J, van Zuijlen P. The FLIR ONE thermal imager for the assessment of burn wounds: reliability and validity study. Burns. (2017) 43:1516–523. doi: 10.1016/j.burns.2017.04.006
30. Keenan E, Gethin G, Flynn L, Watterson D, O'Connor GM. Enhanced thermal imaging of wound tissue for better clinical decision making. Physiol Meas. (2017) 38:1104. doi: 10.1088/1361-6579/aa6ea0
31. Calin MA, Parasca SV, Savastru R, Manea D. Characterization of burns using hyperspectral imaging technique-a preliminary study. Burns. (2015) 41:118–24. doi: 10.1016/j.burns.2014.05.002
32. Clancy NT, Gurusamy K, Jones G, Davidson B, Clarkson MJ, Hawkes DJ, et al. Spectral imaging of thermal damage induced during microwave ablation in the liver. In: 40th Annual International Conference of the IEEE Engineering in Medicine and Biology Society (EMBC). Honolulu, HI: IEEE (2018). p. 3001–4. doi: 10.1109/EMBC.2018.8512901
33. Wang P, Cao Y, Yin M, Li Y, Lv S, Huang L, et al. Full-field burn depth detection based on near-infrared hyperspectral imaging and ensemble regression. Rev Sci Instrum. (2019) 90:064103. doi: 10.1063/1.5034503
34. Raymond JL, Cleveland RO, Roy RA. HIFU-induced changes in optical scattering and absorption of tissue over nine orders of thermal dose. Phys Med Biol. (2018) 63:245001. doi: 10.1088/1361-6560/aaed69
35. Song C, Marshall B, McLean D, Frank T, Cuschieri A, Campbell P, et al. Thermographic investigation of the heating effect of high intensity focused ultrasound. In: 2005 IEEE Engineering in Medicine and Biology 27th Annual Conference. IEEE (2006). p. 3456–8. doi: 10.1109/IEMBS.2005.1617222
36. Ahmed SE, Moussa HG, Martins AM, Abbas Y, Al-Sayah MH, Husseini GA. Factors affecting the acoustic in vitro release of calcein from PEGylated liposomes. J Nanosci Nanotechnol. (2019) 19:6899–906. doi: 10.1166/jnn.2019.16646
37. en T, Tüfekçiolu O, Koza Y. Mechanical index. Anatol J Cardiol. (2015) 15:334. doi: 10.5152/akd.2015.6061
38. Kollmann C, Ter Haar G, Dolezal L, Hennerici M, Salvesen K, Valentin L. Ultrasound output: thermal (TI) and mechanical (MI) indices. Ultraschall in der Medizin. (2013) 34:422–34. doi: 10.1055/s-0033-1335843
39. Medicine AIoUi. Acoustic output measurement and labeling standard for diagnostic ultrasound equipment. (1992).
40. Henriques F Jr. Studies of themal injury, V. The predictability and significance of thermally induced rate processes leading to irreversible epidermal injury. Arch Pathol. (1947) 43:489–502.
41. Pennes HH. Analysis of tissue and arterial blood temperatures in the resting human forearm. J Appl Physiol. (1948) 1:93–122. doi: 10.1152/jappl.1948.1.2.93
42. Buettner K. Effects of extreme heat and cold on human skin. I. Analysis of temperature changes caused by different kinds of heat application. J Appl Physiol. (1951) 3:691–702. doi: 10.1152/jappl.1951.3.12.691
43. Buettner K. Effects of extreme heat and cold on human skin. II. Surface temperature, pain and heat conductivity in experiments with radiant heat. J Appl Physiol. (1951) 3:703–13. doi: 10.1152/jappl.1951.3.12.703
44. Vasefi F, MacKinnon N, Farkas D. Hyperspectral and multispectral imaging in dermatology. In: Hamblin MR, Avci P, Gupta GK, editors. Imaging in Dermatology. Boston, MA: Elsevier (2016). p. 187–201. doi: 10.1016/B978-0-12-802838-4.00016-9
45. Jakovels D, Spigulis J. 2-D mapping of skin chromophores in the spectral range 500-700 nm. J Biophoton. (2010). 3:125–9. doi: 10.1002/jbio.200910069
46. Chen X, Lin W, Wang C, Chen S, Sheng J, Zeng B, et al. In vivo real-time imaging of cutaneous hemoglobin concentration, oxygen saturation, scattering properties, melanin content, and epidermal thickness with visible spatially modulated light. Biomed Optics Express. (2017) 8:5468–82. doi: 10.1364/BOE.8.005468
47. Tseng SH, Bargo P, Durkin A, Kollias N. Chromophore concentrations, absorption and scattering properties of human skin in-vivo. Optics Express. (2009) 17:14599–617. doi: 10.1364/OE.17.014599
48. He Q, Wang RK. Analysis of skin morphological features and real-time monitoring using snapshot hyperspectral imaging. Biomed Optics Express. (2019) 10:5625–38. doi: 10.1364/BOE.10.005625
49. Zonios G, Bykowski J, Kollias N. Skin melanin, hemoglobin, and light scattering properties can be quantitatively assessed in vivo using diffuse reflectance spectroscopy. J Investig Dermatol. (2001) 117:1452–7. doi: 10.1046/j.0022-202x.2001.01577.x
50. Shimada M, Yamada Y, Itoh M, Yatagai T. Melanin and blood concentration in a human skin model studied by multiple regression analysis: assessment by Monte Carlo simulation. Phys Med Biol. (2001) 46:2397. doi: 10.1088/0031-9155/46/9/309
51. Zheng W, Wang C, Chang S, Zhang S, Xu RX. Hyperspectral wide gap second derivative analysis for in vivo detection of cervical intraepithelial neoplasia. J Biomed Optics. (2015) 20:121303. doi: 10.1117/1.JBO.20.12.121303
52. Wang C, Zheng W, Bu Y, Chang S, Zhang S, Xu RX. Multi-scale hyperspectral imaging of cervical neoplasia. Arch Gynecol Obstetr. (2016) 293:1309–17. doi: 10.1007/s00404-015-3906-8
53. Lowe DG. Distinctive image features from scale-invariant keypoints. Int J Comput Vis. (2004) 60:91–110. doi: 10.1023/B:VISI.0000029664.99615.94
54. Abdlaty R, Sahli S, Hayward J, Fang Q. Hyperspectral imaging: comparison of acousto-optic and liquid crystal tunable filters. In: Medical Imaging 2018: Physics of Medical Imaging. Vol. 10573. Houston, TX: International Society for Optics Photonics (2018). p. 105732P. doi: 10.1117/12.2282532
55. Randeberg L, Bonesrnning J, Dalaker M, Nelson J, Svaasand L. Methemoglobin formation during laser induced photothermolysis of vascular skin lesions. Lasers Surg Med. (2004) 34:414. doi: 10.1002/lsm.20042
Keywords: vulvar lichen sclerosus, focused ultrasound, therapeutic assessment, ADT, hyperspectral imaging
Citation: Qu Y, Meng Y, Feng S, Liu M, Xiao L, Zhang X, Zheng J, Chang S and Xu RX (2020) Therapeutic Assessment of High-Intensity Focused Ultrasound for Vulvar Lichen Sclerosus by Active Dynamic Thermal Imaging and Hyperspectral Imaging—A Preliminary Study. Front. Phys. 8:91. doi: 10.3389/fphy.2020.00091
Received: 25 December 2019; Accepted: 12 March 2020;
Published: 30 April 2020.
Edited by:
Jun Xia, University at Buffalo, United StatesCopyright © 2020 Qu, Meng, Feng, Liu, Xiao, Zhang, Zheng, Chang and Xu. This is an open-access article distributed under the terms of the Creative Commons Attribution License (CC BY). The use, distribution or reproduction in other forums is permitted, provided the original author(s) and the copyright owner(s) are credited and that the original publication in this journal is cited, in accordance with accepted academic practice. No use, distribution or reproduction is permitted which does not comply with these terms.
*Correspondence: Shufang Chang, c2hmY2gyMDA1QDE2My5jb20=; Ronald X. Xu, eHUucm9uYWxkQGhvdG1haWwuY29t