 Xinglan Fu
94% of researchers rate our articles as excellent or good
Learn more about the work of our research integrity team to safeguard the quality of each article we publish.
Find out more
REVIEW article
Front. Phys. , 31 March 2020
Sec. Optics and Photonics
Volume 8 - 2020 | https://doi.org/10.3389/fphy.2020.00068
This article is part of the Research Topic State-of-the-Art Laser Spectroscopy and its Applications View all 9 articles
Laser-induced breakdown spectroscopy (LIBS) is fast, on-line, causes little sample damage, and can be applied in remote field locations. In recent years, LIBS has been widely used in many fields of scientific research for element detection. Further application of LIBS is limited by the strong matrix effect, poor repeatability, and relatively weak detection sensitivity. The detection sensitivity is an important factor and needs to be improved for LIBS detection of minor or trace elements in samples. A variety of methods have been developed to improve detection sensitivity of LIBS. In this invited review paper, we discuss improvements in the LIBS detection sensitivity achieved with physical enhancement methods, chemical enhancement methods, mathematical methods, and combinations of multiple methods. We discuss the enhancement mechanisms, sensitivity improvements, configurations, and effects of key factors for various methods. The advantages, disadvantages, and real-time capabilities of these methods are reviewed. Finally, new trends and future perspectives for LIBS as an efficient analytical tool are discussed.
Laser-induced breakdown spectroscopy (LIBS) is an effective technique for rapid elemental analysis. Quantitative and qualitative results are obtained from the emission spectra of various elements using plasma generated by laser ablation of the sample [1]. LIBS is increasingly used in multifarious on-site inspections, such as nuclear waste detection [2], molten steel analysis [3–5], and examination of fruit pesticide residues [6], heritage [7], environment [8], biology [9], and agriculture [10]. In addition to solid samples, LIBS can be used with liquids [11], gases [12, 13], and aerosols [14] because it is flexible, fast, and causes little damage to samples [15]. Because of these characteristics, the application range of LIBS has continued to expand.
Further application of LIBS is limited by a strong matrix effect, poor repeatability, and relatively weak sensitivity [16]. The elimination of matrix effect and improvement of repeatability have been investigated in many studies [17–23]. However, the sensitivity still restricts the application of LIBS in both qualitative and quantitative analyses. Compared with X-ray fluorescence, the limit of detection (LOD) of LIBS is usually approximately an order of magnitude higher [24]. For detection of elements in most solids, the LOD of LIBS is 1–100 parts per million [25], which cannot meet the demands for detection of many trace substances.
To improve the sensitivity, a variety of methods have been developed. Some of these methods improve the LIBS signal intensity by changing the LIBS setup, such as adding a second laser pulse for secondary heating of the plasma [26–30]. In other methods, the sensitivity is improved by chemical treatment of the sample, such as chemical replacement to preconcentrate the element of interest in the sample [31–34]. Furthermore, mathematical methods, such as multivariate analysis instead of univariate analysis [35, 36], can be used to improve the sensitivity of the predictive model.
This review presents a brief overview of recent methods used for improving the LIBS detection sensitivity. We discuss the advantages and disadvantages of these methods in consideration of the sensitivity improvement, simplicity, and real-time capability. This paper provides a reference for rational use of these methods.
Conventional LIBS uses a strong laser to break down a sample into plasma. However, the detection sensitivity is poor. A double-pulse LIBS (DP-LIBS) method has been proposed to improve the sensitivity of LIBS. There are several possible mechanisms could explain the signal enhancement of DP-LIBS, such as pulse-plasma coupling effects, sample heating effects, and atmospheric effects [37, 38]. At the same time, the plasma temperature and electron density were increased due to the re-ablation of second laser in DP-LIBS [39]. Accordingly, the spectral intensity and the detection sensitivity were increased. Spectral intensity and LOD improvements achieved with DP-LIBS in recent years are shown in Table 1. Because the plasma lifetime is often <10 μs, which is far less than the minimum interval between two laser pulses at present, a double pulse system must use two lasers, which greatly increases the cost of the LIBS system.
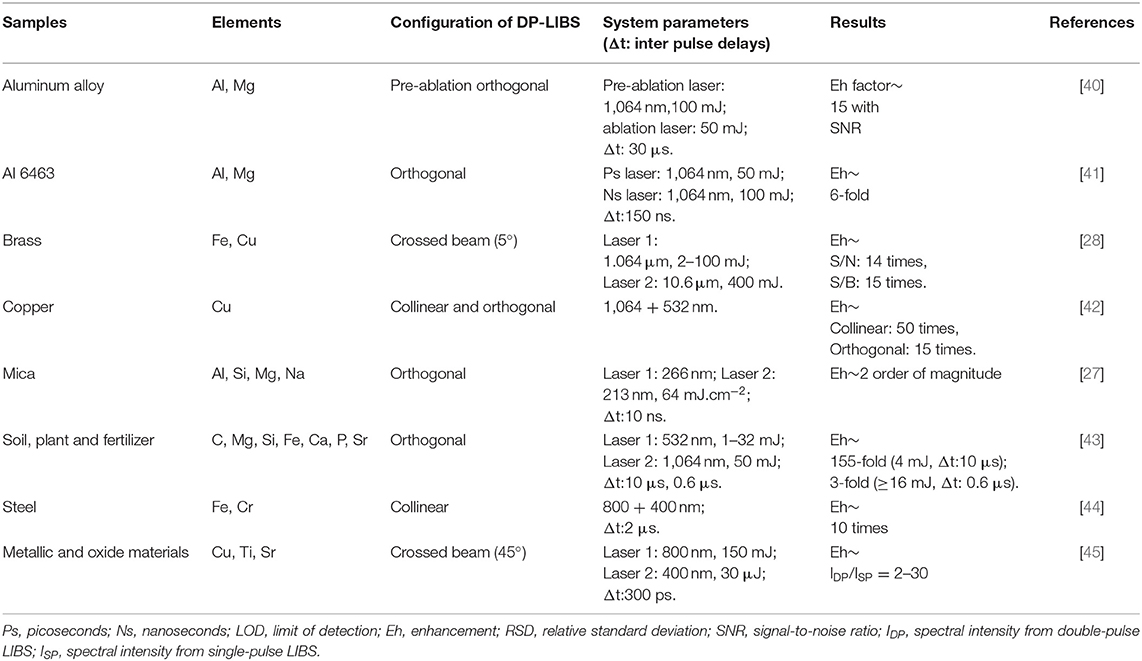
Table 1. The applied examples of DP-LIBS in recent years.
In the DP-LIBS configuration, the physical positions and angles of the two lasers greatly affect the spectral intensity. The two laser beams can be combined in collinear, orthogonal, and crossover modes. The orthogonal mode includes orthogonal preheating and orthogonal reheating [46]. Figure 1 shows a schematic diagram of several laser positions. In addition to the physical location of the laser, the laser wavelength also affects the signal enhancement. For example, Ahmed et al. [47] studied the enhancement effect of iron in orthogonal measurements using first (λ1) and second (λ2) wavelengths of λ1 = λ2 = 532, λ1 = λ2 = 1,064, and λ1 = 532 and λ2 = 1,064 nm. The enhancement factors obtained using different wavelength combinations varied and the maximum enhancement factor was 30 times.
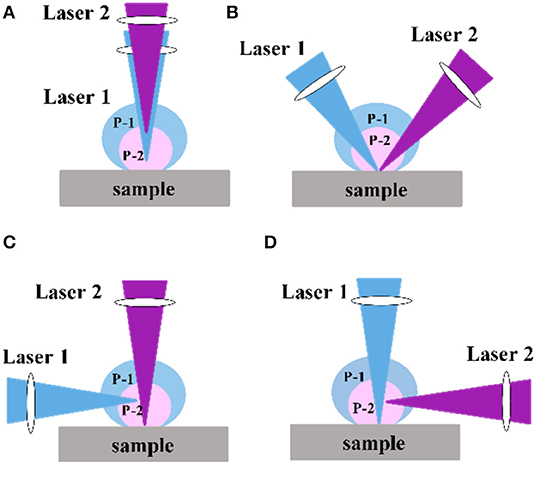
Figure 1. Various configuration of DP-LIBS: (A) collinear; (B) dual pulse crossed beam; (C) orthogonal preheating; (D) orthogonal reheating; Labels (P-1) and (P-2) indicate the plasma produced by pulse1 and pulse 2, respectively.
With the development of solid-state lasers, two fast pulses can be output by one laser, which greatly reduces the cost and complexity of DP-LIBS. For instance, some researchers have obtained a 3-fold signal enhancement with collinear dual-beam detection of lunar mimics [48]. The drawback of this method is that the two laser pulses can only work in a collinear mode and the focus position has to be consistent. Therefore, better signal enhancement can be obtained by using two lasers than one in double pulse system. For the above three modes, secondary heating of the plasma or ablation of the sample was completed using a different laser. The inter-pulse delay of the two lasers was mainly realized by a timing controller. However, Liu et al. [49] used the method for reheating plasma and adjusting the inter-pulse delay by adjusting the optical path difference. The laser output from the ordinary laser was split into two beams, and one of them was used to complete the first breakdown on the sample surface. The second beam was then focused on the sample to achieve a second breakdown after the optical path was increased for the second beam. In this way, a DP-LIBS measurement was achieved with one laser. An enhancement factors of 2–32 times was obtained for the ionic and atomic lines as compared to the single pulse LIBS.
Besides, a method of long-short DP-LIBS was proposed to improve the sensitivity of LIBS. Compared with traditional DP-LIBS, a laser with a wider pulse (μs) was used as second laser in long-short DP-LIBS. The Deguchi's team have been done deep research about long-short DP-LIBS. For example, they proposed the collinear long and short DP-LIBS to detect the solid sample. The results showed that the plasma became more stable and sustained when using a long pulse-width laser (pulse width of 60 μs) as external energy, and marked enhancement were obtained compared to single-pulse LIBS [50]. Further, the spectral signal was enhanced about 3–7 times by long-short DP-LIBS comparing to conventional SP-LIBS when detecting the standard steel samples [51]. In the subsequent study, they used long-short DP-LIBS to detect the Mn content in steel. The results showed that the R2 of calibration curve was improved from 0.810 to 0.988 using long-short DP-LIBS compared to SP-LIBS. In addition, the RSD was reduced from 29.3% (SP-LIBS) to 10.5% (long-short DP-LIBS) [52].
Furthermore, an interesting method named resonant DP-LIBS has been proposed to achieve spectral enhancement. In this case, the second laser is replaced by an optical parametric oscillator wavelength-tunable laser to reheat the plasma. When the laser wavelength is equal to an excited line of a target element, the atoms of the target element absorb laser photons and then emit strong fluorescence [53]. The spectral intensity achieved using resonant DP-LIBS is approximately 1–2 orders of magnitude higher than that with signal pulse LIBS. In one study, the resonant DP-method was used to analyze aluminum alloy and decrease the LODs of Mg and Si to 0.7 and 50 fg, respectively [54]. This method has also been used to detect TiO2 aerosols, achieving a signal enhancement of 220 times [55].
When the laser ablates the sample, the surrounding gas is ablated simultaneously to produce a plasma plume. The composition of the gas greatly affect formation and diffusion of this plasma plume. Thus, the LIBS signal can be enhanced and the detection sensitivity increased by changing the atmosphere in which the sample is placed. The enhancement method under ambient atmosphere is to use an inert gas (e.g., N2, Ar, and He). An inert gas has a lower conductivity and specific heat than air, so its breakdown threshold is low. For example, Kim et al. [56] injected argon (25 L/min) into a sample chamber to increase the signal intensities of the main elements by 2–3 times when detecting Cu(In,Ga)Se2 samples. Son et al. [57] researched the signal improvement of Al under Ar gas environment of 0.5 MPa. The results showed that the spectral intensity of Al I increased by 6 times, and the maximum spectral intensity of Al II increased by more than 12 times. Lin et al. [58] studied the enhancement effect of different atmospheres (1–80 kPa pressure, He and Ar) using femtosecond laser to detect Al. The experimental results showed that the intensity of Al I was enhanced by 4 times in Ar gas, which was higher than in air and He [59]. In addition, Jiang et al. [60] investigated the signals of steel samples at different pressures (vacuum: 10–6 mbar; N2: 1.0 mbar and 0.3 mbar; Ar: 2.1 and 1.5 mbar; He: 25 and 28 mbar). The LODs of C in N2, Ar, He, and vacuum were 2.9, 3.6, 5.7, and 13.6 ppm, respectively. And the LODs of S were 1.5 ppm (N2), 2.4 ppm (Ar), 3.4 ppm (He), and 8.9 ppm (vacuum), respectively. However, because the gas protection enhancement method often requires a closed air chamber based on the traditional LIBS structure, as shown in Figure 2, this method increases the complexity and cost of the system hardware.
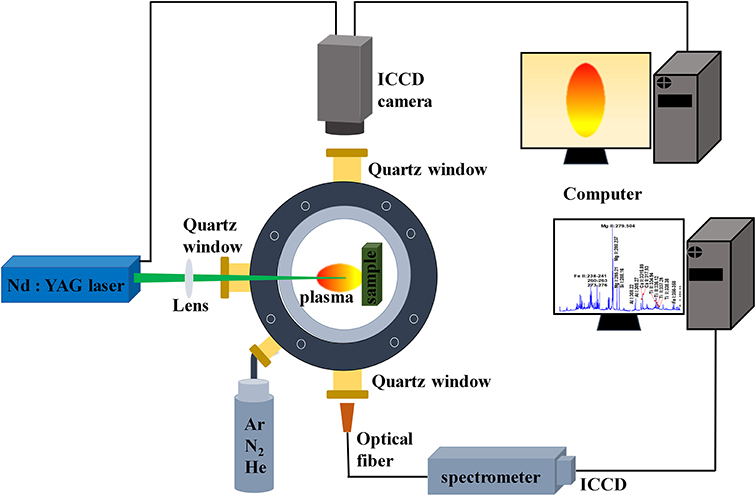
Figure 2. An example of the structure of a closed air chamber.
In addition to modification of the LIBS hardware and control of the ambient atmosphere, external field assistance can also be used as a physical enhancement method to improve the sensitivity of LIBS detection. Spatial constraint is one external field assistance method. A spatial constraint device can be added on the periphery of the sample to achieve spectral enhancement. Then, a shockwave can be generated after the generation and expansion of the laser-induced plasma in air. The shockwave will be reflected back when it encounters obstacles such as a plate wall or a cylindrical wall and will compress the plasma plume during expansion [61]. Therefore, a higher plasma temperature and electron density, and a stronger spectral signal will be obtained. Figure 3 shows a morphological comparison of plasma with and without constraint devices. It can be seen from the Figure 3 that the shockwave is reflected back to the center of the plasma under the effect of spatial constraint device. On the contrary, when there is no spatial constraint device, the shockwave expands around.
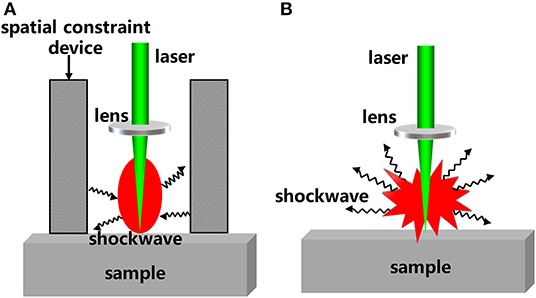
Figure 3. The morphological comparison of plasmas (A) with restraint device; (B) without restraint device.
Spatial constraint is a very simple method to improve the sensitivity of LIBS and requires no or little modification of the LIBS system. Common spatial constraint devices forms are the parallel plate, hemispherical, cylindrical, and rectangular cavity. Currently, the hemispherical form is considered to provide the best enhancement effect. A hemispherical device with a circular hole on the top as a channel for laser pulse focusing could be designed to allow for reflection and confinement of the expansion shockwave on the inner surface of device, which would achieve signal enhancement. The main parameters that affect a spatial constraint device are the hemisphere diameter, hole diameter, and thickness of the hemisphere wall. The enhancement effects of hemispheres with diameters of 4, 5, 6, and 7 mm have been investigated. When the hemisphere diameter was 5 mm, the correlation coefficient (R2) of V(I)/Fe(I) improved from 0.946 to 0.981. Similarly, the R2 of Cr(I)/Fe(I) and Mn(I)/Fe(I) increased from 0.973 to 0.986 and from 0.945 to 0.981, respectively [61].
Traditional spatial constraint can result in formation of laser-induced craters. When multiple pulses hit a sample, the LIBS signal generated by later pulses will be enhanced because of the formation of craters by the initial pluses [62]. Spectral enhancement occurs because the laser pulse crater has a binding effect on the plasma [63].
Magnetic constraint is another common external field assistance method for improving LIBS sensitivity. Application of the magnetic constraint method is very similar to that of spatial constraint. This method replaces the spatial constraint device around the sample with a magnetic field device. Under the magnetic field, charged particles inside the plasma that are excited on the surface of the sample will move in a circular or spiral motion because of the Lorentz force [64]. This may slow down expansion of the plasma plume, increase the emission duration, improve the probability of electron-ion recombination, and result in enhancement of the emission line intensities [65].
One of the simplest applications of magnetic confinement uses a magnetic ring as a magnetic field to constrain the plasma. Hao et al. [64] designed a magnetic ring to investigate the effect of a magnetic field. The outer diameter, inner diameter, and height of the magnetic ring were 12.7, 3.2, and 6.3 mm, respectively. LODs of 11 ppm for V and 30 ppm for Mn were obtained with the magnetic ring, and these were lower than those obtained with a degaussed magnet (18 ppm for V and 41 ppm for Mn) [64]. Dong et al. [66] used a combination of metal nanoparticlea, super-hydrophobic, and magnetic confiment to detect Cu in solution. This method gave a signal intensity enhancement of approximately 5–6 orders of magnitude. Although a magnetic ring is simple and easy to apply as an external magnetic field device, the magnetic field of a magnetic ring cannot be adjusted. Therefore, Cheng et al. [67] used a pair of magnetic poles to form a magnetic field to constrain plasma. In their experiments, a magnetic field of 0.67 T was applied in analysis of a copper sheet. The detection results showed that the signal intensity of Cu(I) was enhanced 3–4 times, and those of Cu(II) and Cu(III) were enhanced 6–8 times. Although the enhancement effect of magnetic field is very good in laboratory, it is inconvenient to the filed for in-situ detection.
Chemical enhancement methods can also be used to improve the LIBS detection sensitivity. Sample pre-treatment is the main method used to achieve chemical enhancement, especially nanoparticle surface enhancement. The enhancement mechanism of nanoparticle-enhanced LIBS differs for conductors and insulators [68]. Figure 4 shows the ablation process of nanoparticles on conductors and insulators. It can be seen from the figure that, for conductors, when NPs are deposited on the surfaces of metals and other conductors, surface plasmons of the nanoparticle formed by the laser electromagnetic field couple with the electric field to produce a field enhancement. As a result of the enhanced electromagnetic field, the inward acceleration of free electrons in the direction of the laser pulse propagation results in faster ablation of the material, which results in enhancement [69]. As for insulators, enhancement mainly occurs because of the resonance between nanoparticles and local surface plasma from the sample. Strong local heating is generated on the surface of the sample, which stimulates the surface of the sample to produce more plasma and enhance the spectral signal [70].
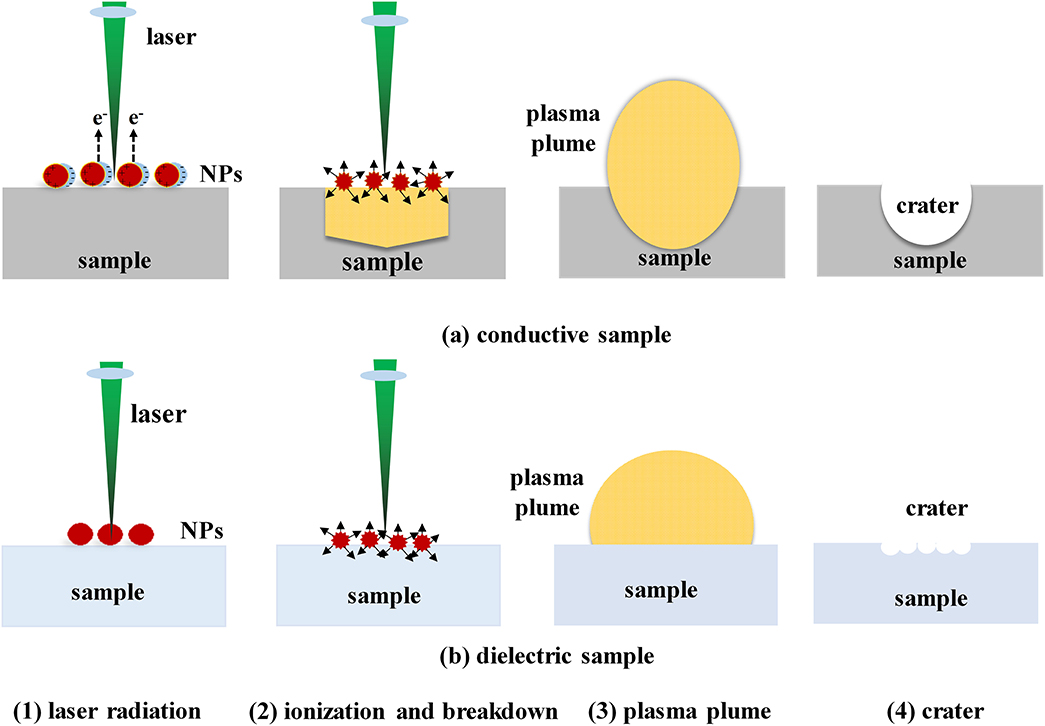
Figure 4. The Schematic diagram of nanoparticles acting on (a) conductive sample and (b) dielectric sample: (1) laser radiation; (2) ionization and breakdown; (3) plasma generation; (4) crater.
Nanoparticle-enhanced LIBS is mainly affected by the type, radius, and concentration of the nanoparticles. The enhancement effects of nanoparticles of different types (Au, Ag, Cu, and Pt), sizes (e.g., 20 and 10 nm Ag), and concentrations (e.g., 0.02 and 0.01 mg.mL−1 10 nm Ag) have been investigated. Enhancements of 1–2 orders of magnitude were obtained for metal samples [69, 70]. Furthermore, the enhancement effects of Au nanoparticles for PbCl2, Pb (NO3)2, and AgNO3 have been investigated. The results showed that the LODs of Pb and Ag were 2 pg and 0.2 pg, respectively [71, 72]. Poggialini et al. [73] used Greensynthetized silver nanoparticles to enhance the spectral intensities of Zn and Cr in copper and obtained LODs for Zn and Cr of 6 ppm and 0.1 ppm, respectively. Wen et al. [74] used LIBS combined with Au nanoparticles to detect Cu2+, Pb2+, and Cr3+ in the solution, and the LODs of Cr, Pb, and Cu in the solution were 0.5, 0.5, and 1.1 g.ml−1, respectively. In addition, Wu et al. [75] achieved a LOD of 13 ppb for K by combining amphiphiles with nanoparticles for adsorption and enrichment of K in KCl solution. The application of nanoparticles for molecular bands detection was studied by Koral et al. [76] An order of magnitude enhancement of AlO signal was achieved by 20 nm Ag nanoparticles when detecting aluminum alloy. Metal nanoparticles are simple to use and can greatly improve the detection sensitivity; however, metal nanoparticles will contaminate samples.
It is well-known that LIBS of liquid samples suffers from problems such as spattering, quenching, and short plasma lifetimes. Therefore, some researchers have proposed chemical replacement methods for pretreatment of liquid samples to improve the sensitivity of LIBS. The replacement can be implemented by methods such as liquid–liquid extraction, liquid–solid transformation, and surface-enhanced LIBS.
Liquid–liquid extraction can improve the LIBS sensitivity for liquid samples. Some special elements can be extracted and enriched by adding special chemical reagents to the solution before detection of LIBS. In the study of Aguirre et al. [77] dispersive liquid–liquid microextraction has been used to detect Cr, Cu, and Mn in water. The signal intensity obtained with this method was 4–5 times that of traditional LIBS and the LODs of the elements decreased by 3.7–5.6 times. In their subsequent research, they proposed a method of single-drop microextraction, which improved the detection sensitivity by 2.0–2.6 times, and the detection limit of Cr, Mn, Ni, Cu, and Zn elements in the solution was in range of 21–301 mg/kg [78]. However, liquid–liquid extraction suffers from some problems as the extraction process can be cumbersome and use dangerous chemical reagents.
To improve liquid–liquid extraction shortcomings, researchers have proposed the liquid-solid conversion method. The method was realized by using solid-phase media to enrich the elements of object in liquid samples, then the solid-phase media was detected by LIBS. The sensitivity was improved by the effect of enrichment. For example, nanographite and electrospun ultrafine fibers have been used to adsorb heavy metal ions in solution and increase the LODs [58, 79]. However, the liquid–solid conversion is a physical adsorption process and the adsorption efficiency is limited by the adsorption medium. Therefore, some researchers have proposed using an electrochemical reaction method. In one study, two aluminum sheets were used as an electrode to displace Cu in solution and achieve a LOD of 500 part per trillion [80]. Although the electrochemical conversion improved the displacement efficiency, the requirement for an applied electric field increased the complexity of the LIBS structure.
Researchers discovered that it was possible to improve the LIBS sensitivity by dropping a small amount of liquid sample onto the surface of a selected solid substrate, drying it, and then exciting the dried sample by LIBS. The method was defined surface-enhanced LIBS (SENLIBS) [32]. For example, the SELIBS method had been to reduce the LODs of Mn and K to 6 and 0.53 μg.g−1, respectively [81, 82]. In addition, Yang et al. [32] have used the SENLIBS method to simultaneously detect La, Ce, Pr, and Nd in solution. Compared with the filter paper method, the LODs of these elements increased by 2–4 times. They also detected some metallic elements in the solution using chemical replacement combined with SENLIBS, and the minimum detection limits were 0.250 g.ml−1 (Cu), 0.118 g.ml−1 (Pb), 0.420 g.ml−1 (Cd) and 0.025 g.ml−1 (Cr), respectively [34].
Mathematical processing of spectral data acquired by LIBS can be used to improve the sensitivity. With a mathematical method, the spectrum can be fully used and matrix interference can be reduced, which improves the prediction ability of the model. In principle, mathematical methods are divided into univariate methods and multivariate methods. The univariate methods mainly include single linear regression [83], internal standard [84], and external standard [85]. Commonly used multivariate methods include partial least squares [86], artificial neural network [87, 88], partial least squares regression [89], least squares support vector machines [90, 91], and random forest [92].
The univariate analysis method extracts the peak intensity of the target element from the spectrum and then establishes a fit between the intensity of the spectrum and the content of the element to obtain the relationship between them. However, because of self-priming and self-etching in the spectral line or interference from other peaks, the fitting result with a single variable is poor and the model has poor prediction ability and is difficult to apply practically. Therefore, multivariate methods have been used to filter redundant information in the spectrum and extract useful information to obtain a quantitative model with strong predictive ability [93]. For example, the univariate model R2 obtained using a single Cd line was 0.2316 for quantitative analysis of Cd in fresh vegetables. The band at 211.03–229.57 nm was extracted to increase the R2 of calibration set to 0.98 and the R2 of validation set to 0.99 with the partial least squares model [94]. When predicting the melamine contents in milk samples, researchers used an artificial neural network to increase the R2 obtained from a univariate algorithm from 0.982 to 0.999. Similarly, the mean prediction error and standard deviation decreased from 24 to 5% and from 2.2 to 0.3%, respectively [95]. In addition, for prediction of S and P elements in alloy steel, the R2 using a univariate algorithm were 0.8532 and 0.8936, respectively. When using the sequential backward selection-random forest, the R2 increased to 0.9991 (S) and 0.9994 (P) [96]. It is noted that incorrect spectral analysis methods can lead to poor analytical performance of LIBS. Therefore, it is important to choose appropriate mathematical methods based on the characteristics of the spectrum.
The methods used to improve the sensitivity of LIBS detection also include spark assisted LIBS, flame assisted LIBS and microwave-assisted LIBS (MW-LIBS). With the assistance of microwaves, the transmission time of the plasma is maintained by hundreds of microseconds to milliseconds [97]. As the lifetime of plasma extended, the emission intensity also enhanced. For example, Tampo et al. [98] used 2.45 GHz, 250 W microwave pulses to assist LIBS in detecting nuclear fuel. The results showed that Gd spectral signal could be enhanced by 50 times, and the minimum detection limit could reach 40 ppm. The enhancement effect was very significant. Alwahabi's team used microwave-assisted LIBS to detect Cu/Al2O3 solid samples. The results showed that the Cu spectral signal was enhanced by 100 times, and the detection limit reached 8.1 ppm [99]. At the same time, they also used MW-LIBS to detect the liquid samples. The results showed that the detection limit of MW-LIBS (10.8 ± 0.7 ppm) was greatly improved compared with that of traditional LIBS (124 ± 5 ppm) [100]. In spark-assisted LIBS, the detection sensitivity of LIBS was improved by using a high voltage pulse to re-excite the plasmas. It was proved that using a coil with a length of 50 m and a resistance value of 50 Ω to re-excite the plasma on the surface of the aluminum alloy could improve the signal-to-noise ratio by an order of magnitude [101]. Martinez et al. [102] also obtained enhancement of two orders of magnitude by applying a 600 kW electric pulse to assist LIBS [102]. Flame assist is another method to improve the spectral signal intensity of LIBS. Liu et al. [103] used neutral acylene flame assist LIBS to test aluminum alloy samples, and proved that the spectral lines of atoms and ions in the flame environment were enhanced by 4 times and 3 times, respectively. Although these methods improve the detection sensitivity of LIBS to some extent, they increase the cost and complexity of the system. At the same time, the above methods are impractical for in-situ measurement, because they increase the operation difficulty in filed.
To further improve the sensitivity of LIBS, researchers have considered combining the above methods. Because DP-LIBS can greatly improve the detection sensitivity, many studies have investigated combining other physical methods with DP-LIBS. For example, steel samples have been analyzed by DP-LIBS in combination with the ambient atmosphere method. The enhancement effects of different inert gases (N2, Ar, and He) at different pressures on plasma were investigated. Compared with a single pulse, the detection limits of C(III) and S(V) were reduced from 12.6 to 3.6 parts per million and from 9.8 to 2.4 parts per million, respectively [60]. In another study, spatial constraint was combined with DP-LIBS to enhance Si spectral lines by 2–3 times [104]. An enhancement factor of 70 for Al(I) (308.2 nm) was achieved using magnetic confinement in combination with DP-LIBS [105]. Magnetic confinement has been combined with the ambient atmosphere control method. The results showed that Mg(II) signals were enhanced 3 times in argon at 1 kPa and 1.5 times in argon at 80 kPa [106]. In the chemical enhancement methods, nanoparticles can greatly improve the detection sensitivity. Therefore, combination of nanoparticles with DP-LIBS has been investigated, and was found to increase the LIBS signal 30 times [107]. Resin enrichment combined with the spatial constraint method reportedly decreases the LOD of Cd from 0.3 to 0.132 mg.kg−1 [108].
In this invited review paper, we summarize various techniques proposed by researchers in recent years for improving the poor detection sensitivity of LIBS. These methods can be divided into physical, chemical, mathematical methods, MA-LIBS, spark-assisted LIBS, and flame assisted LIBS. The physical methods include the double-pulse method, environmental atmosphere control method, spatial constraint, and magnetic confinement. The chemical methods include nanoparticle surface enhancement and chemical replacement. Researchers have demonstrated the enhancements achieved with these methods for metals, soils, gemstones, liquids, gases, and foods. In these studies, the LODs were reduced to part per million levels and even part per trillion levels in some cases. Furthermore, the signal could be enhanced several tens of times and simple non-linear regression can be improved by more than 10 times. The mechanism, enhancement effect, change in plasma temperature, and electron density with each method have been thoroughly investigated. In conclusion, the detection sensitivity of LIBS could be greatly improved using these methods and by combination of multiple methods. However, there are some problems with these methods, such as complicated experimental configurations and high costs. In addition, some methods are difficult to realize for portable rapid detection instruments. With the continuous development of science and technology, exploration and discovery can introduce new materials and innovative methods to improve the detection sensitivity of LIBS. It is important that the complexity and cost of the LIBS systems is decreased for rapid field measurements. With improvements in the sensitivity and repeatability of LIBS, as well as miniaturization and improvement of the practicability of the instrument, LIBS technology will have greater potential for rapid field measurements in various areas.
XF: writing—original draft and editing. GL: investigation. DD: investigation, methodology, and conceptualization.
This work was supported by National Natural Science Foundation of China (Grant Nos. 31600417 and 31622040).
The authors declare that the research was conducted in the absence of any commercial or financial relationships that could be construed as a potential conflict of interest.
1. Miziolek AW, Palleschi V, Schechter I. Laser-induced breakdown spectroscopy (LIBS) : fundamentals and applications. Crit Rev Anal Chem. (2006) 27:257–90. doi: 10.1017/CBO9780511541261
2. Singh M, Karki V, Mishra RK, Kumar A, Mao X, Sarkar A, et al. Analytical spectral dependent partial least squares regression: a study of nuclear waste glass from thorium based fuel using LIBS. J Anal At Spectrom. (2015) 30:2507–15. doi: 10.1039/C5JA00372E
3. Sturm V, Fleige R, de Kanter M, Leitner R, Pilz K, Fischer D, et al. Laser-induced breakdown spectroscopy for 24/7 automatic liquid slag analysis at a steel works. Anal Chem. (2014) 86:9687–92. doi: 10.1021/ac5022425
4. Liang L, Zhang T, Wang K, Tang H, Yang X, Zhu X, et al. Classification of steel materials by laser-induced breakdown spectroscopy coupled with support vector machines. Appl Opt. (2014) 53:544–52. doi: 10.1364/AO.53.000544
5. Xu L, Liang L, Zhang T, Tang H, Wang K, Li H. A method of improving classification precision based on model population analysis of steel material for laser-induced breakdown spectroscopy. Anal Methods. (2014) 6:8374–9. doi: 10.1039/C4AY01557F
6. Markiewicz-Keszycka M, Cama-Moncunill X, Casado-Gavalda MP, Dixit Y, Cama-Moncunill R, Cullen PJ, Sullivan C. Laser-induced breakdown spectroscopy (LIBS) for food analysis: a review. Trends Food Sci Technol. (2017) 65:80–93. doi: 10.1016/j.tifs.2017.05.005
7. Gaudiuso R, Dell'Aglio M, Pascale OD, Senesi GS, Giacomo AD. Laser induced breakdown spectroscopy for elemental analysis in environmental, cultural heritage and space applications: a review of methods and results. Sensors. (2010) 10:7434–68. doi: 10.3390/s100807434
8. Harmon RS, Russo RE, Hark RR. Applications of laser-induced breakdown spectroscopy for geochemical and environmental analysis: a comprehensive review. Spectrochim Acta Part B At Spectrosc. (2013) 87:11–26. doi: 10.1016/j.sab.2013.05.017
9. Kaiser J, Novotný K, Martin MZ, Hrdlička A, Malina R, Adam V, et al. Trace elemental analysis by laser-induced breakdown spectroscopy—Biological applications. Surf Sci Rep. (2012) 67:233–43. doi: 10.1016/j.surfrep.2012.09.001
10. Peng J, Liu F, Zhou F, Song K, He L, Ye L, et al. Challenging applications for multi-element analysis by laser-induced breakdown spectroscopy in agriculture: a review. TrAC Trends Anal Chem. (2016) 85:260–72. doi: 10.1016/j.trac.2016.08.015
11. Noll R, Fricke-Begemann C, Brunk M, Connemann S, Meinhardt C, Scharun M, et al. Laser-induced breakdown spectroscopy expands into industrial applications. Spectrochim Acta Part B At Spectrosc. (2014) 93:41–51. doi: 10.1016/j.sab.2014.02.001
12. Hsu PS, Patnaik AK, Stolt AJ, Estevadeordal J, Roy S, Gord JR. Femtosecondlaser-induced plasma spectroscopy for high-pressure gas sensing: enhanced stability of spectroscopic signal. Appl Phys Lett. (2018) 113:2141031–4. doi: 10.1063/1.5054805
13. Yin H, Hou Z, Tingbi Y, Wang Z, Ni W, Li Z. Application of spatial confinement for gas analysis using laser-induced breakdown spectroscopy to improve signal stability. J Anal At Spectrom. (2015) 30:922–8. doi: 10.1039/C4JA00437J
14. Cahoon EM, Almirall JR. Quantitative analysis of liquids from aerosols and microdrops using laser induced breakdown spectroscopy. Anal Chem. (2012) 84:2239–44. doi: 10.1021/ac202834j
15. Xue B, Tian Y, Lu Y, Li Y, Zheng R. Characteristics of the secondary breakdown of DP-LIBS in bulk water with different axial focusing arrangements and laser energies. Spectrochim Acta B. (2019) 151:20–5. doi: 10.1016/j.sab.2018.11.005
16. Hahn DW, Omenetto N. Laser-induced breakdown spectroscopy (LIBS), part I: review of basic diagnostics and plasma-particle interactions: still-challenging issues within the analytical plasma community. Appl Spectrosc. (2010) 64:335–66. doi: 10.1366/000370210793561691
17. Windom BC, Hahn DW. Laser ablation—laser induced breakdown spectroscopy (LA-LIBS): a means for overcoming matrix effects leading to improved analyte response. J Anal At Spectrom. (2009) 24:1665–75. doi: 10.1039/b913495f
18. Feng J, Wang Z, Li Z, Ni W. Study to reduce laser-induced breakdown spectroscopy measurement uncertainty using plasma characteristic parameters. Spectrochim Acta Part B At Spectrosc. (2010) 65:549–56. doi: 10.1016/j.sab.2010.05.004
19. Aguilera JA, Aragón C, Madurga V, Manrique J. Study of matrix effects in laser induced breakdown spectroscopy on metallic samples using plasma characterization by emission spectroscopy. Spectrochim Acta Part B At Spectrosc. (2009) 64:993–8. doi: 10.1016/j.sab.2009.07.007
20. Anzano JM, Villoria MA, Ruíz-Medina A, Lasheras RJ. Laser-induced breakdown spectroscopy for quantitative spectrochemical analysis of geological materials: effects of the matrix and simultaneous determination. Analytica Chimica Acta. (2006) 575:230–5. doi: 10.1016/j.aca.2006.05.077
21. Gornushkin SI, Gornushkin IB, Anzano JM, Smith BW, Winefordner JD. Effective normalization technique for correction of matrix effects in laser-induced breakdown spectroscopy detection of magnesium in powdered samples. Appl Spectrosc. (2002) 56:433–6. doi: 10.1366/0003702021955088
22. Marangoni B, Nicolodelli G, Cabral J, Silva CS, Teixeira PC, Senesi GS, et al. Phosphorus quantification in fertilizers using laser induced breakdown spectroscopy (LIBS): a methodology of analysis to correct physical matrix effects. Anal Methods. (2016) 8:78–82. doi: 10.1039/C5AY01615K
23. Yao S, Zhao J, Xu J, Lu Z, Lu J. Optimizing the binder percentage to reduce matrix effects for the LIBS analysis of carbon in coal. J Anal At Spectrom. (2017) 32:766–72. doi: 10.1039/C6JA00458J
24. Solo-Gabriele HM, Townsend TG, Jacobi G, Jambeck J, Hosein N, Hahn DW, et al. Evaluation of XRF and LIBS technologies for on-line sorting of CCA-treated wood waste. Waste Manag. (2004) 24:413–24. doi: 10.1016/j.wasman.2003.09.006
25. Takahashi T, Thornton B. Quantitative methods for compensation of matrix effects in LIBS signals of solids, spectrochimica Acta B. Spectrochim Acta Part B At Spectrosc. (2017) 138:31–42. doi: 10.1016/j.sab.2017.09.010
26. Almaviva S, Caneve L, Colao F, Gasior PJ, Kubkowska M, Łepek M, et al. Double pulse laser induced breakdown spectroscopy measurements on ITER-like samples. Fusion Eng Des. (2015) 96–97:848–51. doi: 10.1016/j.fusengdes.2015.02.068
27. Cai BY, Mao X, Hou H, Zorba V, Russo RE, Cheung NH. Double-pulse laser ablation sampling: Enhancement of analyte emission by a second laser pulse at 213 nm. Spectrochim Acta Part B At Spectrosc. (2015) 110:51–5. doi: 10.1016/j.sab.2015.05.010
28. Freeman JR, Diwakar PK, Harilal SS, Hassanein A. Improvements in discrimination of bulk and trace elements in long-wavelength double pulse LIBS. Spectrochim Acta Part B At Spectrosc. (2014) 102:36–41. doi: 10.1016/j.sab.2014.10.008
29. Legnaioli S, Lorenzetti G, Pardini L, Cavalcanti GH, Palleschi V. Double and multiple pulse LIBS techniques. Berlin; Heidelberg: Springer (2014).
30. Song C, Gao X, Shao Y. Pre-ablation laser parameter effects on the spectral enhancement of 1064 nm/1064 nm dual-pulse laser induced breakdown spectroscopy. Optik Int J Light Electron Optics. (2016) 127:3979–83. doi: 10.1016/j.ijleo.2016.01.109
31. Järvinen ST, Saarela J, Toivonen J. Detection of zinc and lead in water using evaporative preconcentration and single-particle laser-induced breakdown spectroscopy. Spectrochim Acta Part B At Spectrosc. (2013) 86:55–9. doi: 10.1016/j.sab.2013.04.010
32. Yang X, Hao Z, shen M, Yi RX, Li J, Yu H, et al. Simultaneous determination of La, Ce, Pr, and Nd elements in aqueous solution using surface-enhanced laser-induced breakdown spectroscopy. Talanta. (2017) 163:127–31. doi: 10.1016/j.talanta.2016.10.094
33. Yang X, Li X, Cui Z, Hao Z, Lu Y, Huang J, et al. Analytical-performance improvement of aqueous solution by chemical replacement combined with surface-enhanced laser-induced breakdown spectroscopy. Appl Opt. (2018) 57:7135–9. doi: 10.1364/AO.57.007135
34. Yang XY, Hao ZQ, Li CM, Li JM, Yi RX, Shen M, et al. Sensitive determinations of Cu, Pb, Cd, and Cr elements in aqueous solutions using chemical replacement combined with surface-enhanced laser-induced breakdown spectroscopy. Opt Express. (2016) 24:13410–7. doi: 10.1364/OE.24.013410
35. Guo G, Niu G, Shi Q, Lin Q, Tian D, Duan Y. Multi-element quantitative analysis of soils by laser induced breakdown spectroscopy (LIBS) coupled with univariate and multivariate regression methods. Anal Methods. (2019) 11:3006–13. doi: 10.1039/C9AY00890J
36. Haddad JE, Bruyère D, Ismaël A, Gallou G, Laperche V, Canioni L, et al. Application of a series of artificial neural networks to on-site quantitative analysis of lead into real soil samples by laser induced breakdown spectroscopy. Spectrochim Acta Part B At Spectrosc. (2014) 97:57–64. doi: 10.1016/j.sab.2014.04.014
37. de Giacomo A, Dell'Aglio M, Bruno D, Gaudiuso R, de Pascale O. Experimental and theoretical comparison of single-pulse and double-pulse laser induced breakdown spectroscopy on metallic samples. Spectrochim Acta Part B At Spectrosc. (2008) 63:805–16. doi: 10.1016/j.sab.2008.05.002
38. Scaffidi J, Angel SM, Cremers DA. Emission enhancement mechanisms in dual-pulse LIBS. Anal Chem. (2006) 78:24–32. doi: 10.1021/ac069342z
39. Elnasharty IY, Doucet FR, Gravel JFY, Bouchard P, Sabsabi M. Double-pulse LIBS combining short and long nanosecond pulses in the microjoule range. J Anal At Spectrom. (2014) 29:1660–6. doi: 10.1039/C4JA00099D
40. Sanginés R, Sobral H. Time resolved study of the emission enhancement mechanisms in orthogonal double-pulse laser-induced breakdown spectroscopy. Spectrochim Acta Part B At Spectrosc. (2013) 88:150–5. doi: 10.1016/j.sab.2013.06.008
41. Sobral H, Sanginés R. Comparison of plasma parameters and line emissions of laser-induced plasmas of an aluminum target using single and orthogonal double nanosecond/picosecond pulses. Spectrochim Acta Part B At Spectrosc. (2014) 94–95:1–6. doi: 10.1016/j.sab.2014.02.002
42. Ahmed R, Baig MA. A comparative study of enhanced emission in double pulse laser induced breakdown spectroscopy. Optics Laser Technol. (2015) 65:113–8. doi: 10.1016/j.optlastec.2014.07.011
43. Nicolodelli G, Senesi GS, Ranulfi A, Marangoni B, Watanabe A, Oliveira P, et al. Double-pulse laser induced breakdown spectroscopy in orthogonal beam geometry to enhance line emission intensity from agricultural samples. Microchem J. (2017) 133:272–8. doi: 10.1016/j.microc.2017.03.047
44. Wang Y, Chen A, Li S, Sui L, Dunli L, Tian D, et al. Enhancement of laser-induced Fe plasma spectroscopy with dual-wavelength femtosecond double-pulse. J Anal At Spectrom. (2016) 31:497–505. doi: 10.1039/C5JA00420A
45. Ahamer CM, Pedarnig JD. Femtosecond double pulse laser-induced breakdown spectroscopy: investigation of the intensity enhancement. Spectrochim Acta Part B At Spectrosc. (2018) 148:23–30. doi: 10.1016/j.sab.2018.05.027
46. Diwakar PK, Harilal SS, Freeman JR, Hassanein A. Role of laser pre-pulse wavelength and inter-pulse delay on signal enhancement in collinear double-pulse laser-induced breakdown spectroscopy. Spectrochim Acta Part B At Spectrosc. (2013) 87:65–73. doi: 10.1016/j.sab.2013.05.015
47. Ahmed R, Iqbal J, Baig MA. Effects of laser wavelengths and pulse energy ratio on the emission enhancement in dual pulse LIBS. Laser Phys Lett. (2015). 12:066102. doi: 10.1088/1612-2011/12/6/066102
48. Antony JK, Vasa NJ, Sridharraja VLN, Laxmiprasad AS. Dual-wavelength laser induced breakdown spectroscopic technique for emission enhancement in vacuum. Appl Phys A. (2013) 112:215–9. doi: 10.1007/s00339-012-7282-y
49. Liu X, Sun S, Wang X, Liu Z, Liu Q, Ding P, et al. Effect of laser pulse energy on orthogonal double femtosecond pulse laser-induced breakdown spectroscopy. Opt Express. (2013) 21:A704–13. doi: 10.1364/OE.21.00A704
50. Wang Z, Deguchi Y, Liu R, Ikutomo A, Zhang Z, Chong D, et al. Emission characteristics of laser-induced plasma using collinear long and short dual-pulse laser-induced breakdown spectroscopy (LIBS). Appl Spectrosc. (2017) 71:2187–98. doi: 10.1177/0003702817693239
51. Cui M, Deguchi Y, Wang Z, Yuki F, Liu R, Zhao S, et al. Enhancement and stabilization of plasma using collinear long-short double-pulse laser-induced breakdown spectroscopy. Spectrochim Acta Part B At Spectrosc. (2018) 142:14–22. doi: 10.1016/j.sab.2018.02.002
52. Cui M, Deguchi Y, Wang Z, Tanaka S, Fujita Y, Zhao S, et al. Improvement of the analysis of manganese in steel samples using collinear long-short double pulse Laser-Induced Breakdown Spectroscopy (LIBS). Appl Spectrosc. (2019) 73:152–62. doi: 10.1177/0003702818803943
53. Li J, Hao Z, Zhao N, Zhou R, Lu YJOE. Spatially selective excitation in laser-induced breakdown spectroscopy combined with laser-induced fluorescence. Opt Express. (2017) 25:4945–51. doi: 10.1364/OE.25.004945
54. Goueguel C, Laville S, Vidal F, Sabsabi M, Chaker M. Investigation of resonance-enhanced laser-induced breakdown spectroscopy for analysis of aluminum alloys. J Anal At Spectrom. (2010) 25:246–53. doi: 10.1039/b927013b
55. Xiong G, Li S, Tse SD. Tuning excitation laser wavelength for secondary resonance in low-intensity phase-selective laser-induced breakdown spectroscopy for in-situ analytical measurement of nanoaerosols. Spectrochim Acta Part B At Spectrosc. (2018) 140:13–21. doi: 10.1016/j.sab.2017.11.013
56. Kim CK, In JH, Lee SH, Jeong S. Influence of Ar buffer gas on the LIBS signal of thin CIGS films. J Anal At Spectrom. (2013) 28:460–7. doi: 10.1039/C2JA30297G
57. Son JG, Lee Y, Ko DK. Signal enhancement of laser-induced breakdown spectroscopy by applying synchronized buffer gas pulses. Appl Phys Express. (2018) 11:102401. doi: 10.7567/APEX.11.102401
58. Lin Q, Wei Z, Xu M, Wang S, Niu G, Liu K, et al. Laser-induced breakdown spectroscopy for solution sample analysis using porous electrospun ultrafine fibers as a solid-phase support. Rsc Adv. (2014) 4:14392–9. doi: 10.1039/c3ra47697a
59. Nakimana A, Tao H, Gao X, Hao Z, Lin J. Effects of ambient conditions on femtosecond laser-induced breakdown spectroscopy of Al. J Phys D Appl Phys. (2013) 46:285204. doi: 10.1088/0022-3727/46/28/285204
60. Jiang X, Hayden P, Costello JT, Kennedy ET. Double-pulse laser induced breakdown spectroscopy with ambient gas in the vacuum ultraviolet: optimization of parameters for detection of carbon and sulfur in steel. Spectrochim Acta Part B At Spectrosc. (2014) 101:106–13. doi: 10.1016/j.sab.2014.07.002
61. Guo LB, Hao Z, Shen M, Xiong W, He XN, Xie ZQ, et al. Accuracy improvement of quantitative analysis by spatial confinement in laser-induced breakdown spectroscopy. Opt Express. (2013) 21:18188–95. doi: 10.1364/OE.21.018188
62. Corsi M, Cristoforetti G, Hidalgo M, Iriarte D, Legnaioli S, Palleschi V, et al. Effect of laser-induced crater depth in laser-induced breakdown spectroscopy emission features. Appl Spectrosc. (2005) 59:853–60. doi: 10.1366/0003702054411607
63. Li K, Guo L, Li X, Hao Z, Zeng X, Shen M, et al. Characteristics of spectral lines with crater development during laser-induced breakdown spectroscopy. Appl Opt. (2016) 55:7422–7. doi: 10.1364/AO.55.007422
64. Hao Z, Guo L, Li CM, Shen M, Zou X, Li X, et al. Sensitivity improvement in the detection of V and Mn elements in steel using laser-induced breakdown spectroscopy with ring-magnet confinement. J Anal At Spectrom. (2014) 29:2309–14. doi: 10.1039/C4JA00144C
65. Hai R, Liu P, Wu D, Xiao Q, Sun L, Ding H. Effect of steady magnetic field on laser-induced breakdown spectroscopic characterization of EAST-like wall materials. J Nucl Mater. (2015) 463:927–30. doi: 10.1016/j.jnucmat.2014.10.069
66. Dong D, Jiao L, Du X, Zhao C. Ultrasensitive nanoparticle enhanced laser-induced breakdown spectroscopy using a super-hydrophobic substrate coupled with magnetic confinement. Chem Commun. (2017) 53:4546–9. doi: 10.1039/C6CC09695F
67. Cheng L, Xun G, Qi L, Chao S, Jingquan L. Spectral enhancement of laser-induced breakdown spectroscopy in external magnetic field. Plasma Sci Technol. (2015) 17:919–22. doi: 10.1088/1009-0630/17/11/05
68. Dell'Aglio M, Alrifai R, Giacomo AD. Nanoparticle enhanced laser induced breakdown spectroscopy (NELIBS), a first review. Spectrochim Acta Part B At Spectrosc. (2018) 148:105–12. doi: 10.1016/j.sab.2018.06.008
69. Giacomo AD, Gaudiuso R, Koral C, Dell'Aglio M, Pascale OD. Nanoparticle enhanced laser induced breakdown spectroscopy: effect of nanoparticles deposited on sample surface on laser ablation and plasma emission. Spectrochim Acta Part B At Spectrosc. (2014) 98:19–27. doi: 10.1016/j.sab.2014.05.010
70. Giacomo AD, Gaudiuso R, Koral C, Dell'Aglio M, Pascale OD. Nanoparticle-enhanced laser-induced breakdown spectroscopy of metallic samples. Anal Chem. (2013) 85:10180–7. doi: 10.1021/ac4016165
71. de GA, Koral C, Valenza G, Gaudiuso R, Dell'Aglio M. Nanoparticle enhanced laser induced breakdown spectroscopy for microdrop analysis at sub-ppm level. Anal Chem. (2016) 88:9869–70.
72. Zhao C, Dong D. Comment on “Nanoparticle enhanced laser induced breakdown spectroscopy for microdrop analysis at sub-ppm level.” Anal Chem. (2016) 88:9869–70. doi: 10.1021/acs.analchem.6b02874
73. Poggialini F, Campanella B, Giannarelli S, Grifoni E, Legnaioli S, Lorenzetti G, et al. Green-synthetized silver nanoparticles for Nanoparticle-Enhanced Laser Induced Breakdown Spectroscopy (NELIBS) using a mobile instrument. Spectrochim Acta B. (2018) 141:53–8. doi: 10.1016/j.sab.2018.01.005
74. Wen X, Lin Q, Niu G, Shi Q, Duan Y. Emission enhancement of laser-induced breakdown spectroscopy for aqueous sample analysis based on Au nanoparticles and solid-phase substrate. Appl Opt. (2016) 55:6706–12. doi: 10.1364/AO.55.006706
75. Wu K, Shen J, Cao D, Cheng H, Sun S, Hu B, et al. Coulombic effect of amphiphiles with metal nanoparticles on laser-induced breakdown spectroscopy enhancement. J Phys Chem C. (2018) 122:19133–8. doi: 10.1021/acs.jpcc.8b03008
76. Koral C, de Giacomo A, Mao X, Zorba V, Russo RE. Nanoparticle enhanced laser induced breakdown spectroscopy for improving the detection of molecular bands. Spectrochim Acta Part B At Spectrosc. (2016) 125:11–7. doi: 10.1016/j.sab.2016.09.006
77. Aguirre MA, Selva EJ, Hidalgo M, Canals A. Dispersive liquid-liquid microextraction for metals enrichment: a useful strategy for improving sensitivity of laser-induced breakdown spectroscopy in liquid samples analysis. Talanta. (2015) 131:348–53. doi: 10.1016/j.talanta.2014.07.090
78. Aguirre MA, Nikolova H, Hidalgo M, Canals A. Hyphenation of single-drop microextraction with laser-induced breakdown spectrometry for trace analysis in liquid samples: a viability study. Anal Methods. (2015) 7:877–83. doi: 10.1039/C4AY02218A
79. Wang X, Shi L, Lin Q, Zhu X, Duan Y. Simultaneous and sensitive analysis of Ag(i), Mn(ii), and Cr(iii) in aqueous solution by LIBS combined with dispersive solid phase micro-extraction using nano-graphite as an adsorbent. J Anal At Spectrom. (2014) 29:1098–104. doi: 10.1039/c4ja00021h
80. Lu Y, Li Y, Qi F, Zheng R. Concentration determination of copper in aqueous solution using deposition-assisted Laser-Induced Breakdown Spectroscopy (LIBS). Appl Spectrosc. (2015) 69:1412–6. doi: 10.1366/14-07774
81. Aguirre MA, Legnaioli S, Canals A, Almodóvar F, Hidalgo M, Palleschi V, et al. Elemental analysis by surface-enhanced Laser-Induced Breakdown Spectroscopy combined with liquid–liquid microextraction. Spectrochim Acta Part B At Spectrosc. (2013) 79–80:88–93. doi: 10.1016/j.sab.2012.11.011
82. Bae D, Nam SH, Han SH, Yoo J, Lee Y. Spreading a water droplet on the laser-patterned silicon wafer substrate for surface-enhanced laser-induced breakdown spectroscopy. Spectrochim Acta Part B At Spectrosc. (2015) 113:70–8. doi: 10.1016/j.sab.2015.09.005
83. Andrade DF, Pereira Filho ER, Chemistry F. Direct determination of contaminants, major and minor nutrients in solid fertilizers using Laser-Induced Breakdown Spectroscopy (LIBS). J Agric. (2016) 64:7890–8. doi: 10.1021/acs.jafc.6b04028
84. Lasheras RJ, Bello-Gálvez C, Anzano JM. Quantitative analysis of oxide materials by laser-induced breakdown spectroscopy with argon as an internal standard. Spectrochim Acta Part B At Spectrosc. (2013) 82:65–70. doi: 10.1016/j.sab.2013.01.005
85. Sheng L, Zhang T, Wang K, Tang H, Li H. Quantitative analysis of Fe content in iron ore via external calibration in conjunction with internal standardization method coupled with LIBS. Chem Res Chin Univ. (2015) 31:107–11. doi: 10.1007/s40242-014-4318-1
86. Yuan T, Wang Z, Li Z, Ni W, Liu J. A partial least squares and wavelet-transform hybrid model to analyze carbon content in coal using laser-induced breakdown spectroscopy. Anal Chim Acta. (2014) 807:29–35. doi: 10.1016/j.aca.2013.11.027
87. Li K, Guo L, Shen M, Zheng Z, Yu Y, Hao R, et al. Analytical-performance improvement of laser-induced breakdown spectroscopy for steel using multi-spectral-line calibration with an artificial neural network. J Anal At Spectrom. (2015) 30:1623–8. doi: 10.1039/C5JA00089K
88. El Haddad J, Ismaël A, Gallou G, Michel K, Bruyère D, Laperche V, et al. Artificial neural network for on-site quantitative analysis of soils using laser induced breakdown spectroscopy. Spectrochim Acta Part B At Spectrosc. (2013) 79:51–7. doi: 10.1016/j.sab.2012.11.007
89. Tiwari PK, Awasthi S, Kumar R, Anand RJ, Rai RP, Rai AK, et al. Rapid analysis of pharmaceutical drugs using LIBS coupled with multivariate analysis. Lasers Med Sci. (2018) 33:263–70. doi: 10.1007/s10103-017-2358-8
90. Wei J, Wang K, Tang H, Yang X, Li H, Zhang T, et al. Quantitative and classification analysis of slag samples by laser induced breakdown spectroscopy (LIBS) coupled with support vector machine (SVM) and partial least square (PLS) methods. J Anal At Spectrom. (2015) 30:368–74. doi: 10.1039/C4JA00421C
91. Yang J, Yi C, Xu J, Ma X. Laser-induced breakdown spectroscopy quantitative analysis method via adaptive analytical line selection and relevance vector machine regression model. Spectrochim Acta Part B At Spectrosc. (2015) 107:45–55. doi: 10.1016/j.sab.2015.02.014
92. Sheng L, Zhang T, Niu G, Wang K, Tang H, Duan Y, et al. Classification of iron ores by laser-induced breakdown spectroscopy (LIBS) combined with random forest (RF). J Anal At Spectrom. (2015) 30:453–8. doi: 10.1039/C4JA00352G
93. Hongbo Fu JJ, Huadong Wang, Zhibo Ni, Fengzhong Dong Calibration Methods of Laser-Induced Breakdown Spectroscopy. 85-107 (2018).
94. Yao M, Yang H, Huang L, Chen T, Rao G, Liu M, et al. Detection of heavy metal Cd in polluted fresh leafy vegetables by laser-induced breakdown spectroscopy. Appl Opt. (2017) 56:4070–5. doi: 10.1364/AO.56.004070
95. Moncayo S, Manzoor S, Rosales JD, Anzano J, Caceres JO. Qualitative and quantitative analysis of milk for the detection of adulteration by Laser Induced Breakdown Spectroscopy (LIBS). Food Chem. (2017) 232:322–8. doi: 10.1016/j.foodchem.2017.04.017
96. Ruan F, Qi J, Yan C, Tang H, Zhang T, Li H, et al. Quantitative detection of harmful elements in alloy steel by LIBS technique and sequential backward selection-random forest (SBS-RF). J Anal At Spectrom. (2017) 32:2194–9. doi: 10.1039/C7JA00231A
97. Liu Y, Baudelet M, Richardson M. Elemental analysis by microwave-assisted laser-induced breakdown spectroscopy: evaluation on ceramics. J Anal At Spectrom. (2010) 25:1316–23. doi: 10.1039/c003304a
98. Tampo M, Miyabe M, Akaoka K, Oba M, Wakaida I, Maruyama Y, et al. Enhancement of intensity in microwave-assisted laser-induced breakdown spectroscopy for remote analysis of nuclear fuel recycling. J Anal At Spectrom. (2014) 29:886–92. doi: 10.1039/C3JA50259G
99. Viljanen J, Sun Z, Alwahabi ZT. Microwave assisted laser-induced breakdown spectroscopy at ambient conditions. Spectrochim Acta Part B At Spectrosc. (2016) 118:29–36. doi: 10.1016/j.sab.2016.02.002
100. Wall M, Sun Z, Alwahabi ZT. Quantitative detection of metallic traces in water-based liquids by microwave-assisted laser-induced breakdown spectroscopy. Opt Express. (2016) 24:1507–17. doi: 10.1364/OE.24.001507
101. Sobral H, Robledo-Martinez A. Signal enhancement in laser-induced breakdown spectroscopy using fast square-pulse discharges. Spectrochim Acta Part B At Spectrosc. (2016) 124:67–73. doi: 10.1016/j.sab.2016.08.017
102. Robledo-Martinez A, Sobral H, Garcia-Villarreal A. Effect of applied voltage and inter-pulse delay in spark-assisted LIBS. Spectrochim Acta Part B At Spectrosc. (2018) 144:7–14. doi: 10.1016/j.sab.2018.03.002
103. Liu L, Li S, He XN, Huang X, Zhang CF, Fan L, et al. Flame-enhanced laser-induced breakdown spectroscopy. Opt Express. (2014) 22:7686–93. doi: 10.1364/OE.22.007686
104. Su X, Zhou W, Qian H. Optical emission character of collinear dual pulse laser plasma with cylindrical cavity confinement. J Anal At Spectrom. (2014) 29:2356–61. doi: 10.1039/C4JA00296B
105. Hussain A, Gao X, Hao Z, Lin J. Combined effects of double pulses and magnetic field on emission enhancement of laser-induced breakdown spectroscopy from aluminum plasma. Optik Int J Light Electron Opt. (2016) 127:10024–30. doi: 10.1016/j.ijleo.2016.07.047
106. Hussain A, Tanveer M, Farid G, Hussain MB, Azam M, Khan W. Combined effects of magnetic field and ambient gas condition in the enhancement of laser-induced breakdown spectroscopy signal. Optik. (2018) 172:1012–8. doi: 10.1016/j.ijleo.2018.07.071
107. Yang F, Jiang L, Wang S, Cao Z, Liu L, Wang M, et al. Emission enhancement of femtosecond laser-induced breakdown spectroscopy by combining nanoparticle and dual-pulse on crystal SiO2. Opt Laser Technol. (2017) 93:194–200. doi: 10.1016/j.optlastec.2017.03.016
Keywords: laser-induced breakdown spectroscopy, detection sensitivity, physical enhancement, chemical enhancement, mathematical method
Citation: Fu X, Li G and Dong D (2020) Improving the Detection Sensitivity for Laser-Induced Breakdown Spectroscopy: A Review. Front. Phys. 8:68. doi: 10.3389/fphy.2020.00068
Received: 24 November 2019; Accepted: 28 February 2020;
Published: 31 March 2020.
Edited by:
Yufei Ma, Harbin Institute of Technology, ChinaReviewed by:
Lianbo Guo, Huazhong University of Science and Technology, ChinaCopyright © 2020 Fu, Li and Dong. This is an open-access article distributed under the terms of the Creative Commons Attribution License (CC BY). The use, distribution or reproduction in other forums is permitted, provided the original author(s) and the copyright owner(s) are credited and that the original publication in this journal is cited, in accordance with accepted academic practice. No use, distribution or reproduction is permitted which does not comply with these terms.
*Correspondence: Daming Dong, damingdong@hotmail.com
Disclaimer: All claims expressed in this article are solely those of the authors and do not necessarily represent those of their affiliated organizations, or those of the publisher, the editors and the reviewers. Any product that may be evaluated in this article or claim that may be made by its manufacturer is not guaranteed or endorsed by the publisher.
Research integrity at Frontiers
Learn more about the work of our research integrity team to safeguard the quality of each article we publish.