 Ting Zhang
 Gang Zhang
- Jiangsu Key Laboratory of Advanced Laser Materials and Devices, College of Physics and Electronic Engineering, Jiangsu Normal University, Xuzhou, China
Ethylene (C2H4) concentration and temperature is simultaneously measured in high temperature environments using a differential absorption scheme combined with a distributed feedback (DFB) diode laser near 1. 620 μm. Based on optimal selection criteria, two wavelength pairs with absorption peaks at 6,174.58 cm−1 and 6,174.98 cm−1 are selected for the measurement. Temperatures are obtained from the ratio of the absorption cross-section of the two wavelength pairs, and C2H4 concentration is inferred from the differential absorption of one of the wavelength pairs. Measurements are performed in a high temperature cell (T = 300–900 K, P = 1 atm) to verify the accuracy of the system. The accuracies for the measurement of C2H4 concentration and temperature are 1.135 and 2.215%, respectively. Continuous time series measurements indicated that the system has a good stability, and the limit of detection achieved by Allan-Werle variance analysis is 6.6 ppm at the optimal average time of 340 s. All the measurements show the scheme is helpful for improving the practicality of laser absorption spectroscopy in combustion diagnosis.
Introduction
Temperature is one of the scalar quantities on large technical combustion systems which directly reflects the combustion efficiency and affects the diffusivity of combustion products. The analysis of existing research [1–3] indicated that it is difficult to measure temperature or its distribution in combustion process. Therefore, it is necessary to develop an accurate and precise experiment approach to directly measure combustion temperature and provide time-resolved information of temperature distribution.
In combustion applications, planar laser-induced fluorescence (PLIF) is a kind of laser spectrum measurement technology for the diagnosis of high-temperature variable flow fields [4, 5]. PLIF technology can accurately measure the distribution of component concentration, temperature change, and other information in the combustion environment, but PLIF equipment is complex, expensive, and difficult to apply in industrial applications. Tunable diode laser absorption spectroscopy (TDLAS) is a valuable tool for studying the combustion environment due to its non-contact measurement, rapid response time, and high sensitivity [6–9]. TDLAS technology has been demonstrated previously to provide quantitative measurements for species concentrations and temperatures in various combustion systems [8–11]. For example, Almodovar et al. identified the absorption transitions of nitric oxide (NO) on species sensing and two-color thermometry in high temperature applications, and some new insights to the temperature dependence of NO collision broadening were provided [12]. Sun et al. demonstrated the measurement of multi-species concentrations and temperature in a slagging coal gasifier with high pressure and high temperature using TDLAS, proving the capability of TDL sensors to monitor transient changes in gas temperature and the syngas heating value [13]. Cai et al. demonstrated accurate and fast measurement of carbon dioxide concentration and temperature based on TDLAS at high temperature and high pressure [14].
Through an investigation of relevant literature, it has been found that there are many studies on measurements of species concentration and temperature by direct absorption spectroscopy (DAS) or wavelength modulation spectroscopy (WMS) employing isolated absorption lines of the measured gas molecules [12–19]. However, for the molecules with dense absorption spectral features (such as ethylene and methane, which contain hydrocarbon bonds), there will be self-mixing or overlap with other molecules at an elevated temperature and pressure, making it difficult to accurately infer the complete transition properties through a single line or line pair. Therefore, the previous measurements of these species are mainly performed at low pressure or by employing a fixed-wavelength scheme. For example, Ren et al. performed fixed-wavelength measurements of ethylene at 10.532 μm using a CO2 gas laser [20]. Strand et al. established a fixed-wavelength methodology for the measurement of a quantitative absorption cross-section of elevated temperature and pressure gases using an external-cavity quantum cascade laser with raid-tuning mode and broad-scanning range [21]. Tanaka et al. constructed a sensor for trace gas analysis of C2H4 in combustion emission using WMS coupled with a DFB interband cascade laser near 3.356 μm under 3 kPa pressure [22]. The peak of the absorption may be shifted due to the change of the pressure in a practical combustion; these methods are difficult to implement for most sensors deployed in real-world environments.
In addition to the challenges of the conditions of the species being tested, it is also necessary to consider the interference caused by other species and soot in a practical combustion. To address this disadvantage, a differential absorption (or peak to valley) scheme is proposed to eliminate self-interference of the tested species or interference of other molecules with absorption features in the wavelength range of interest [23, 24]. And the method can also eliminate the effects of extinction or scattering caused by particles or liquid droplets. However, it has only been used for interference-free measurements of some species concentrations rather than temperature. In this study, we will demonstrate the simultaneous measurement of C2H4 concentration and temperature using TDLAS combined with the differential absorption scheme in an elevated temperature environment.
Experimental Detail
For high precision determination of temperature and C2H4 concentration, a schematic of the optical setup is shown in Figure 1. A continuous-wavelength DFB laser with a relatively narrow linewidth of about ~2 MHz operating at 1.620 μm is employed as a light source for this experiment. The laser is controlled by a low-noise laser driver (ILX Lightwave LDC-3724C) to probe the C2H4 absorption lines, and the laser temperature is fixed at 13.8°C while the current is scanned by a triangle voltage ramp generated by a function generator (RIGOL, DG1032Z). The laser beam is connected to a fiber beam-splitter to form two parts. The first part (about 50%) is propagated into a wavemeter (Bristol-671B-MIR) with a repeatability of ±1 ppm to record the frequency of the spectroscopic lines. The second part is collimated and introduced into a heat static cell to sense C2H4. The transmitted laser beams is directly recorded by a home-made detector. Finally, the output signal from the photodetector is acquired by a DAQ card (National instruments, USB6361).
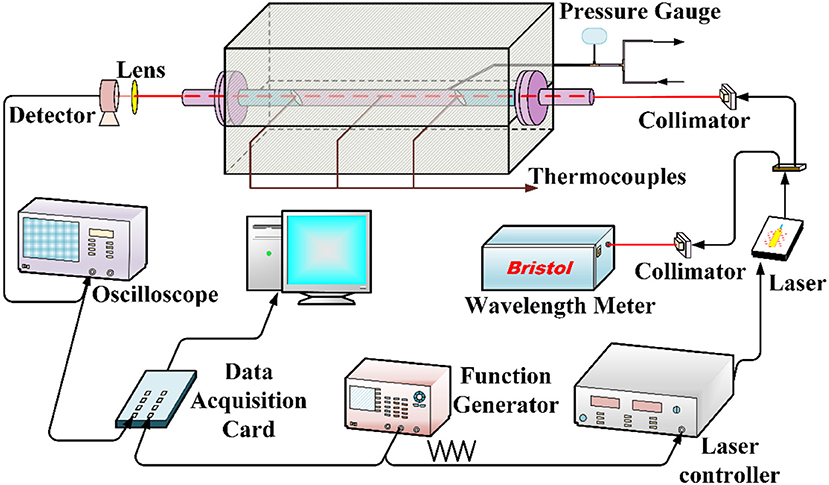
Figure 1. Schematic of the experimental setup.
The heat static cell is previously described in our previous work [25]. Briefly, the temperature of the cell can reach up to 1,200 K and pressure can withstand 10 atm under ideal conditions. The gas temperature in the static cell is determined by the average of three thermocouples with accuracies of 1% and these thermocouples are arranged equidistantly along the cell body. Before each experiment, the heat static cell is purged with pure N2 for a few minutes to remove the residual gas. The pressure of the test gases is measured by a gauge with an accuracy of 0.25%. In this work, the cell is operated at 300–900 K at an operational pressure of 1 atm. When the temperature is stabilized, the C2H4-N2 gas with different concentrations are delivered to the cell for measurement. Each spectrum is obtained with 30 average sweeps to increase the signal noise ratio (SNR).
Theory and Methodology
Algorithms for Data Processing
The theoretical details for concentration measurement with the differential absorption scheme were previously described in Ref. [26–28]. Here we will present a brief review and develop the theory for two-wavelength temperature measurement.
As a laser beam passes through a uniform gas mixture, the relationship between the transmitted intensity and incident intensity of the laser beam can be described using the Lambert Beer law:
in which is the ratio of transmitted and incident laser intensities, σ(ν, T, P) (m2 mol−1) is the absorption cross section of target molecules, x is the mole fraction of the absorber, R (8.314 J K−1 mol−1) is the universal gas constant, Ptot (atm) and T (K) is the total gas pressure and the temperature, L (m) is the path length of the gas sample, and α(ν, T, P) is the absorbance.
However, in certain situations, other absorbing species can produce absorption and interference absorption in the selected wavelength range, while extinction or scattering can also be caused by particles or liquid droplets. The Equation (1) can be modified to describe these effects:
where αtarget is the absorption by the target molecules, αinterference is the absorption from other interfering molecules, and τextinciton includes the total extinction and scattering from all other sources. In the differential absorption scheme, the fractional transmissions should be acquired at the peak and valley wavelength.
In order to quantitatively measure the C2H4 concentration and temperature based on direct absorption spectroscopy, the absorption transitions with minimal interference from other species should be identified in the wavelength range of interest. The differential absorption , can be effectively applied to eliminate the influence of interference from other species and extinction while their magnitudes are almost the same at the peak and valley of the absorption feature of the measured molecule. Therefore, the mole fraction of the target substance can be calculated by subtracting the valley from the peak value of the absorption transition using Equation (2) at a specific temperature and pressure. After simplification, the following expression can be obtained:
For a single absorbing species, the ratio of peak-to-valley absorbance is only a function of the differential absorption cross-section at the selected wavelength pairs.
where ν1 and ν2 represent the selected two wavelength pairs, respectively.
Since the absorption cross-section is strongly temperature-dependent [29], the cross-sections of peak and valley at selected wavelengths can be determined in a temperature range required in the work. The temperature dependences of the differential absorption cross-sections can be modeled with power law expressions based on the measured cross-section data.
where σν, peak−valley(T0) is the differential absorption cross-section at the reference temperature T0, a and b are the indices of the polynomial expression.
Since Equation (4) can expressed as:
Finally, when the total pressure and the ratio are known, the gas temperature can be deduced.
Wavelength Pairs Selections Methodology
Selecting optimal absorption transitions is crucial to the performance of all TDLAS sensors. In this work, the main line selection criteria for the differential absorption-based system include strong absorbance at the peak wavelength, isolation from interference of the other species at the target range of interest wavelength range, adequate intervals for each wavelength pair, and the monotonicity between the ratio of the differential absorption cross-sections of the two wavelength pairs and temperature [24]. Here two wavelength pairs near 6,175 cm−1 are selected based on those criteria. Figure 2 shows the measured spectrum of C2H4 and the simulated absorbance of the main interference species in combustion based on HITRAN 2016 at 905 K and 1 atm, the selected wavelength pairs are marked in this figure. Since the absorbance of these interference species is almost the same at the marked locations, the interference absorption in combustion could be minimized using the differential absorption technique.
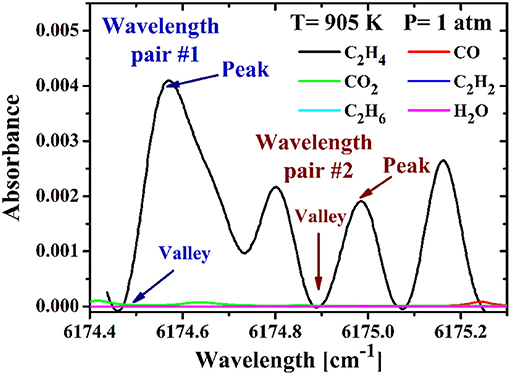
Figure 2. Measured absorbance profile of C2H4 and simulated absorbance profiles of other species near 6,175 cm−1. The peaks and valleys of the selected wavelength pair #1 and #2 are marked in the figures.
Results and Discussion
Measurement of Differential Absorption Cross Sections
In order to obtain the differential absorption cross-sections for the selected two wavelength pairs, direct absorption spectra of a set of C2H4/N2 mixture with different concentrations are recorded in the temperature range of 300–900 K at normal atmosphere. For each wavelength pair, the differential absorption cross-sections can be inferred from the differential absorbance between the peak and valley. The differential absorbance of wavelength pair #1 and #2 vs. the C2H4 concentration is plotted in Figure 3. According to Equation (3), the absorption cross-section of each wavelength pair can be determined from the linear fit to the measured differential absorbance at various C2H4 concentrations. It also can be seen from the figure that the differential absorbance linearly increases with the C2H4 concentration, but it decreases with temperature at a certain C2H4 concentration. As the temperature increases, the temperature dependence increases. This is because the transitions overlap each other as the temperature increases, and the profile of the spectrum becomes relatively dense at high temperatures.
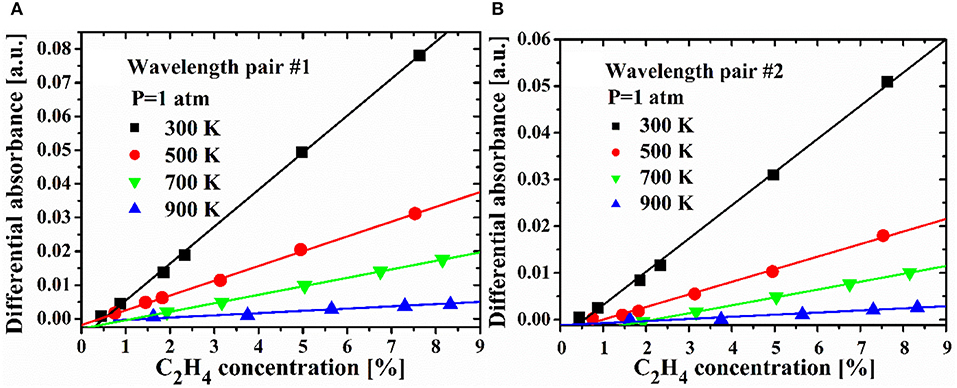
Figure 3. The differential absorbance obtained of the selected wavelength pair #1 (A) and #2 (B) at 1 atm.
Figure 4 shows the absorption cross-sections at peaks and valleys, and differential cross-sections for the used C2H4 at selected wavelength pairs, which obtained at different temperatures and atmospheric pressure. As indicated in Figure 4, the differential cross-section (σpeak−valley) of the selected two wavelength pairs show strong temperature dependence. Both of them decrease with temperature. Then the generalized expression for differential cross-sections as a function of temperature can be derived for the two selected wavelength pairs.
The differential absorption cross sections derived from the expressions agree well with the measured values, and the standard deviations between the derived and measured values are 4.67% for pair #1 and 2.89% for pair #2.
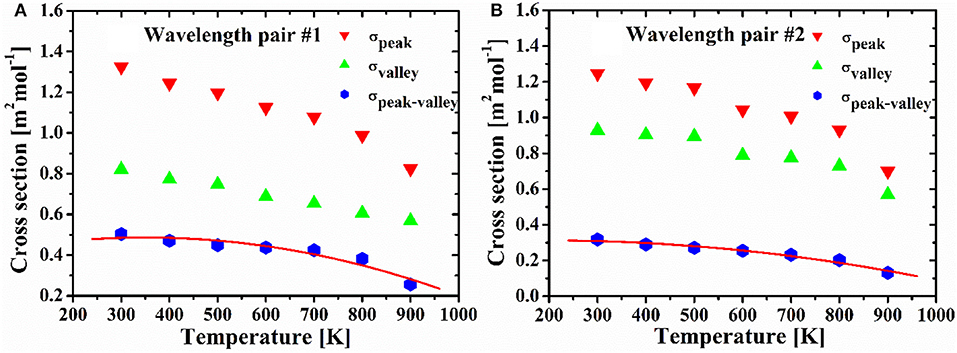
Figure 4. The absorption cross sections of the selected peaks and valleys, and their differential cross sections (σpeak−valley) of wavelength pair #1 (A) and #2 (B) as a function of temperature at 1 atm.
Measurement of Temperature and C2H4 Concentration
Experiments with a controlled C2H4-N2 mixture over the measured range of temperature are performed to validate the accuracy of temperature and C2H4 concentration, inferred from the differential fractional transmission. The top row of Figure 5 shows the comparison between the measured temperatures and the average values recorded by three thermocouples. Each data point represents the mean of temperature obtained from multiple measurements. It can be seen that the measured temperatures agree well with the reading of the thermocouple in the experimental temperature range.
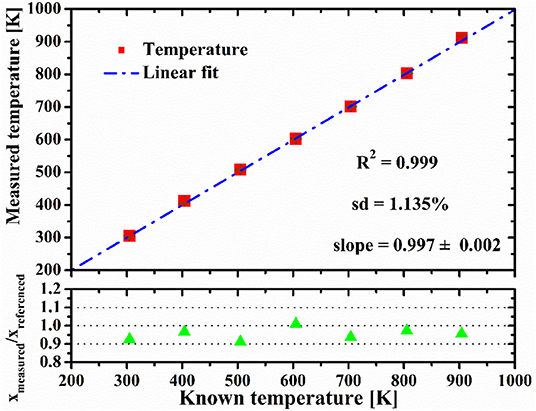
Figure 5. Comparison between the measured temperature and the average of reading of three thermocouples (top row); ratio of the measured C2H4 concentrations (Xmeasured.) and the concentrations recorded during gas premixing (Xreferenced.) (bottom row).
The consistency of measurement resulting at low temperature is better than that at high temperature, which can be explained by the reduction of SNR at high temperature. Correlation of the measured data points has an R-squared value of 0.999, and the mean value of the standard deviations is 1.135%. The liner fitting slope is 0.997 ± 0.002, and there is an average bias about 4 K between the measured temperature and the thermocouple reading. The bottom row of Figure 5 shows the ratio of the measured C2H4 concentration (Xmeasured.) and the recorded C2H4 concentration during gas premixing (Xreferenced.). The C2H4 concentrations are calculated using the wavelength pair #1 which have bigger differential absorption. The average standard deviation is 2.215% between the measured and reference values of C2H4 concentration. The reasonable consistency between the measured and referenced values confirms the practicability of the differential absorption technique for measurement of temperature and C2H4 concentration in this work.
Precision and Sensitivity
In order to validate measurement precision and stability, time series measurement is performed for a C2H4/N2 mixture with concentration of 0.5% sealed in a high temperature cell during 33 min. The measured data was obtained for each 1 s, and 2,000 data points are obtained in the measurement. The histogram plot of measured data used to evaluate the measurement precision for C2H4 concentration is shown in Figure 6. As shown in this figure, the histogram demonstrated a good Gaussian distribution, and the measurement precision for C2H4 concentration is 20.3 ppm, which can be determined by the half width at half maximum (HWHM) of the Gaussian profile [15].
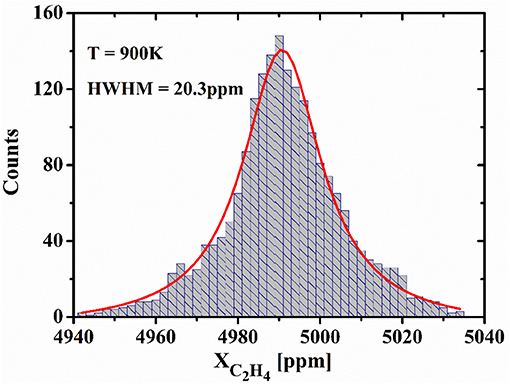
Figure 6. Histogram plot acquired from time series measurements for a C2H4/N2 mixture sealed in the high temperature cell.
The Allan-Werle analysis can be used to evaluate the sensitivity of the system [30]. Figure 7 shows the Allan-Werle variance obtained from the successive measurement to validate the sensitivity of the measurement. The Allan-Werle analysis shows when the average time of the system is 340 s, the corresponding minimum detection limit of the C2H4 concentration can be down to 6.6 ppm. The high sensitivity and measurement precision confirm the good performance of the system based on differential absorption scheme.
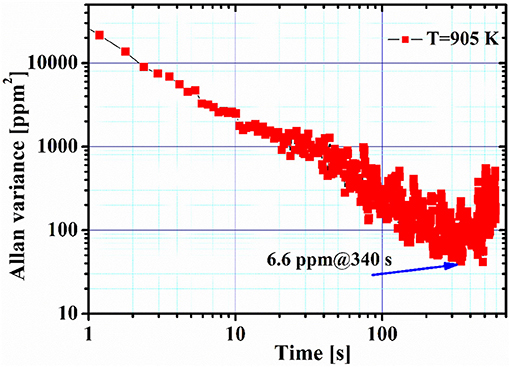
Figure 7. Allan-Werle variance plot obtained from continuous time series measurements.
Conclusion
A TDLAS based system for simultaneous measurements of C2H4 concentration and temperature is achieved with the help of the differential absorption scheme which can eliminate the inferences from other species. The measurements are performed with C2H4/N2 mixture of different concentrations in a static cell from 300 to 900 K at normal atmosphere. The comparison between the measured values and referenced values confirms the accuracy and reliability of the system. The measurement precision for C2H4 concentration is 20.3 ppm at 900 K. According to the Allan-Werle variance analysis, a sensitivity of 6.6 ppm can be achieved with an averaging time of 340 s. In the future, we will improve the performance of the system to extend its applicability to study the fields of the shock tube, the internal combustion engine, or flames of different types.
Data Availability Statement
The datasets generated for this study are available on request to the corresponding author.
Author Contributions
TZ was responsible for the experimental setup and writing. GZ and XL were responsible for the data processing and picture editing of this paper. GG was responsible for the verification of the overall experiment, and TC was responsible for the revision of the paper. All the authors made positive contributions to the work.
Funding
This work was funded by the National Natural Science Foundation of China (NSFC) (61875079, 61805110, 61475068, and 11104237) and the Science and Technology Program of Xuzhou City (no. KC19202).
Conflict of Interest
The authors declare that the research was conducted in the absence of any commercial or financial relationships that could be construed as a potential conflict of interest.
References
1. Girard JJ, Spearrin RM, Goldenstein CS, Hanson RK. Compact optical probe for flame temperature and carbon dioxide using interband cascade laser absorption near 4.2 μm. Combust Flame. (2017) 178:158–67. doi: 10.1016/j.combustflame.2017.01.007
2. Hwan HK, Sang HW, Jeffrey S, Zheng C, Yiguang J. Measurements of the critical initiation radius and unsteady propagation of n-decane/air premixed flames. Proc Combust Inst. (2013) 34:929–36. doi: 10.1016/j.proci.2012.07.035
3. Li S, Farooq A, Hanson RK. H2O temperature sensor for low-pressure flames using tunable diode laser absorption near 2.9 μm. Meas Sci Technol. (2011) 22:125–301. doi: 10.1088/0957-0233/22/12/125301
4. Lozano A, Yip B, Hanson RK. Acetone - a tracer for concentration measurements in gaseous flows by planar laser-induced fluorescence. Exp Fluids. (1992) 13:369–76. doi: 10.1007/BF00223244
5. Yu X, Chang G, Peng J, Dong H, Yu Y, Gao L, et al. Oxygen concentration distribution measurement of the nozzle flow field by toluene/acetone planar laser-induced fluorescence. Front Phys. (2019) 7:205. doi: 10.3389/fphy.2019.00205
6. Du YJ, Peng ZM, Ding YJ. High-accuracy sinewave-scanned direct absorption spectroscopy. Opt Express. (2018) 26:29550–60. doi: 10.1364/OE.26.029550
7. Cai TD, Gao GZ, Wang MR. Simultaneous detection of atmospheric CH4 and CO using a single tunable multi-mode diode laser at 2.33 μm. Opt Express. (2016) 24:859–73. doi: 10.1364/OE.24.000859
8. Hanson RK. Applications of quantitative laser sensors to kinetics, propulsion and practical energy systems. Proc Combust Inst. (2011) 33:1–40. doi: 10.1016/j.proci.2010.09.007
9. Xing C, Jeffries JB, Hanson RK. Development of laser absorption techniques for real-time, in-situ dual-species monitoring (NO/NH3, CO/O2) in combustion exhaust. Proc Combust Inst. (2013) 34:3583–92. doi: 10.1016/j.proci.2012.05.024
10. Xing C, Jeffries JB, Hanson RK. In situ absorption sensor for NO in combustion gases with a 5.2 μm quantum-cascade laser. Proc Combust Inst. (2011) 33:725–33. doi: 10.1016/j.proci.2010.05.014
11. Ma YF, He Y, Tong Y, Yu X, Tittel FK. Quartz-tuning-fork enhanced photothermal spectroscopy for ultra-high sensitive trace gas detection. Opt Express. (2018) 26:32103–10. doi: 10.1364/OE.26.032103
12. Almodovar CA, Spearrin RM, Hanson RK. Two-color laser absorption near 5 μm for temperature and nitric oxide sensing in high-temperature gases. J Quant Spectrosc Radiat Transf . (2017) 203:572–81. doi: 10.1016/j.jqsrt.2017.03.003
13. Sun K, Sur R, Chao X, Jeffries JB, Hanson RK, Pummill RJ, et al. TDL absorption sensors for gas temperature and concentrations in a high-pressure entrained-flow coal gasifier. Proc Combust Inst. (2013) 34:3593–601. doi: 10.1016/j.proci.2012.05.018
14. Cai TD, Gao GZ, Wang MR, Wang GS, Liu Y, Gao X, et al. High-pressure measurements of temperature and Co2 concentration using tunable diode lasers at 2 μm. Appl Spectrosc. (2016) 70:474–84. doi: 10.1177/0003702815626672
15. Li JS, Deng H, Sun J, Yu BL, Fischer H. Simultaneous atmospheric CO, N2O and H2O detection using a single quantum cascade laser sensor based on dual-spectroscopy techniques. Sens Actuators B Chem. (2016) 231:723–32. doi: 10.1016/j.snb.2016.03.089
16. Ma YF, He Y, Patimisco P, Sampaolo A, Qiao SD, Yu X, et al. Ultra-high sensitive trace gas detection based on light-induced thermoelastic spectroscopy and a custom quartz tuning fork. Appl Phys Lett. (2020) 116:011103. doi: 10.1063/1.5129014
17. Li JS, Yu BL, Zhao WX, Chen WD. A review of signal enhancement and noise reduction techniques for tunable diode laser absorption. Spectrosc Appl Spectrosc Rev. (2014) 49:666–691. doi: 10.1080/05704928.2014.903376
18. Li G, Dong E, Ji W. A near-infrared trace Co2 detection system based on an 1,580 nm tunable diode laser using a cascaded integrator comb (CIC) filter-assisted wavelength modulation technique and a digital lock-in amplifier. Front Phys. (2019) 7:199. doi: 10.3389/fphy.2019.00199
19. He Y, Ma YF, Tong Y, Yu X, Tittel FK. Ultra-high sensitive light-induced thermoelastic spectroscopy sensor with a high Q-factor quartz tuning fork and a multipass cell. Opt Lett. (2019) 44:1904–07. doi: 10.1364/OL.44.001904
20. Ren W, Davidson DF, Hanson RK. IR laser absorption diagnostic for C2H4 in shock tube kinetics studies. Int J Chem Kinet. (2011) 44:423–32. doi: 10.1002/kin.20599
21. Strand CL, Ding Y, Johnson SE, Hanson RK. Measurement of the mid-infrared absorption spectra of ethylene (C2H4) and other molecules at high temperatures and pressures. J Quant Spectrosc Radiat Transf. (2019) 222:122–9. doi: 10.1016/j.jqsrt.2018.10.030
22. Tanaka K, Akishima K, Sekita M, Tonokura K, Konno M. Measurement of ethylene in combustion exhaust using a 3.3-μm distributed feedback interband cascade laser with wavelength modulation spectroscopy. Appl Phys B. (2017) 123:219. doi: 10.1007/s00340-017-6798-4
23. Pyun SH, Cho J, Davidson DF, Hanson RK. Interference-free mid-IR laser absorption detection of methane. Meas Sci Technol. (2011) 22:025303. doi: 10.1088/0957-0233/22/2/025303
24. Sajid MB, Javed T, Farooq A. High-temperature measurements of methane and acetylene using quantum cascade laser absorption near 8 μm. J Quant Spectrosc Radiat Transf. (2015) 155:66–74. doi: 10.1016/j.jqsrt.2015.01.009
25. Gao GZ, Zhang T, Zhang G, Liu X, Cai TD. Simultaneous and interference-free measurements of temperature and C2H4 concentration using a single tunable diode laser at 1.62 μm. Opt Express. (2019) 27:17887–904. doi: 10.1364/OE.27.017887
26. Gao Q, Weng WB, Li B, Aldén M. Gas temperature measurement using differential optical absorption spectroscopy (DOAS). Appl Spectrosc. (2018) 72:1014–20. doi: 10.1177/0003702818760864
27. Parise TC, Davidson DF, Hanson RK. Development of a two-wavelength IR laser absorption diagnostic for propene and ethylene. Meas Sci Technol. (2018) 29:055202. doi: 10.1088/1361-6501/aab02b
28. Mellqvist J, Rosen A. DOAS for flue gas monitoring-temperature effects in the uv/visible absorption spectra of NO, NO2, SO2 and NH3. J Quant Spectrosc Radiat Transf. (1996) 56:187–208. doi: 10.1016/0022-4073(96)00042-8
29. Gordon IE, Rothman LS, Hill C, Kochanov RV, Tan Y, Bernath PF, et al. The HITRAN2016 molecular spectroscopic database. J Quant Spectrosc Radiat Transf. (2017) 203:3–69. doi: 10.1016/j.jqsrt.2017.06.038
Keywords: tunable diode laser absorption spectroscopy (TDLAS), differential absorption scheme, temperature, concentration, measurement
Citation: Zhang T, Zhang G, Liu X, Gao G and Cai T (2020) A TDLAS Sensor for Simultaneous Measurement of Temperature and C2H4 Concentration Using a Differential Absorption Scheme at High Temperature. Front. Phys. 8:44. doi: 10.3389/fphy.2020.00044
Received: 19 December 2019; Accepted: 19 February 2020;
Published: 11 March 2020.
Edited by:
Yufei Ma, Harbin Institute of Technology, ChinaCopyright © 2020 Zhang, Zhang, Liu, Gao and Cai. This is an open-access article distributed under the terms of the Creative Commons Attribution License (CC BY). The use, distribution or reproduction in other forums is permitted, provided the original author(s) and the copyright owner(s) are credited and that the original publication in this journal is cited, in accordance with accepted academic practice. No use, distribution or reproduction is permitted which does not comply with these terms.
*Correspondence: Tingdong Cai, Y2FpdGluZ2RvbmdAMTI2LmNvbQ==