
94% of researchers rate our articles as excellent or good
Learn more about the work of our research integrity team to safeguard the quality of each article we publish.
Find out more
ORIGINAL RESEARCH article
Front. Phys. , 06 December 2019
Sec. Medical Physics and Imaging
Volume 7 - 2019 | https://doi.org/10.3389/fphy.2019.00211
This article is part of the Research Topic Quantification in Nuclear Medicine Imaging View all 11 articles
 Georg Schramm1*
 Michel Koole1
 Stefanie M. A. Willekens1
 Ahmadreza Rezaei1
 Donatienne Van Weehaeghe1
 Gaspar Delso2
 Ronald Peeters3
 Nathalie Mertens1
 Johan Nuyts1
 Koen Van Laere1
Accurate MR-based attenuation correction (MRAC) is essential for quantitative PET/MR imaging of the brain. In this study, we analyze the regional bias caused by MRAC based on Zero-Echo-Time MR images (ZTEAC) compared to CT-based AC (CTAC) static and dynamic PET imaging. In addition, the results are compared to the performance of the Atlas-based AC (AtlasAC) implemented in the GE SIGNA PET/MR software version MP24.
Methods: Thirty static [18F]FDG and eleven dynamic [18F]PE2I acquisitions from a SIGNA PET/MR were reconstructed using ZTEAC (using a research tool, GE Healthcare), single-subject AtlasAC (the default AC in SIGNA PET/MR software version MP24) and CTAC (from a PET/CT acquisition of the same day). In the 30 static [18F]FDG reconstructions, the bias caused by ZTEAC and AtlasAC in the mean uptake of 85 anatomical volumes of interest (VOIs) of the Hammers' atlas was analyzed in PMOD. For the 11 dynamic [18F]PE2I reconstructions, the bias caused by ZTEAC and AtlasAC in the non displaceable binding potential BPnd in the striatum was calculated with cerebellum as the reference region and a simplified reference tissue model.
Results: The regional bias caused by ZTEAC in the static [18F]FDG reconstructions ranged from −8.0 to +7.7% (mean 0.1%, SD 2.0%). For AtlasAC this bias ranged from −31.6 to +16.6% (mean −0.4%, SD 4.3%). The bias caused by AtlasAC showed a clear gradient in the cranio-caudal direction (−4.2% in the cerebellum, +6.6% in the left superior frontal gyrus). The bias in the striatal BPnd for the [18F]PE2I reconstructions ranged from −0.8 to +4.8% (mean 1.5%, SD 1.4%) using ZTEAC and from −0.6 to +9.4% using AtlasAC (mean 4.2%, SD 2.6%).
Conclusion: ZTEAC provides excellent quantitative accuracy for static and dynamic brain PET/MR, comparable to CTAC, and is clearly superior to the default AtlasAC implemented in the SIGNA PET/MR software version MP24.
Since the introduction of combined PET/MR, accurate attenuation correction (AC) for brain imaging has always been a field of active research. Neglecting higher bone attenuation of the skull in the first generation segmentation-based AC methods used in product implementations led to a substantial spatially-varying bias in the reconstructed tracer uptake [1]. To include patient-specific information about higher bone attenuation, two concepts for MR-based attenuation correction (MRAC) were investigated by different research groups. On the one hand, ultra short echo time (UTE) MR sequences that allow to generate signal in cortical bone were used to segment bone structures in the skull [2–8]. On the other hand, the use of single [9–11] or multi MR-CT atlas [12, 13] information to generate attenuation images including higher bone attenuation were proposed. On top of methods relying on MR images, Benoit et al. [14] and Rezaei et al. [15] evaluated the use of joint estimation of activity and attenuation for non-TOF and TOF brain PET/MR, respectively. Renner et al. [16] proposed to integrate a transmission source rotating in a MR-compatible hydraulic system directly into a dedicated head coil. Recently, Ladefoged et al. [17] showed in a multi-center evaluation that the bias introduced by MRAC in brain PET/MR imaging can be reduced to ±35% when using different second generation atlas- or UTE-based AC techniques developed by different research groups.
Weiger et al. [18] and Wiesinger et al. [19] showed that zero echo time (ZTE) MR sequences have great potential in imaging materials with short such as cortical bone. Since ZTE sequences only use a single echo, their acquisition time is substantially shorter compared to UTE sequences that usually acquire two echos. In addition, faster switching from transmit to receive in the ZTE sequence minimizes loss of signal in tissues with short relaxation times such as cortical bone. Due to the use of minimal gradient switching, ZTE is less prone to eddy current artifacts than UTE [19, 20]. Moreover, a correlation between the ZTE MR signal intensity and CT Hounsfield units (HU) in cortical bone was demonstrated in Wiesinger et al. [19].
Consequently, ZTE MR imaging is very promising for accurate AC in brain PET/MR. Delso et al. [21] showed that ZTE-based skull segmentation, which is needed to generate attenuation images including higher bone attenuation, is feasible. Boydev et al. [22] showed that the use of ZTE MR images in their atlas-based prediction of pseudo CTs improved the correctness of the pseudo CTs for radiation therapy planning in case of bone resection surgery prior to the radiation therapy compared to using T1-weighted MR images as input.
Sekine et al. [20], Khalife et al. [23], Yang et al. [24], Leynes et al. [25], Wiesinger at al. [26], and, Delso et al. [27] demonstrated that the quantitative accuracy of PET images reconstructed with ZTE-based attenuation images is high. Gong et al. [28] recently showed that attenuation images generated by a neural network using Dixon and ZTE MR images as input outperform attenuation images from a network that only uses a Dixon MR as input in terms of bias in the reconstructed PET images. Moreover, the approach using the neural network was also superior to the vendor-supplied ZTE segmentation approach.
So far, no evaluation of ZTE-AC for absolute quantification of dynamic receptor studies (e.g., in terms of non-displaceable binding potential or distribution volume) has been published. The influence of attenuation correction on parameters derived from kinetic modeling is more complex especially in case when reference tissue models are used. In those cases, it is important to have accurate attenuation correction for the target region (e.g., the striatum) as well as for the reference region (e.g., the cerebellum).
To study the influence of ZTE-based AC on the accuracy of tracer kinetic modeling using the simplified reference tissue model, we analyzed eleven dynamic PET/MR acquisitions with the highly selective dopamine transporter tracer [18F]PE2I. In addition, we investigated the regional quantitative accuracy of ZTE-based AC in 30 static [18F]FDG PET/MR acquisitions.
We included 48 subjects that participated in two PET/MR research protocols in the context of neurodegenerative diseases. Thirty-four patients suspected for dementia were investigated with a static [18F]FDG PET/MR protocol between October 2016 and June 2017. Three patients were excluded from this comparison study due to dental implants which led to metal artifacts in the MR images. In one case the patient was positioned too low in the head coil which led to very low ZTE MR signal in the caudal end of the head due to low coil sensitivity in that region. This case was excluded as well. The mean age of the remaining 30 patients was 63 y (range 40–77 y). In addition, we analyzed 14 dynamic [18F]PE2I acquisitions of healthy controls (mean age 40.8 y, range 21–70 y). As in the case of the static acquisitions, three cases had to be excluded due to metal artifacts caused by dental implants.
All patients were examined on a SIGNA 3T TOF PET/MR (GE Healthcare, Chicago, US) [29]. The static [18F]FDG PET/MR protocol included a 25 min static PET acquisition 66±9 min after tracer injection (mean injected dose 144±31 MBq). For the 11 [18F]PE2I cases, 60 min of dynamic PET data were acquired directly after tracer injection (mean injected dose 153±15 MBq). During the PET acquisitions a LAVA flex MR [acquisition details: repetition time (TR) 4 ms, echo time (TE) 2.23 ms, flip angle (α) 5°, matrix 256 × 256 × 120, voxel size 1.95 mm × 1.95 mm × 2.6 mm, number of averages 0.7, acquisition time: 18 s], a ZTE MR (acquisition details: 3D radial acquisition, α.8°, matrix 110 × 110 × 116, voxel size 2.4 mm × 2.4 mm × 2.4 mm, number of averages 4, bandwidth ± 62.5 kHz, acquisition time 42 s) and other study-specific MR sequences were acquired. Among the study-specific MR sequences were a 3D volumetric sagittal T1-weighted BRAVO sequence [acquisition details: TE 3.2 ms, TR 8.5 ms, inversion time (TI) 450 ms, α 12°, receiver bandwidth ± 31.2 kHz, number of exicatations (NEX) 1, voxel size 1 mm × 1 mm × 1 mm] and a 3D sagittal T2-weighted CUBE FLAIR sequence [acquisition details: TE 137 ms, number of echoes 1, TR 8,500 ms, TI 50 ms, receiver bandwidth ±31.25 kHz, NEX 1, voxel size 1.2 mm × 1.3 mm × 1.4 mm] The T1-weighted and FLAIR MR sequences were used to define regions of interest in the brain in our analysis. In all cases, a standard head coil (8-channel HR brain, GE Healthcare) was used for the MR acquisitions. This coil was validated to ensure that the achievable transmit to receive switching time was short enough for zero echo time imaging purposes.
All subjects underwent a PET/CT acquisition before ([18F]FDG cases) or after ([18F]PE2I cases) the PET/MR acquisition. The PET/CT acquisitions were performed on a Siemens Biograph 16 or with a Siemens Biograph 40 (Siemens Healthcare, Erlangen, Germany) PET/CT. All PET/CT examinations included a low-dose CT acquisition (120 kV, 11 mAs) which was used to generate a CT-based attenuation image taken as the ground truth in the study.
The PET raw data from all PET/MR acquisitions were reconstructed with three different methods for attenuation correction, shown in Figure 1. First, a GE atlas-based attenuation image (default method in the SIGNA PET/MR software version MP24) was used to reconstruct PETAtlasAC. Subsequently, a GE ZTE-based attenuation image and a co-registered CT-based attenuation image were used to reconstruct PETZTEAC and PETCTAC, respectively. The generation of all attenuation images is described in detail in the following subsection. The reconstructions of the static PET data sets were performed offline with the GE reconstruction toolbox v.1.28 (GE Healthcare, Chicago, US) using time of flight ordered subset maximum likelihood expectation maximization (TOF OSEM) with 4 iterations and 28 subsets, a voxel size of 1.17 mm × 1.17 mm × 2.78 mm, and a Gaussian post-smoothing with an FWHM of 4 mm.
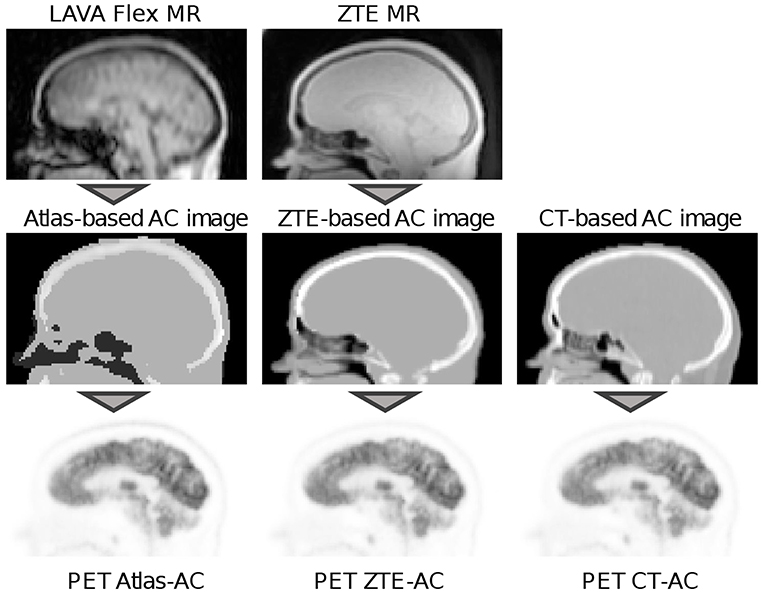
Figure 1. Workflow of the PET reconstructions used in this study. In the reconstruction of PETAtlasAC an atlas-based attenuation image that was derived from a LAVA flex MR image was used for attenuation correction (left column). The atlas-based attenuation image was generated with the vendor-provided software version MP24. In the reconstruction of PETZTEAC attenuation correction was performed using a ZTE-based attenuation image that was derived from a ZTE MR image (middle column). The ZTE MR post-processing was done with a research tool provided by the vendor. For PETCTAC a co-registered CT-based attenuation image from a PET/CT acquisition of the same day was used. In all attenuation images, templates for the bed and the head coil were added.
Reconstruction of the dynamic [18F]PE2I PET data sets was performed on the scanner (software version MP24.R03). The acquired listmode data were split into 32 frames (frame length 10–360 s). All frames were reconstructed with TOF OSEM with 4 iterations and 28 subsets, a voxel size of 1.56 mm × 1.56 mm × 2.78 mm and a Gaussian post-smoothing with an FWHM of 3 mm.
First, the atlas-based attenuation images were generated with the GE reconstruction toolbox v.1.28 which uses the same post-processing algorithm as implemented in the software release of the SIGNA PET/MR (MP24.R03). The algorithm uses a non-rigid registration of an input in-phase LAVA flex MR image to an atlas of predefined attenuation images [30, 31]. The resulting atlas-based attenuation images are post-smoothed with a Gaussian kernel with FWHM ca. 10 mm.
Second, the ZTE-based attenuation images were generated by post-processing the ZTE MR images with a research tool provided by GE (v.1.6.2). Software release MP26 of the SIGNA PET/MR contains an option to use this algorithm for ZTE-based AC. The ZTE post-processing algorithm identifies bone voxels based on the ZTE image intensity and assigns continuous bone attenuation values [19–21]. The bone segmentation in the ZTE post-processing is completely model-free. To avoid misclassifications of air, tissue and bone in the nasal region, the ZTE post-processing algorithm v.1.6.2 uses the sinus/edge correction evaluated in Yang et al. [24]. Details of the ZTE post-processing algorithm that was used in our analysis are given in Delso et al. [27].
The vendor-provided ZTE post-processing has several input parameters. For all parameters but one (the partial volume slope) we used the default values suggested by the vendor. We used a value of 2 for the parameter for the partial volume slope which was obtained based on an evaluation of the results of the first 15 static subjects. The main influence of the partial volume slope parameter that we observed was a change in the size of the outer contour of the head (transition between background air and soft tissue of the skin). By changing the partial volume slope we obtained better agreement with the size of the outer contours derived from the CT-based attenuation images. When using the default partial volume slope of 1, the outer contour of the head is dilated by 1 voxel (2.4 mm) compared to using a partial volume slope of 2. This in turn led to a small global positive bias of 3%. All ZTE-based attenuation images were post-smoothed with a Gaussian kernel with FWHM 4 mm.
Third, after automatically removing the patient bed and cushions, the low-dose CT images from the PET/CT acquisition were rigidly co-registered to the in-phase LAVA flex MR. Subsequently, the Hounsfield units of the co-registered CT were scaled to 511-keV attenuation coefficients by using the GE-provided multi-linear scaling. We verified that the Siemens and GE scaling for 120 kV are virtually identical up to 1,200 HU (where GE decreases the slope while Siemens does not). After adding the templates for the PET/MR patient table and the head coil, a CT-based attenuation image that could be used to reconstruct the PET/MR raw data was obtained. All CT-based attenuation images were also post-smoothed with a Gaussian kernel with FWHM 4 mm.
The axial field of view (FOV) of the ZTE MR (limited by the sensitivity of the head coil) and the one of the CT was slightly smaller than the axial FOV of the PET detector rings in the SIGNA PET/MR. To complete areas in the neck and shoulders where ZTE or CT image information was not available, a simple segmentation-based two class attenuation image based on the LAVA flex MR image was used.
For all static acquisitions the mean uptake in 85 anatomical volumes of interest (VOIs) was calculated in PETAtlasAC, PETZTEAC, and PETCTAC. The VOIs were defined in the neuro tool of PMOD v.3.8 (PMOD technologies LCC, Zurich, Switzerland) using the Hammers atlas [32]. In every VOI we calculated the fractional bias of the mean uptake as
where aCTAC(VOI) is the mean uptake of the VOI in PETCTAC that was used as the gold standard and aAtlasAC(VOI) and aZTEAC(VOI) are the mean uptake of the VOI in PETAtlasAC and PETZTEAC, respectively. In three subjects (6, 7, and 21), the caudal end of the occipital skull was not completely in the FOV in the attenuation CT. In those subjects, the cerebellum VOIs were excluded from the analysis. All VOIs were grouped according to their anatomical location into the following groups: frontal cortex, temporal cortex, parietal cortex, occipital cortex, medial temporal cortex, striatum, thalamus, cerebellum, and cerebral white matter. All VOIs and the assigned groups (regions) are listed in Tables S1, S2. A Wilcoxon signed-rank test was used to test whether the subject averaged mean of aAtlasAC and aZTEAC is different from aCTAC in all VOIs and regions.
To analyze the robustness of the vendor-provided atlas-based and ZTE-based attenuation correction, we applied the metric proposed in the multi-center evaluation of Ladefoged et al. [17]. This metric calculates the fraction of subjects in which the MRAC-introduced voxel bias of at least a given fraction of brain voxels is within ±5, ±10, ±15%. As mentioned in Ladefoged et al. [17], for a perfect AC method, the bias in the whole brain of all subjects would be within ±0%. The results of this metric were visualized in a characteristic curve for the three bias thresholds ±5, ±10, ±15%. As in Ladefoged et al. [17], we also analyzed three subjects with the biggest fraction of voxels exceeding a bias of ± 10%.
Regional time activity curves (TACs) were extracted for the left and right caudate nucleus, left and right putamen, and the cortex of the cerebellum. All VOIs were defined based on the 3D T1 BRAVO MR image using the Freesurfer image analysis suite which is documented and freely available online (http://surfer.nmr.mgh.harvard.edu/) [33]. Subsequently, we used the simplified reference tissue model (SRTM) with the cerebellar grey matter as reference region to estimate binding potential values (BPnd) in the four striatal VOIs.
As proposed in Lammertsma and Hume [34] and validated for [18F]PE2I in Sasaki et al. [35], the tissue response Ct(t) was modeled as
where Cr(t) is the TAC of the reference tissue (the cerebellum), R1 is the ratio between K1 of the tissue and reference tissue, and * denotes the convolution operator. The parameters R1, k2, and BPnd were obtained with non-linear curve fitting using the python package lmfit (v.0.9.7).
Similar to Equations (1) and (2), we calculated the bias of BPnd, R1, and k2 in the four striatal VOIs for PETAtlasAC and PETZTEAC compared to PETCTAC. In all VOIs, a Wilcoxon signed-rank test was used to test whether the subject averaged mean of BPnd,AtlasAC and BPnd,ZTEAC differ from BPnd,CTAC.
Figures 2, 3 and Tables S3, S4 show the results for the regional bias in the static [18F]FDG reconstructions caused by ZTEAC and AtlasAC compared to CTAC on a subject and regional level, respectively. Globally the bias ranges from −31.6 to +16.6% with a mean of −0.4% and a standard deviation of 4.3% for PETAtlasAC. For PETZTEAC the bias ranges from −8.0 to +7.7% with a mean of 0.1% and a standard deviation of 2.0%. Excluding the outliers based on the boxplot shown in Figure 3 reduces the global bias range to −12 to +14% for PETAtlasAC and to −5.5 to +5.5% for PETZTEAC.
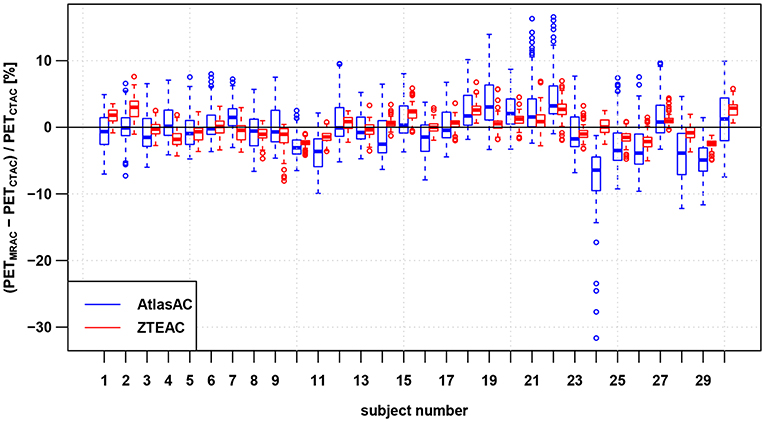
Figure 2. Regional bias in the PET reconstruction caused by AtlasAC (blue) and ZTEAC (red) compared to CTAC for all 30 static PET acquisitions. Each box plot shows the bias distribution over the 85 anatomical VOIs. The rectangular boxes represent the interquartile ranges (IQR) and the horizontal line are the medians. The upper ends of the whiskers are at the minimum of the third quartile plus 1.5IQR and the biggest data point The lower ends of the whiskers are at the maximum of the first quartile minus 1.5IQR and the smallest data point. Outliers are plotted as open circles. Please note that the VOIs in the cerebellum had to be excluded in three subjects (6, 7, 21).
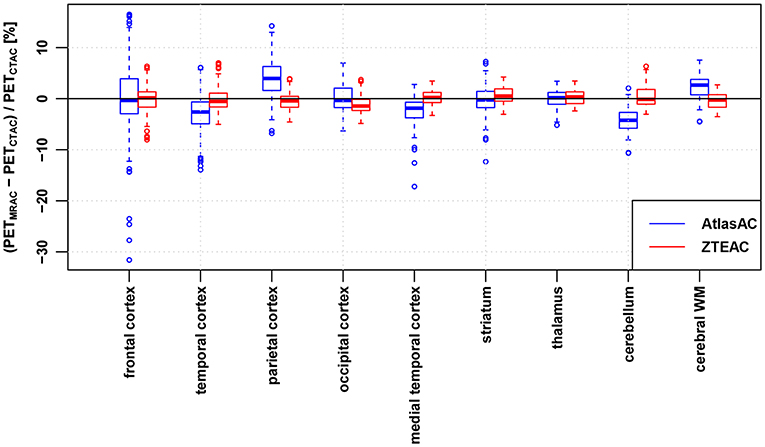
Figure 3. Regional bias in the PET reconstruction caused by AtlasAC (blue) and ZTEAC (red) compared to CTAC as a function of the VOI location in the brain. Please note that the VOIs in the cerebellum had to be excluded in three subjects (6, 7, 21).
On a subject level, Figure 2 and Table S3 demonstrate that ZTEAC strongly reduces the inter- and intra-subject variability in the bias. In subject 24 where the non-rigid alignment to the atlas failed, PETAtlasAC showed severe negative bias of more than −25% in the orbitofrontal cortical VOIs (see Figure 5). In these VOIs of subject 24, the bias of PETZTEAC was <1.6%.
On a regional level, Figure 3 and Table S4 show that ZTEAC strongly reduces the inter- and intra-regional variability in the bias, as well as the mean bias in the frontal cortex, temporal cortex, parietal cortex, medial temporal cortex, cerebellum, and cerebral white matter. In all regions shown in Figure 2, the mean bias in PETZTEAC is between −1.2 and +0.6%. PETAtlasAC shows a distinct negative bias in the cerebellum (mean −4.2%) and distinct positive bias in the parietal cortex (mean +4%).
On a VOI level, Figure 4 and Tables S1, S2 demonstrate that ZTEAC strongly reduces the inter- and intra-VOI variability in the bias, as well as the mean bias in almost all VOIs. The mean VOI bias caused by ZTEAC ranges from −1.8% in the lateral remainder of the left occipital lobe to +2.2% in the left lateral ventricle. In PETAtlasAC, a distinct gradient in the mean VOI bias in the cranio-caudal direction is visible. The mean VOI bias caused by AtlasAC ranges from −4.5% in the cerebral white matter to +6.6% in the left superior frontal gyrus. In PETZTEAC, only 1.4% of the analyzed VOIs in all subjects had a bias of more than 5% whereas in PETAtlasAC 20.3% of all VOIs showed a bias of more than 5%.
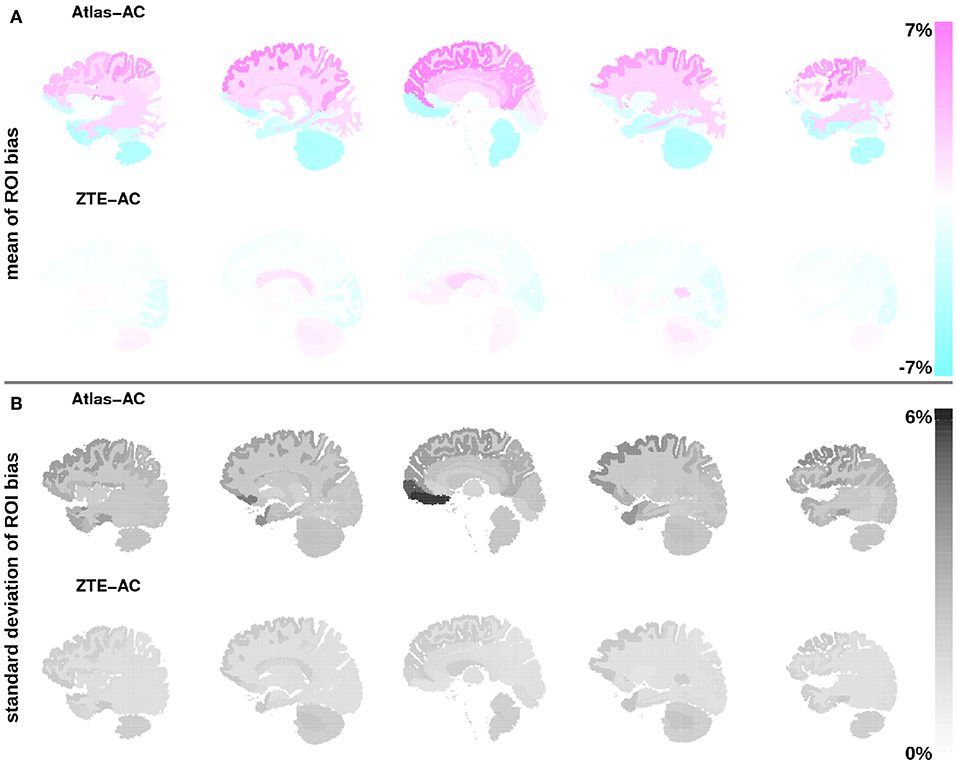
Figure 4. (A) Mean of bias in the PET reconstruction in all 85 anatomical VOIs averaged over all 30 static PET acquisitions for Atlas-AC (top row) and ZTE-AC (bottom row). (B) Standard deviation of VOI bias. The VOI location is visualized in five sagittal slices using the brain anatomy of subject 1. Please note that the VOIs in the cerebellum had to be excluded in three subjects (6, 7, 21).
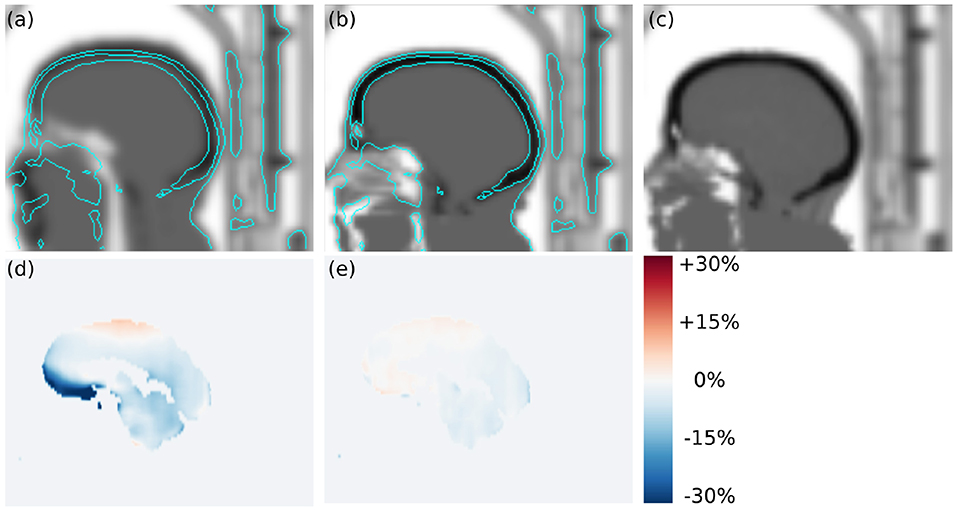
Figure 5. Transversal slices of (a) atlas-based attenuation image, (b) ZTE-based attenuation image, (c) CT-based attenuation image, (d) regional bias in PETAtlasAC, and (e) regional bias in PETZTEAC of subject 24. In this case, the template registration in the atlas-based attenuation image failed which caused a misclassification of soft tissue voxels as air voxels in the frontal region. The cyan contour lines show the head contour in the CT-based attenuation image for comparison. As a result of the underestimated attenuation PETAtlasAC shows strong negative bias of up to −32% in the left straight gyrus.
Figure 6 shows the results of the outlier metric [17] for biases within (±5, ±10, ±15%). Again, the performance of ZTE-based attenuation correction is much better than the one of the atlas-based attenuation correction. At least 95/77% of all brain voxels in all subjects show a bias within ±10% for PETZTEAC/PETAtlasAC. For a bias within ±5% the corresponding values are 82/46% and for a bias within ±15% the corresponding values are 97/89%. Table 1 shows the results of the three worst outliers in terms of subjects with highest voxel bias, highest VOI bias and highest fraction of the brain exceeding a bias of ±10%.
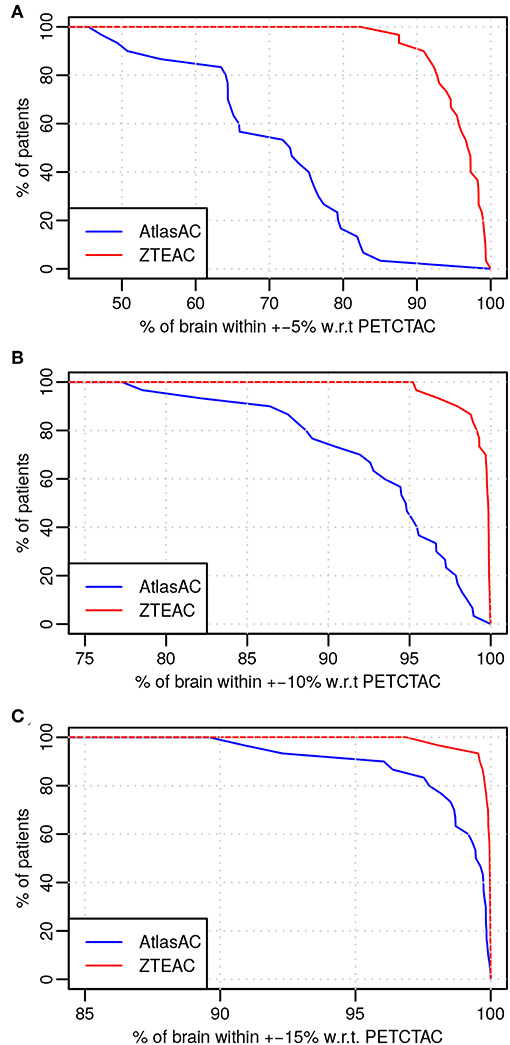
Figure 6. Outlier analysis [17] of the 30 static acquisitions for PETZTEAC (red) and PETAtlasAC (blue) for the bias thresholds of (A) 5%, (B) 10%, and (C) 15%. Note the different scale on the x-axis.
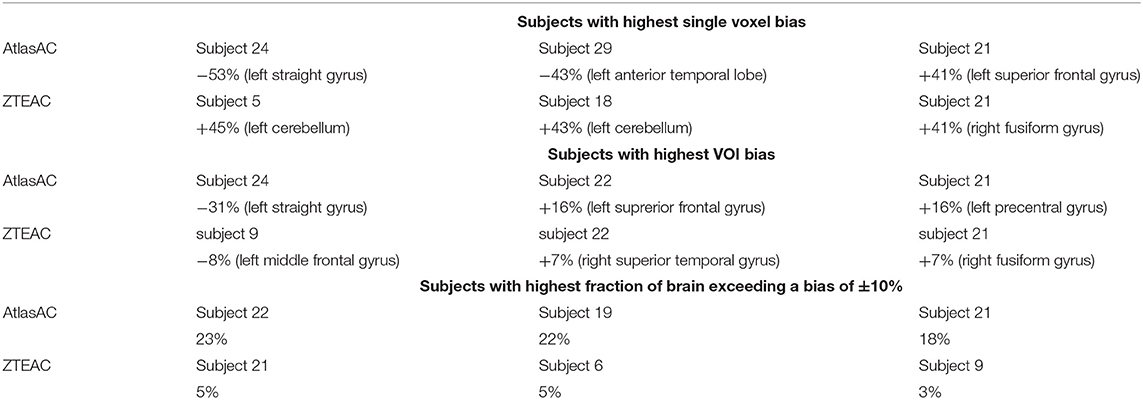
Table 1. Results of outlier analysis of the static acquisitions in terms of subjects with highest voxel bias, highest VOI bias, and highest fraction of brain exceeding a bias of ±10%.
Figure 7 and Table S5 summarize the bias in the modeled BPnd in four different regions of the striatum using the cerebellum as reference region and TACs derived from PETAtlasAC and PETZTEAC compared to TACs from PETCTAC. The bias in the BPnd ranges from −0.6% (right putamen in subject 11) to +9.4% (left caudate nucleus subject 9) for PETAtlasAC and from −0.8% (right putamen subject 3) to +4.8% (right caudate nucleus subject 8) for PETZTEAC. The right caudate nucleus shows the biggest subject averaged regional bias (5.1±2.6%, p = 0.003 for PETAtlasAC and 2.0±1.5%, p = 0.006 for PETZTEAC). In addition, Figures S1–S3 show the bias in the time activity curves, and the R1 and k2 estimates in PETAtlasAC and PETZTEAC, respectively.
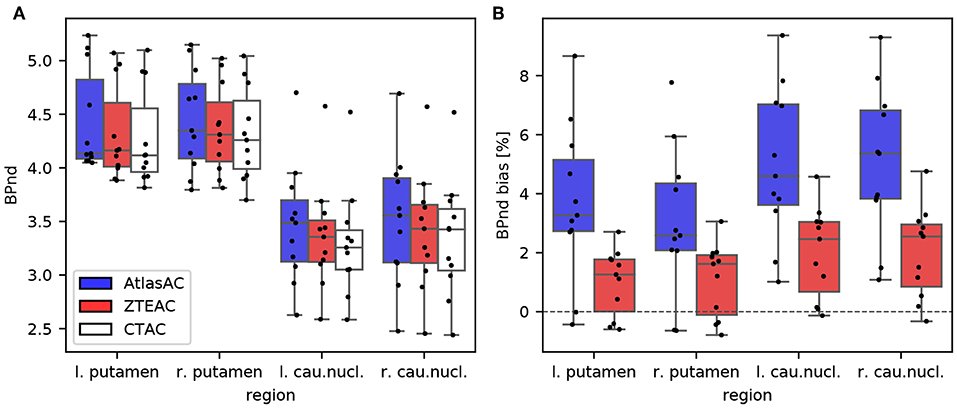
Figure 7. (A) Boxplot of BPnd values in four striatal regions of the 11 [18F]PE2I subjects obtained from PETAtlasAC, PETZTEAC, and PETCTAC. (B) Bias in BPnd estimation in PETAtlasAC, PETZTEAC compared to PETCTAC.
Our analysis demonstrates that the bias caused by ZTEAC compared to CTAC as ground truth for brain PET/MR is small. The magnitude of the maximum bias of 8% is in agreement with the analysis of Sekine et al. [20]. In contrast to Sekine et al. [20], we have evaluated more static PET as well as dynamic PET acquisitions. Moreover, the subjects in our analysis underwent a PET/MR protocol with realistic PET acquisition times whereas [20] only used an additional 2 min PET/MR exam after a PET/CT acquisition.
In contrast to the earlier evaluation of the quantitative accuracy of the AtlasAC [30, 31] (range of VOI bias −5 to +7.3%), our analysis showed that the AtlasAC implemented in the SIGNA PET/MR software version MP24, can lead to individual regional underestimations of up to −32% (as observed in subject 24). A possible reason for the discrepancy is the fact that the number of subjects in Sekine et al. [30, 31] was much smaller compared to our study. In this work, the biggest underestimations were found in a single subject (24) where the alignment of the atlas to the patient anatomy failed (see Figure 5) which caused a misclassification of some soft-tissue voxels as air voxels (pharynx) in the frontal region. Since the atlas alignment is highly subject dependent, failures are hard to predict. As demonstrated in subject 24, those failures can occur with the investigated implementation of the AtlasAC leading to severe problems in regional quantification.
As observed in Sekine et al. [20], another drawback of the AtlasAC is the fact that the introduced bias in the PET reconstruction shows a clear gradient in the cranio-caudal direction. Caudal VOIs such as the cerebellum (ca −4.2%) and the anterior lateral temporal lobe (−4.2%) show negative bias. This is because part of the temporal and occipital bone are classified as soft tissue in the AtlasAC. Moreover, there is a gross underestimation of the anterior part of the head including the oropharynx, nasal cavities, and cartilage tissue.
On the other hand, the superior cortical areas (frontal-parietal) show positive bias (+6.6% in the left superior frontal gyrus). This overestimation is caused by the fact that (a) the thickness of the superior skull seems overestimated in the AtlasAC and (b) the atlas-based attenuation image is heavily post-smoothed such that some soft tissue voxels in the superior gyri in the attenuation image are affected by spill over from skull voxels.
The cranio-caudal gradient in the bias distribution affects especially cerebral kinetic modeling analysis when using the cerebellum as the reference region. This could be demonstrated in the kinetic modeling of the binding potential in the striatum of the 11 [18F]PE2I subjects. As a consequence of the observed negative bias in the cerebellum compared to the striatum in PETAtlasAC in the static cases, AtlasAC leads to a small but systematic and significant overestimation of the binding potential of [18F]PE2I in the striatum (ca. +5% in the caudate nucleus and +3.3% in the putamen). This positive bias can be understood by looking at Equation (3). Under the assumptions that BPnd ≫ 1 and 1 + BPnd ≫ R1 (which both are fullfilled for [18F]PE2I in the striatum), it can be seen that scaling Cr(t) with α and at the same time scaling R1, k2, and BPnd with α−1 yields the same tissue response Ct(t). Since we can deduce from the analysis of the static examinations that Cr(t) in the cerebellum is underestimated by ca. 4% and that there is almost no bias in the striatum (Ct(t)), we would expect a 4% overestimation in R1, k2, and BPnd which is in accordance with the results of the dynamic analysis as shown in Figure 7 and Figures S2, S3.
Using ZTEAC strongly reduces this bias in BPnd (ca. +2.0% in the caudate nucleus and +1.1% in the putamen). The performance of ZTEAC in the context of dynamic PET imaging is comparable to the MaxProb multi atlas-based attenuation correction method. In [36], Merida et al. showed that the MaxProb method leads to a regional bias of −2 to +5% in the BPnd of seven subjects examined with [18F]MPPF.
It has been shown [31, 37] and should be noted that the AtlasAC method implemented in the SIGNA PET/MR software version MP24, is clearly outperformed by more advanced atlas-based methods. Since the focus of this study was to analyze the performance of the ZTE-based attenuation correction, a detailed analysis of more advanced atlas-based methods for MR-based attenuation correction is beyond the scope of this study.
Compared to the detailed multi-center study of 11 methods for brain attenuation correction for the Siemens mMR in 359 subjects by Ladefoged et al. [17], it can be seen that the results for the regional quantitative accuracy of ZTEAC are comparable to the best methods in Ladefoged et al. [17] which showed a global mean bias in the range of −0.4% to +0.8% with a standard deviation of 1.2% to 1.9%. Also in terms of robustness (as seen in the standard deviation in the VOI-averaged bias) and in terms of outlier behavior ZTEAC performs comparably to the best methods of Ladefoged et al. [17]. However, it should be noted that we could only analyze 30 subjects which influences the detection of (rare) outliers.
Among the five best methods in Ladefoged et al. [17] are three template-/atlas-based methods [9, 13, 37] and two ultra short echo time MR (UTE) segmentation-based methods [4, 5]. Compared to the template-/atlas-based methods, the current ZTEAC for brain has the advantage that it does not rely on any anatomical prior information. This might be beneficial in subjects with very abnormal brain anatomy (e.g., after surgery or traumatic brain injury) which needs further validation.
Finally, the fact that we had to exclude 6 out of 48 patients (12.5%) due to MR artifacts caused by dental implants demonstrates that there is a need for a reliable method for compensation of metal artifacts that can be applied in clinical routine.
A potential limitation of the study is the fact that the attenuation CTs used for CTAC were acquired on a Siemens PET/CT system, but scaled to linear attenuation coefficients with the multi-linear scaling provided by GE. This might lead to small residual uncertainties in the linear attenuation coefficients of the ground truth CTAC due to the fact that the vendor-specific scaling procedures might be optimized for different effective x-ray spectra. However, we do not expect this to be a major problem, because the multi-linear scaling curves of GE and Siemens are virtually identical up to 1,200 HU. Note that in software version MP26 of the SIGNA PET/MR, the algorithm that generates the atlas-based attenuation images was updated compared to software version MP24. A detailed analysis of the performance of this updated algorithm is beyond the scope of the manuscript since all our subjects were acquired under software version MP24.
ZTE-based attenuation correction provides excellent quantitative accuracy for static and dynamic PET/MR imaging in all parts of the brain. It is clearly superior to the Atlas-based head attenuation correction implemented in the SIGNA PET/MR software version MP24 and hereby obviates the major concern that was present in the quantitative accuracy of brain PET/MR.
The datasets generated for this study are available on request to the corresponding author.
The studies involving human participants were reviewed and approved by Ethical Committee of UZ Leuven. The patients/participants provided their written informed consent to participate in this study.
GS performed the PET reconstructions, the static PET image analysis, and drafted the manuscript. MK performed the analysis of the dynamic PET images. SW coordinated the study and helped to draft the manuscript. AR helped to perform the PET reconstructions. DV coordinated the study and helped to draft the manuscript. GD performed the postprocessing of the ZTE MR images. RP and NM optimized the ZTE MR sequence on the SIGNA PET/MR at UZ Leuven. JN and KV designed the study and helped to draft the manuscript.
GS was funded by the NIH project 1P41EB017183-01A1. AR and JN are funded by the Research Foundation Flanders (FWO) projects 12T7118N and G.0275.14N.
GD is an employee of GE Healthcare, Cambridge, UK. GS, MK, AR, NM, RP, JN, and KV received travel grants from GE Healthcare for attending workshops. GS and KV received travel grants for presenting PET/MR results at GE user meetings. KU Leuven received a research collaboration grant for partial funding of this study.
The remaining authors declare that the research was conducted in the absence of any commercial or financial relationships that could be construed as a potential conflict of interest.
The Supplementary Material for this article can be found online at: https://www.frontiersin.org/articles/10.3389/fphy.2019.00211/full#supplementary-material
PET, positron emission tomography; MR, magnetic resonance imaging; AC, attenuation correction; MRAC, MR-based AC; ZTE MR, zero echo time MR; ZTEAC, ZTE MR-based AC; CTAC, CT-based AC; AtlasAC, Atlas-based AC; UTE MR, ultra short echo time MR; HU, Hounsfield unit; TOF, time of flight; OSEM, ordered subset maximum likelihood & expectation maximization; FOV, field of view; VOI, volume of interest; TAC, time activity curve.
1. Andersen FL, Ladefoged CN, Beyer T, Keller SH, Hansen AE, Højgaard L, et al. Combined PET/MR imaging in neurology: MR-based attenuation correction implies a strong spatial bias when ignoring bone. Neuroimage. (2014) 84:206–16. doi: 10.1016/j.neuroimage.2013.08.042
2. Keereman V, Fierens Y, Broux T, De Deene Y, Lonneux M, Vandenberghe S. MRI-based attenuation correction for PET/MRI using ultrashort echo time sequences. J Nucl Med. (2010) 51:812–8. doi: 10.2967/jnumed.109.065425
3. Delso G, Carl M, Wiesinger F, Sacolick L, Porto M, Hullner M, et al. Anatomic evaluation of 3-dimensional ultrashort-echo-time bone maps for PET/MR attenuation correction. J Nucl Med. (2014) 55:780–5. doi: 10.2967/jnumed.113.130880
4. Ladefoged CN, Benoit D, Law I, Holm S, Kjær A, Højgaard L, et al. Region specific optimization of continuous linear attenuation coefficients based on UTE (RESOLUTE): application to PET/MR brain imaging. Phys Med Biol. (2015) 60:8047–65. doi: 10.1088/0031-9155/60/20/8047
5. Juttukonda MR, Mersereau BG, Chen Y, Su Y, Rubin BG, Benzinger TLS, et al. MR-based attenuation correction for PET/MRI neurological studies with continuous-valued attenuation coefficients for bone through a conversion from R2* to CT-Hounsfield units. Neuroimage. (2015) 112:160–8. doi: 10.1016/j.neuroimage.2015.03.009
6. Anazodo UC, Thiessen JD, Ssali T, Mandel J, Günther M, Butler J, et al. Feasibility of simultaneous whole-brain imaging on an integrated PET-MRI system using an enhanced 2-point Dixon attenuation correction method. Front Neurosci. (2015) 9:434. doi: 10.3389/fnins.2014.00434
7. Cabello J, Lukas M, Förster S, Pyka T, Nekolla SG, Ziegler SI. MR-based attenuation correction using ultrashort-echo-time pulse sequences in dementia patients. J Nucl Med. (2015) 56:423–9. doi: 10.2967/jnumed.114.146308
8. Cabello J, Lukas M, Rota Kops E, Ribeiro A, Shah NJ, Yakushev I, et al. Comparison between MRI-based attenuation correction methods for brain PET in dementia patients. Eur J Nucl Med Mol Imaging. (2016) 43:2190–200. doi: 10.1007/s00259-016-3394-5
9. Izquierdo-Garcia D, Hansen AE, Forster S, Benoit D, Schachoff S, Furst S, et al. An SPM8-based approach for attenuation correction combining segmentation and nonrigid template formation: application to simultaneous PET/MR brain imaging. J Nucl Med. (2014) 55:1825–30. doi: 10.2967/jnumed.113.136341
10. Paulus DH, Quick HH, Geppert C, Fenchel M, Hermosillo G, Faul D, et al. Whole-body PET/MR imaging: quantitative evaluation of a novel model-based MR attenuation correction method including bone. J Nucl Med. (2015) 56:1061–6. doi: 10.2967/jnumed.115.156000
11. Koesters T, Friedman KP, Fenchel M, Zhan Y, Hermosillo G, Babb J, et al. Dixon sequence With superimposed model-based bone compartment provides highly accurate PET/MR attenuation correction of the brain. J Nucl Med. (2016) 57:918–24. doi: 10.2967/jnumed.115.166967
12. Burgos N, Cardoso MJ, Thielemans K, Modat M, Pedemonte S, Dickson J, et al. Attenuation correction synthesis for hybrid PET-MR scanners: application to brain studies. IEEE Trans Med Imaging. (2014) 33:2332–41. doi: 10.1109/TMI.2014.2340135
13. Merida I, Costes N, Heckemann R, Hammers A. Pseudo-CT generation in brain MR-PET attenuation correction: comparison of several multi-atlas methods. In: IEEE 12th Int Symp Biomed Imaging, Vol. 1. Brooklyn, NY (2015). p. 1431–4. Available online at: http://ejnmmiphys.springeropen.com/articles/10.1186/2197-7364-2-S1-A29
14. Benoit D, Ladefoged CN, Rezaei A, Keller SH, Andersen FL, Højgaard L, et al. Optimized MLAA for quantitative non-TOF PET/MR of the brain. Phys Med Biol. (2016) 61:8854–74. doi: 10.1088/1361-6560/61/24/8854
15. Rezaei A, Schramm G, Willekens SM, Delso G, Van Laere K, Nuyts J. A quantitative evaluation of joint activity and attenuation reconstruction in TOF-PET/MR brain imaging. J Nucl Med. (2019) 60:1649–55. doi: 10.2967/jnumed.118.220871
16. Renner A, Rausch I, Cal Gonzalez J, Frass-Kriegl R, De Lara LN, Sieg J, et al. A head coil system with an integrated orbiting transmission point source mechanism for attenuation correction in PET/MRI. Phys Med Biol. (2018) 63:225014. doi: 10.1088/1361-6560/aae9a9
17. Ladefoged CN, Law I, Anazodo U, St Lawrence K, Izquierdo-Garcia D, Catana C, et al. A multi-centre evaluation of eleven clinically feasible brain PET/MRI attenuation correction techniques using a large cohort of patients. Neuroimage. (2017) 147:346–59. doi: 10.1016/j.neuroimage.2016.12.010
18. Weiger M, Stampanoni M, Pruessmann KP. Direct depiction of bone microstructure using MRI with zero echo time. Bone. (2013) 54:44–7. doi: 10.1016/j.bone.2013.01.027
19. Wiesinger F, Sacolick LI, Menini A, Kaushik SS, Ahn S, Veit-Haibach P, et al. Zero TE MR bone imaging in the head. Magn Reson Med. (2015) 114:107–14. doi: 10.1002/mrm.25545
20. Sekine T, ter Voert EEGW, Warnock G, Buck A, Huellner M, Veit-Haibach P, et al. Clinical evaluation of zero-echo-time attenuation correction for brain 18F-FDG PET/MRI: comparison with atlas attenuation correction. J Nucl Med. (2016) 57:1927–32. doi: 10.2967/jnumed.116.175398
21. Delso G, Wiesinger F, Sacolick LI, Kaushik SS, Shanbhag DD, Hullner M, et al. Clinical evaluation of zero-echo-time MR imaging for the segmentation of the skull. J Nucl Med. (2015) 56:417–22. doi: 10.2967/jnumed.114.149997
22. Boydev C, Demol B, Pasquier D, Saint-Jalmes H, Delpon G, Reynaert N. Zero echo time MRI-only treatment planning for radiation therapy of brain tumors after resection. Phys Med. (2017) 42:332–8. doi: 10.1016/j.ejmp.2017.04.028
23. Khalifé M, Fernandez B, Jaubert O, Soussan M, Brulon V, Buvat I, et al. Subject-specific bone attenuation correction for brain PET/MR: can ZTE-MRI substitute CT scan accurately? Phys Med Biol. (2017) 62:7814–32. doi: 10.1088/1361-6560/aa8851
24. Yang J, Wiesinger F, Kaushik S, Shanbhag D, Hope TA, Larson PEZ, et al. Evaluation of sinus/edge corrected ZTE-based attenuation correction in brain PET/MRI. J Nucl Med. (2017) 58:1873–9. doi: 10.2967/jnumed.116.188268
25. Leynes AP, Yang J, Hope TA. Hybrid ZTE/Dixon MR-based attenuation correction for quantitative uptake estimation of pelvic lesions in PET / MRI. Med Phys. (2017) 44:902–13. doi: 10.1002/mp.12122
26. Wiesinger F, Bylund M, Yang J, Kaushik S, Shanbhag D, Ahn S, et al. Zero TE-based pseudo-CT image conversion in the head and its application in PET/MR attenuation correction and MR-guided radiation therapy planning. Magn Reson Med. (2018) 80:1440–51. doi: 10.1002/mrm.27134
27. Delso G, Kemp B, Kaushik S, Wiesinger F, Sekine T. Improving PET/MR brain quantitation with template-enhanced ZTE. NeuroImage. (2018) 181:403–13. doi: 10.1016/j.neuroimage.2018.07.029
28. Gong K, Yang J, Kim K, El Fakhri G, Seo Y, Li Q. Attenuation correction for brain PET imaging using deep neural network based on Dixon and ZTE MR images. Phys Med Biol. (2018) 63:125011. doi: 10.1088/1361-6560/aac763
29. Grant AM, Deller TW, Khalighi MM, Maramraju SH, Delso G, Levin CS. NEMA NU 2-2012 performance studies for the SiPM-based ToF-PET component of the GE SIGNA PET/MR system. Med Phys. (2016) 43:2334–43. doi: 10.1118/1.4945416
30. Sekine T, Buck A, Delso G, ter Voert EEGW, Huellner M, Veit-Haibach P, et al. Evaluation of atlas-based attenuation correction for integrated PET/MR in human brain: application of a head atlas and comparison to true CT-based attenuation correction. J Nucl Med. (2016) 57:215–20. doi: 10.2967/jnumed.115.159228
31. Sekine T, Burgos N, Warnock G, Huellner M, Buck A, ter Voert EEGW, et al. Multi-atlas-based attenuation correction for brain 18F-FDG PET imaging using a time-of-flight PET/MR scanner: comparison with clinical single-atlas- and CT-based attenuation correction. J Nucl Med. (2016) 57:1258–64. doi: 10.2967/jnumed.115.169045
32. Hammers A, Allom R, Koepp MJ, Free SL, Myers R, Lemieux L, et al. Three-dimensional maximum probability atlas of the human brain, with particular reference to the temporal lobe. Hum Brain Mapp. (2003) 19:224–47. doi: 10.1002/hbm.10123
33. Fischl B, Salat DH, Busa E, Albert M, Dieterich M, Haselgrove C, et al. Whole brain segmentation: automated labeling of neuroanatomical structures in the human brain. Neuron. (2002) 33:341–55. doi: 10.1016/S0896-6273(02)00569-X
34. Lammertsma AA, Hume SP. Simplified reference tissue model for PET receptor studies. Neuroimage. (1996) 4:153–8. doi: 10.1006/nimg.1996.0066
35. Sasaki T, Ito H, Kimura Y, Arakawa R, Takano H, Seki C, et al. Quantification of dopamine transporter in human brain using PET with 18F-FE-PE2I. J Nucl Med. (2012) 53:1065–73. doi: 10.2967/jnumed.111.101626
36. Merida I, Reilhac A, Redoute J, Heckemann R, Costes N, Hammers A. Multi-atlas attenuation correction supports full quantification of static and dynamic brain PET data in PET-MR. Phys Med Biol. (2017) 62:2834–58. doi: 10.1088/1361-6560/aa5f6c
Keywords: MR-based attenuation correction, PET/MR, PET quantification, PET reconstruction, molecular imaging
Citation: Schramm G, Koole M, Willekens SMA, Rezaei A, Van Weehaeghe D, Delso G, Peeters R, Mertens N, Nuyts J and Van Laere K (2019) Regional Accuracy of ZTE-Based Attenuation Correction in Static [18F]FDG and Dynamic [18F]PE2I Brain PET/MR. Front. Phys. 7:211. doi: 10.3389/fphy.2019.00211
Received: 02 October 2019; Accepted: 21 November 2019;
Published: 06 December 2019.
Edited by:
Ivo Rausch, Medical University of Vienna, AustriaReviewed by:
Paul Cumming, University of Bern, SwitzerlandCopyright © 2019 Schramm, Koole, Willekens, Rezaei, Van Weehaeghe, Delso, Peeters, Mertens, Nuyts and Van Laere. This is an open-access article distributed under the terms of the Creative Commons Attribution License (CC BY). The use, distribution or reproduction in other forums is permitted, provided the original author(s) and the copyright owner(s) are credited and that the original publication in this journal is cited, in accordance with accepted academic practice. No use, distribution or reproduction is permitted which does not comply with these terms.
*Correspondence: Georg Schramm, Z2Vvcmcuc2NocmFtbUBrdWxldXZlbi5iZQ==
Disclaimer: All claims expressed in this article are solely those of the authors and do not necessarily represent those of their affiliated organizations, or those of the publisher, the editors and the reviewers. Any product that may be evaluated in this article or claim that may be made by its manufacturer is not guaranteed or endorsed by the publisher.
Research integrity at Frontiers

Learn more about the work of our research integrity team to safeguard the quality of each article we publish.