 Xin Yu1,2
 Guang Chang1,2*Jiangbo Peng1,2*Hao Dong3Yang Yu1,2Long Gao1,2Zhen Cao1,2Biao Yan1,2Ye Luo1,2Tianjiao Qu1,2
- 1National Key Laboratory of Science and Technology on Tunable Laser, Harbin Institute of Technology, Harbin, China
- 2School of Astronautics, Harbin Institute of Technology, Harbin, China
- 3College of Aerospace Engineering, Nanjing University of Aeronautics and Astronautics, Nanjing, China
Planar laser-induced fluorescence (PLIF) of toluene and acetone is performed for visualization of spatial distribution of oxygen in gas and oxygen mixing region in the nozzle flow field. The principle of the calibration methods of oxygen concentration distribution is expounded in this paper. As the two tracers had different situations on oxygen quenching effect, the ratio of the fluorescence images of the two tracers could be used to measure the oxygen concentration in the mixed area. In this way, the ratio of fluorescence signal intensity of toluene to acetone was found to be linearly related to oxygen concentration. By using this calibration relationship, we can measure the oxygen concentration distribution of the nozzle flow field with an accuracy of 12.6%. It indicates that this measurement method can be applied in a turbulent flow field. The variation trend of oxygen concentration distribution in the nozzle flow field can be analyzed by capturing multiple PLIF images in time sequence, which has the important reference value for the development of the nozzle burner flame.
Introduction
The nozzles have many advantages such as simple structure, easy processing, low investment cost, simple operation, and easy maintenance. Meanwhile, nozzles also have high reliability and adaptability, which can work in extreme environments [1, 2]. Therefore, they are widely used in fuel injection of various internal combustion engines. The research on the nozzle mainly focuses on the diameter and shape of the nozzle at present. These properties are very important for the mixture of the fuel ejected from the nozzle with oxygen in the combustion chamber, which related to the combustion process and combustion efficiency of the combustion engines [3, 4]. The distribution of oxygen concentration in the mixing area directly depends on the distribution of equivalent ratio of combustion area; moreover, the position of lean combustion area and rich combustion area inside the combustion chamber will be affected by the distribution of oxygen concentration, which is the key to reduce the emission of NOx, COx, and other harmful gases [4, 5]. It can be seen that measuring the oxygen distribution of the nozzle flow field is very important to assess whether the design scheme of nozzle achieves the expected purpose. Additionally, since the chemical character of oxygen is very active, the reaction is susceptible to nanomaterials, such as nanosheets and nanotubes; in turn, the fluorescence spectrum would be shifted with the increase of oxygen concentration [6–8].
As a kind of laser spectrum measurement technology, planar laser-induced fluorescence (PLIF) technology is applied to the diagnosis of high-speed variable flow field [9, 10]. In the development of internal combustion engine, the equivalent ratio distribution, temperature distribution, flame combustion area, and other flow field information in the engine combustion chamber have great significance for engine design and development [11–14]. PLIF technology can accurately measure the component concentration distribution, temperature variation, combustion area, and other flow field information inside the engine, and show the variation trend of these parameters in space and time [15, 16]. Based on these data information, the combustion process inside the engine can be further obtained, and it gives the basis for the engine structure modification and optimization design.
Based on the PLIF diagnostic technology, the current measurement accuracy of oxygen concentration is about 10% [17, 18]. The traditional sensor oxygen concentration measurement methods have a higher measurement accuracy, but such methods would destroy the original state of the flow field, resulting in inaccurate flow field information [9]. Additionally, the non-contact optical measurement technologies, such as TDLAS, LIBS, and so on, which can measure oxygen concentration with higher accuracy, such as TDLAS up to 1.7% [19–21]. However, these technologies only apply to measure single point measurement, and it is difficult to realize synchronous measurement of oxygen concentration distribution in the whole plane of the nozzle flow field and cannot satisfy the requirements of turbulence field measurement. Therefore, it is of practical significance to further promoting PLIF technology and improving the accuracy.
PLIF technology has two main methods to measure oxygen concentration in turbulent field [22]. One of the methods is the two-color method, based on the phenomenon of red shift of toluene fluorescence spectrum with the increase of oxygen concentration, realizing the quantitative measurement of oxygen concentration [18]. However, due to the reason of red shift of toluene fluorescence spectrum caused by the increased temperature, the two-color method is difficult to measure oxygen concentration in the flow field with drastic temperature variation, and its application prospect is severely limited. The other adopts a method to monitor the ratio of fluorescence intensity of the toluene and 3-pentanone to measure the oxygen concentration, resulting from the difference of fluorescence intensity of two tracers being quenched by oxygen [17]. This method is more suitable for the test of the nozzle flow field in the long term and avoids the temperature variation in the flow field effectively.
In our research, 3-pentanone is replaced with acetone for the first time by combining with toluene to measure oxygen concentration. Compared with 3-pentanone, acetone has the advantage of higher saturated vapor pressure at room temperature, which is more convenient to prepare tracer experimental gas with various required concentrations and more suitable for gas flow field diagnosis. Moreover, acetone has a weaker quenching effect on toluene fluorescence signal, which greatly improves the signal-to-noise ratio of toluene fluorescence image. Additionally, according to the research results of Shelar et al. [23], the fluorescence signal of 3-pentanone is significantly affected by oxygen quenching effect, while the fluorescence signal of acetone is weakly affected by oxygen. Therefore, the ratio of fluorescence intensity of acetone to toluene is more sensitive than that of 3-pentanone to toluene due to the variation of oxygen concentration.
The quenching effect of oxygen on fluorescence signal of toluene and acetone and the mutual quenching effect between them is studied for the first time. Toluene and acetone are diluted into high-purity nitrogen to form the experimental gas, which is injected directly into the air environment to form the nozzle flow field and measure the oxygen concentration distribution in this process. The fluorescence signals of acetone and toluene are captured by ICCD and IsCmos with specific filter.
Theoretical Background
The LIF signal is the fluorescence signal generated by the spontaneous emission. The fluorescence signal intensity of the tracer can be expressed as Equation (1) [22].
E is the pulse energy density (J/cm2). hv is the single-photon energy in the case of the excitation frequency of v, and h is the Planck constant. η(λ) is the fluorescence photon collection efficiency of the entire fluorescence collection system for wavelength λ, which is determined by the combination of the lens, CCD, and other related equipment and experimental environment. Ω is the solid angle of the detector for the volume of the measured area. dVc is the volume element.ntol is the molecule density of tracer. σ(λex, T) is the absorption cross section of tracer in the case of the incident light wavelength of λex and the ambient temperature is T. ϕ(λ, λex, T, Pi, P) represents the fluorescence quantum efficiency of the tracer molecule, which is determined by the partial pressure Pi, total pressure P, temperature T, incident laser wavelength λex, and specific fluorescence wavelength λ.
Because the quenching effect is mainly from oxygen and tracer, the quenching effect of other components can be neglected. The fluorescence signals of acetone and toluene in the same position (x, y) can be represented by Sa(x, y) and St(x, y). If the experimental gas composed of toluene, acetone, and diluent gas is fully mixed and the concentration ratio of the two tracers is known and the excitation wavelength of laser is a single wavelength (266 nm), the same term can be eliminated and Equation (2) can be obtained. Pi represented the partial pressure of the other tracer or oxygen. a is constant.
The fluorescence intensity ratios of different tracers directly depend on the oxygen concentration in different environments, which results from the denoted degree of contribution from oxygen quenching in various tracers. By comparing the ratio change of the fluorescence intensity of toluene and acetone, the distribution of the oxygen concentration could be determined.
The quenching effect includes oxygen to toluene, oxygen to acetone, acetone to toluene, and toluene to acetone in our research. It is necessary to avoid the interference of quenching effect between the two tracers. The strength of this quenching effect is analyzed by using Stern–Volmer Equation (3) as follows:
The Stern–Volmer coefficients kSV of different quenching agents can be determined by the fluorescence intensity without quenching I0 and the fluorescence intensity after quenching I. n(Q) is the concentration of the quenching agent. Therefore, the interference of quenching effect from two traces can be significantly declined based on an appropriate concentration ratio of acetone and toluene to improve the design in the nozzle flow field.
Experimental Approach
Stern–Volmer Coefficient Measurement
The schematic diagram of the experimental device is shown in Figure 1; the quenching effect of oxygen on the acetone and toluene and the mutual quenching effect between acetone and toluene were measured in a static cell with quartz window. The detector was Andor ICCD or Spectrometer equipped with ICCD, and the excitation source was 266 nm pulsed laser from Nd:YAG. Two laser energy probes are used to measure the energy of each laser pulse. The timing of the whole system was controlled by digital delay. The Stern–Volmer coefficient measurement kSV of different quenching agents was measured by controlling the partial pressures of different components in the static cell. We obtained the fluorescence signal pictures under different concentrations of tracer and quenching agent. Nitrogen was used as the diluent gas throughout the experiment, and the total pressure was maintained at 100 kPa.
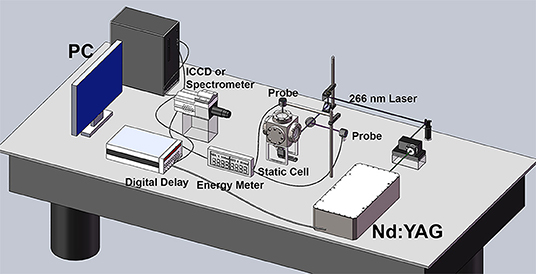
Figure 1. Schematic diagram of Stern–Volmer coefficient measurement experiment.
Measurement of Oxygen Concentration Distribution in the Nozzle Flow Field
The oxygen concentration distribution of the nozzle flow field would be observed. The experimental gas was composed of acetone steam and toluene steam diluted in high-purity nitrogen with the specific ratio of the concentrations of the two tracers. A mixing tank was used to prepare the experimental gas. After a certain amount of steam of two tracers was injected into it, nitrogen was injected into the tank and filled to 250 kPa. Under the control of the gas flowmeter, the experimental gas was injected directly into the open space environment through the nozzle.
The tracer was excited by UV pulses at 1 Hz from a frequency-quadrupled Nd:YAG at 266 nm. The beam was formed into a sheet (0.1 mm × 35 mm) using three cylindrical lens, the focal lengths of which were 22, 150, and 170 mm, respectively. Typical energies were 1.5–2.0 mJ for the 266-nm beam (~7 ns pulse duration).
IsCmos and ICCD served as the detectors to capture fluorescent signals, which captured fluorescent signals of toluene and acetone, respectively. The lens installed on ICCD was Nikkor F/1.4 50 mm lens for acetone, the other lens installed on IsCmos was ultraviolet lens of F/4.5 105 mm for toluene. The corresponding filter should be installed on the lens. The detector's shutter width was set to 100 ns to ensure that all fluorescent signals are captured.
The experimental diagram is shown in Figure 2. The timing control of the whole PLIF system was controlled by DG645 (Stanford Research System). The experimental gas was fed into the nozzle and then sprayed into the air environment. The shaping laser beam was incident to the observation area, so as to excite tracer molecules to produce fluorescence. ICCD and IsCmos were positioned on both sides of the nozzle, and the two detectors focus on the observation area; meanwhile, the corresponding lenses and filters were installed, respectively to capture fluorescent signals of acetone and toluene, respectively. The nozzle diameter is 4 mm. The resulting fluorescent images were stored directly in the computer.
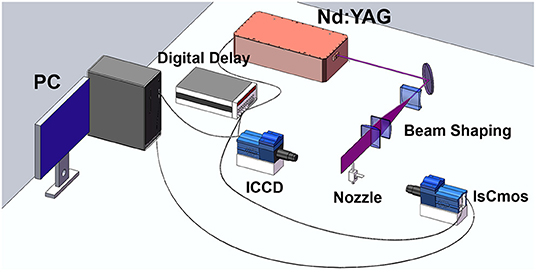
Figure 2. Schematic diagram of oxygen concentration distribution in the nozzle flow field.
Results and Discussion
The Fluorescence Spectra of Traces and Corresponding Filters
The excited wavelength of the pulsed laser is 266 nm, which is in the overlap region of the absorption spectra of toluene and acetone. In addition, the fluorescence spectra of toluene and acetone excited by the 266-nm pulse laser do not change with the variation of oxygen concentration [8].
In order to select the appropriate filter, we first used the experimental device in Figure 1 to detect the fluorescence spectra of toluene and acetone in the nitrogen environment and selected the appropriate filter for the following experiment according to its spectral characteristics. Under the excitation of the 266-nm pulsed laser, the fluorescence spectra of two tracers obtained in the static cell are shown in Figure 3. The fluorescence spectrum peak of toluene is around 280 nm, while acetone is around 450 nm. In this experiment, the Semrock BP280 filter is used to capture toluene fluorescent signals, and Semrock LP430 is used for acetone; this solution could ensure that both cameras capture the fluorescent signals they need separately, without capturing the other fluorescence signals.
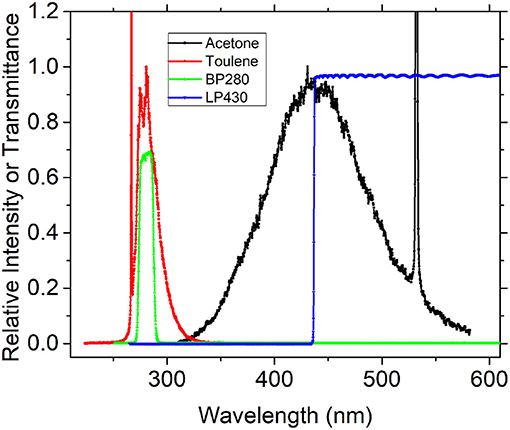
Figure 3. Fluorescence spectra of toluene (red) and acetone (black) in nitrogen excited by 266 nm pulsed and transmission spectrum of Semrock BP280 (green) and LP430 (blue).
Compared with other PLIF flow field diagnostic tracer, the greatest advantage of the acetone and toluene for PLIF imaging is that they can be excited at a single wavelength and the peak areas of their fluorescence spectrum are distinguishable, making it easy to use specific filters for simultaneous signal acquisition.
Influence of Stern–Volmer Coefficients on Fluorescence Signal
In this experiment, nitrogen is a diluent gas, and its influence on the fluorescence signals of toluene and acetone is particularly important. Therefore, we first studied the fluorescence signal intensity variation of the two tracers under different nitrogen pressure by the experimental arrangement in Figure 1. Because this experiment was carried out under normal temperature and pressure, the range of pressure test was set at 70–120 kPa. The fluorescence intensity of the two tracers was normalized, and the experimental results are shown in Figure 4. It can be found that within this pressure range, nitrogen has a very weak influence on the fluorescence intensity of toluene and toluene, and the variation range is smaller than the measurement error. Therefore, the influence of nitrogen on the fluorescence intensity of toluene and toluene can be neglected in this experiment. Faust et al. [24] and Thurber and Hanson [22] have studied the variation trend of the fluorescence intensity of toluene and acetone with the increase of nitrogen pressure in a larger pressure range (100–1,000 kPa), respectively, at room temperature, which are consistent with this experiment. As nitrogen has a negligible effect on toluene and acetone fluorescence signal, it is very suitable as a diluent gas of tracer vapor.
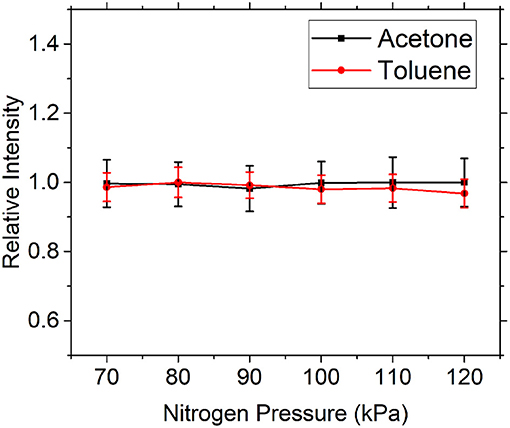
Figure 4. The influence of nitrogen partial pressure on acetone (black) and toluene (red) fluorescence signal.
A tracer with a certain partial pressure was injected into the static cell in Figure 2, followed by a quenching agent with a certain partial pressure (oxygen or another tracer), and finally nitrogen was injected to maintain the total pressure at 100 kPa. In each working condition, the partial pressure of tracer was kept unchanged, while the partial pressure of quenching agent was changed. In the experiment, let the partial pressure of tracer remain unchanged, change the partial pressure of quenching agent, and observe the variation trend of fluorescence signal under different partial pressure of quenching agent. Thus, kSV corresponding to specific tracer and quenching agent could be calculated according to Equation (4), which represents the quenching ability of the quencher to the fluorescence signal of the tracer.
The quenching effect of oxygen and acetone on toluene was first studied, as shown in Figure 5. Figure 5A shows that the fluorescence intensity of toluene gradually decreases with the increase of partial pressure of oxygen in the environment. Figure 5B shows that the toluene LIF is quenched by oxygen with a clear Stern–Volmer behavior allowing for linear regression. The slopes give the Stern–Volmer coefficients, = 2.21 kPa−1. The quenching coefficient of oxygen to toluene measured by Koban et al. [17] is = 2.39 kPa−1, which is consistent with the experimental results.
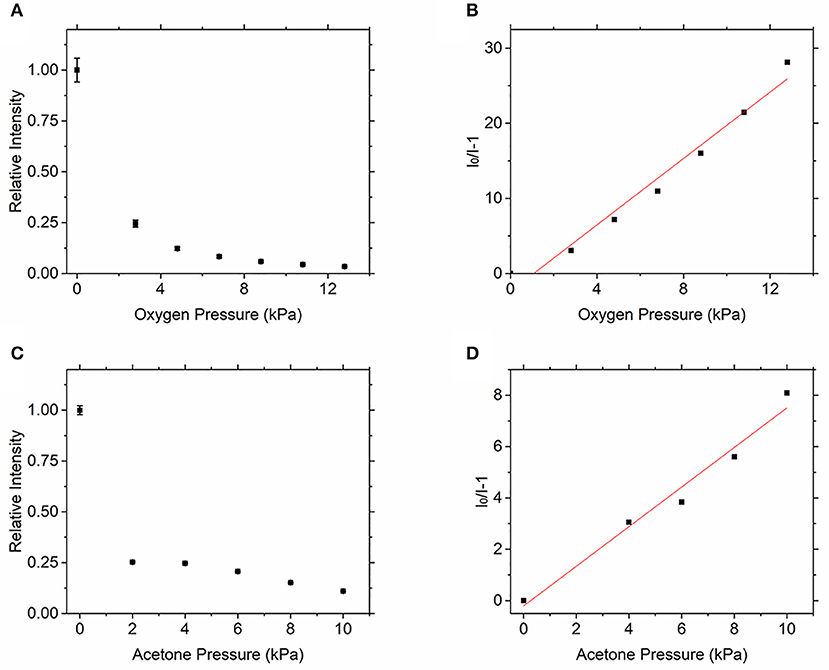
Figure 5. Relative fluorescence intensity of toluene vs. oxygen (A) and acetone (C) partial pressure and dependence of toluene LIF on quenching by oxygen (B) and acetone (D).
Figures 5C,D show the quenching effect of acetone on toluene fluorescence signal. Figure 5C shows that the fluorescence signal of toluene also weakens with the increase of the partial pressure of acetone. The Stern–Volmer coefficient of acetone on toluene can be calculated through Figure 5D, = 0.77 kPa−1. Therefore, the quenching ability of oxygen to toluene signal is much stronger than that of acetone. The quenching coefficient of 3-pentanone to toluene measured by Koban et al. [17] was = 2.56 kPa−1. It can be seen that the quenching effect of 3-pentanone on toluene fluorescence signal is significantly greater than that of acetone. Compared with 3-pentanone, acetone is easier to improve the signal-to-noise ratio of toluene fluorescence image. This result verifies that acetone is superior to 3-pentanone in measuring oxygen concentration.
Similar to the above research method, Figure 6 shows the quenching effect of oxygen and toluene on the fluorescence signal of acetone, and the Stern–Volmer coefficient of them can be obtained, respectively. However, as the quenching effect is very weak, when the partial oxygen pressure reaches 50 kPa, the fluorescence signal of acetone is weakened by about 10%, so the current instruments cannot accurately measure the . This result is consistent with the results of quenching of acetone fluorescence signal by oxygen as measured by Thurber and Hanson [22]. In his results, the fluorescence signal of acetone excited by the 266-nm pulsed laser decreased by <10% when the oxygen pressure increased to 800 kPa. It can be seen that the effect of oxygen on the fluorescence signal of acetone is much weaker than that of toluene. Our results show that oxygen quenching has a vastly different effect on the fluorescence signal from two kinds of tracer, and experiments substantiate the feasibility of this research method.
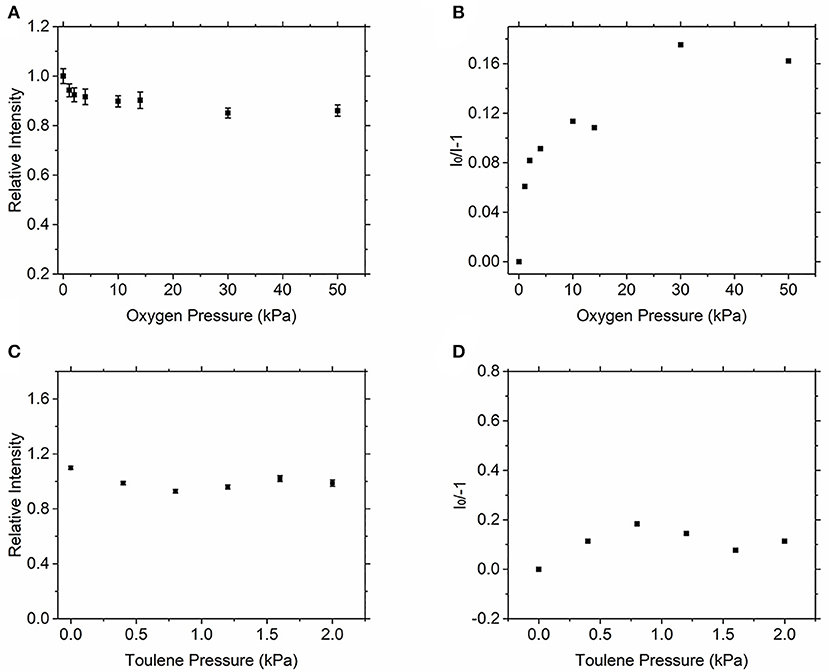
Figure 6. Relative fluorescence intensity of acetone vs. oxygen (A) and toluene (C) partial pressure, dependence of acetone LIF on quenching by oxygen (B) and toluene (D).
In addition, toluene had no obvious quenching effect on acetone, according to Figures 6C,D. When acetone and toluene were present in the environment, toluene had no obvious quenching effect on the fluorescence signal strength of acetone, and the Stern–Volmer coefficient cannot be calculated, so the quenching effect could be ignored.
According to the above studies, the measurement of oxygen concentration can be achieved by the difference of oxygen quenching effect on the fluorescence signals of acetone and toluene. When the quenching effect of toluene on acetone fluorescence signal can be negligible, only the quenching effect of acetone on toluene fluorescence signal needs to be considered. In order to reduce this effect, the partial pressures of toluene and acetone in the gas mixing tank were divided into 2 and 0.5 kPa in this experiment. Therefore, it can be calculated that the fluorescence intensity of toluene will not change more than 7.1% due to the quenching effect of acetone, and the fluorescence quenching effect of acetone on toluene was also negligible. Thus, the mutual quenching effect of tracer in Equation (2) can be negligible, and Equation (3) can be obtained.
According to Equation (4), the ratio of the fluorescence efficiency of the two tracers has functional relationship with oxygen concentration. The quenching effect of oxygen on the fluorescence signal of the two tracers was different, and oxygen concentrations at different positions can be measured by Equation (4).
The relationship between oxygen concentration and fluorescence intensity ratio of acetone to toluene under the above tracer partial pressure condition is shown in Figure 7. It shows that as the oxygen concentration goes up, the ratio goes up linearly, which can be used as a calibration for oxygen concentration measurements.
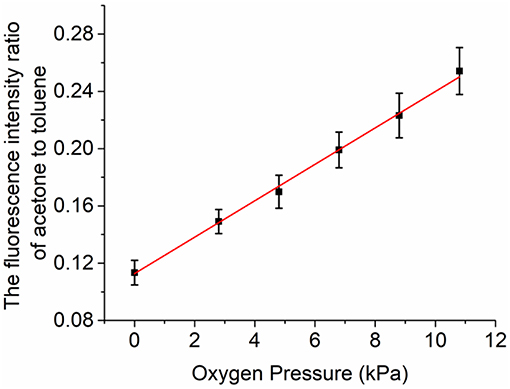
Figure 7. The relationship between fluorescence intensity of acetone and toluene and partial pressure of oxygen.
In the calibration process of this experiment, due to the error of energy meter probe, pressure gauge, thermocouple, and other measuring equipment, the total error actually generated is 7.5%. The error of the intensifier camera and the image processing method is estimated to be 5.1%. At the same time, the quenching effect of acetone on the fluorescence signal of toluene was negligible in this experiment, and the fluorescence intensity of toluene would have an additional measurement error of 7.1%. According to the error transfer principle, the maximum error is estimated to be 12.6%. When the oxygen partial pressure is 6 kPa, the accuracy of actual measurement is 9.5%. Compared with the previous tracer combination of toluene/3-pentanone, the accuracy is 10% under the same condition of oxygen partial [17]. The new dual tracer combination improves the measurement accuracy to some extent.
Measurement of Oxygen Concentration Distribution in the Nozzle Flow Field
Then, the acetone/toluene PLIF is used to measure oxygen concentration distribution of the nozzle flow field. The experimental gas injection velocity is 5.28 m/s. In Figure 8, the oxygen concentration distribution of the nozzle flow field could be observed. Figures 8A–C show the distribution of the molecular density of acetone, toluene, and oxygen concentration distribution in the mixing area, respectively. The gray value is zero in areas where oxygen or experimental gas existed only; the mixture area of oxygen and experimental gas is marked. It can be observed from the figure that the mixing area is mainly concentrated in the boundary layer between gas and air, and the oxygen concentration gradually decreases from the outside to the inside.
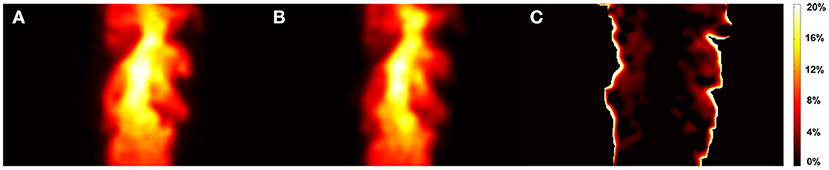
Figure 8. The two-dimensional distribution of acetone (A), toluene (B), and the mixing area (C).
Figure 9A shows the distribution of oxygen concentration in the nozzle flow field in a moment (gate width is 100 ns). It can be seen that the center area of the nozzle is still an oxygen-free area. The formation and fracture of vortex structure exist in the mixing zone of gas and oxygen, which indicates that this measurement method can be applied in a turbulent flow field. The variation trend of oxygen concentration distribution in the nozzle flow field can be analyzed by capturing multiple PLIF images in time sequence, which has the important reference value for the development of the nozzle burner flame. Figure 9B shows the distribution of mixed areas through a three-dimensional diagram. The results showed that the mixing area of oxygen and experimental gas from the nozzle was concentrated in the boundary layer, and the widest width of the mixing area was about 2.1 mm. Oxygen concentration also increases radially in general.
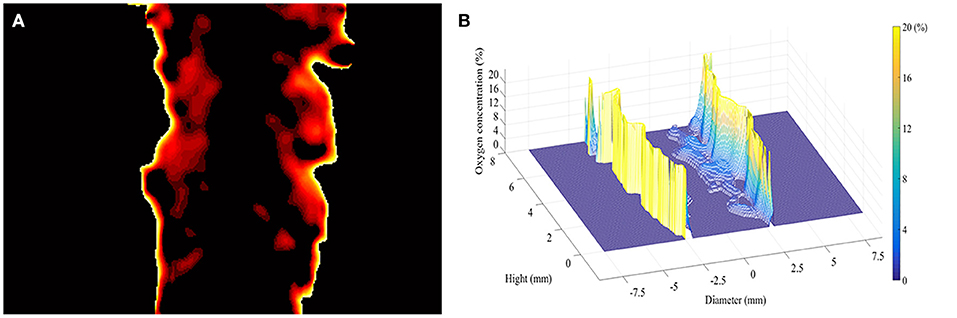
Figure 9. Oxygen concentration distribution of the nozzle flow field (A) and 3D diagram (B).
Figure 10A shows the oxygen concentration distribution in mixing area under different airflow velocity. Eighty consecutive images were selected in each working condition for average processing. The airflow velocity at the nozzle is 2.64, 3.96, 5.28, and 6.60 m/s, in the four pictures from left to right.
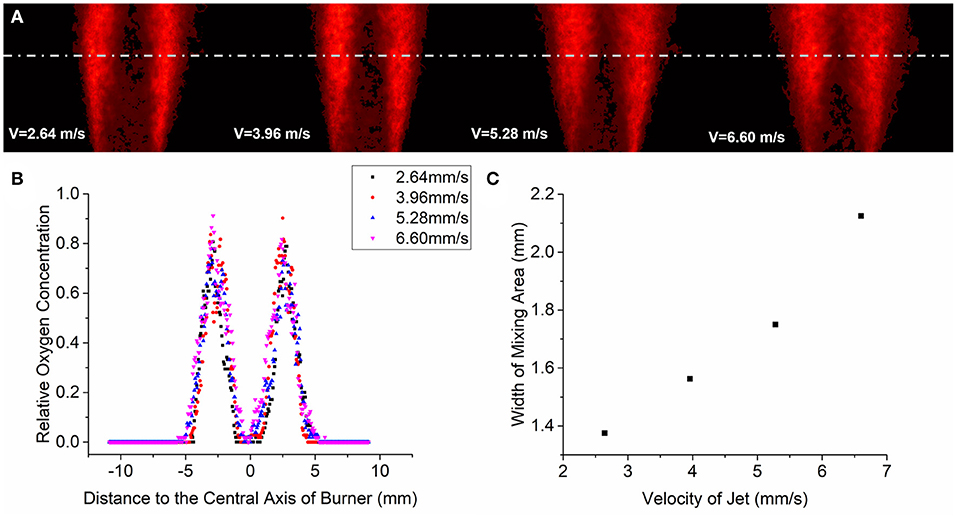
Figure 10. Eighty consecutive images were selected in each working condition for average processing (A). The cumulative average of the oxygen concentration in the horizontal direction is processed and normalized under different operation conditions (B). The relationship between the width of the mixing region and the velocity of the jet stream (C).
Figure 10B shows the horizontal distribution trend of relative oxygen concentration in the mixing area under specific height conditions with different airflow injection velocities. The position with the highest relative oxygen concentration in the figure is the interface between the mixing area and the air under this condition. On the side near the central axis, the lowest relative oxygen concentration appears at the interface between the mixing zone and pure gas. The region between these two interfaces is the mixed region. As can be seen from Figure 10C, at this specific height, the width of the mixing area increases with the increase of the jet velocity. This is mainly because with the increase of the jet velocity, the Reynolds number of the flow field increases and the turbulence increases, and the boundary layer between gas and air gradually breaks. These oxygen concentration distribution images obtained by acetone/toluene tracer technique have practical significance for nozzle design optimization.
Conclusion
The distribution of oxygen concentration in the flow field of the nozzle is measured by PLIF technique and used the acetone/toluene as dual tracer for the first time. The mixture of acetone and toluene is influenced differently by the oxygen quenching effect. It is found that the quenching effect of oxygen on toluene is much stronger than that of oxygen on acetone. At the same time, the fluorescence quenching effect between acetone and toluene was studied for the first time. The quenching effect of acetone on toluene is obvious; on the contrary, the effect is weak. Therefore, the effect of acetone on the fluorescence signal of toluene can be negligible. By controlling the concentration of acetone, the effect of acetone on toluene fluorescence signal was reduced as much as possible. In this way, it can be considered that the fluorescence intensity ratio of toluene to acetone at a specific location is only affected by the oxygen concentration at that location. In this way, acetone/toluene PLIF can be used to measure the two-dimensional oxygen concentration of the nozzle flow field. As an easily obtained excitation light source, the 266-nm pulsed laser can excite two tracers at the same time and obtain fluorescence images by different filters, and the visualization of the oxygen concentration is realized by acetone/toluene PLIF. The acetone/toluene PLIF technique provides a new measurement method to determine whether the nozzle design achieves the expected effect. The following research will focus on this quenching effect of acetone on the fluorescence of toluene to obtain the relevant quantitative relationship, which can further improve the measurement accuracy of this technology.
Data Availability Statement
All datasets generated for this study are included in the article/supplementary material.
Author Contributions
XY was the leader of the work. GC and JP were responsible for experiment setting and paper writing. YY, LG, and ZC were mainly engaged in picture editing and related data processing. BY, YL, and TQ contributed to the stable operation of nozzle. All authors have made positive contributions to the work.
Funding
This work was supported by the National Natural Science Foundation of China (Grant Nos. 51536002, 61405048, and 91441130).
Conflict of Interest
The authors declare that the research was conducted in the absence of any commercial or financial relationships that could be construed as a potential conflict of interest.
References
1. Xiong Y, Cha MS, Chung SH. Fuel density effect on near nozzle flow field in small laminar coflow diffusion flames. Proc Combust Inst. (2015) 35:873–80. doi: 10.1016/j.proci.2014.06.025
2. Mansouri A, Eaves NA, Thomson MJ, Dworkin SB. Influence of pressure on near nozzle flow field and soot formation in laminar co-flow diffusion flames. Combust Theor Model. (2018) 23:1–13. doi: 10.1080/13647830.2018.1557746
3. Einecke S, Schulz C, Sick V. Measurement of temperature, fuel concentration and equivalence ratio fields using tracer LIF in IC engine combustion. Appl Phys B Lasers Opt. (2000) 71:717–23. doi: 10.1007/s003400000383
4. Joshi S, Olsen DB, Dumitrescu C, Puzinauskas PV, Yalin AP. Laser-induced breakdown spectroscopy for in-cylinder equivalence ratio measurements in laser-ignited natural gas engines. Appl Spectroscopy. (2009) 63:549–54. doi: 10.1366/000370209788346869
5. Li ZS, Kiefer J, Zetterberg J, Linvin M, Leipertz A, Bai XS, et al. Development of improved PLIF CH detection using an Alexandrite laser for single-shot investigation of turbulent and lean flames. Proc Combust Inst. (2007) 31:727–35. doi: 10.1016/j.proci.2006.08.015
6. Ren X, Zhou J, Qi X, Liu Y, Huang Z, Li Z, et al. Few-layer black phosphorus nanosheets as electrocatalysts for highly efficient oxygen evolution reaction. Adv Energy Mater. (2017) 7:1700396. doi: 10.1002/aenm.201700396
7. Jiang Q, Xu L, Chen N, Zhang H, Dai L, Wang S. Facile synthesis of black phosphorus: an efficient electrocatalyst for the oxygen evolving reaction. Angew Chem Int Ed. (2016) 55:13849–53. doi: 10.1002/anie.201607393
8. Koban W, Koch JD, Hanson RK, Schulz C. Oxygen quenching of toluene fluorescence at elevated temperatures. Appl Phys B Lasers Opt. (2005) 80:777–84. doi: 10.1007/s00340-005-1769-6
9. Vancruyningen I, Lozano A, Hanson RK. Quantitative imaging of concentration by planar laser-induced fluorescence. Exp Fluids. (1990) 10:41–9. doi: 10.1007/BF00187871
10. Lozano A, Yip B, Hanson RK. Acetone - a tracer for concentration measurements in gaseous flows by planar laser-induced fluorescence. Exp Fluids. (1992) 13:369–76. doi: 10.1007/BF00223244
11. Hanson RK, Seitzman JM, Paul PH. Planar laser-fluorescence imaging of combustion gases. Appl Phys B Photophys Laser Chem. (1990) 50:441–54. doi: 10.1007/BF00408770
12. Lee MP, McMillin BK, Hanson RK. Temperature-measurements in gases by use of planar laser-induced fluorescence imaging of NO. Appl Opt. (1993) 32:5379–96. doi: 10.1364/AO.32.005379
13. Ossler F, Alden M. Measurements of picosecond laser induced fluorescence from gas phase 3-pentanone and acetone: Implications to combustion diagnostics. Appl Phys B Lasers Opt. (1997) 64:493–502. doi: 10.1007/s003400050205
14. Yip B, Miller MF, Lozano A, Hanson RK. A combined OH/acetone planar laser-induced fluorescence imaging technique for visualizing combusting flows. Exp Fluids. (1994) 17:330–6. doi: 10.1007/BF01874413
15. Estruch-Samper D, Vanstone L, Hillier R, Ganapathisubramani B. Toluene-based planar laser-induced fluorescence imaging of temperature in hypersonic flows. Exp Fluids. (2015) 56:115. doi: 10.1007/s00348-015-1987-6
16. Miller VA, Troutman VA, Mungal MG, Hanson RK. 20 kHz toluene planar laser-induced fluorescence imaging of a jet in nearly sonic crossflow. Appl Phys B Lasers Opt. (2014) 117:401–10. doi: 10.1007/s00340-014-5849-3
17. Koban W, Schorr J, Schulz C. Oxygen-distribution imaging with a novel two-tracer laser-induced fluorescence technique. Appl Phys B Lasers Opt. (2002) 74:111–4. doi: 10.1007/s003400100769
18. Mohri K, Luong M, Vanhove G, Dreier T, Schulz C. Imaging of the oxygen distribution in an isothermal turbulent free jet using two-color toluene LIF imaging. Appl Phys B Lasers Opt. (2011) 103:707–15. doi: 10.1007/s00340-011-4564-6
19. Nwaboh JA, Werhahn O, Ortwein P, Schiel D, Ebert V. Laser-spectrometric gas analysis: CO2-TDLAS at 2 μm. Measure Sci Technol. (2012) 24:015202. doi: 10.1088/0957-0233/24/1/015202
20. Dou H, Dong L, Zhang L, Jia S, Yin W. Laser-induced breakdown spectroscopy for determination of the organic oxygen content in anthracite coal under atmospheric conditions. Appl Spectroscopy. (2008) 62:458–63. doi: 10.1366/000370208784046786
21. Gao Y, Zhang Y, Chen D, He Y, You K, Chen C, et al. Real-time O 2 measurement in a cement kiln with a TDLAS analyzer. In: Proceedings SPIE 10155, International Symposium on Optoelectronic Technology and Application. Beijing (2016). doi: 10.1117/12.2247141
22. Thurber MC, Hanson RK. Pressure and composition dependences of acetone laser-induced fluorescence with excitation at 248, 266, and 308 nm. Appl Phys B Lasers Opt. (1999) 69:229–40. doi: 10.1007/s003400050799
23. Shelar V, Hegde G, Umesh G, Jagadeesh G, Reddy K. Gas phase oxygen quenching studies of ketone tracers for laser-induced fluorescence applications in nitrogen bath gas. Spectroscopy Lett. (2014) 47:12–8. doi: 10.1080/00387010.2013.775463
Keywords: planar laser-induced fluorescence, dual-tracers, nozzle flow field, fluorescence signal quenching, oxygen concentration distribution
Citation: Yu X, Chang G, Peng J, Dong H, Yu Y, Gao L, Cao Z, Yan B, Luo Y and Qu T (2019) Oxygen Concentration Distribution Measurement of the Nozzle Flow Field by Toluene/Acetone Planar Laser-Induced Fluorescence. Front. Phys. 7:205. doi: 10.3389/fphy.2019.00205
Received: 20 September 2019; Accepted: 14 November 2019;
Published: 04 December 2019.
Edited by:
Karol Krzempek, Wrocław University of Science and Technology, PolandCopyright © 2019 Yu, Chang, Peng, Dong, Yu, Gao, Cao, Yan, Luo and Qu. This is an open-access article distributed under the terms of the Creative Commons Attribution License (CC BY). The use, distribution or reproduction in other forums is permitted, provided the original author(s) and the copyright owner(s) are credited and that the original publication in this journal is cited, in accordance with accepted academic practice. No use, distribution or reproduction is permitted which does not comply with these terms.
*Correspondence: Guang Chang, guangchang126@163.com; Jiangbo Peng, pengjiangbo_2004@126.com