- 1School of Electronic and Optical Engineering, Nanjing University of Science and Technology, Nanjing, China
- 2Jiangsu Key Laboratory of Spectral Imaging and Intelligent Sense, Nanjing University of Science and Technology, Nanjing, China
- 3Smart Computational Imaging Laboratory, Nanjing University of Science and Technology, Nanjing, China
We introduce the quantitative phase imaging camera with a weak diffuser (QPICWD) as an effective scheme of quantitative phase imaging (QPI) based on normal microscope platforms. The QPICWD is an independent compact camera measuring object induced phase delay under low-coherence quasi-monochromatic illumination by examining the deformation of the speckle intensity pattern. By interpreting the speckle deformation with an ensemble average of the geometric flow, we can obtain the high-resolution distortion field via the transport of intensity equation (TIE). Since the phase measured by TIE is the generalized phase of the partially coherent image, rather than the phase of the measured object, we analyze the effect of illumination coherence and imaging numerical aperture (NA) on the accuracy of phase retrieval, revealing that the sample's phase can be reliably reconstructed under the conditions that the coherence parameter (the ratio of illumination NA to objective NA) of the Köhler illumination is between 0.3 and 0.5. We present some applications for the proposed design involving nondestructive optical testing of microlens array with nanometric thickness and imaging of fixed and live unstained HeLa cells. Since the designed QPI camera does not require any modification of the widely available bright-field microscope or additional accessories for its use, it is expected to be applied by the broader communities of biology and medicine.
1. Introduction
In recent years, quantitative phase imaging (QPI) has become a valuable tool in biomedical studies in virtue of its distinctive imaging abilities to obtain the spatial distribution of optical thickness of live cell without using contrast agents or specific staining [1–6]. Conventionally, transparent biological samples can be observed by using phase visualization approaches, for instance phase contrast [7] and differential interference contrast (DIC) microscopy [8]. However, these two classic approaches cannot provide quantitative phase information, leading to difficulties in data interpretation, and further analysis. Therefore, phase measurement techniques should be used to quantify the optical phase shifts and provide valuable information about the object structures that can be used for further quantitative evaluations. The most well-established phase measurement or QPI methods for obtaining quantitative phase are based on interferometry, such as interferometric microscopy [9] and digital holographic microscopy [3]. However, in general, such approaches rely on coherent illumination, and thus, are easily disturbed by speckle noises caused by multiple scattering stray interference due to the defects in the optical system. Besides, the interferometric system is complicated and the experimental environment is rather restrictive in order to guarantee stable measurements. The restriction has been alleviated by the low-coherence QPI techniques, such as spatial light interference microscopy (SLIM) [10], white-light diffraction phase microcopy (wDPM) [11], quadriwave lateral shearing interferometry (QWLSI) [12], τ interferometry [13] etc. Combining common-path geometry with broadband illumination greatly relieves the speckle noise problem and improve the stability to air fluctuations and mechanical vibrations. Nevertheless, such low-coherence QPI methods typically require spatially coherent illumination to guarantee accurate phase measurements without halo artifacts [14, 15]. Consequently, the maximum achievable lateral resolution is still limited to the coherent diffraction limit. Although synthetic aperture approaches by oblique [16, 17] or structured illumination [18] is able to expand the imaging resolution to that of their traditional, incoherent imaging counterpart. This class of methods demands comparatively intricate optical systems, which are usually unavailable to most patho/biologists, preventing their wide application in medicine and bioscience.
In order to overcome these drawbacks associated with interferometric methods, phase retrieval algorithms can be employed to achieve QPI by utilizing only the intensity measurements of multiple axial displacement planes (or under different illuminations) without explicit manipulation of the object beam and reference beam. There are typically two classes of phase retrieval algorithms, iterative methods [19–24] and transport of intensity equation (TIE) methods [2, 25–39]. Compared to iterative approaches, TIE is deterministic, requires less intensity measurement (a minimum of two intensity measurements on closely spaced planes), and is compatible with off-the-shelf microscopes with Köhler illumination optics [2, 36, 40]. In addition, TIE is expected to obtain superior spatial resolution over the coherent diffraction limit when the object is illuminated with spatially partially coherent light from an optical condenser since the angular content of illumination contributes to the transverse resolution [34, 40, 41]. Furthermore, TIE alleviates the stringent beam-coherence needs for interferometry, extending applications to X-ray diffraction [42], electron-beam microscopy [43], neutron radiography [44], where the partial coherence of the field is unavoidable for most cases. Besides, in optical microscopy, partial coherence illuminations provide superior QPI quality, preventing image deterioration resulting from speckle noise [28, 34, 36, 37].
One important issue preventing TIE from dynamic QPI is that it typically requires at least 2 images captured at different axial planes via moving the detector or the sample mechanically or manually, which not only complicates the image acquisition procedure, but also prolong the mensuration time, precluding real-time measurement of dynamic samples. Introducing a spatial light modulator (SLM) and an extra image-relay system [36] or an electrically tunable lens (ETL) [37] located at the objective rear aperture plane, a series of images of the object at different depth can be obtained rapidly (even in a single exposure) without any moving parts. Such systems enable real-time QPI with nanometric sensitivity and millisecond temporal resolution. These new TIE systems have been successfully applied to investigations of drug-induced morphology changes and phagocytosis of macrophages [36], imaging of cellular dynamics of breast cancer cells [37], and characterization of micro-optical elements [45]. Despite the advantages and promising results obtained, the translation of these TIE systems into clinical and biological laboratories is still impeded owing to its complex and bulky optical configuration as well as high costs for the hardware (e.g., SLM, ETL) and maintenance.
In this work, we introduce the quantitative phase imaging camera with a weak diffuser (QPICWD) as an effective realization of QPI on a standard off-the-shelf microscope. Inspired by recent work on speckle tracking based on phase imaging technology [46–49], we introduce a weak diffuser (scotch tape) to generate random speckle illumination in the imaging optical path, and recover the phase of the sample by examining the relative distortion of the speckle field with the sample (so-called sample speckle) with respect to the reference speckle when there is no sample in the optical path. By interpreting the speckle deformation with an ensemble average of the geometric flow [49], we can obtain the high-resolution distortion field by solving the TIE. Since the reference speckle image can be acquired beforehand, our approach combines the advantages of speckle tracking phase imaging and TIE, enabling rapid, efficient, and high-resolution quantitative phase imaging in a single exposure. However, different from previous approaches where monochromatic, high spatial coherent illumination, and perfect imaging condition are assumed, our approach uses relatively low spatially coherent illumination by opening up the condenser aperture to suppress coherent noise and a normal microscope objective with limited numerical aperture (NA) to acquired a magnified image of the sample. In such cases, the phase measured by TIE is the generalized phase of the partially coherent image, instead of the measured object's phase [38, 50]. To address these problems, by invoking the phase-space representation, the Wigner distribution function (WDF), we make the connections between speckle distortion to the moment of the WDF, and thus the generalized phase of partially coherent field. We further analyze the effect of illumination coherence and imaging NA on the accuracy of phase retrieval, revealing that the phase of the sample can be reliably reconstructed when the coherence parameter (the ratio of illumination NA to objective NA) of the Köhler illumination is between 0.3 and 0.5. Several applications for the QPICWD are presented, including nondestructive optical testing of microlens array with nanometric thickness and imaging of fixed and live HeLa cells. Experimental results verify that QPICWD is a simple and cost-effective add-on that can be attached to the output port of any bright-field microscopes for high-performance QPI applications.
2. Materials and Methods
2.1. Phase Induced Speckle Distortion
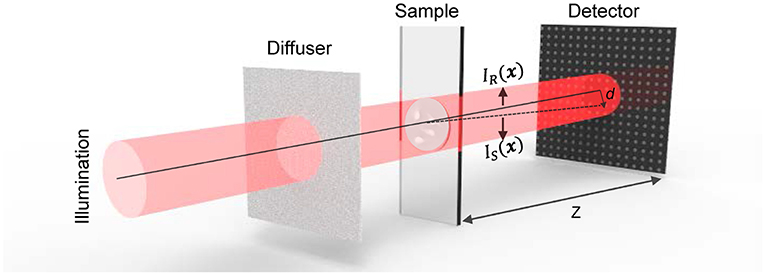
Considering the optical configuration shown in Figure 1, the paraxial forward-propagating beam illuminates a thin object and then traverses a short distance z to the planar image sensor. The IR(x) indicates the intensity of the reference speckle, i.e., the image taken in the absence of the object, where x is transverse coordinates in the plane perpendicular to the optic axis z corresponding to (x, y). The image in the presence of the sample is represented as IS(x). IS(x) is a resultant graph of distorted IR(x) due to the presence of the measured sample, whose non-planar phase geometrically distorts the reference speckles IR(x). Assuming that the illumination light is an ideal coherent plane wave, the phase of the sample with different surface slopes causes translation of the speckle pattern. According to Berto et al. and Paganin et al. [48, 49], the speckle particle displacement vector field ∇⊥d(x) on the camera is proportional to the phase gradient ∇⊥ϕ(x),
where k denotes the wave number, λ represents wavelength, and z is the distance between the sample and the detector. Thus, based on the relation between d(x) and ϕ(x), phase information of the sample can be acquired by simply finding the displacement vector field ∇⊥d(x) of the speckle pattern.
2.2. Phase Retrieval Based on Geometric-Flow Speckle Tracking
The key issue regarding speckle tracking based phase retrieval is to find the high-resolution displacement vector field ∇⊥d(x) of the speckle pattern, which can be realized mainly through two methods: the spatial correlation method proposed by Berto et al. [48] and the geometric-flow speckle tracking method (GFST) proposed by Paganin et al. [49]. In comparison, the geometric-flow tracking method can detect displacement vector field with a higher spatial resolution (account for both the 1st order prism term, and 2nd order lensing term) and lower computational cost since it recast the problem of displacement field detection to retrieval of corresponding scalar potential through solving associated partial differential equations. More specifically, in the geometric-flow speckle tracking method [49], the flow is defined as a conserved current associated with the deformation of the reference speckles induced by the phase of the sample. By representing the transverse flow associated with deforming IS(x) into IR(x) as the gradient of a scalar auxiliary function ∇⊥Λ = IRD⊥, the displacement field D⊥(x) can be obtained as,
F{·} denotes Fourier transformation with respect to x and y, F−1{·} implies inverse Fourier transform, and (u, v) is the corresponding Fourier coordinates. Assuming the field of the flow to be irrotational, the displacement field can be described as the gradient of a scalar potential D⊥(x):
Therefore, the final formula for reconstructing the phase shift ϕ(x) on the basis of GFST is:
where x0 and y0 are unit vectors in the x and y directions, respectively.
2.3. Connections Between GFST and TIE
Transport of intensity equation (TIE) is a well-established method for non-interferometric phase retrieval and QPI. It is a 2D second-order elliptical partial differential equation that outlines the relation between sample-plane phase with respect to the first derivative of intensity along the optical axis in the near Fresnel region [25],
where I(x) is the intensity at the in-focus plane, ∇ denotes the gradient operator, z refers position along the optical axis, and ϕ(x) indicates the quantitative phase to be retrieved. Experimentally, the intensity I(x) can be captured directly. The longitudinal intensity derivative can be estimated by finite differences taken between two slightly defocused images . As suggested by Teague [25], an auxiliary function ψ satisfying ∇⊥ψ = I0∇⊥ϕ is introduced, which converts the TIE into the following two Poisson equations:
and
By solving the first Poisson equation (Equation 6), we can get the solution for ψ(x), and thus the phase gradient is obtained [since ]. The second Poisson equation (Equation 7) is used for phase reconstruction based on integration of its gradient. By solving these two Poisson equations with fast Fourier transform (FFT) [27] or discrete cosine transform (DCT) [35], the phase ϕ can be uniquely determined apart from an arbitrary additive constant (which is trivial for QPI). In this work, we assume there is no phase change at the image boundary, so the TIE can be solved under simplified homogeneous Neumann boundary conditions, which is reasonable when the samples are isolatedly distributed within the field of view (FOV). Note that in a more general and rigorous solution of the TIE, the inhomogeneous Neumann boundary conditions should be applied, and one additional hard-edged aperture should be introduced at the sample plane to generate the inhomogeneous boundary signals [35]. In order to solve the Poisson equations, the Laplacian operator needs to be inverted. For simplified periodic boundary conditions, we can use the derivative properties of Fourier transform [21], and ψ(x) can be solved as,
Then, the phase ϕ(x) can be obtained,
By comparing (Equation 2) with (Equation 8), and (Equation 4) with [Equation 9], it can be found that GFST and TIE are essentially based on the same principle: the reference speckle field IR can be viewed as the in-focus intensity I0, and the scalar potential Λ(x) associated with displacement field ∇⊥Λ = IRD⊥ is equivalent to the auxiliary function ψ satisfying ∇⊥ψ = I0∇⊥ϕ, which represents the transverse energy flux directed along the Poynting vector [27]. Both of them retrieve the phase information by solving the resultant Poisson's equations with the aid of these scalar potentials, or so-called Teague's auxiliary function.
2.4. Interpretation of Speckle Distortion Under Partially Coherent Illumination
Since both GFST [49] and [25]'s TIE are premised on the assumption of monochromatic, coherent, and perfect imaging conditions, there may be problems in dealing with fields with non-negligible partial coherence, such as optical microscopy. So we combine the physical meaning of the generalized phase with energy flow (or current density) to extend the application of Speckle-TIE in partially coherent fields. Without loss of generality, we consider a quasi-monochromatic, stationary and ergodic scalar light field U(x). To characterize such statistical field, we use the phase space (x, u) representation, i.e., the Wigner Distribution Function (WDF), defined as:
where u is the corresponding 2D spatial frequency vector (u, v), Γ(x + x′/2, x − x′/2) implies the cross-spectral density (CSD) transformed by the differential variable x′. With WDF, we can construct the 3D vector field , which is also known as the geometrical vector flux [51]:
In the field of quantum mechanics, j is the probability stream, which is the expected value of the local momentum operator. For a light field that approximates a scalar wave, j indicates the energy flux along the Poynting vector. The energy conservation law in free space propagation means that the divergence of the geometric vector flux is zero, resulting in the following continuity equation [52]:
The (Equation 13) shows that the geometric-flow becomes the first moment of the Wigner function in the case of partial coherence, representing the statistical average in many rays. Then, the extended form of the traditional TIE in the partial coherent field can be written as [38]:
The (Equation 14) is the generalized TIE, which is sufficient to cover various light fields with arbitrary spatial and temporal coherence. Based on the above formulas, a strict definition of phase in partially coherent light fields can be written as follows:
The (Equation 15) shows that the phase in a partially coherent light field can be strictly defined as a scalar potential function whose gradient is the first-order spatial frequency conditional moment of the WDF of the partially coherent optical field. This definition provides a theoretical basis for non-interferometric phase recovery and quantitative phase imaging under partially coherent illumination. Here we refer the new phase Φ(x) defined by Equation (15) as the generalized phase of partially coherent fields to distinguish it from its coherent counterpart. The well-defined energy flow density vectors are weighted and averaged at a single position to create a unique and also well-defined average flux vector. For coherent wavefronts, geometrical light ray in single position travels only along one direction. For partially coherent fields, geometric rays at a single location may travel in various directions. This is the main difference between Φ(x) and ϕ(x). Since the TIE relates the angular moment of the WDF to the gradient of the generalized phase, when the statistical average of all rays at a single position coincides with the direction of the individual ray in the coherent case when the illumination is axisymmetric about the optical axis, the phase can still be accurately retrieved, regardless of the size of the source (i.e., the spatial coherence of the illumination) [26, 38].
In the context of speckle tracking based phase imaging, the case of partially coherent field is also quite different from the coherent case where the speckle distortion is due to the non-planar wavefront shifting the ray direction at a single position. For partially coherent field, the distortion of the speckle field is a result of statistical average effect of many rays passing through each spatial position and deflected by the phase of the object. Therefore, the average angular shift of the speckle pattern can be represented as the angular moment of the 4D light field:
It has been proven that the 4D light field approaches WDF at geometric optics limit L(x, θ) ≈ W(x, λu) [53, 54], so the following relationship between the speckle distortion field and the generalized phase can be established:
This equation shows that the gradient of the generalized phase is related to the normalized transverse average energy flux vector, which can be approximately obtained by measuring the distortion field of the speckle pattern based on solving TIE. In this way, we can obtain the WDF moment, and thus, the generalized phase function regardless of the spatial coherence of the illumination.
2.5. Interpretation of Speckle Distortion Under a Practical Microscopic System
All of the previous derivations are based on the assumption of ideal imaging, but it is difficult to satisfy in practical imaging systems. Especially when the aperture size of the imaging system is not sufficient to allow all of the spatial frequency components of interest of the object to pass through, the errors caused by the imaging system are often not simply ignored. In this subsection, we go a step further by explicitly taking into account both the partially coherent illumination and the imaging aperture effect under a practical microscopic system. It should be mentioned that when an object is magnified by the imaging optics, which creates an image at the camera port of the microscope, the phase we actually measured is not the phase of the object, instead, the generalized phase of the image. Thus, it is important to analyze and quantify the impact of imaging systems on phase recovery. Assuming a slowly varying object, [38] derived a corresponding simplified version of WDF at the image plane Wimage(x, u) in partially coherent, finite aperture imaging systems (microscopy systems) based on the theory of phase space, which can be represented as:
where Pc is the illumination aperture distribution and uNA represents the numerical aperture of the objective lens. Thus, the intensity ultimately captured in the image plane is the sum of the intensities of all the rays passing through the imaging system, determined by the overlapping area of the shifted primary source and pupil function:
In the case of partially coherent finite aperture imaging, the geometric-flow becomes the first moment of the Wigner function of the image plane (limited by the aperture). Thus, the reconstructed gradient of the generalized phase at the image plane is the centroid of the overlapping area of the shifted source and the pupil function, which may induce discrepancy between the gradient of measured generalized phase ∇⊥Φ(x) and the gradient of the real object ∇⊥ϕ(x). Therefore, for a practical imaging system, it is necessary to give higher importance to the illumination coherence, because the size of the source has a signicant influence on the image formation. To quantify the effect of partial coherence, we adopt the quantity of coherence parameter, S = NAi/NAo (where NAi is the illumination NA and NAo is the objective NA) [38, 50]. When S approaches 0, the imaging system is equivalent to a fully coherent imaging system. In this case, although the accuracy of the recovered phase gradient can be guaranteed, the imaging resolution is limited to coherent diffraction limit, and the signal-to-noise ratio (SNR) of the experimental results is poor because of the low light throughput. When S approaches 1, it belongs to the case of completely incoherent imaging. In such circumstances, though the light throughput is highest, the phase is almost impossible to be reconstructed owing to the fact that the optical aperture is exactly the same as the numerical aperture of the objective lens. In brief, ∇⊥Φ(x) is always significantly underestimated the gradient of the object phase ∇⊥ϕ(x). Thus, as shown in the Figure 2, for a bright-field microscope with a coherence parameter S, when the weak phase gradient is smaller than the frequency corresponding to 1 − S the phase of an object will be correctly predicted (u is spatial frequency). By comparing and analyzing the curve data in the Figure 2, it is clear that when S is between 0.3 and 0.5, the balance among, accuracy, spatial resolution, and SNR of the reconstructed phase can be achieved.
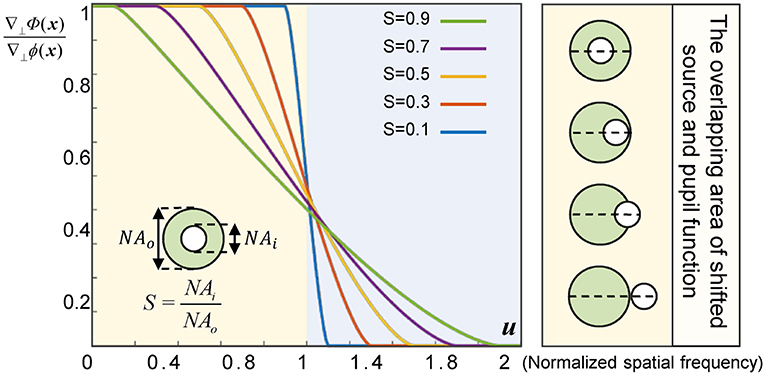
Figure 2. Phase gradient ratio () for a bright-field micro-scope with different values of coherence parameter S.
2.6. QPI Based on a Camera With a Weak Diffuser
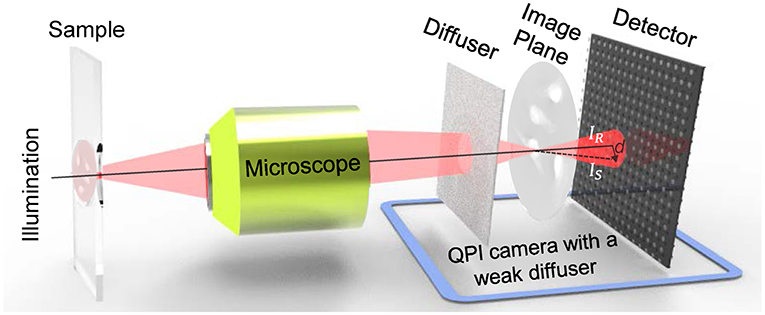
The QPICWD is simply composed of a weak diffuser (scotch tape) and a conventional camera. The weak diffuser is placed a short distance from a detector of the camera. As shown in Figure 3, the light source illuminates a thin phase object, and then imaged by the optics of the microscope, creating a magnified image at the camera port (image plane) of the microscope. The weak diffuser is in front of the image to create the speckle field that illuminates the magnified image of the sample. The speckle field is distorted due to the presence of the measured sample, which finally arrives at the sensor plane to create an image with the distorted speckle pattern. Integrating the weak diffuser in Figure 3 with the detector on a camera, it can achieve QPI based on Speckle-TIE with an extremely low-cost and compact design. The detailed schematic diagram is shown in Figure 4. Compared with the GFST method, our device modulates the speckle pattern of the image magnified by the microscope, not directly to the object, thus our system can measure much smaller sample with higher spatial resolution, which is vital for biomedical observation and research.
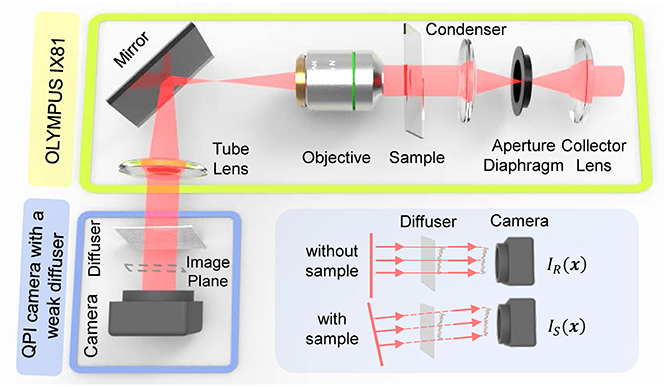
Figure 4. The schematic of the experimental setup and principle of the QPICWD. For a weak diffuser, a tip or tilt angle to the impinging wavefront results in a global shift of the speckle pattern.
3. Experimental Setup
The correctness and validity of the proposed approach are verified through a series of experiments, based on an off-the-shelf inverted microscope (IX81, Olympus) as shown in Figure 5A. The illumination of the microscope is partially coherent light filtered by a green interference filter [central wavelength λ = 550nm, 10nm full width half maximum (FWHM) bandwidth]. The IX2-MLWCD (Olympus) condenser was used in our experiments with a maximum NA of 0.55, in cooperation with a 20×, 0.4NA objective (PLN 20×, Olympus). As shown in Figures 5B,C, the QPICWD is just a normal CCD camera (DMK 23U2748/12 bit, 1600 × 1200, The Imaging Source) with a weak diffuser (a plain scotch tape) placed 4.5mm from the sensor. The distance is chosen in a compact way, based on the considerations of both the validity of the geometric approximation and the strength of the intensity difference single between the reference image and the speckle image. For Speckle-TIE phase imaging with a circular aperture, the condenser diaphragm should be properly adjusted to achieve the desired coherent parameter S. It is used for the optimal coherence parameter experiment and measurement of the microlens array. For the experiment of dynamic QPI of HeLa cells, it is performed based on a commercial inverted microscope (IX83, Olympus) with a 20times, 0.4NA objective (PLN20times, Olympus), accommodating an incubation chamber (INUF-IX3W-F1, Tokai Hit). The incubation chamber maintains an internal environment of 37 °C and provides humidified air with 5% carbon dioxide for time-lapse imaging of live cells.
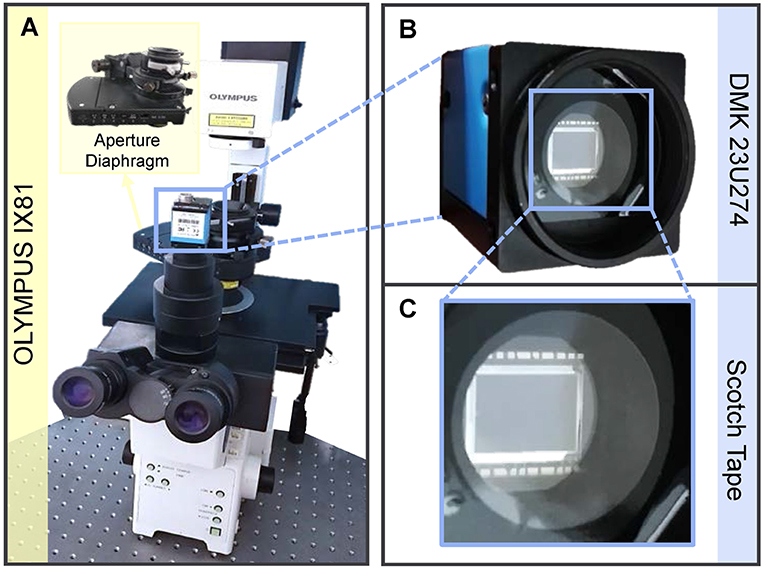
Figure 5. Experimental setup. (A) Experiments based on existing microscope Olympus IX81 without any other special optical elements. (B) Camera with scotch tape attached in front of the image sensor. (C) Enlarged view of the blue box area in (B).
4. Results
The acquisition procedure of the original image data required for the experiment is very simple and straightforward. Firstly, the reference speckle pattern IR is captured when no sample is placed in the optical path. Secondly, the sample to be measured is placed on the sample stage, and the speckle pattern IS can be captured. Finally, the corresponding phase result can be obtained with Speckle-TIE based algorithm. Since the reference speckle pattern only needs to be captured once beforehand, phase recovery from single exposure can be achieved through such a pre-calibration process.
4.1. Effect of Spatial Coherence on Phase Reconstruction
As mentioned in section 2.5, the coherence parameter S has an optimal range because the different choice of S makes the corresponding phase reconstruction results contradict each other in resolution and SNR, exacerbating the inherent noise-to-resolution tradeoff in TIE imaging. As shown in Figure 6, the phases retrieved from the experimental images taken under different coherence parameter by adjusting the condenser aperture diaphragm. Figure 6B is an enlarged version corresponding to the red box in Figure 6A. It can be seen from these images that when S = 0.1, the experimental results demonstrate good imaging resolution because the illumination is nearly completely coherent. However, due to the low illumination flux, the quality of reconstructed phase is poor due to the cloudy artifacts, which is notorious in TIE imaging. The phase imaging quality can be improved by opening up the condenser aperture (S = 0.3 and S = 0.5). The background noise is largely suppressed and most phase details are preserved. For a wide open condenser aperture (S = 0.7 and S = 0.9), the restored phase is blurred and the phase contrast becomes poorer. For the case of fully matched illumination (S = 1), the washout in phase contrast prevents any recognizable phase information to be reconstructed, resulting in significant low-frequency artifacts. In comparison, it is obvious that good phase reconstruction quality can be obtained when S is between 0.3 and 0.5, suggesting that our QPICWD can reliably retrieve the phase of the object under relatively low-coherence quasi-monochromatic illumination.
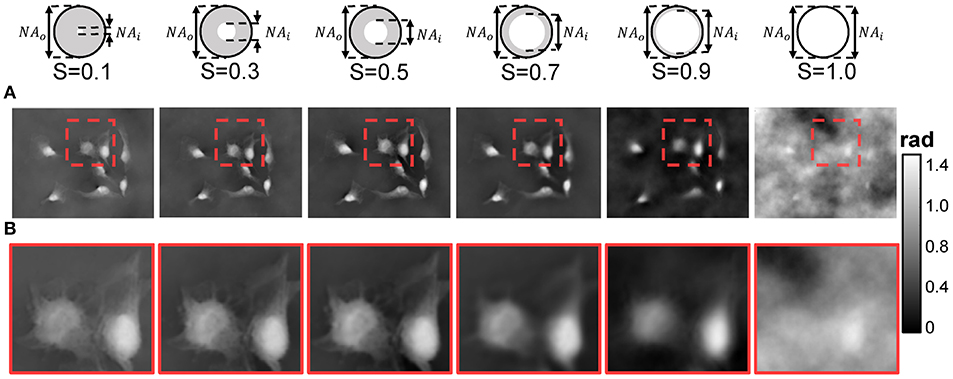
Figure 6. Recovered phases of HeLa cells under different coherence parametersS(S = NAi/NAo). (A) Recovered phases. (B) Enlarged version of red box area in (A).
4.2. Characterization of a Microlens Array
To demonstrate the accuracy of the phase reconstruction for QPICWD, a plano-convex microlens array (MLA300-7AR, Thorlabs) is measured with the IX2-MLWCD condenser and a 20×, 0.4NA objective (PLN 20×, Olympus). To evaluate the accuracy of the measured phase distribution, the same microlens array is also measured using a digital holographic microscope (DHM) system equipped with a 20×, 0.5NA microscope objective (laser wavelength λ = 532nm). Figure 7 shows the experimental results and the corresponding original map of microlens array on the basis of Speckle-TIE method under the optimal S, and displays a comparison with the phase results obtained by DHM. Thickness profiles for the same microlens array taken along the red dashed line in Figure 7D and the blue solid line in Figure 7E are compared quantitatively in Figure 7F. The relative difference between the two measurement results from these two methods is <1%, as shown in Figure 7F, suggesting that it is possible to achieve high-precision phase measurement for QPICWD in combination with a partially coherent microscopic imaging system.
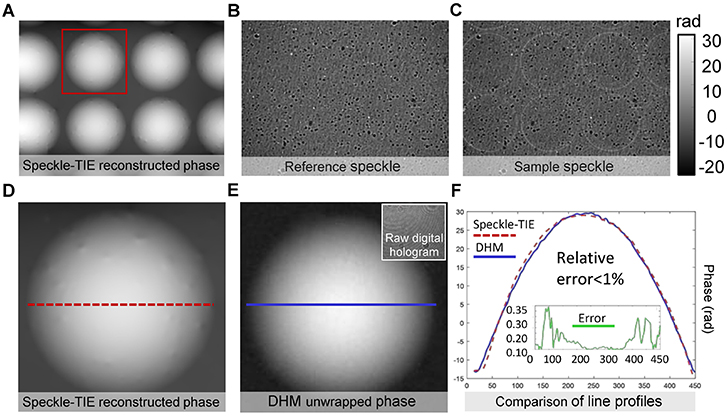
Figure 7. Microlens array characterization using QPICWD. (A) QPICWD reconstructed phase under 20×, 0.4NA objective. (B) Reference speckle (IR(x)). (C) Sample speckle (IS(x)). (D) Recovered phase of single microlens by QPICWD [enlarged version of the red box area in (A)]. (E) DHM (digital holographic microscope) reconstructed unwrapped phase under 20×, 0.5NA objective. (F) Phase line profiles corresponding to the red dashed line in (D) and the blue solid line in (E), respectively.
4.3. Dynamic QPI of HeLa Cells
The single-shot QPI capability of the proposed QPICWD provides the possibility for dynamic label-free imaging of cell apoptosis in culture. In Figure 8A, we show four representative quantitative phase images of human cervical adenocarcinoma epithelial (HeLa) cells over the time course of 5 hours. Experiments are performed based on a commercial inverted microscope (IX83, Olympus) equipped with a 20×, 0.4NA objective (PLN 20×, Olympus). In the zoom-in of the phase image shown in Figure 8B, subcellular features, such as cytoplasmic vesicles, are clearly observed. In Figure 8C, we further selected one cell [corresponding to the red-boxed region shown in Figure 8A] to study its morphology during division, which spanned over about 4 hours. A time-lapse movie created with one phase reconstruction per 10 seconds is also provided in Supplementary Video 1. The absence of fluorescent contrast agents eliminates any concerns about photobleaching and phototoxicity. Besides, the single-shot nature of QPICWD allows subcellular dynamics of HeLa cells, such as fluctuating lamellipodium being clearly visualized without inducing any motion-induced blurring or artifacts.
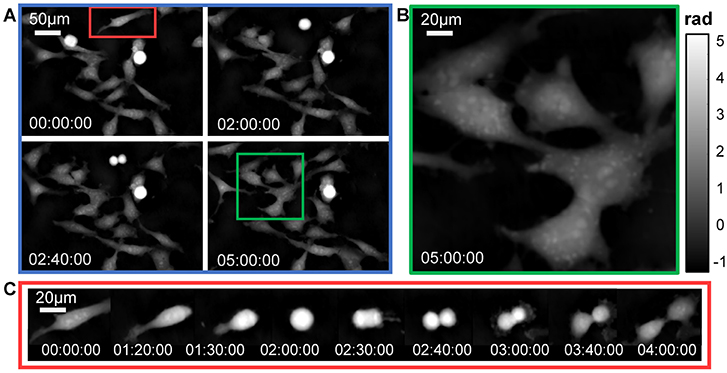
Figure 8. Time-lapse phase imaging of HeLa cell division over a long period (5 h). (A) Representative quantitative phase images. (B) The magnified view corresponding to the region of interest [the green box in (A)]. (C) 9 selected time-lapse phase images showing the morphological features of a dividing cell [the red box in (A)] at different stages of mitosis.
5. Conclusion and Discussion
In this paper, speckle phase imaging technology has been extended to partially coherent quantity phase microscopy with the advantages of low-cost and simple configuration. The new system, so-called QPICWD, introduce a weak diffuser (scotch tape) to generate random speckle illumination in the imaging optical path, and recover the phase of the sample by examining the relative distortion of the speckle field with the sample with respect to the reference speckle when there is no sample in the optical path. Since the reference speckle image can be acquired beforehand, QPICWD combines the advantages of speckle tracking phase imaging and TIE, enabling rapid, efficient, and high-resolution quantitative phase imaging in a single exposure. By invoking the phase-space representation, we established the connections between speckle distortion to the moment of the WDF, and thus the generalized phase of the partially coherent field. The theoretical analysis and experimental results suggest that the phase-space theory can broaden the range of TIE phase measurements. We also analyzed the effect of illumination coherence and imaging NA on the accuracy of phase retrieval, revealing that the phase of the object can be reliably retrieved when the coherence parameter of the Köhler illumination is between 0.3 and 0.5. Several applications for the QPICWD are presented, including nondestructive optical testing of microlens array with nanometric thickness and imaging of fixed and live HeLa cells. Experimental results verify that QPICWD is a simple and cost-effective add-on that can be appended to the output port of an off-the-shelf bright-field microscope for high-performance QPI applications.
Finally, it should be mentioned that regardless of the fact that QPICWD can provide high quality phase measurement with relatively low coherence illumination. It is still suffering from the contradiction between the spatial resolution and the phase measurement accuracy. As shown in Figure 2, when the coherence parameter of the Köhler illumination is between 0.3 and 0.5, the imaging resolution is still limited to the partially coherent limit (1.3 − 1.5NA), which is still much lower than the incoherent limit (2NA). Besides, the phase gradient is still underestimated between the range of 1 − S and 1 + S, resulting in phase blurring especially for large phase gradients, or equivalently, high spatial frequencies. Therefore, the practical phase imaging resolution achieved is still below the theoretically partially coherent limit. In the future, we will investigate the possibilities of using annular illumination to enhance the frequency coverage and response for phase over conventional circular illumination [34], and improving the phase imaging resolution by compensating the underestimation of phase gradient with a lookup table according to the relationship shown in Figure 2 [38, 50]. Furthermore, the proposed approach is potentially able to be combined with other unconventional microscopic system (e.g., double negative metamaterial lens [55, 56]) to substantially increase the resolution beyond the diffraction limit.
Ethics Statement
This study was carried out in accordance with the recommendations of Hospital of Nanjing University of Science and Technology. The protocol was approved by the Hospital of Nanjing University of Science and Technology.
Author Contributions
CZ conceived the idea. LL and JZ did the experiments. CZ and QC supervised the project. All the authors contributed to discussion on the results for this manuscript.
Conflict of Interest Statement
CZ and QC are named inventors on several related patent applications and also have a competing financial interest in Nanjing Jiangnan Novel Optics Co., Ltd. and Suzhou Flyingman Precision Instrument Co., Ltd. China, which, however, did not support this work.
The remaining authors declare that the research was conducted in the absence of any commercial or financial relationships that could be construed as a potential conflict of interest.
Acknowledgments
This work was supported by the National Natural Science Foundation of China (61722506, 11574152), Final Assembly 13th Five-Year Plan Advanced Research Project of China (30102070102), Equipment Advanced Research Fund of China (61404150202), National Defense Science and Technology Foundation of China (0106173), Outstanding Youth Foundation of Jiangsu Province (BK20170034), The Key Research and Development Program of Jiangsu Province (BE2017162), 333 Engineering Research Project of Jiangsu Province (BRA2016407), Fundamental Research Funds for the Central Universities (30917011204).
Supplementary Material
The Supplementary Material for this article can be found online at: https://www.frontiersin.org/articles/10.3389/fphy.2019.00077/full#supplementary-material
Supplementary Video 1. Dynamic quantitative phase imaging of HeLa cells.
References
2. Barty A, Nugent K, Paganin D, Roberts A. Quantitative optical phase microscopy. Opt Lett. (1998) 23:817–9. doi: 10.1364/OL.23.000817
3. Cuche E, Bevilacqua F, Depeursinge C. Digital holography for quantitative phase-contrast imaging. Opt Lett. (1999) 24:291–3. doi: 10.1364/OL.24.000291
4. Lee K, Kim K, Jung J, Heo J, Cho S, Lee S, et al. Quantitative phase imaging techniques for the study of cell pathophysiology: from principles to applications. Sensors. (2013) 13:4170–91. doi: 10.3390/s130404170
5. Lee K, Park Y. Quantitative phase imaging unit. Opt Lett. (2014) 39:3630–3. doi: 10.1364/OL.39.003630
6. Park Y, Diez-Silva M, Popescu G, Lykotrafitis G, Choi W, Feld MS, et al. Refractive index maps and membrane dynamics of human red blood cells parasitized by Plasmodium falciparum. PNAS. (2008) 105:13730–5. doi: 10.1073/pnas.0806100105
7. Zernike F. Diffraction and optical image formation. Proc Phys Soc. (1948) 61:158. doi: 10.1088/0959-5309/61/2/306
9. Popescu G, Ikeda T, Dasari RR, Feld MS. Diffraction phase microscopy for quantifying cell structure and dynamics. Opt Lett. (2006) 31:775–7. doi: 10.1364/OL.31.000775
10. Wang Z, Millet L, Mir M, Ding H, Unarunotai S, Rogers J, et al. Spatial light interference microscopy (SLIM). Opt Express. (2011) 19:1016–26. doi: 10.1364/OE.19.001016
11. Bhaduri B, Pham H, Mir M, Popescu G. Diffraction phase microscopy with white light. Opt Lett. (2012) 37:1094–6. doi: 10.1364/OL.37.001094
12. Bon P, Maucort G, Wattellier B, Monneret S. Quadriwave lateral shearing interferometry for quantitative phase microscopy of living cells. Opt Express. (2009) 17:13080–94. doi: 10.1364/OE.17.013080
13. Shaked NT. Quantitative phase microscopy of biological samples using a portable interferometer. Opt Lett. (2012) 37:2016–8. doi: 10.1364/OL.37.002016
14. Nguyen TH, Kandel M, Shakir HM, Best-Popescu C, Arikkath J, Do MN, et al. Halo-free phase contrast microscopy. Sci Rep. (2017) 7:44034. doi: 10.1038/srep44034
15. Edwards C, Bhaduri B, Nguyen T, Griffin BG, Pham H, Kim T, et al. Effects of spatial coherence in diffraction phase microscopy. Opt Express. (2014) 22:5133–46. doi: 10.1364/OE.22.005133
16. Mico V, Zalevsky Z, García-Martínez P, García J. Superresolved imaging in digital holography by superposition of tilted wavefronts. Appl Opt. (2006) 45:822–8. doi: 10.1364/AO.45.000822
17. Mico V, Zalevsky Z, García-Martínez P, García J. Synthetic aperture superresolution with multiple off-axis holograms. JOpt Soc Am A. (2006) 23:3162–70. doi: 10.1364/JOSAA.23.003162
18. Gao P, Pedrini G, Osten W. Structured illumination for resolution enhancement and autofocusing in digital holographic microscopy. Opt Lett. (2013) 38:1328–30. doi: 10.1364/OL.38.001328
19. Gerchberg RW. A practical algorithm for the determination of phase from image and diffraction plane pictures. Optik. (1972) 35:237–46.
20. Fienup JR. Phase retrieval algorithms: a comparison. Appl Opt. (1982) 21:2758–69. doi: 10.1364/AO.21.002758
21. Allen L, Oxley M. Phase retrieval from series of images obtained by defocus variation. Opt Commun. (2001) 199:65–75. doi: 10.1016/S0030-4018(01)01556-5
22. Pedrini G, Osten W, Zhang Y. Wave-front reconstruction from a sequence of interferograms recorded at different planes. Opt Lett. (2005) 30:833–5. doi: 10.1364/OL.30.000833
23. Almoro PF, Pedrini G, Gundu PN, Osten W, Hanson SG. Phase microscopy of technical and biological samples through random phase modulation with a diffuser. Opt Lett. (2010) 35:1028–30. doi: 10.1364/OL.35.001028
24. Gao P, Pedrini G, Zuo C, Osten W. Phase retrieval using spatially modulated illumination. Opt Lett. (2014) 39:3615–8. doi: 10.1364/OL.39.003615
25. Teague MR. Deterministic phase retrieval: a Greens function solution. JOpt Soc Am. (1983) 73:1434–41. doi: 10.1364/JOSA.73.001434
26. Streibl N. Phase imaging by the transport equation of intensity. Opt Commun. (1984) 49:6–10. doi: 10.1016/0030-4018(84)90079-8
27. Paganin D, Nugent KA. Noninterferometric phase imaging with partially coherent light. Phys Rev Lett. (1998) 80:2586. doi: 10.1103/PhysRevLett.80.2586
28. Kou SS, Waller L, Barbastathis G, Sheppard CJ. Transport-of-intensity approach to differential interference contrast (TI-DIC) microscopy for quantitative phase imaging. Opt Lett. (2010) 35:447–9. doi: 10.1364/OL.35.000447
29. Phillips KG, Jacques SL, McCarty OJ. Measurement of single cell refractive index, dry mass, volume, and density using a transillumination microscope. Phys Rev Lett. (2012) 109:118105. doi: 10.1103/PhysRevLett.109.118105
30. Chakraborty T, Petruccelli JC. Source diversity for transport of intensity phase imaging. Opt Express. (2017) 25:9122–37. doi: 10.1364/OE.25.009122
31. Jenkins MH, Long JM, Gaylord TK. Multifilter phase imaging with partially coherent light. Appl Opt. (2014) 53:D29–39. doi: 10.1364/AO.53.000D29
32. Bao Y, Gaylord TK. Quantitative phase imaging method based on an analytical nonparaxial partially coherent phase optical transfer function. JOpt Soc Am A. (2016) 33:2125–36. doi: 10.1364/JOSAA.33.002125
33. Zuo C, Chen Q, Yu Y, Asundi A. Transport-of-intensity phase imaging using Savitzky-Golay differentiation filter-theory and applications. Opt Express. (2013) 21:5346–62. doi: 10.1364/OE.21.005346
34. Zuo C, Sun J, Li J, Zhang J, Asundi A, Chen Q. High-resolution transport-of-intensity quantitative phase microscopy with annular illumination. Sci Rep. (2017) 7:7654. doi: 10.1038/s41598-017-06837-1
35. Zuo C, Chen Q, Asundi A. Boundary-artifact-free phase retrieval with the transport of intensity equation: fast solution with use of discrete cosine transform. Opt Express. (2014) 22:9220–44. doi: 10.1364/OE.22.009220
36. Zuo C, Chen Q, Qu W, Asundi A. Noninterferometric single-shot quantitative phase microscopy. Opt Lett. (2013) 38:3538–41. doi: 10.1364/OL.38.003538
37. Zuo C, Chen Q, Qu W, Asundi A. High-speed transport-of-intensity phase microscopy with an electrically tunable lens. Opt Express. (2013) 21:24060–75. doi: 10.1364/OE.21.024060
38. Zuo C, Chen Q, Tian L, Waller L, Asundi A. Transport of intensity phase retrieval and computational imaging for partially coherent fields: the phase space perspective. Opt Lasers Eng. (2015) 71:20–32. doi: 10.1016/j.optlaseng.2015.03.006
39. Li J, Chen Q, Sun J, Zhang J, Pan X, Zuo C. Optimal illumination pattern for transport-of-intensity quantitative phase microscopy. Opt Express. (2018) 26:27599–614. doi: 10.1364/OE.26.027599
40. Barone-Nugent E, Barty A, Nugent K. Quantitative phase-amplitude microscopy I: optical microscopy. J Microsc. (2002) 206:194–203. doi: 10.1046/j.1365-2818.2002.01027.x
41. Jenkins MH, Gaylord TK. Quantitative phase microscopy via optimized inversion of the phase optical transfer function. Appl Opt. (2015) 54:8566–79. doi: 10.1364/AO.54.008566
42. Nugent K, Gureyev T, Cookson D, Paganin D, Barnea Z. Quantitative phase imaging using hard x rays. Phys Rev Lett. (1996) 77:2961. doi: 10.1103/PhysRevLett.77.2961
43. Bajt S, Barty A, Nugent K, McCartney M, Wall M, Paganin D. Quantitative phase-sensitive imaging in a transmission electron microscope. Ultramicroscopy. (2000) 83:67–73. doi: 10.1016/S0304-3991(99)00174-6
44. Allman B, McMahon P, Nugent K, Paganin D, Jacobson DL, Arif M, et al. Imaging: phase radiography with neutrons. Nature. (2000) 408:158. doi: 10.1038/35041626
45. Zuo C, Chen Q, Li H, Qu W, Asundi A. Boundary-artifact-free phase retrieval with the transport of intensity equation II: applications to microlens characterization. Opt Express. (2014) 22:18310–24. doi: 10.1364/OE.22.018310
46. Bérujon S, Ziegler E, Cerbino R, Peverini L. Two-dimensional x-ray beam phase sensing. Phys Rev Lett. (2012) 108:158102. doi: 10.1103/PhysRevLett.108.158102
47. Berujon S, Ziegler E. Near-field speckle-scanning-based x-ray imaging. Phys Rev A. (2015) 92:013837. doi: 10.1103/PhysRevA.92.013837
48. Berto P, Rigneault H, Guillon M. Wavefront sensing with a thin diffuser. Opt Lett. (2017) 42:5117–20. doi: 10.1364/OL.42.005117
49. Paganin DM, Labriet H, Brun E, Berujon S. Single-image geometric-flow x-ray speckle tracking. Phys Rev A. (2018) 98:053813. doi: 10.1103/PhysRevA.98.053813
50. Sheppard CJ. Partially coherent microscope imaging system in phase space: effect of defocus and phase reconstruction. JOpt Soc Am A. (2018) 35:1846–54. doi: 10.1364/JOSAA.35.001846
51. Bastiaans MJ. Application of the Wigner distribution function to partially coherent light. JOpt Soc Am A. (1986) 3:1227–38. doi: 10.1364/JOSAA.3.001227
52. Zuo C, Chen Q, Huang L, Asundi A. Phase discrepancy analysis and compensation for fast Fourier transform based solution of the transport of intensity equation. Opt Express. (2014) 22:17172–86. doi: 10.1364/OE.22.017172
53. Zhang Z, Levoy M. Wigner distributions and how they relate to the light field. In: 2009 IEEE International Conference on Computational Photography (ICCP) California: IEEE (2009). p. 1–10.
54. Zuo C, Chen Q, Asundi A. Light field moment imaging: comment. Opt Lett. (2014) 39:654. doi: 10.1364/OL.39.000654
55. Pendry JB. Negative refraction makes a perfect lens. Phys Rev Lett. (2000) 85:3966. doi: 10.1103/PhysRevLett.85.3966
Keywords: transport of intensity equation, quantitative phase imaging, microscopic imaging, speckle imaging, phase space
Citation: Lu L, Sun J, Zhang J, Fan Y, Chen Q and Zuo C (2019) Quantitative Phase Imaging Camera With a Weak Diffuser. Front. Phys. 7:77. doi: 10.3389/fphy.2019.00077
Received: 01 February 2019; Accepted: 02 May 2019;
Published: 24 May 2019.
Edited by:
YongKeun Park, Korea Advanced Institute of Science & Technology (KAIST), South KoreaReviewed by:
Xiaojun YU, Nanyang Technological University, SingaporeQing Ai, Beijing Normal University, China
Copyright © 2019 Lu, Sun, Zhang, Fan, Chen and Zuo. This is an open-access article distributed under the terms of the Creative Commons Attribution License (CC BY). The use, distribution or reproduction in other forums is permitted, provided the original author(s) and the copyright owner(s) are credited and that the original publication in this journal is cited, in accordance with accepted academic practice. No use, distribution or reproduction is permitted which does not comply with these terms.
*Correspondence: Chao Zuo, enVvY2hhbyYjeDAwMDQwO25qdXN0LmVkdS5jbg==; c3VycGFzc3p1byYjeDAwMDQwOzE2My5jb20=
 Linpeng Lu
 Jiasong Sun1,2,3
 Chao Zuo